jarlife journal
Sample text

AND option

OR option

USE OF AN OPEN-SOURCE SOFTWARE TO EXAMINE LOW SKELETAL MUSCLE MASS IN PENILE CANCER PATIENTS: A CROSS-SECTIONAL STUDY


C. Ibilibor, H. Wang, D. Kaushik, R. Rodriguez


Department of Urology, University of Texas Health Science Center at San Antonio, San Antonio, TX, USA

Corresponding Author: Christine Ibilibor, M.D., M.Sc, Department of Urology, University of Texas Health Science Center at San Antonio, 7703 Floyd Curl Drive San Antonio, TX 78229, USA, Phone: 210 567 5676, Fax: 210-567-6868, ibilibor@uthscsa.edu, ORCID: 0000-0002-3432-7883

J Aging Res & Lifestyle 2021;10:45-49
Published online June 28, 2021, http://dx.doi.org/10.14283/jarlife.2021.8


Abstract

Purpose: Low skeletal muscle mass determined radiographically has emerged as an important prognostic marker in penile cancer patients but may be unrecognized in obese patients with a high comorbid disease burden. Moreover, publicly available software for image segmentation are limited. Thus, we describe the prevalence of radiographically low skeletal muscle mass in an obese penile cancer cohort, using an open-source software and examine its association with comorbid disease burden. Methods: This is a cross-sectional study, utilizing retrospective data from patients diagnosed with penile squamous cell carcinoma between October 2009 and December 2019. Available digital files of perioperative computerized tomography were analyzed, using CoreSlicer, an open-source image segmentation software. The correlation between radiographically low skeletal muscle mass, defined as a skeletal muscle index (SMI) less than 55 cm2/m2 and a Charlson Comorbidity Index (CCI) greater than 4 was examined, using logistic and linear regression. Results: Forty two of 59 patients had available digital files. Median SMI and body mass index (BMI) were 54.6cm2/m2 and 30.2kg/m2 respectively for the entire cohort. Of included patients, 54% had radiographically low skeletal muscle mass and a median BMI of 28.9 kg/m2. Radiographically low skeletal muscle mass was associated with a CCI greater than 4 on univariable and multivariable logistic regression with odds ratios of 4.85 (p = 0.041) and 7.32 (p = 0.033), respectively. When CCI was treated as a continuous variable on linear regression, the association between radiographically low skeletal muscle mass and CCI was positive, but not statistically significant with an estimated effect of 1.29 (p = 0.1) and 1.27 (p = 0.152) on univariable and multivariable analysis, respectively. Conclusion: Our data demonstrate that low skeletal muscle mass can be readily assessed with CoreSlicer and is associated with a CCI greater than 4 in obese penile cancer patients.

Key words: Low skeletal muscle mass, obesity, penile cancer, computer software, charlson comorbidity index.


Introduction

Growing examination of the association between body composition and perioperative risk stratification has led to the identification of low skeletal muscle mass (SMM) as an important diagnostic and prognostic marker in patients undergoing major surgery (1). While many different metrics have been put forth to define low SMM as a syndrome of low skeletal muscle quality and quantity, low SMM determined radiographically is marked principally by a low skeletal muscle index (SMI) where SMI is differentiated from SMM by being skeletal muscle surface area at the 3rd lumbar normalized to height (2, 3). Within the oncologic literature, radiographically low SMM has been associated with increased rates of post-operative complications, cancer-specific and all-cause mortality in multiple disease sites, including bladder, gastrointestinal and endometrial cancers (4-7). These poorer oncologic outcomes found in patients with low SMM have been reported to be, at least in part, due to the association between low SMM and higher chronic comorbid disease (4, 8). Increased usage of body composition as a corollary to clinical outcomes in different oncologic sites has led to an increasing number of image analysis platforms available for analytic morphomic. However, software commonly used for image segmentation such as Slice-O-Matic and OsiriX are proprietary and not readily accessible (9). Within the realm of urologic oncology, penile cancer patients have been reported as having the third highest median number of chronic comorbid conditions behind bladder and kidney cancer patients (10). Thus, penile cancer patients represent a population of men with a high comorbid disease burden by virtue of the modifiable patient related factors and such as cigarette smoking and obesity, where the latter is commonly associated with a sedentary lifestyle, that increase the risk of developing of penile cancer (11-13). However, due to the rarity of penile cancer there have been limited studies evaluating the association between low SMM, comorbid disease burden, oncologic and surgical outcomes in this patient population (14-16). We believe the rarity of this cancer type and the given high comorbid disease burden of these men warrants further investigation into the prevalence of low SMM among these patients and its correlation with indices of comorbidity. Within this context, our objective is to investigate the relationship between the presence of radiographically defined low SMM and comorbid disease burden in a penile cancer patient cohort, using an open-source web-based image segmentation software to validate its utility in a clinical population.


Materials & Methods

Patient Population

This is a cross-sectional study, utilizing retrospective data. Thus, after institutional review board approval was obtained (HSC20190555H), patients diagnosed with penile squamous cell carcinoma (PSqCC) between October 2009 and December 2019 were consecutively identified within the University of Texas Health Science Center at San Antonio (UTHSCSA) health system. Among the identified PSqCC patients, only those who had undergone standard of care resection including but not limited to partial penectomy, total penectomy, and ILND were further identified using the following corresponding current procedural terminology (CPT) codes: 54120, 54125, 38765, 38531, and 38760. Approximately 59 patients treated for PSqCC were identified in the UTHSCSA system, of those, 42 had available digital files and were included for analysis. Clinicopathologic data were captured through a retrospective chart review with Charlson Comorbidity Index (CCI) scores calculated from abstracted patient data.

Imaging Analysis

The open-source web-based medical image segmentation platform, CoreSlicer, was used for image analysis. The digital files for perioperative computerized tomography (CT) scans performed within 90 days of the primary tumor resection or ILND were imported from the medical record and anonymized in digital imaging and communications in medicine (DICOM) format and subsequently uploaded into CoreSlicer. Only CT scan imaging obtained prior to ILND were used for patients who underwent this procedure. Within the CoreSlicer user interface, a single cross-sectional image obtained at the level of the 3rd lumbar vertebrae was selected by an investigator (CI) blinded to the patient’s clinical data. Image segmentation at the 3rd lumbar vertebrae was performed using a threshold brush that allows for the demarcation of regions of interest based on attenuation thresholds. Skeletal muscle attenuation thresholds ranged from –29 to +150 Hounsfield units while subcutaneous, visceral, and intramuscular adipose attenuation thresholds ranged from –190 to –30 Hounsfield units. SMI was calculated by normalizing the surface area of skeletal muscle in centimeters squared at the 3rd lumbar vertebrae to height in meters squared. Fat mass index (FMI) was calculated by deriving total fat mass in kilograms from the sum total surface area of adipose in centimeters squared which included subcutaneous, visceral and intramuscular adipose, using the below equation and normalizing it to height in meters squared (17).

Total fat mass (kg) = (Total adipose area at the 3rd lumbar in cm2) × 0.042 + 11.2

Primary Predictor Variables

The primary objective of this study is to determine whether there is an association between radiographically low SMM and a CCI greater than 4; an association between SMI and CCI has been reported previously (8). Low SMM, defined as an SMI less than 55cm2/m2, served as our primary predictor. This cut-off was chosen due to its previously reported use in this patient population (15). Also, we treated low SMM as a categorical variable in our analysis due to its previous use in this patient population and our clinical practice (15). Similarly, obesity defined as an FMI greater than 10 kg/m2, based on the NHANES 2009 criteria, or a body mass index (BMI) greater than 30 kg/m2 served as secondary predictors of elevated CCI (18).

Primary Outcome Variables

The CCI for each patient was calculated by using abstracted patient data and served as the primary outcome variable because it has been previously demonstrated to be an important marker of comorbid disease burden (19, 20). The CCI is based on patient age, and the presence of 16 diseases with varied disease specific severity measures. One point is given for an age between 50-59, and one additional point for each decade above 50 up to 80 years. One point was given for history of myocardial infarction, congestive heart failure, peripheral vascular disease, cerebrovascular accident, dementia, chronic obstructive pulmonary disease, peptic ulcer disease, liver cirrhosis without portal hypertension (3 points for cirrhosis with portal hypertension, with or without a history of variceal bleeding), and history of uncomplicated diabetes mellitus (2 points for diabetes mellitus with end organ damage). Similarly, two points were given for presence of a localized tumor (6 points for metastatic disease), 2 points for leukemia and lymphoma while 6 points were given for the presence of acquired immunodeficiency syndrome. Patients with a CCI greater than 4 points were defined as having a high comorbid disease burden based on previous literature in the penile cancer population (15).

Statistical Analysis

Categorical variables such as low SMM, smoking status and ethnicity were expressed as percentages, while continuous variables such as SMI, and BMI were expressed as medians and interquartile ranges. Predictor variables, low SMM, smoking history, ethnicity, and obesity, were chosen a priori, and used to model our primary outcome variable. Univariable and multivariable linear regression models were used to model the effect of our predictors on CCI as a continuous variable while univariable and multivariable logistic regression models were used to model CCI greater than 4 as a categorical variable. Age was not used as a predictor variable nor included in our regression models because age is incorporated into CCI calculations; thus inclusion of age in any analyses modeling CCI would be over adjusted. All statistical analyses were performed in R Version 4.0.0 (Vienne, Austria). All tests were two-sided and a p-value less than 0.05 was the criterion for statistical significance.


Results

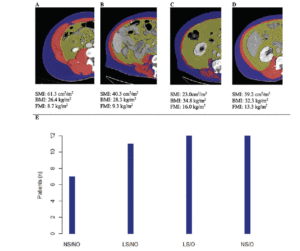
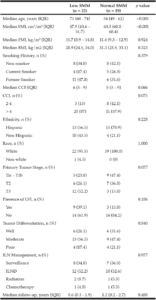
Cohort data. The clinicopathologic characteristics of the 42 included stratified by presence of radiographically low SMM are summarized in Table 1. The 17 patients without available digital files had similar baseline demographics to those of the included patients (data not shown). Median SMI, BMI and FMI for the entire cohort were 54.62cm2/m2, 30.2kg/m2 and 11.49kg/m2 respectively and 54% of patients had radiographically low SMM. Low SMM and normal SMM patients were largely similar based on FMI, BMI, smoking history, ethnicity/race, and inguinal lymph node management with one patient within each group receiving chemotherapy for inguinal and distant metastases at presentation. However, low SMM patients were generally older with a slightly higher median CCI score that approached statistical significance and a slightly higher proportion of pathologic T3 disease that similarly trended toward statistical significance. Patients were further subdivided into four body categories based on BMI, FMI and SMI to determine the proportion of obese patients who had radiographically low SMM. Within the cohort, 28.6% were low SMM obese, 28.6% were normal SMM obese, while 26.2% were low SMM non-obese, and 16.7% were normal SMM non-obese. Figure 1 illustrates the number of patients within each of the four body categories with their representative image after image segmentation in CoreSlicer.

Table 1
Baseline patient characteristics stratified by
the presence of Low Skeletal Muscle Mass

BMI: body mass index, CCI: Charlson Comorbidity Index, FMI: fat mass index, ILN: inguinal lymph node, ILND: inguinal lymph node dissection, IQR: interquartile range, LVI: lymphovascular invasion, SMI: skeletal muscle index, SMM: skeletal muscle mass

Figure 1
Representative CoreSlicer images of four different body compositions

A) normal skeletal muscle mass non-obese, B) low skeletal muscle mass non-obese, C) low skeletal muscle mass obese, D) normal skeletal muscle obese, and with visible differences in the skeletal muscle (red), visceral adipose (yellow) and subcutaneous (blue) surface areas. E) bar graph demonstrating the number of patients in each category. BMI: body mass index, FMI: fat mass index, LS/NO: low skeletal muscle mass/non-obese, LS/O: low skeletal muscle mass /obese, NS/NO: normal skeletal muscle mass/non-obese, NS/O: normal skeletal muscle mass /obese, SMI: skeletal muscle index

Inguinal lymph node dissection subgroup

Twenty-two patients underwent ILND and their clinicopathologic data are shown in Supplemental Table 1. Of note, among the patients classified with radiographically low SMM, a larger proportion underwent only bilateral superficial inguinal lymph node dissection and did not undergo sartorius flap creation. Thus, there was higher percentage of 30-day ILND-related complications in the normal SMM group.
The association between low SMM and CCI

On univariable and multivariable logistic regression analysis, radiographically low SMM had a strong association with CCI greater than 4 while smoking history, Hispanic ethnicity, and obesity defined by FMI and BMI had no association with CCI greater than 4 (Table 2). When CCI was treated as a continuous variable, the estimated effect of low SMM on CCI demonstrated a non-statistically significant positive correlation on univariable and multivariable linear regression (Table 3).

Table 2
Odds ratios for likelihood of having a CCI greater than 4

BMI: body mass index, CCI: Charlson Comorbidity Index, CI: confidence interval, FMI: fat mass index, OR: odds ratio, SMM: skeletal muscle mass

Table 3
Estimated effects of predictors on CCI

BMI: body mass index, CCI: Charlson Comorbidity Index, SE: standard error, SMI: skeletal muscle index, FMI: fat mass index


Discussion

In the present cross-sectional study, we utilize a new web-based open-source image segmentation platform called CoreSlicer in a clinical population which to our knowledge has not be reported previously. This software has been shown to provide image analysis comparable to other proprietary software such as Slice-O-Matic and lends itself to higher ease of use through its wizard format, allowing it to be potentially integrated into a clinical work-flow. CoreSlicer positions itself as a platform for radiomics and the extraction of high-quality data from clinical imaging (9). The clinical value of this open-source software is high given its accessibility; however, it is currently only intended for use in investigative research. Thus, further investigation of CoreSlicer’s use in clinical populations such as the one presented here is warranted.
Here, we also report the prevalence of low SMM in an obese penile cancer population and a nearly 5-fold increased likelihood of high comorbid disease burden in men with low SMM alone and a greater than 7-hold increased likelihood when adjusted for other covariates. A negative linear correlation between CCI and SMI has between reported in a geriatric medical patient population with patients demonstrating a higher CCI and poorer performance status also exhibiting lower SMI values (8). Our study helps confirm this phenomenon in a highly comorbid cancer population.
Penile cancer patients represent a population of men with a high comorbid disease burden owing to the risk factors that are associated with penile cancer development such as cigarette smoking and obesity (11, 12). Thus, the impact of a sedentary lifestyle and overall inactivity on penile cancer risk through its contribution to obesity development, cannot be understated (13). Moreover, obesity represents a modifiable risk factor for penile cancer development (11). In the current study, most men were either obese with a low SMM or obese with a normal SMM, pointing to the prevalence of an elevated BMI in this population. It is currently unclear how lifestyle changes or a change in BMI effect penile cancer development, however further research in this area is warranted.
This study’s limitations include its small sample size and retrospective design, leaving it susceptible to selection bias. However, the baseline demographic data for patients who did not have available digital files for analysis were similar to those in the studied cohort. Also, associations that approached statistical significance in our study may be accentuated in a larger sample size. In addition, our usage of CCI as a categorical variable can create an unbalanced population sample as those above and below our predefined threshold will differ inherently based on age.


Conclusion

In this study, we offer insight into the utilization of a publicly available software for body segmentation and the evaluation for the presence of low SMM in a surgical population with a characteristically high comorbid disease burden.


Conflict of interest: The authors have no conflict of interests to declare, financial or otherwise.

Ethical standard: The authors declare that the study procedures adhere to all ethical standards. Ethics approval for this study was obtained from The University of Texas Health Science Center at San Antonio Instituitional Review Board.

Acknowledgments: Christine Ibilibor has received research support through the University of Texas Health Science Center at San Antonio Cancer Research Training Program supported by the CPRIT Research Training Award (RTA; RP170345).


SUPPLEMENTARY MATERIAL


References

1. Friedman, J., Lussiez, A., Sullivan, J., Wang, S. & Englesbe, M. Implications of sarcopenia in major surgery. Nutr Clin Pract 2015; 30, 175-179, doi:10.1177/0884533615569888.
2. Cruz-Jentoft, A. J. et al. Sarcopenia: revised European consensus on definition and diagnosis. Age Ageing 2019; 48, 16-31, doi:10.1093/ageing/afy169.
3. Dodds, R. & Sayer, A. A. Sarcopenia and frailty: new challenges for clinical practice. Clin Med (Lond) 2016; 16, 455-458, doi:10.7861/clinmedicine.16-5-455 .
4. Kuroki, L. M. et al. Pre-operative assessment of muscle mass to predict surgical complications and prognosis in patients with endometrial cancer. Ann Surg Oncol 2015; 22, 972-979, doi:10.1245/s10434-014-4040-8.
5. Psutka, S. P. et al. Mortality after radical cystectomy: impact of obesity versus adiposity after adjusting for skeletal muscle wasting. J Urol 2015; 193, 1507-1513, doi:10.1016/j.juro.2014.11.088.
6. Simonsen, C. et al. Sarcopenia and Postoperative Complication Risk in Gastrointestinal Surgical Oncology: A Meta-analysis. Ann Surg 2018; 268, 58-69, doi:10.1097/SLA.0000000000002679.
7. Smith, A. B. et al. Sarcopenia as a predictor of complications and survival following radical cystectomy. J Urol 2014; 191, 1714-1720, doi:10.1016/j.juro.2013.12.047 .
8. Gong, G. et al. Correlation between the Charlson comorbidity index and skeletal muscle mass/physical performance in hospitalized older people potentially suffering from sarcopenia. BMC Geriatr 2019; 19, 367, doi:10.1186/s12877-019-1395-5.
9. Mullie, L. & Afilalo, J. CoreSlicer: a web toolkit for analytic morphomics. BMC Med Imaging 2019; 19, 15, doi:10.1186/s12880-019-0316-6.
10. Garg, T. et al. Burden of Multiple Chronic Conditions among Patients with Urological Cancer. J Urol 2018; 199, 543-550, doi:10.1016/j.juro.2017.08.005.
11. Barnes, K. T. et al. Obesity is associated with increased risk of invasive penile cancer. BMC Urol 2016; 16, 42, doi:10.1186/s12894-016-0161-7.
12. Daling, J. R. et al. Penile cancer: importance of circumcision, human papillomavirus and smoking in in situ and invasive disease. Int J Cancer 2005; 116, 606-616, doi:10.1002/ijc.21009.
13. Kushi, L. H. et al. American Cancer Society Guidelines on nutrition and physical activity for cancer prevention: reducing the risk of cancer with healthy food choices and physical activity. CA Cancer J Clin 2012; 62, 30-67, doi:10.3322/caac.20140.
14. Christodoulidou, M. et al. Is sarcopenia a useful prognostic indicator in patients with squamous cell carcinoma of the penis? Journal of Clinical Oncology 2017; 35, 426-426, doi:10.1200/JCO.2017.35.6_suppl.426.
15. Sharma, P. et al. Sarcopenia as a predictor of complications in penile cancer patients undergoing inguinal lymph node dissection. World J Urol 2015; 33, 1585-1592, doi:10.1007/s00345-014-1471-6.
16. Takkamoto, D. et al. A low psoas muscle volume is associated with a poor prognosis in penile cancer. Oncotarget 2020; 11, 3526-3530, doi:10.18632/oncotarget.27719.
17. Mourtzakis, M. et al. A practical and precise approach to quantification of body composition in cancer patients using computed tomography images acquired during routine care. Appl Physiol Nutr Metab 2008; 33, 997-1006, doi:10.1139/H08-075.
18. Kelly, T. L., Wilson, K. E. & Heymsfield, S. B. Dual energy X-Ray absorptiometry body composition reference values from NHANES. PLoS One 2009; 4, e7038, doi:10.1371/journal.pone.0007038.
19. Charlson, M. E., Pompei, P., Ales, K. L. & MacKenzie, C. R. A new method of classifying prognostic comorbidity in longitudinal studies: development and validation. J Chronic Dis 1987; 40, 373-383, doi:10.1016/0021-9681(87)90171-8.
20. Quan, H. et al. Updating and validating the Charlson comorbidity index and score for risk adjustment in hospital discharge abstracts using data from 6 countries. Am J Epidemiol 2011; 173, 676-682, doi:10.1093/aje/kwq433.

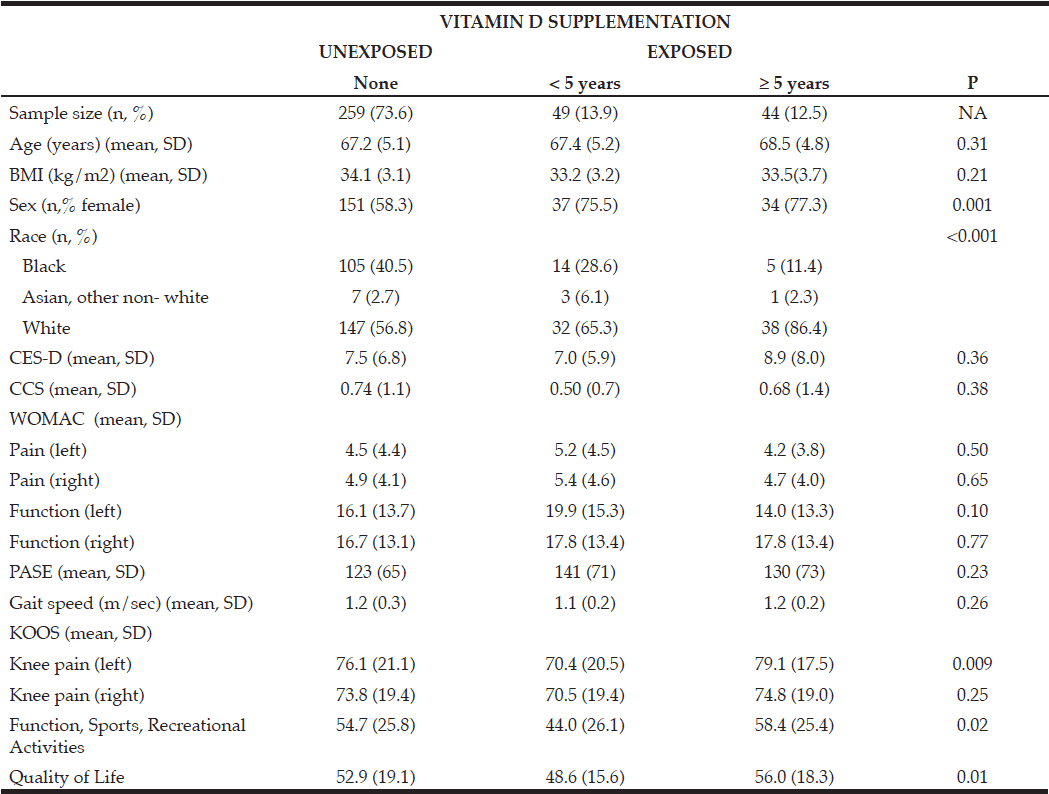
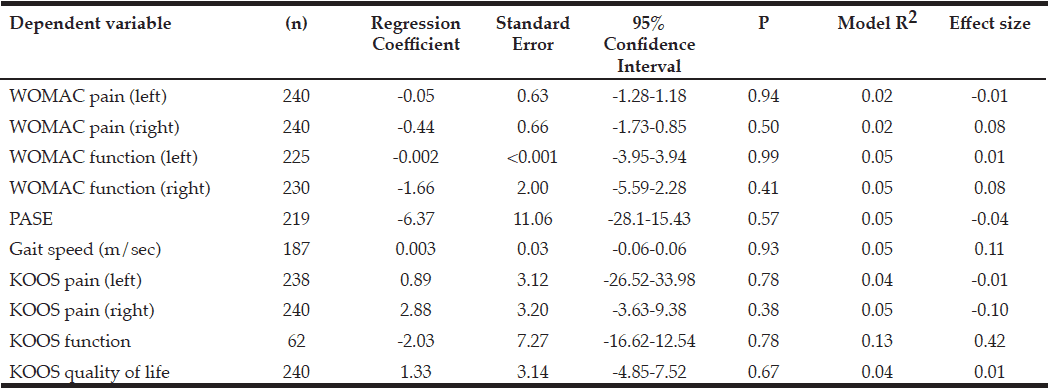
FIT & STRONG! PLUS: DESCRIPTIVE DEMOGRAPHIC AND RISK CHARACTERISTICS IN A COMPARATIVE EFFECTIVENESS TRIAL FOR OLDER AFRICAN-AMERICAN ADULTS WITH OSTEOARTHRITIS


M. L Fitzgibbon1,2,3, L. Tussing-Humphreys1,3,4, L. Schiffer3, R. Smith-Ray3,5, A.D. Demott3,6, M. Martinez3,6, M.L. Berbaum1,3, G.M. Huber7, S.L. Hughes3,6


1. University of Illinois Cancer Center, Chicago, IL 60612; 2. Department of Pediatrics, University of Illinois at Chicago, Chicago, IL 60612; 3. Institute for Health Research and Policy, School of Public Health, University of Illinois at Chicago, Chicago, IL, 60608; 4. Department of Medicine, University of Illinois at Chicago, Chicago, IL 60612; 5. Health Analytics, Research and Reporting, Walgreen Co., Deerfield, IL, 60015; 6. Center for Research on Health and Aging, University of Illinois at Chicago, Chicago, IL 60608; 7. Physical Therapy and Human Movement Sciences, Northwestern University, Chicago, IL, 60611

Corresponding Author: Marian L. Fitzgibbon, PhD, University of Illinois at Chicago, 486 Westside Research Office Building, 1747 W. Roosevelt Rd., Chicago, IL, 60608, Email: mlf@uic.edu, Phone: 312-996-0146


J Aging Res Clin Practice 2018;7:9-16
Published online February 19, 2018, http://dx.doi.org/10.14283/jarcp.2018.3


Abstract

Objectives: The prevalence of osteoarthritis (OA) has increased in the US. We report on a comparative effectiveness trial that compares Fit & Strong!, an existing evidence-based physical activity (PA) program, to Fit & Strong! Plus, which combines the Fit & Strong! intervention with a weight management intervention. Methods: Participants included 413 overweight/obese (BMI 25-50 kg/m²) adults with lower extremity (LE) OA. The majority of the sample was African-American and female. Both interventions met 3 times weekly for 8 weeks. Primary measures included diet and weight. Results: The baseline mean BMI for all participants was 34.8 kg/m², percentage of calories from fat was high, and self-reported PA was low. Discussion: This sample of overweight/obese African-American adults had lifestyle patterns at baseline that were less than healthful, and there were differences between self-report and performance-based measures as a function of age.

Key words: Weight management, obesity, older adults, physical activity.


Purpose

Arthritis and related rheumatic conditions, including osteoarthritis (OA), affect approximately 50 million or 22% of the adult United States (US) population (1), and the majority of affected individuals are older adults. African Americans with OA have higher rates of inactivity and functional limitations than non-Hispanic whites (2-4), and African-American women with OA have approximately twice the rate of disability compared to non-Hispanic whites (5). Risk factors for OA include genetics, female sex, and obesity (6), and obesity is a strong risk factor for the incidence and progression of knee OA (7, 8). Unfortunately, the prevalence of obesity has increased significantly since the 1980s, with African-American women ≥ 60 years having the highest rates compared to non-Hispanic white women (57.5% vs. 38.2%) (9-13).
Obese individuals who have OA are usually advised to lose weight (14-16). Several studies support the combination of physical activity (PA) and weight management as central to the reduction of knee pain and limitations in mobility (17, 18), and several randomized controlled trials (RCTs) have tested the combined impact of modest weight loss with regular moderate PA compared to either PA or diet/weight management alone (17, 19-22).  These studies highlight  a need to test relatively simple, easily replicable evidence-based programs that combine both PA and weight management for adults with OA and to test these interventions with disadvantaged populations that have consistently higher rates of OA and obesity, such as African-American women (1, 23). To address this need, our team developed and is testing Fit & Strong! Plus.
Fit & Strong! Plus combines interventions from two successful RCTs that have shown improvements in PA (Fit & Strong!) and weight management (the Obesity Reduction Black Intervention Trial, ORBIT) (24-26). The Fit & Strong! intervention and its evidence base are described in detail elsewhere (27-29). ORBIT is a 6-month weight loss and PA intervention targeting African-American women that was successful in reducing weight by 3.0 kg in the intervention group, on average (25). In 2012, we received funding to test the comparative effectiveness of customary Fit & Strong! vs. the new Fit & Strong! Plus version using an RCT. The details of the trial design are published elsewhere (30).


Methods

Design

The Fit & Strong! Plus trial is a randomized comparative effectiveness trial that is testing whether Fit & Strong! Plus produces significantly better results than standard Fit & Strong! on weight, dietary intake, PA, physical performance, OA-associated symptoms of LE pain and stiffness, anxiety / depression, and self-efficacy for weight loss and exercise among overweight / obese adults with OA. The project was approved by the Institutional Review Board at the University of Illinois at Chicago (UIC), and all participants gave written informed consent. The trial is registered at clinicaltrials.gov (NCT03180008).

Setting

Both interventions were conducted at local community sites.

Subjects

Participants were randomly assigned to Fit & Strong! (n = 210) or Fit & Strong! Plus (n = 203) and are being followed for 18 months.

Interventions

Both Fit & Strong! and Fit & Strong! Plus are conducted in 90-minute sessions 3 times per week over an 8-week period. The first 60 minutes of both interventions consist of stretching, low-impact aerobics, and strengthening exercises with a consistent focus on lower extremity muscles. The interventions diverge in the 30-minute health education component at the end of the session. The health education component of Fit & Strong is designed to build self-efficacy (SE) related to managing pain and OA symptoms through PA, while Fit & Strong! Plus also incorporates SE for dietary weight management behaviors.

Measures

Anthropometrics: Height was measured using a portable stadiometer (Seca, United Kingdom), and weight was measured using a calibrated digital scale (Tanita Worldwide). Both height and weight were measured twice. If the two measurements were > 0.5 cm or > 0.2 kg apart, a third measurement was taken, and the mean of the two closest measurements was used. BMI was calculated as weight (kg) divided by height (m) squared. To assess body composition change, we measured waist circumference twice using a Gulick 150-centimeter anthropometric tape (Country Technology, Inc.; Gays Mills, WI, USA). If the two waist measurements were > 1 cm apart, a third measurement was taken, and the mean of the two closest measurements was used.

Dietary intake

We used the Block 2005 Food Frequency Questionnaire (FFQ) to assess dietary intake. The FFQ, which inquires about approximately 110 food items, was designed to estimate habitual intake of an array of nutrients and food groups (31). Using data from the FFQ, participants’ diet quality was calculated using the Healthy Eating Index-2010 (HEI) (32), which measures adherence to the 2010 Dietary Guidelines for Americans (DGA).

Physical Activity

PA was assessed using the Physical Activity Scale for the Elderly (PASE) (33), a valid and reliable self-report measure for older adults, with a higher score indicating greater self-reported physical activity.

Performance measures

Lower extremity (LE) strength was measured using the 30-second Chair Stand, which tests the number of full stands from a seated position a person can complete in 30 seconds with folded arms (34). Mobility was assessed using the 6-minute Walk Test, which measures functional exercise capacity (35-37).

OA Symptoms

The Western Ontario and McMaster Universities Arthritis Index (WOMAC) was used to assess OA symptoms of stiffness and pain in the hip and knee joints during daily activities and the degree to which physical functioning is affected by arthritis.

Depression and anxiety

These outcomes were measured using the GERI-AIMS, a version of the Arthritis Impact Measurement Scale that was adapted for use with an elderly population (38).

Self Efficacy

We assessed weight-related SE using the Weight Efficacy Lifestyle Questionnaire (WEL), a 20-item measure that assesses confidence to manage eating in an array of situations (39).

Statistical Analyses

We tested for differences in participant characteristics between randomization groups at baseline using t-tests for most continuous variables, Wilcoxon rank tests for income and number of chronic conditions, and chi-square tests for categorical variables. We also examined differences in anthropometrics, diet, physical activity, performance measures, WOMAC OA index, anxiety/depression, and self-efficacy by age (<70 vs ≥ 70 years) using t-tests and chi-square tests. We explored associations with diet quality, PA, and physical performance using linear regression models with multiple covariates. SAS v 9.4 was used for all analyses.


Primary Results

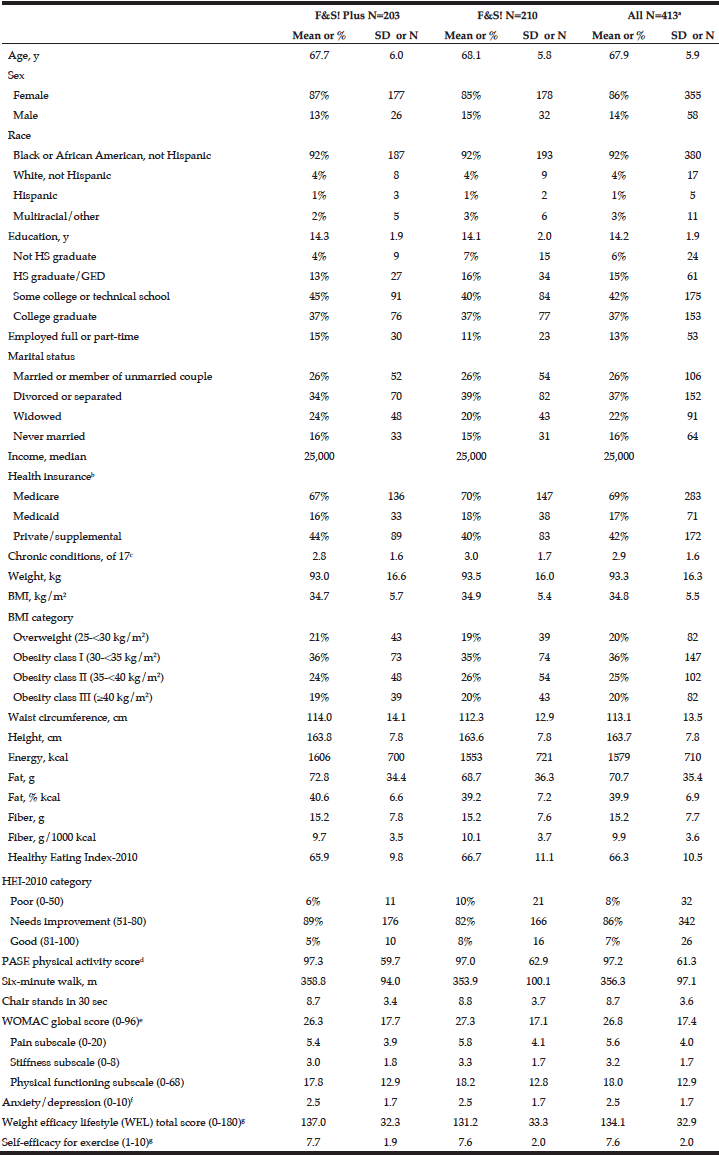
This study met its target recruitment goal of 400 subjects. We randomized 413 individuals: 203 to standard Fit & Strong! and 210 to Fit & Strong! Plus. Table 1 reflects the baseline demographic characteristics.  As we anticipated in designing the study, our sample was primarily African-American and representative of the racial and ethnic distribution of older adults in the neighborhoods surrounding the participating Chicago Park District sites. As measured by the Block 2005 FFQ, participants reported a mean energy intake of 1579 (SD = 710) calories, the mean percentage of calories from fat was 39.9 (SD = 6.9%), and the mean HEI total score was 66.3 out of a possible 100, which is in the “needs improvement” range, but is consistent with the HEI-2010 total score reported by the USDA for a nationally representative sample of adults that were 65 years and older (https://www.cnpp.usda.gov/sites/default/files/healthy_eating_index/HEI89-90report.pdf; https://www.cnpp.usda.gov/sites/default/files/healthy_eating_index/HEI-2010-During-2011-2012-Oct21-2016.pdf).

Table 1 Participant characteristics at baseline

Table 1
Participant characteristics at baseline

a. N=345 for income, N=411 for waist. For diet data, N=400; records with estimated energy <500 or >5000 were excluded from the analysis (N=13: 6 in F&S Plus, 7 in F&S). N=409 for physical activity score and 6-minute walk, and N=412 for chair stands; b. Percentage of participants reporting each type of insurance; some participants reported more than one type of insurance; c. Chronic conditions: Number of self-reported conditions currently affecting health (of 17): arthritis, high BP, heart disease, mental illness, diabetes, cancer, alcohol or drug abuse, lung disease, kidney disease, liver disease, stomach disease, blood disease, stroke or other neurologic problems, vascular disease, vision problems, hearing problems, thyroid; d. A higher score indicates greater physical activity; e. A higher score indicates greater difficulties due to OA; f. A higher score indicates greater anxiety/depression; g .A higher score indicates greater self-efficacy.


The mean score on the PASE (33) was 97.2 (SD = 61.3), which is lower than the  mean scores of 169.3 (SD = 88.2) reported by Skou and colleagues (40) and 131.4 (SD = 71.1) by Martin and colleagues (41) in work with older adult samples. Participants had a low mean score of 8.7 (SD = 3.6) on the 30-second chair stand as well as a low mean score of 356.3 meters (SD = 97.1) on the six-minute walk test. On the WOMAC, participants had a mean of 5.6 (SD = 4.0) on the pain subscale, 3.2 (SD = 1.7) on the stiffness subscale and 18.0 (SD = 12.9) on the physical functioning subscale, indicating a moderate amount of OA-related impairment at baseline. The mean score for anxiety/depression measured by the GERI-AIMS was low at 2.5 (SD = 1.7). Mean overall score on weight-related self-efficacy was 134.1 (SD = 32.9), which is higher than reported for other samples of overweight/obese non-Hispanic white samples (5, 42). Mean self-efficacy for exercise was also relatively high: 7.6 (SD=2.0) on a 1-10 scale.

Differences by Age

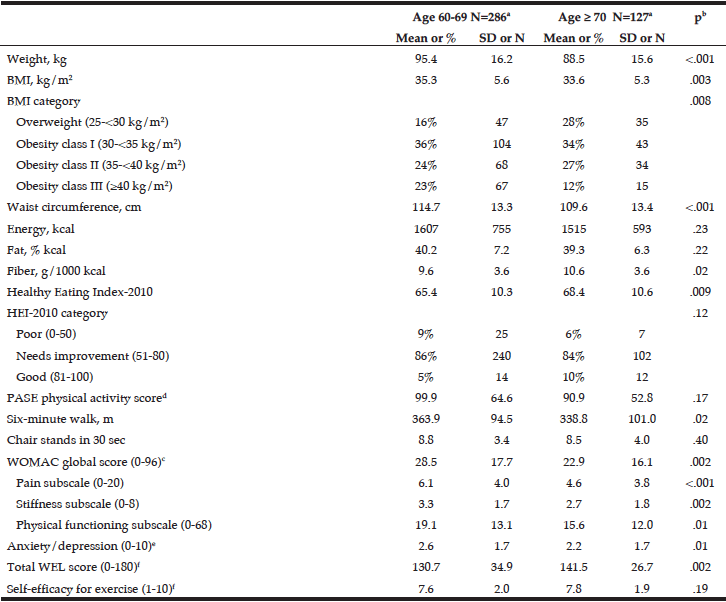
As shown in Table 2, we tested for differences between younger (60-69 years) and older (≥ 70 years) participants on a number of measures. Younger participants had a higher mean BMI (35.3 vs. 33.6 kg/m2, p = .003), and 23% of younger participants had Class III obesity (≥ 40 kg/m2) compared to 12% of older participants. Consistent with their lower BMI, older participants also scored significantly higher on the HEI (mean=68.4 vs. 65.4, p = .009) and consumed more fiber (10.6 vs. 9.6 g/1000 kcal, p = .02). Mean scores on the self-reported WOMAC showed that younger participants perceived more OA-related impairment than older participants. This was evident across the pain (6.1 vs. 4.6, p < .001), stiffness (3.3 vs. 2.7, p = .002), and physical functioning subscales (19.1 vs. 15.6, p = .01). However, on the performance-based six-minute walk, younger participants had a better mean score than older participants (363.9 m vs. 338.8 m, p = .02).

Table 2 Participant characteristics at baseline by age

Table 2
Participant characteristics at baseline by age

a. Ns differ for some variables due to missing data; see Table 1; b. From t-tests with pooled variance for continuous variables and chi-square tests for categorical variables; c. A higher score indicates greater difficulties due to OA; d. A higher score indicates greater physical activity; e. A higher score indicates greater anxiety/depression; f. A higher score indicates greater self-efficacy.


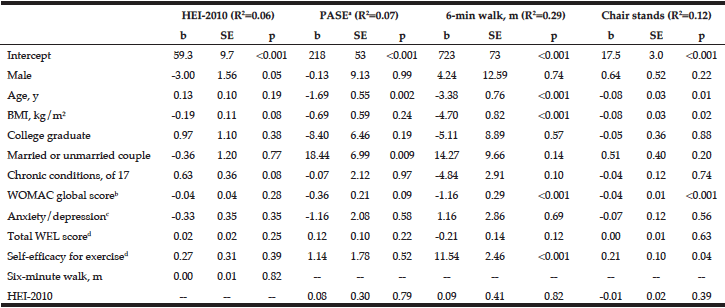
Finally, we used linear regression models with multiple covariates to explore possible predictors of diet quality, PA, and performance measures at baseline (Table 3). The chosen predictors explained a relatively small percentage of the variance for the HEI-2010 (R2=0.06) and self-reported PA (R2=0.07), somewhat more for chair stands in 30 seconds (R2=0.12) and a substantial percentage for six-minute walk distance (R2=0.29). None of the selected predictors were significantly associated with the HEI-2010 score at baseline. However, increased age was associated with lower self-reported PA (b=-1.69, p = .002), a shorter 6-minute walk distance (b=-3.38, p < .001), and fewer chair stands in 30 seconds (b=-0.08, p = .01). A higher BMI predicted a shorter 6-minute walk distance (b=-4.70, p < .001) and fewer chair stands (-0.08, p =.02). Married participants had higher self-reported PA (b=18.44, p=.009), but did not have significantly higher performance scores. A higher score on the WOMAC (more severe OA symptoms) predicted a shorter 6-minute walk distance (b=-1.16, p < .001) and fewer chair stands (b=-0.04, p < .001).

Table 3 Predictors of diet quality, physical activity, and performance measures

Table 3
Predictors of diet quality, physical activity, and performance measures

From linear regression models with diet and physical activity variables as the dependent variable and the variables shown as independent variables. For diet data, N=400; records with estimated energy <500 or >5000 were excluded from the analysis (N=13: 6 in F&S Plus, 7 in F&S). Due to missing data, N=409 for physical activity score and 6-minute walk; a. A higher score indicates greater physical activity; b. A higher score indicates greater difficulties due to OA; c. A higher score indicates greater anxiety/depression; d. A higher score indicates greater self-efficacy.


Discussion

OA is a leading cause of pain and disability among older adults in the US (43). The primary aim of this comparative effectiveness trial is to assess whether Fit & Strong! Plus is more successful than Standard Fit & Strong! for producing positive dietary changes at post-intervention (2 months) and producing a 5% or greater weight loss at 6 months that is maintained at 18 months among older adults who both have OA and are overweight or obese. The secondary aim is to assess whether Fit & Strong! Plus will produce superior outcomes for this population in self-reported PA and physical performance, lower extremity (LE) pain, stiffness, function, anxiety/depression, and self-efficacy at 2 months that are maintained at 6, 12, and 18 months.
Dietary intake is a central aspect of weight management, and high fat consumption is a key contributor to the obesity epidemic (44, 45). Overall, participants in our study consumed more than the recommended amount of fat and less than the recommended amount of fiber (46).  Although clinical guidelines recommend PA as a central tenet of treating OA, PA in this population is low, with less than 50% meeting current recommended activity levels (47-49).  In addition, a number of articles demonstrate that African Americans are less likely to meet PA guidelines than non-Hispanic whites (50, 51), and that African-American women, in particular, are among those reporting the lowest levels of PA (52-54).
We also administered the performance-based six-minute walk test. The mean score in our sample was 356.3 meters, which was lower than reports from other samples comprising individuals with OA (55).
Measuring lower body strength is vital when evaluating the functional performance of older adults with OA (34, 56) The 30-second chair stand test provides a reliable and valid indication of lower body strength and function (57). In our study, the mean score on this test was 8.7 (SD = 3.6), which is lower than the 13.1 reported in another study of healthy older adults (mean = 70.5 years) (34), and importantly, it was also lower than a score of 10.0 reported in a study of older adults (mean = 56.3 years) with OA(55).
Overall, OA-related pain and functional limitations are known to be higher among African Americans compared to non-Hispanic whites (58, 59). On the WOMAC, we observed both commonalities and differences between our sample and other older adult samples. For example, pain and physical function scores were 6.5 and 24.2 in the Messier IDEA trial respectively (20), compared to our scores of 5.6 and 18.0. Wilcox and colleagues (55) reported lower scores than our sample on the pain subscale (4.6-4.9), but higher scores on the stiffness subscale (5.1-5.5 vs. 3.2 in our sample).  A prior study of customary Fit & Strong! that included approximately 47% African Americans (42) reported similar scores on the pain and stiffness subscales but a higher score on physical function (42).
The differences between our older and younger participants are striking for the WOMAC. On all subscales, younger participants (60-69 years) reported more pain, stiffness, and disability than older participants (≥70 years). This could reflect societal changes in how people think about their health, with younger groups of older adults having higher expectations for their health [60].
Limitations. The current study has several limitations. It is limited to individuals who are overweight and obese (BMI = 25-50 kg/m²) and will not provide information on how Fit & Strong! Plus could benefit those with a BMI < 25 or > 50. We also did not clinically confirm OA, but instead used self-reported LE pain and stiffness. Additionally, our sample consisted of primarily lower-income adults with a median income of $25,000.
Conclusions. This study adds to the limited literature on combined PA and diet and weight management studies with older African-American adults with OA. Our results highlight some differences in self-reported versus performance-based functioning in our study sample at baseline and also documents differences between younger and older individuals within our older adult sample. Our findings regarding increased BMI and poorer self-reported function agree with findings from several recent longitudinal studies on aging that document disturbing trends of increased disability related to overweight/obesity in younger cohorts of aging adults (61, 62). These findings illustrate the need for additional research and ongoing refinement of interventions for this population that is both high-risk and growing rapidly.

Author’s Note

This project is supported by Grant Number R01AG039374 from the National Institute on Aging.  Additional support was provided by the American Cancer Society of Illinois grant (#261775) and American Cancer Society Mentored Research Scholar grant MRSG014-025-01-CNE) to Dr. Lisa Tussing-Humphreys. The content of this manuscript is solely the responsibility of the authors and does not necessarily represent the official views of the National Institute on Aging or National Institutes of Health.  We wish to thank Colleen Lammel and the supportive staff at the Chicago Park Districts. We would also like to thank Mirjana Antonic for her administrative support and the study participants for giving their time generously to the project.


Conflict of Interests: The authors declare that there are no conflicts of interest.

Ethical standards: All authors in this manuscript declare that they have no conflicting interest


References

1.    Trends in aging – united states and worldwide MMWR Suppl. 2003;52:101-6.
2.    Kington RS, Smith JP. Socioeconomic status and racial and ethnic differences in functional status associated with chronic diseases. Am J Public Health. 1997;87(5):805-10.
3.    Dunlop DD, Manheim LM, Sohn MW, Liu X, Chang RW. Incidence of functional limitation in older adults: The impact of gender, race, and chronic conditions. Arch Phys Med Rehabil. 2002;83(7):964-71.
4.    Helmick CG, Lawrence RC, Pollard RA, Lloyd E, Heyse SP. Arthritis and other rheumatic conditions: Who is affected now, who will be affected later? National arthritis data workgroup. Arthritis Care Res. 1995;8(4):203-11.
5.    Clark MM, Cargill BR, Medeiros ML, Pera V. Changes in self-efficacy following obesity treatment. Obes Res. 1996;4(2):179-81.
6.    Silverwood V, Blagojevic-Bucknall M, Jinks C, Jordan JL, Protheroe J, Jordan KP. Current evidence on risk factors for knee osteoarthritis in older adults: A systematic review and meta-analysis. Osteoarthritis Cartilage. 2015;23(4):507-15.
7.    Szoeke CE, Cicuttini FM, Guthrie JR, Clark MS, Dennerstein L. Factors affecting the prevalence of osteoarthritis in healthy middle-aged women: Data from the longitudinal melbourne women’s midlife health project. Bone. 2006;39(5):1149-55.
8.    Washburn RA, Smith KW, Jette AM, Janney CA. The physical activity scale for the elderly (pase): Development and evaluation. J Clin Epidemiol. 1993;46(2):153-62.
9.    Flegal KM, Kruszon-Moran D, Carroll MD, Fryar CD, Ogden CL. Trends in obesity among adults in the united states, 2005 to 2014. Jama. 2016;315(21):2284-91.
10.    Freedman DS. Obesity – united states, 1988-2008. MMWR Suppl. 2011;60(1):73-7.
11.    Crowninshield RD, Rosenberg AG, Sporer SM. Changing demographics of patients with total joint replacement. Clin Orthop Relat Res. 2006;443:266-72.
12.    Leininger RE, Knox CL, Comstock RD. Epidemiology of 1.6 million pediatric soccer-related injuries presenting to us emergency departments from 1990 to 2003. Am J Sports Med. 2007;35(2):288-93.
13.    Deshpande BR, Katz JN, Solomon DH, Yelin EH, Hunter DJ. Number of persons with symptomatic knee osteoarthritis in the us: Impact of race and ethnicity, age, sex, and obesity. Arthritis Care Res (Hoboken). 2016;68(12):1743-50.
14.    Zhang W, Robertson J, Jones AC, Dieppe PA, Doherty M. The placebo effect and its determinants in osteoarthritis: Meta-analysis of randomised controlled trials. Ann Rheum Dis. 2008;67(12):1716-23.
15.    March L, Amatya B, Osborne RH, Brand C. Developing a minimum standard of care for treating people with osteoarthritis of the hip and knee. Best Pract Res Clin Rheumatol. 2010;24(1):121-45.
16.    Gay C, Chabaud A, Guilley E, Coudeyre E. Educating patients about the benefits of physical activity and exercise for their hip and knee osteoarthritis. Systematic literature review. Ann Phys Rehabil Med. 2016;59(3):174-83.
17.    Messier SP, Loeser RF, Miller GD, Morgan TM, Rejeski WJ, Sevick MA, et al. Exercise and dietary weight loss in overweight and obese older adults with knee osteoarthritis: The arthritis, diet, and activity promotion trial. Arthritis Rheum. 2004;50(5):1501-10.
18.    Messier SP, Loeser RF, Mitchell MN, Valle G, Morgan TP, Rejeski WJ, et al. Exercise and weight loss in obese older adults with knee osteoarthritis: A preliminary study. J Am Geriatr Soc. 2000;48(9):1062-72.
19.    Villareal DT, Chode S, Parimi N, Sinacore DR, Hilton T, Armamento-Villareal R, et al. Weight loss, exercise, or both and physical function in obese older adults. N Engl J Med. 2011;364(13):1218-29.
20.    Messier SP, Mihalko SL, Legault C, Miller GD, Nicklas BJ, DeVita P, et al. Effects of intensive diet and exercise on knee joint loads, inflammation, and clinical outcomes among overweight and obese adults with knee osteoarthritis: The idea randomized clinical trial. Jama. 2013;310(12):1263-73.
21.    Somers TJ, Blumenthal JA, Guilak F, Kraus VB, Schmitt DO, Babyak MA, et al. Pain coping skills training and lifestyle behavioral weight management in patients with knee osteoarthritis: A randomized controlled study. Pain. 2012;153(6):1199-209.
22.    Messier SP, Gutekunst DJ, Davis C, DeVita P. Weight loss reduces knee-joint loads in overweight and obese older adults with knee osteoarthritis. Arthritis Rheum. 2005;52(7):2026-32.
23.    Zinn C, Schofield GM, Hopkins WG. A “small-changes” workplace weight loss and maintenance program: Examination of weight and health outcomes. J Occup Environ Med. 2012;54(10):1230-8.
24.    Fitzgibbon ML, Stolley M, Schiffer L, Sharp L, Singh V, Van Horn L, et al. Obesity reduction black intervention trial (orbit): Design and baseline characteristics. J Womens Health (Larchmt). 2008;17(7):1099-110.
25.    Fitzgibbon ML, Stolley MR, Schiffer L, Sharp LK, Singh V, Dyer A. Obesity reduction black intervention trial (orbit): 18-month results. Obesity (Silver Spring). 2010;18(12):2317-25.
26.    Stolley MR, Fitzgibbon ML, Schiffer L, Sharp LK, Singh V, Van Horn L, et al. Obesity reduction black intervention trial (orbit): Six-month results. Obesity (Silver Spring). 2009;17(1):100-6.
27.    Hughes SL, Seymour RB, Campbell R, Pollak N, Huber G, Sharma L. Impact of the fit and strong intervention on older adults with osteoarthritis. Gerontologist. 2004;44(2):217-28.
28.    Hughes SL, Seymour RB, Campbell RT, Desai P, Huber G, Chang HJ. Fit and strong!: Bolstering maintenance of physical activity among older adults with lower-extremity osteoarthritis. Am J Health Behav. 2010;34(6):750-63.
29.    Hughes SL, Seymour RB, Campbell RT, Huber G, Pollak N, Sharma L, et al. Long-term impact of fit and strong! On older adults with osteoarthritis. Gerontologist. 2006;46(6):801-14.
30.    Smith-Ray RL, Fitzgibbon ML, Tussing-Humphreys L, Schiffer L, Shah A, Huber GM, et al. Fit and strong! Plus: Design of a comparative effectiveness evaluation of a weight management program for older adults with osteoarthritis. Contemp Clin Trials. 2014;37(2):178-88.
31.    Block G, Hartman AM, Dresser CM, Carroll MD, Gannon J, Gardner L. A data-based approach to diet questionnaire design and testing. Am J Epidemiol. 1986;124(3):453-69.
32.    Guenther PM, Casavale KO, Reedy J, Kirkpatrick SI, Hiza HA, Kuczynski KJ, et al. Update of the healthy eating index: Hei-2010. J Acad Nutr Diet. 2013;113(4):569-80.
33.    Washburn RA, McAuley E, Katula J, Mihalko SL, Boileau RA. The physical activity scale for the elderly (pase): Evidence for validity. J Clin Epidemiol. 1999;52(7):643-51.
34.    Jones CJ, Rikli RE, Beam WC. A 30-s chair-stand test as a measure of lower body strength in community-residing older adults. Res Q Exerc Sport. 1999;70(2):113-9.
35.    Kennedy DM, Stratford PW, Wessel J, Gollish JD, Penney D. Assessing stability and change of four performance measures: A longitudinal study evaluating outcome following total hip and knee arthroplasty. BMC Musculoskelet Disord. 2005;6:3.
36.    Naylor JM, Hayen A, Davidson E, Hackett D, Harris IA, Kamalasena G, et al. Minimal detectable change for mobility and patient-reported tools in people with osteoarthritis awaiting arthroplasty. BMC Musculoskelet Disord. 2014;15:235.
37.    Guyatt GH, Sullivan MJ, Thompson PJ, Fallen EL, Pugsley SO, Taylor DW, et al. The 6-minute walk: A new measure of exercise capacity in patients with chronic heart failure. Can Med Assoc J. 1985;132(8):919-23.
38.    Hughes SL, Edelman P, Chang RW, Singer RH, Schuette P. The geri-aims. Reliability and validity of the arthritis impact measurement scales adapted for elderly respondents. Arthritis Rheum. 1991;34(7):856-65.
39.    Dutton GR, Martin PD, Rhode PC, Brantley PJ. Use of the weight efficacy lifestyle questionnaire with african american women: Validation and extension of previous findings. Eat Behav. 2004;5(4):375-84.
40.    Skou ST, Wise BL, Lewis CE, Felson D, Nevitt M, Segal NA. Muscle strength, physical performance and physical activity as predictors of future knee replacement: A prospective cohort study. Osteoarthritis Cartilage. 2016;24(8):1350-6.
41.    Martin KA, Rejeski WJ, Miller ME, James MK, Ettinger WH, Jr., Messier SP. Validation of the pase in older adults with knee pain and physical disability. Med Sci Sports Exerc. 1999;31(5):627-33.
42.    Pinto BM, Clark MM, Cruess DG, Szymanski L, Pera V. Changes in self-efficacy and decisional balance for exercise among obese women in a weight management program. Obes Res. 1999;7(3):288-92.
43.    Johnson VL, Hunter DJ. The epidemiology of osteoarthritis. Best Pract Res Clin Rheumatol. 2014;28(1):5-15.
44.    Fung TT, Rimm EB, Spiegelman D, Rifai N, Tofler GH, Willett WC, et al. Association between dietary patterns and plasma biomarkers of obesity and cardiovascular disease risk. Am J Clin Nutr. 2001;73(1):61-7.
45.    Cordain L, Eaton SB, Sebastian A, Mann N, Lindeberg S, Watkins BA, et al. Origins and evolution of the western diet: Health implications for the 21st century. Am J Clin Nutr. 2005;81(2):341-54.
46.    Dietary guidelines for americans, 2010. Washington, D.C.: Office of Disease Prevention and Health Promotion, 2010 December 2010. Report No.
47.    Holden MA, Nicholls EE, Young J, Hay EM, Foster NE. Exercise and physical activity in older adults with knee pain: A mixed methods study. Rheumatology (Oxford). 2015;54(3):413-23.
48.    Herbolsheimer F, Schaap LA, Edwards MH, Maggi S, Otero A, Timmermans EJ, et al. Physical activity patterns among older adults with and without knee osteoarthritis in six european countries. Arthritis Care Res (Hoboken). 2016;68(2):228-36.
49.    Wallis JA, Webster KE, Levinger P, Taylor NF. What proportion of people with hip and knee osteoarthritis meet physical activity guidelines? A systematic review and meta-analysis. Osteoarthritis Cartilage. 2013;21(11):1648-59.
50.    Mama SK, McNeill LH, McCurdy SA, Evans AE, Diamond PM, Adamus-Leach HJ, et al. Psychosocial factors and theory in physical activity studies in minorities. Am J Health Behav. 2015;39(1):68-76.
51.    Matthews CE, Chen KY, Freedson PS, Buchowski MS, Beech BM, Pate RR, et al. Amount of time spent in sedentary behaviors in the united states, 2003-2004. Am J Epidemiol. 2008;167(7):875-81.
52.    Tucker JM, Welk GJ, Beyler NK. Physical activity in u.S.: Adults compliance with the physical activity guidelines for americans. Am J Prev Med. 2011;40(4):454-61.
53.    Troiano RP, Berrigan D, Dodd KW, Masse LC, Tilert T, McDowell M. Physical activity in the united states measured by accelerometer. Med Sci Sports Exerc. 2008;40(1):181-8.
54.    Cohen SS, Matthews CE, Signorello LB, Schlundt DG, Blot WJ, Buchowski MS. Sedentary and physically active behavior patterns among low-income african-american and white adults living in the southeastern united states. PLoS One. 2013;8(4):e59975.
55.    Wilcox S, McClenaghan B, Sharpe PA, Baruth M, Hootman JM, Leith K, et al. The steps to health randomized trial for arthritis: A self-directed exercise versus nutrition control program. Am J Prev Med. 2015;48(1):1-12.
56.    Stump TE, Clark DO, Johnson RJ, Wolinsky FD. The structure of health status among hispanic, african american, and white older adults. J Gerontol B Psychol Sci Soc Sci. 1997;52 Spec No:49-60.
57.    Bohannon RW. Sit-to-stand test for measuring performance of lower extremity muscles. Percept Mot Skills. 1995;80(1):163-6.
58.    Anderson KO, Green CR, Payne R. Racial and ethnic disparities in pain: Causes and consequences of unequal care. J Pain. 2009;10(12):1187-204.
59.    Hardt J, Jacobsen C, Goldberg J, Nickel R, Buchwald D. Prevalence of chronic pain in a representative sample in the united states. Pain Med. 2008;9(7):803-12.
60.    Martin LG, Freedman VA, Schoeni RF, Andreski PM. Health and functioning among baby boomers approaching 60. J Gerontol B Psychol Sci Soc Sci. 2009;64(3):369-77.
61.    Rosen DMCaELGaAB. Is the us population behaving healthier? Working Paper. National Bureau of Economic Research, 2007 April. Report No.:  Contract No.: 13013.
62.    Olshansky SJ. Projecting the future of u.S. Health and longevity. Health Aff (Millwood). 2005;24 Suppl 2:W5r86-9.

IDEAL REDUCTION OF CALORIES FOR GREATEST REDUCTION OF BODY FAT AND MAINTENANCE OF LEAN BODY MASS


M. Lombardo1, R. Magarotto1, F. Marinelli1, E. Padua1,3, M. Caprio1, G.Annino3, A. Bellia1,2, F. Iellamo3,4


1. Human Nutrition Unit, San Raffaele Rome Open University, Italy; 2. Department of Systems Medicine, Faculty of Medicine and Surgery, Tor Vergata University, Rome, Italy; 3. Dep. Clinical Science and Translational Medicine, University Tor Vergata; 4. IRCCS San Raffaele Pisana, Roma.

Corresponding Author: Mauro Lombardo, MD, San Raffaele Rome Open University, Via di Val Cannuta, 247, 00166 Roma, Italy. E-mail: mauro.lombardo@unisanraffaele.gov.it


J Aging Res Clin Practice 2017;inpress
Published online January 5, 2017, http://dx.doi.org/10.14283/jarcp.2017.1


Abstract

Objectives: This retrospective clinical study was intended to assess the ideal number of calories in the Mediterranean-style diet (MD) required for maximum weight reduction through a greater decrease in fat mass (FM) and maintenance of fat-free mass (FFM). Methods: We analysed the data of 90 non-smoking subjects (56 females, age = 32.5 ± 9.6 years, BMI = 28.3 ± 5.4 kg/m2, data as mean ± SD). The participants underwent two-month individualised MDs with similar macronutrient composition (55% carbohydrate, 30% fat, 15% protein and fibre > 30 g) but different amounts of energy, which varied daily from 374 kcal to 1305 kcal compared with the total energy expenditure measured by metabolic Holter. The sample was divided into nine groups of 10 subjects in order to establish the amount of energy restriction that was most effective in terms of achieving fat loss and maintaining muscle mass. Results: All subject groups had significant improvements in body composition parameters (weight loss = 2.7 ± 1.8 kg, FM loss = 2.2 ± 1.2 kg and FFM loss = 0.5 ± 1.3 kg). Differences between the nine groups were not significant but higher FM loss was observed in groups one, three, six and eight. Groups one and four had the highest FFM increase and groups two, three and eight had the highest FFM loss. Conclusions: These data suggest that increasing the amount of energy restriction in a low-calorie MD might be useless in terms of obtaining a higher FM loss but a lower restriction could be more effective for maintaining FFM.

Key words: Energy restriction, Mediterranean-style diet, body composition, obesity.

Abbreviations: MD: Mediterranean-style diet; FM: fat mass; FFM:f at-free mass; WL: weight loss; REE: resting energy expenditure; VLCD: very low calorie diet; %FML: % fat mass lost; %FFML: % fat-free mass lost; FFML: fat-free mass lost; FML: fat mass lost.


Background

For successful long-term weight loss (WL) the focus should be on achieving the best body composition for maintaining health rather than merely the loss of body weight (BW) (1). Since FM is the most metabolically dangerous tissue type, it is a more meaningful measure of health risk (2). A decrease in weight during a diet should aim at the slightest reduction of FFM, trying to shift the deficit towards fat, particularly visceral fat (3). A variable amount of FFM is often lost in combination with fat loss, and the aim should be to keep this loss to a minimum and to preserve resting energy expenditure (REE). Weight loss-associated adaptations in REE may impair weight loss and contribute to weight regain. In contrast to weight-stable subjects, weight regainers showed a reduced REE adjusted for changes in organ and tissue masses after weight loss (4).
Promoting eating habits consistent with Mediterranean Diet (MD) patterns may be a useful factor in efforts to fight obesity. High MD adherence has been associated with a significantly lower chance of becoming obese among overweight subjects, with stronger associations after adjustment for underreporting of dietary data (5).
Reduced-calorie diets result in clinically meaningful weight loss regardless of which macronutrients they emphasise (6). In a recent trial (7) subjects lost more FM than FFM after consumption of different diets, with no differences in changes in body composition, abdominal fat, or hepatic fat between assigned macronutrient amounts. Thus a combination of diet and exercise provides greater improvement in physical function than either intervention alone (8).
The degree of caloric restriction, exercise and rate of weight loss influences the percentage of fat-free mass lost (%FFML). Comparison diets with similar nutrient composition show that the degree of caloric restriction impacts on %FFML, at least in the short term (9). A very low calorie diet (VLCD) is a diet with extremely low daily food energy consumption (800 kilocalories per day or fewer). VLCD provides quite rapid weight loss and higher loss of LBM. An accurate assessment of EE is necessary to determine caloric needs and to provide optimal nutrition support for in-patients, as well as nutrition counselling for outpatients (10).
This retrospective clinical study was intended to assess in the short term the ideal reduction of calories in subjects following an MD to obtain the maximum weight reduction through a greater decrease in FM and maintenance of FFM.


Subjects and methods

All 90 subjects were adult Caucasians and provided written informed consent to participate. The investigation was conducted in accordance with the Declaration of Helsinki. Exclusion criteria were as follows: age 55 years; pregnancy or nursing; any lifestyle treatment in the year before; alcoholism; diabetes mellitus; chronic kidney disease; glucocorticoids, oestrogens and anti-convulsant therapies; history of cardiovascular, neoplastic or other systemic diseases (both chronic and acute). All subjects underwent thorough medical examination and subsequent food history, physical examination and evaluation of body composition. Weight and height were measured after subjects fasted overnight and were wearing only underwear. Body composition: fat mass (FM), fat-free mass (FFM) and hydration status (TBW) were recorded by the BIA Tanita BC-420 MA, a validated instrument with DXA [11], which measures values from a standing position and without the use of electrodes to within 100 grams.
The same protocol with detection of the above information was carried out two months later. Patients were required to observe the following guidelines before body composition analysis: at least three hours after awakening and the beginning of the normal daily activities; three hours or more after meals and not eating or drinking too much the day before the measurement; 12 hours or more after a hard workout; urinating before the measurement; avoiding alcohol 12 hours before the visit and avoiding menstruation.
The total energy expenditure was measured by a multisensory armband (SenseWear Pro2 Armband, Bodymedia Inc., Pittsburgh, PA, USA) worn on the back of the upper right arm that recorded data for at least 48 hours in a free-living context. The measured values are represented by TEE (total energy expenditure), the steps taken, the energy expenditure during exercise and daily METs. All subjects were also asked to maintain the same lifestyle and sporting activity consistently for the duration of the study.
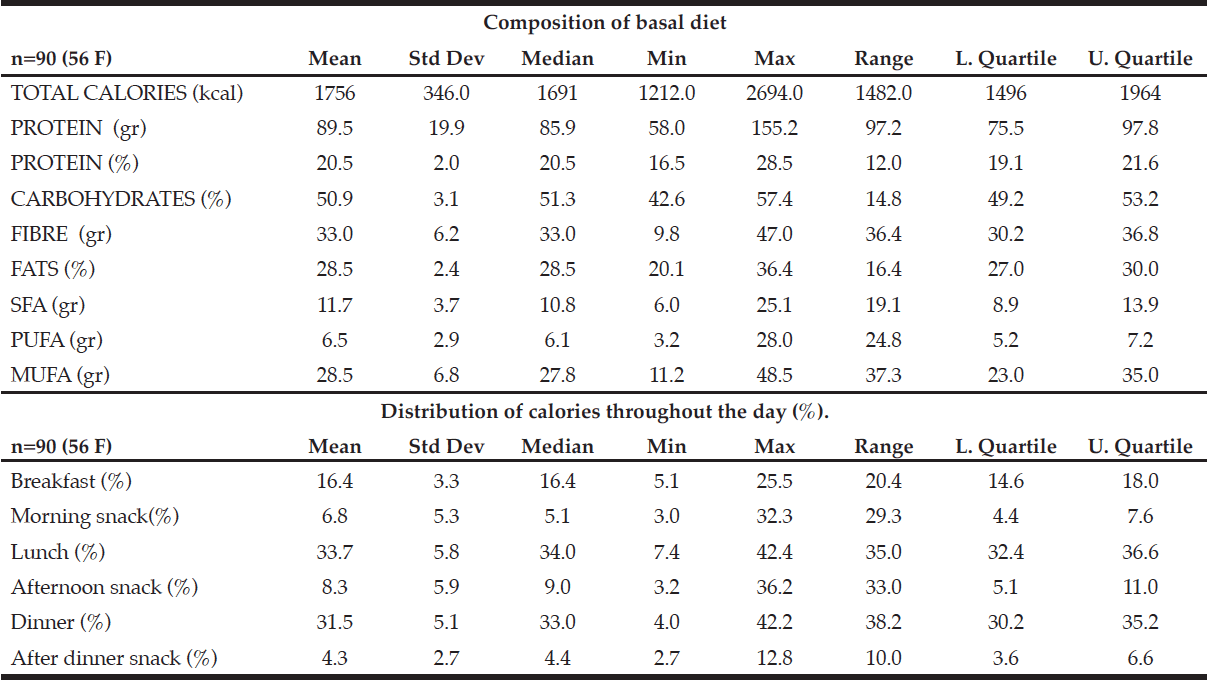
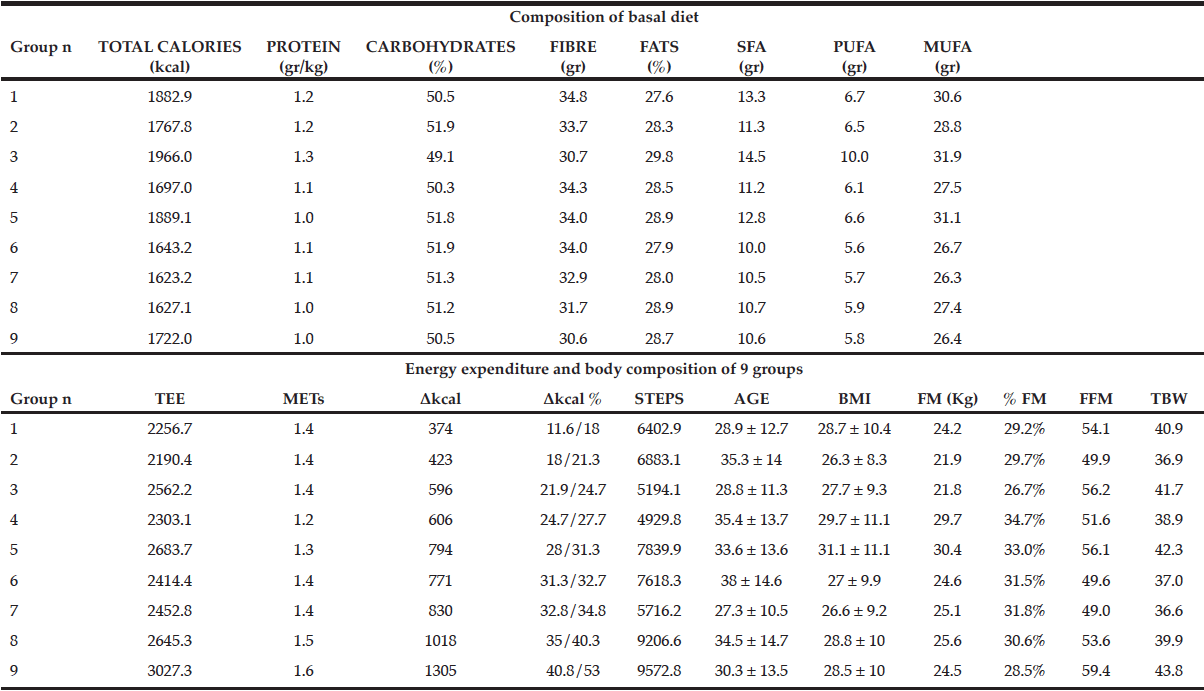
All participants were placed on a two-month hypocaloric nutritionally balanced MD tailored to the individual. The nutritional patterns of the MD and the distribution of the daily food ration are shown in Table 1. A diet with a higher number of calories in the first part of the day was elaborated in order to establish a greater reduction in fat mass as we demonstrated before (12). The main features of MD are as follows (13): eating primarily plant-based foods, such as fruits and vegetables, whole grains, legumes, and nuts; replacing butter with healthy fats such as olive oil; using herbs and spices instead of salt to flavour foods; limiting red meat to no more than a few times a month; and eating fish and poultry at least twice a week. Nutritional intakes were divided into three main meals and two or three snacks. Twice a month patients met a dietitian for a nutritional rehabilitation programmed designed to improve and promote change in eating habits and consisting of individual sessions (dietary assessment, evaluation of nutrient intake and adequacy, nutritional status, anthropometric data, eating patterns, readiness to adopt change). Patients were required to complete a three-day diet diary at the beginning of the study and then weekly throughout the follow-up. Diaries included one weekend day. In order to achieve a more favourable body composition regarding total fat and muscle mass, we recommended a combination diet with endurance and strength training tailored to the individual by a personal trainer (14). The sample was divided into nine homogeneous groups of 10 subjects in relation to the difference% (Δkcal%) between caloric intake and TEE.

Table 1 Composition and mean characteristics of the basal diet

Table 1
Composition and mean characteristics of the basal diet

SFA: saturated fatty acids. MUFA: monounsaturated fatty acids. PUFA: polyunsaturated fatty acids


Statistical analyses

The data were analysed with SOFA Statistics ver. 1.4.2 open source software. Results for descriptive statistics were expressed as mean ± standard deviation or median (range). Statistical comparisons of continuous variables among the groups were performed with one-way ANOVA. A P-value of <0.05 was considered statistically significant.


Results

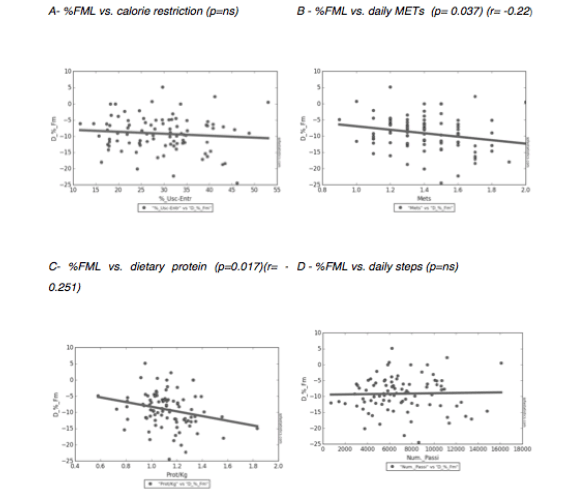
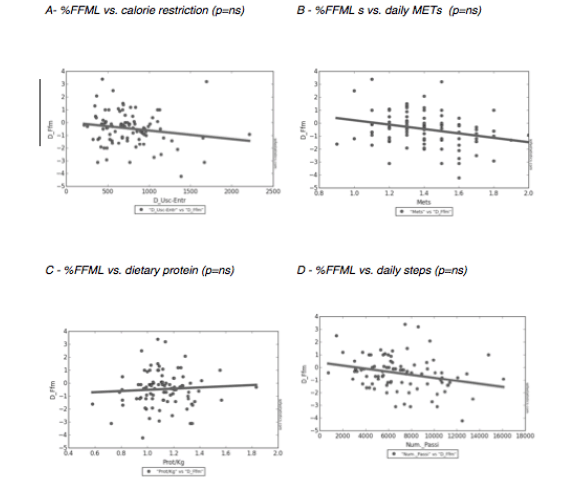
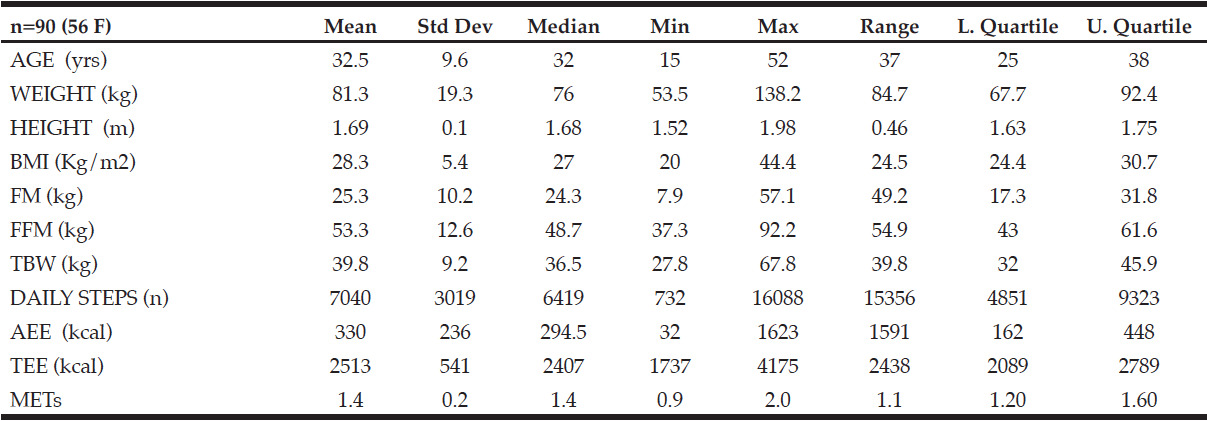
Baseline characteristics of the 90 (56 women, age 32 ± 10 years) participants recruited to the study are shown in Table 2. Subjects showed an average BMI of 28.3 ± 5.4 kg / m2 and FM of 25.3 ± 10.2 kg (38.3%), FFM 53.3 ± 12.6 Kg (61.7%) and TBW of 39.8 ± 9.2 kg (41.3%). The sample at the beginning of the study had a mean total energy expenditure of 2513 ± 541 kcal, an active energy expenditure of 330 ± 236 Kcal and daily average METs of 1.4 ± 0.2. The subjects wore the instrument metabolic Holter SenseWear® Armband for an average 2.13 ± 1.2 days continuously, performing a total number of steps of 7040 ± 3019. Correlations between %FML and calorie restriction (A), daily METs (B), diet protein (gr) for weight (kg) (C), and daily steps (D) are shown in Figure 1. Significant correlations were found for %FL and daily METs (p= 0.037) and diet protein (p= 0.017). Figure 2 shows the correlation between %FFML values and calorie restriction (A), daily METs (B), protein (gr) diet for weight (kg) (C), and daily steps (D). No statistical correlation was found between these values.

Figure 1 Correlation between fat mass loss (%FML) and calorie restriction (A), daily METs (B), diet protein (gr) for weight (kg) (C), and daily steps (D)

Figure 1
Correlation between fat mass loss (%FML) and calorie restriction (A), daily METs (B), diet protein (gr) for weight (kg) (C), and daily steps (D)


Figure 2 Correlation between fat-free mass loss (%FFML) values and calorie restriction (A), daily METs (B), diet protein (gr) for weight (kg) (C), and daily steps (D)

Figure 2
Correlation between fat-free mass loss (%FFML) values and calorie restriction (A), daily METs (B), diet protein (gr) for weight (kg) (C), and daily steps (D)


There were no significant nutritional differences between the nine groups except diet’s calories. Group nine had the highest amount of dietary restriction (1305kcal) and group one had the lowest (374kcal). Dietary features, energy expenditure and body composition of the nine groups are shown in Table 3. Groups 8 and 9 had the highest energy expenditure for sporting activity and higher daily average METs.


Table 2 Body composition, energy expenditure, and other characteristics of subjects

Table 2
Body composition, energy expenditure, and other characteristics of subjects

n: number of subjects ; BMI: body mass index; FM: fat mass; FFM: fat-free mass; TBW: Total body water; AEE (active energy expenditure); TEE: total energy expenditure; METs: Daily metabolic equivalent task


Table 3 Difference between diet features, body composition and energy expenditure parameters between the nine groups

Table 3
Difference between diet features, body composition and energy expenditure parameters between the nine groups

Data are mean values. Every group is formed by 10 subjects. TEE: total energy expenditure AEE (active energy expenditure); METs: daily metabolic equivalent task; STEPS: daily steps; BMI: body mass index; FM: fat mass; %FM: % fat mass, FFM: fat-free mass; TBW: total body water.


The differences for all subjects between the values at the beginning (T0) and end of the study (T1) are shown in Table 4. All subjects’ results returned the following changes (Δ): Δweight equal to 2.68 ± 1.79 kg, ΔBMI equal to 0.93 ± 0.6 kg / m2, %FML equal to 2.2 ± 1.2 kg, FFML equal to 0.46 ± 1.3 kg and TBWL 0.5 ± 0.9 kg. Table 5 shows differences in the average kg of fat mass between the start and end of the study sample for the nine groups.


Table 4 Body composition of all subjects before and after the two-month study

Table 4
Body composition of all subjects before and after the two-month study

Data are mean values. n: number of subjects; FM: fat mass; FFM: fat-free mass; TBW: total body water


Table 5 Difference in body composition parameters between the nine groups before and after study

Table 5
Difference in body composition parameters between the nine groups before and after study

Δkcal: mean difference in Kcal between caloric intake and energy expenditure; Δkcal%: % difference between caloric intake and energy expenditure (minimum and maximum value of the group); ΔWEIGHT: mean difference in weight in Kg between the start and end of study; ΔBMI: mean difference in BMI  between the start and end of study; %FML: mean difference of % fat mass between the start and end of study; ΔTBW:  mean difference in total body water (TBW); ΔFFM: mean FFM difference in Kg between the start and end of the study. There is no statistically significant difference between the groups.


A significant decrease of FM was observed in all groups with different numbers of calories and energy expenditure reduction; the groups with greater restriction, such as eight and nine, had decreases comparable to groups with less restriction, such as one and three. Furthermore, the analysis of variance between groups (ANOVA) did not find any significant difference.


Discussion

Our findings suggest that different rates of energy restriction result in similar body composition variation after two months of MD in overweight or obese individuals (15). Common findings suggest the necessity for acute energetic imbalance; in our results there appears to be no relationship between an higher energy deprivation and better body composition results after MD. Our data confirm the idea of a more complex network of factors that influence overall body composition and health issues for adults (16).
Typical weight loss rules assert that a energy deficit of 7700 kcal is required to lose 1 kg of body weight, or equivalently 32.2 MJ per kg. However, it has been pointed out that FFM is lost in concert with FM during WL and thus it is now generally accepted that these rules overestimates FML%. A more recent rule on expected fat-free mass (FFM) states that approximately one-quarter of weight loss will be FFM (i.e. ΔFFM/ΔWeight = ~0.25), with the remaining three-quarters being FM (17). The ideal number of calories for maximising FM loss while preserving FFM has not been established in previous study (5).
All nine groups achieved weight reductions between 2 and 3.6 kg in the observation period or in two months; parameters are in line with the recommendations set by the National Institute of Health of between 250 and 1000 grams per week. Most patients trying to lose weight do not employ the recommended combination of reducing calorie intake and engaging in leisure-time physical activity of 150 minutes or more per week. The degree of caloric restriction, exercise and rate of weight loss influence the proportion of weight lost. Comparison of different diets gives clear evidence that the degree of caloric restriction affects %FFML. Previous studies demonstrated that the increased initial rate of weight loss achieved using VLCDs compared with LCDs may be the cause of the greater FFM loss on these diets, at least in the short term (9). VLCDs provide quite rapid weight loss and substantial loss of FFM, but stable weight may be more important in terms of the long-term benefits of living a healthier lifestyle.
Exercise training is associated with an increase in energy expenditure, thus promoting changes in body composition and bodyweight while keeping dietary intake constant. The advantages of strength training may have greater implications than initially proposed with respect to decreasing percentage body fat and sustaining FFM (18).
Group one, which had the smaller caloric restriction, obtained one of the best results in terms of fat mass loss and muscle maintenance. We may therefore conclude that excessive caloric restriction is not required to achieve the best results. A less restrained diet would be easier to maintain in the long term because it requires fewer sacrifices (19).
These results also show that as regards the effectiveness of the diet correct directions by the dietitian on nutritional choices and physical activity are more important than the degree of caloric restriction. Perhaps we simply need to tell our patients which food they need to avoid and what sort of physical activity they should do without stringent and often unrealistic calorie restrictions.
Our retrospective study found useful conclusions in relation to the various degrees of calorie restriction for proper weight loss. It could be argued that a smaller restriction of daily calorie intake results in the short term in a significant decrease in weight in terms of fat mass and stabilisation of lean body mass. On the other hand, it is clear that a higher caloric restriction did not lead to a more significant FM decrease. The study could open up new areas of inquiry in relation to healthy lifestyle and physical activity prescriptions for ideal weight loss.


Conclusions

Patients usually lose weight while on a programme but regain weight after they revert to their former lifestyle. We demonstrated that a lower energy restriction is enough to obtain similar %FML and preserve FFM than more unrealistic weight loss programmes not suitable for long-term lifestyle results.


Conflict of interest: The authors declares that there is no conflict of interest regarding the publication of this paper.

Ethical standard: All procedures followed were in accordance with the ethical standards of the responsible committee on human experimentation (institutional and national) and with the Helsinki Declaration of 1975, as revised in 2008. Informed consent was obtained from all patients for being included in the study.


References

1. Serdula MK, Mokdad AH, Williamson DF, Galuska DA, Mendlein JM, Heath GW. Prevalence of attempting weight loss and strategies for controlling weight. JAMA. 1999 Oct 13;282(14):1353-8. PubMed PMID: 10527182.
2. Bosy-Westphal A, Geisler C, Onur S, Korth O, Selberg O, Schrezenmeir J, Müller MJ. Value of body fat mass vs anthropometric obesity indices in the assessment of metabolic risk factors. Int J Obes (Lond). 2006 Mar;30(3):475-83. PubMed PMID: 16261188.
3. Rachel A. Millstein. Measuring Outcomes in Adult Weight Loss Studies That Include Diet and Physical Activity: A Systematic Review. Journal of Nutrition and Metabolism, vol. 2014, Article ID 421423, 13 pages, 2014. doi:10.1155/2014/421423
4. Bosy-Westphal A, Schautz B, Lagerpusch M, Pourhassan M, Braun W, Goele K,Heller M, Glüer CC, Müller MJ. Effect of weight loss and regain on adipose tissue distribution, composition of lean mass and resting energy expenditure in young overweight and obese adults. Int J Obes (Lond). 2013 Oct;37(10):1371-7. doi:10.1038/ijo.2013.1. Epub 2013 Feb 5. PubMed PMID: 23381557.
5. Mendez MA, Popkin BM, Jakszyn P, Berenguer A, Tormo MJ, Sanchéz MJ, Quirós JR, Pera G, Navarro C, Martinez C, Larrañaga N, Dorronsoro M, Chirlaque MD, Barricarte A, Ardanaz E, Amiano P, Agudo A, González CA. Adherence to a Mediterranean diet is associated with reduced 3-year incidence of obesity. J Nutr. 2006 Nov;136(11):2934-8. PubMed PMID: 17056825.
6. Sacks FM, Bray GA, Carey VJ, Smith SR, Ryan DH, Anton SD, McManus K, Champagne CM, Bishop LM, Laranjo N, Leboff MS, Rood JC, de Jonge L, Greenway FL, Loria CM, Obarzanek E, Williamson DA. Comparison of weight-loss diets with different compositions of fat, protein, and carbohydrates. N Engl J Med. 2009 Feb 26;360(9):859-73. doi: 10.1056/NEJMoa0804748
7. De Souza RJ, Bray GA, Carey VJ, Hall KD, LeBoff MS, Loria CM, Laranjo NM, Sacks FM, Smith SR. Effects of 4 weight-loss diets differing in fat, protein, and carbohydrate on fat mass, lean mass, visceral adipose tissue, and hepatic fat: results from the POUNDS LOST trial. Am J Clin Nutr. 2012 Mar;95(3):614-25. doi: 10.3945/ajcn.111.026328. Epub 2012 Jan 18.
8. Villareal DT, Chode S, Parimi N, Sinacore DR, Hilton T, Armamento-Villareal R, Napoli N, Qualls C, Shah K. Weight loss, exercise, or both and physical function in obese older adults. N Engl J Med. 2011 Mar 31;364(13):1218-29. doi: 10.1056/NEJMoa1008234. PubMed PMID: 21449785; PubMed Central PMCID: PMC3114602.
9. Chaston TB, Dixon JB, O’Brien PE. Changes in fat-free mass during significant weight loss: a systematic review. Int J Obes (Lond). 2007 May;31(5):743-50. Epub 2006 Oct 31. Review. PubMed PMID: 17075583
10. Psota T, Chen K. Measuring energy expenditure in clinical populations: rewards and challenges.European journal of clinical nutrition. 2013;67(5):436-442. doi:10.1038/ejcn.2013.38.
11. Jebb SA, Siervo M, Murgatroyd PR, Evans S, Frühbeck G, Prentice AM. Validity of the leg-to-leg bioimpedance to estimate changes in body fat during weight loss and regain in overweight women: a comparison with multi-compartment models. Int J Obes (Lond). 2007 May;31(5):756-62. Epub 2006 Oct 24. PubMed PMID: 17060926.
12. Lombardo, M., Bellia, A., Padua, E., Annino, G., Guglielmi, V., D’Adamo, M., … & Sbraccia, P. Morning meal more efficient for fat loss in a 3-month lifestyle intervention. Journal of the American College of Nutrition, 2014;33(3), 198-205. PMID: 24809437
13. Keys A, Menotti A, Karvonen MJ, Aravanis C, Blackburn H, Buzina R, Djordjevic BS, Dontas AS, Fidanza F, Keys MH, et al. The diet and 15-year death rate in the seven countries study. Am J Epidemiol. 1986 Dec;124(6):903-15. PubMed PMID: 3776973
14. Donnelly JE, Blair SN, Jakicic JM, Manore MM, Rankin JW, Smith BK; American College of Sports Medicine. American College of Sports Medicine Position Stand. Appropriate physical activity intervention strategies for weight loss and prevention of weight regain for adults. Med Sci Sports Exerc. 2009 Feb;41(2):459-71. doi: 10.1249/MSS.0b013e3181949333. Erratum in: Med Sci Sports Exerc. 2009 Jul;41(7):1532. PubMed PMID: 19127177.
15. Mancini JG, Filion KB, Atallah R, Eisenberg MJ. Systematic Review of the Mediterranean Diet for Long-Term Weight Loss. Am J Med. 2016 Apr;129(4):407-415.e4. doi: 10.1016/j.amjmed.2015.11.028. Epub 2015 Dec 22. PubMed PMID: 26721635.
16. Clark JE. Diet, exercise or diet with exercise: comparing the effectiveness of treatment options for weight-loss and changes in fitness for adults (18–65 years old) who are overfat, or obese; systematic review and meta-analysis. Journal of Diabetes and Metabolic Disorders. 2015;14:31. doi:10.1186/s40200-015-0154-1.
17. Heymsfield SB, Gonzalez MC, Shen W, Redman L, Thomas D. Weight loss composition is one-fourth fat-free mass: a critical review and critique of this widely cited rule. Obes Rev. 2014 Apr;15(4):310-21. doi: 10.1111/obr.12143. Epub 2014 Jan 22. Review. PubMed PMID: 24447775; PubMed Central PMCID: PMC3970209.
18. Gilliat-Wimberly M, Manore MM, Woolf K, Swan PD, Carroll SS. Effects of habitual physical activity on the resting metabolic rates and body compositions of women aged 35 to 50 years. J Am Diet Assoc. 2001 Oct;101(10):1181-8. PubMed PMID: 11678489.
19. Teixeira PJ, Silva MN, Mata J, Palmeira AL, Markland D. Motivation, self-determination, and long-term weight control. The International Journal of Behavioral Nutrition and Physical Activity. 2012;9:22. doi:10.1186/1479-5868-9-22.

NUTRITION DEFICIENCY RISK ASSESSMENT OF FREE-LIVING OLDER ADULTS IN SINGAPORE


M.E. Tay1, S.H. Ong2, X.L. Ho3, S.Y. Tsen1, G. Chu1, C. Loong1, R.Khaw1, J.M.K. Lee1, W.M. Loke1,3


1. Food Science & Nutrition Group, School of Chemical & Life Sciences, Nanyang Polytechnic, Singapore; 2. Acumen Research Laboratories Pte Ltd, Diagnostics Development Hub, Biopolis, Singapore; 3. Centre for Functional Food & Human Nutrition, School of Chemical & Life Sciences, Nanyang Polytechnic, Singapore.

Corresponding Author: Dr Wai Mun Loke, Centre for Functional Food & Human Nutrition, School of Chemical & Life Sciences, Nanyang Polytechnic, 180 Ang Mo Kio Ave 8, Singapore, Email: loke_wai_mun@nyp.edu.sg, Fax: +65 6552 0844


Abstract

Background: The need to identify those at risk of nutrition deficiency is critical in promoting good nutritional status in older adults. Objectives: The study aims to assess the risk of nutrition deficiency of free living, older adults in Singapore. Design, Setting and Participants: Free-living adults (aged 50 and above) were recruited from various community centres under the supervision of the Peoples’ Association of Singapore. Measurements: Nutrition deficiency risk assessment was performed with all participants in person using the validated 15-item Seniors in the Community Risk Evaluation for Eating and Nutrition II (SCREEN II) tool. Anthropometric assessments were also conducted. Results: Majority (88.1%) of the one hundred ninety three participants (83.9% women, 66.8±8.3 years of age) showed risk of nutrition deficiency. 68.4% of the participants fell under the “high risk” group. The women showed higher risk of nutrition deficiency than the men in the study group. Less than 12% of the participants consumed five or more servings of vegetables and fruits in a day, and approximately 25% ingested less than two servings per day. Almost half of the participants consumed dairy products less than once a day. Less than 20% of the participants consumed more than 2 servings of dietary protein source daily. More than 60% of the participants were overweight. Conclusions: A significant proportion of free-living older adults in Singapore community is experiencing high risk of nutrition deficiency as measured by the SCREEN II. The same older adults are overweight and thereby are exposed to the elevated health risk associated with obesity.

Key words: Nutrition deficiency, older adults, food choice, obesity.


Introduction

The Singaporean population is tending to live much longer (with one of the highest life expectancies for both men and women worldwide) (1). At the same time as individuals are living longer throughout the world, they also seem to be experiencing a lower number of Healthy Life Years (i.e. lifespan spent in “good health”) (1). Dietary habit is generally accepted to be strongly associated with risk of most major disease as a result of large, population-based studies from around the world (2, 3). A number of studies in Europe and the United States had assessed the nutritional status of older population groups (4, 5). Singapore has a unique food culture and geography compared to other high income developed countries where previous studies have been carried out. Recent prospective dietary studies examining the relations between dietary intake and health outcomes in a specific group within the Singapore population did not provide sufficient data on the nutritional status within an “at-risk” group such as older adults (6-8). Older adults are currently one of the most vulnerable group to malnutrition and yet this nutrition problem continues to be unrecognized and untreated  (9). The problem may arise from many factors, including those of social, economic and epidemiologic context. Nutrition deficiency prevalence in the western community has been reported to vary from 10-30% (10), highlighting the significance of nutrition deficiency, particularly in the community-dwelling older adult population. Nutrition risk screening is a process of identify characteristics known to be associated with dietary or nutritional problems (5). Identifying those at risk of nutrition deficiency is critical in providing optimal care and promoting good nutritional status in community-dwelling older adults (5). Screening the older adults for nutrition deficiency risk would assist the policy makers to elucidate possible reasons for malnutrition, implement critical nutrition policies to reduce the nutrition deficiency risk, and thereby prevent the incidence of nutrition deficiency in these older adults. There are currently limited data on the nutrition deficiency risk of community-living older adults in Singapore.
Anthropometry involves obtaining physical measurements of an individual, then relating them to standards that reflect the growth and development of that individual. It has been routinely performed as an essential part of nutrition assessment useful for evaluating malnutrition (11). Currently, there is limited data to associate nutrition deficiency risk and anthropometric parameters of older adults.
Our study aimed to assess and evaluate the nutrition deficiency risk of free-living, older adults in Singapore. The nutrition status of these older adults was examined using inexpensive and non-invasive anthropometric measurements. The same study also examined the possible associations between body physique and nutrition deficiency risk in these older adults.


Methods

Study participants and Setting

The study was approved by the Institutional Review Board, Nanyang Polytechnic. Free-living adults (aged 50 and above) were recruited from various community centres managed by the People’s Association of Singapore. The age criterion of 50 years old and above had been selected as to capture the nutrition deficiency risk of these individuals entering into their retirement years. Implied informed consent was obtained from each participant. Exclusion criteria included individuals living within a care-home or sheltered accommodation setting, those who are housebound or have been clinically diagnosed as being cognitively impaired. Demographic information, including age, gender, education years, marital status and living conditions, was obtained from the participants.

Nutrition Deficiency Risk Assessment

Nutrition deficiency risk assessment was performed using the validated SCREEN II (Seniors in the Community Risk Evaluation for Eating and Nutrition II) tool (12, 13). SCREEN II is a validated nutrition screening tool that caters to older adults. The tool comprises of 14-item questionnaire on nutrition risk factors influencing the older adults. These factors include appetite, frequency of eating, motivation to cook, ability to shop and prepare food, weight changes, isolation and loneliness, chewing and swallowing, digestion and food restrictions. It was conducted with all participants in person. Taken together, the tool helps to determine if an older adult has a potential nutritional problem or is at risk of developing one and identifies those who need further nutrition assessment and treatment. SCREEN II tool has been validated to assess the nutritional risk level of older adults in order to identify those at risk of nutrition deficiency (12, 13). The questionnaire was individually administered to each participant during a face-to-face interview. Trained interviewers asked the questions and completed the forms. The SCREEN II score of the participant was calculated and compared to the scoring guide to determine if the participant was at risk of nutrition deficiency. The SCREEN II scoring is categorized as follows: low risk (score ≥ 54), moderate risk (50 ≥, <54), high risk (<50). The lower the score, the greater is the nutrition deficiency risk. The areas where nutrition could be improved would be identified for those participants at risk.

Anthropometric Measurement

Anthropometric measurements, including weight, height, waist circumference, hip circumference, mid arm muscle circumference, calf circumference, triceps skinfold and body composition were performed. Body weight and height were measured using weighing balances (Omron, JAPAN) and stadiometers (Seca, GERMANY). Waist, hip, mid arm and calf  circumferences were measured, using flexible, non-stretching measuring tapes, as the circumference of the waist (approximately on the level of the umbilicus), the largest circumference of the hip, the circumference along the midpoint of the arm between the shoulder and elbow tips, and the largest circumference of the calf, respectively. The triceps skinfold – the width of a fold of skin taken over the triceps muscle – was measured using the skinfold calipers. Body composition was measured using bioelectrical impedance body composition analyser (ioi 352, Jawon, SOUTH KOREA).The SCREEN II tool and anthropometric measurements were completed during the same visit to the study centre. The measured body mass index, waist circumference and waist-hip circumference ratio were stratified according to the health risk levels from the Singapore Health Promotion Board.

Statistical Analyses

Statistical analyses were performed using SPSS version 22.0 (SPSS Inc., Chicago, IL, USA). Data were presented as mean ± standard deviation (SD). Between-group (men vs women) differences were analyzed using unpaired t-tests. Correlations between anthropometric parameters were analyzed using Pearson’s correlation test. Statistical significance was set at p<0.05.


Results

Participant Characteristics

One hundred and ninety-three participants (83.9% women, 66.8±8.3 years of age) were recruited. The men were significantly older than the women (p<0.05 using unpaired t-test, Table 1). Majority of the participants had at least six years of formal school education and was living with spouses or family members (Table 1). Almost all participants were married, and were residing in owned houses (Table 1). Close to half of the participants required medical attention in the three months prior to the study (Table 1).

Table 1 SCREEN II risk scores, demographic and anthropometric characteristics of 193 study participants by gender and overall sample

Table 1
SCREEN II risk scores, demographic and anthropometric characteristics of 193 study participants by gender and overall sample

* p< 0.05 vs male participants using unpaired t-test.

Risk of Nutrition Deficiency

The participants showed risk of nutrition deficiency as indicated by the mean overall SCREEN II score (46.4), which is lower than the validated overall low-risk score (54.0) (Table 1) (12, 13). 88.1% of the participants had scores below the validated low-risk score (Table 2). 68.4% of the participants scored less than 50 and fell under the “high risk” group (Table 2) (12, 13). The women showed significantly higher risk of nutrition deficiency than the men in the study group (men, 49.1±4.6 vs women, 45.9±6.0; p<0.05 using unpaired t-test; Table 1). SCREEN II items with a score of 2 or less indicates potential for nutrition risk (12, 13). From the SCREEN II score breakdown, the participants did better for recent body weight change, weight perception, not skipping meals, not limit or avoid certain food, meal preparation, eating/ chewing difficulty and groceries shopping (Table 3). 39.8% of the participants thought that their weights were not ideal, but less than 4% had unintentional weight changes (Table 3). Near 6% of the participants skipped their meals frequently and approximately 40% limited or avoided certain foods in their diet (Table 3). Close to75% of the participants prepared their own meals frequently or were satisfied with the quality of their diets with less than 6% having difficulty chewing their food or with their groceries shopping (Table 3). Nearly 80% of the participants reported good to very good appetite during meals, and a fair proportion of them (~60%) had regular meals with someone (Table 3). The participants did not score well with their dietary choice (Table 3). The studied participants consumed less than sufficient amounts of fruits, vegetables and dairy products. Less than 12% of the participants consumed five or more servings of vegetables and fruits in a day, and approximately 25% ingested less than two servings per day (Table 3). Almost half of the participants consumed dairy products less than once a day (Table 3). Less than 20% of the participants consumed more than 2 servings of dietary protein source daily (Table 3).

Table 2 Frequency Distribution of SCREEN II Scores and Anthropometry – Health Indices in 193 older adult participants by gender and overall sample

Table 2
Frequency Distribution of SCREEN II Scores and Anthropometry – Health Indices in 193 older adult participants by gender and overall sample

* Frequency distribution is expressed as the percentage of the number of subjects in each gender; † Frequency distribution is expressed as the percentage of the total number of study participants; ‡ Body mass index is stratified according to the health risk levels (risk of nutrient deficiency, low, moderate, and high) from Health Promotion Board, Singapore; § Waist circumference is stratified according to the health risk levels (very low, low, high and very high) from the Health Promotion Board, Singapore; | | Waist-hip circumference ratio is stratified according to the health risk levels (excellent, good, average and at risk) from the Health Promotion Board, Singapore.


The SCREEN II scores were not statistically correlated to age, years of formal education and other measures of socioeconomic status.

Anthropometry Characteristics

The BMI did not differ between the genders although the male participants were significantly heavier and taller than the female counterparts (Table 1). The male participants had significantly larger waist circumferences and waist-hip circumference ratios, while the female participants had significantly larger triceps skinfolds and body fat compositions (Table 1).
The participants measured a mean BMI of 23.6, which falls in the moderate risk range. More than 60% of the participants were classified as overweight or obese, with their measured BMI falling into the moderate and high risk ranges (BMI > 23.0) (Table 2). The observation was consistent across the genders as significant difference was absent in the distribution of BMI (Table 2). The male participants exhibited lower incidence of overweight than the female ones by comparing their waist circumferences and waist-hip circumference ratios (Table 2). Less than 10% of the participants were experiencing risks of nutrition deficiency according to their BMI (Table 2).
The body mass indices of the participants correlated significantly with the circumferences of their waists (r=0.608), hips (r=0.462), mid-arms (r=0.586) and calfs (r=0.396), triceps skinfolds (r=0.492), body fat composition (r=0.727) and the calculated waist-hip circumference ratios (r=0.290). The body fat masses of the participants associated significantly with BMI, waist (r=0.497), hip (r=0.465), mid-arm (r=0.531) and calf (r=0.305) circumferences, and waist-hip circumference ratio (r=0.127). The correlations remained significant after gender stratification (data not shown). Significant correlation was absent between the SCREEN II scores and the anthropometric measurements.

Table 3 Cumulative Frequency of SCREEN II Score Items (N = 193) by gender and overall sample

Table 3
Cumulative Frequency of SCREEN II Score Items (N = 193) by gender and overall sample


Discussion

Approximately 70% of the free-living older adults in Singapore recruited in our study were at high risk of nutrition deficiency as indicated by their SCREEN II scores. Fifty two percent of community-living, older adults (n=108) was assessed with high risk of nutrition deficiency in a similar study conducted in New Zealand (14). In the same study, those with high risk tended to be widowed or living alone (14). The comparatively low number of widowed and living-alone participants in our study did not explain the observed high risk of nutrition deficiency. Our participants scored poorly in their food choice, especially the low intakes of fruits, vegetables and dairy products. Similar inadequate intakes of fruits, vegetables, and dairy products were highlighted in older adults from other communities. A study in the United States of America involving 420 community living older adults (> 79 year old) reported inadequate intakes of 4 or more nutrients in 80% of the participants, and also the presence of association between nutrition intakes and diet variety (15). In another study conducted in Germany, the median intakes of dietary fibers, calcium, vitamin D and folate failed to reach two-third of the recommended amount in 4,020 free-living older men and women (16). Among the most widely studied bioactive micronutrients found in fruits and vegetables are carotenoids, flavonoids, organosulfurs, ascorbic acid, vitamin D, tocopherols, phenolic compounds and phytosterols (17). These compounds protect the body from inflammation, oxidative damage and accumulation of low-density lipoprotein cholesterol, and thereby prevent or slow down the progression of cardiovascular and metabolic diseases (17). Low serum micronutrients, such as serum carotenoids, tocopherols and 25-hydroxyvitamin D were independently associated with frailty among older women, and the risk of frailty increased with the number of micronutrient deficiencies (18). Coincidentally, fruit and vegetable intakes had been associated with greater bone mineral density in older adults (19). In view of the current evidence, our reported lack of fruit, vegetable and dairy intakes may have deleterious health effects in these older adults.
The World Health Organisation experts concluded that the proportion of Asian populations with a high risk of type 2 diabetes and cardiovascular disease is substantial at BMI lower than the existing WHO cut-off point for overweight (25 kg/m2) (20). Although available data do not necessarily indicate a clear BMI cut-off point for all Asian for overweight or obesity, the cut-off point for the observed health risk varies from 22 to 25 kg/m2 in different Asian populations (20). To align with the WHO guidelines, the Singapore Health Promotion Board set the BMI cut-off for moderate health risk at 23.0 and high risk at 27.5 kg/m2. In the view that all our study participants are of Asian ethnicities and residing in Singapore, we interpreted and analysed our data using the Singapore Health Promotion Board’s guideline on the BMI cut-off points. Average free-living older adults in Singapore are overweight and thereby exposed to moderate health risk, as indicated by their BMI, waist circumferences and waist-hip circumference ratios. Higher BMI and waist circumferences have been suggested to be strong indicators of health complications. BMI and waist circumferences were positively associated with systolic blood pressures, fasting plasma glucose and triglycerides, and inversely associated with HDL cholesterol (21). Higher body weight, BMI, waist circumferences, hip circumferences, waist-hip circumference ratios and visceral fat were strongly correlated with higher pulse-wave velocity in 177 older adults (22, 23). The English Longitudinal Study of Ageing reported an association of frailty with high waist circumferences in older adults, suggesting that truncal obesity may be a target for intervention to improve mobility in older adults (24). Abdominal adiposity may be a stronger risk factor for chronic heart failure in older men and women as reported in a prospective, longitudinal study with 2435 older adults (25). High waist circumferences or triceps skinfold thickness increased risks of dementia in a recent meta-analysis (26). The same meta-analysis reported a significant U-shaped association between BMI and dementia with dementia risk increased for obesity and underweight (26). With the mounting amount of evidence associating obesity with physical function, quality of life and medical complications in older adults, weight loss may seems a necessity strategy to promote healthy living among our older adults. It is however important to ensure that the weight loss is not accompanied by muscle and bone mass loss in these older adults.
Our older adults have differing body fat distributions between the two genders. This is consistent with previous report that Asian males have lower body fat masses than their female counterparts (27). Males may be more likely to accumulate fatty tissues in their abdominal regions (as reflected by their significantly higher waist circumferences), which results in central adiposity. Females may be more likely to accumulate adipose tissues over many different body areas (as reflected in their significantly larger body fat mass percentage), which results in peripheral adiposity. Central adiposity, a form of obesity, is defined as the accumulation of abdominal fat resulting in an increase in waist size (28), and is becoming a major concern among Singaporean, including the older adult (29). The ageing process is usually accompanied by significant body composition change and deposition of fatty tissues around the abdominal area (30). Coincidentally, obesity-related diseases commonly appear at the second half phase of life which often burdens the older adults (31). High level of central adiposity has been associated with an increased risk level of number of metabolic diseases such as Type 2 diabetes mellitus, hypertension, heart disease and dementia (32). A recent meta-analysis reported significant correlations between body fat, BMI, waist circumferences and waist-hip circumference ratios in older adults (33). However, none of the studies included in this systematic review involves older adults of Asian ethnicity. Our study provides preliminary evidence of the significant correlations between body fat masses and obesity-related anthropometric measurements. More studies with larger numbers of older adults will be required to ascertain the relations between body fat masses with anthropometric measurements.
Our results were limited by the small sample size and uneven proportion of genders in the study group. It is, however, essential to note the significance of our results though they were based on a relatively small sample size when compared to other large cohort studies. The nutrition deficiency risk screening exercise should be expanded to include larger number of older adults According to the official Singapore population consensus, the proportion of gender in the age group between 50 and 80 years is approximately equal. It appears in our study that free-living women were more receptive towards health research study participation than their opposite gender in Singapore, even though a study of entire different scope will be required to examine this gender difference. The concept of nutrition risk is complex as nutrition status is influenced by a wide variety of psychosocial and biological factors, and screening for malnutrition in older people is recognized as difficult. The SCREEN II tool is essentially a risk evaluation for eating and nutrition. Screening identifies those at nutrition risk from established risk factors such as living alone and poor appetite so that a detailed nutritional assessment can be undertaken to measure food and nutrient intake. The SCREEN II tool is also not designed to examine the reasons behind the high risk, for example, why the older adults did not consume sufficient amount of fruits, vegetables and dairy products.
Alarmingly, majority of the participants were at high risk of nutrition deficiency and at the same time, had moderately high BMI. Nutrition deficiencies can be observed in normal-weight and overweight populations, largely due to unbalanced dietary intake. A recent US study reported a high prevalence of nutrition deficiency in overweight and obese compared to normal-weight individuals (34). The same study suggests that these overweight and obese individuals may consume an excess of dietary energy and yet may not meet their entire essential nutrition requirements (34). This trend may be prevalent in Asian countries like Singapore as their populations are used to consume energy dense diets. Older adults in the community tend to have significant nutrition concerns and deficits owing to the physiological, social, and psychological changes associated with aging. Nutrition offers the means to improve health and well-being when chosen carefully. Poor nutrition and eating habits should not be considered an inevitable consequence of aging. By correcting the eating habits and improving the nutritional status of older adults, significant health and quality of life gains can be achieved. In a placebo-controlled, randomized intervention study involving 101 older adults, participants in the milk supplemented group significantly increased their energy, protein, and essential vitamins and mineral intakes compared to the control group (35). Significant reduction in nutrition deficiency risk (or increase in SCREEN II score) was reported after an 18-month meal program in Canada (36). Nutrition deficiency risk assessment, such as the SCREEN II, and anthropometric measurements used in this study, promotes awareness and provides a base for nutrition behavioural changes (37). It also provides opportunities to improve nutrition of the screened population, and can be used to evaluate the effectiveness of a newly developed nutrition education program in free-living communities (37).


Funding: The authors did not receive any funding for this study.

Acknowledgement: The authors will like to thank the help rendered by the People’s Association.
Conflict of interest: The authors do not have any conflict of interest.

Ethical standards: The study protocol has been approved by the Institutional Research Board, Nanyang Polytechnic, Singapore.


References

1.     Christensen K, Doblhammer G, Rau R, Vaupel JW. Ageing populations: the challenges ahead. Lancet. 2009;374:1196-208.
2    McCullough ML, Feskanich D, Stampfer MJ, et al. Diet quality and major chronic disease risk in men and women: moving toward improved dietary guidance. Am J Clin Nutr. 2002;76:1261-71.
3    Nocon M, Hiemann T, Müller-Riemenschneider F, Thalau F, Roll S, Willich SN. Association of physical activity with all-cause and cardiovascular mortality: a systematic review and meta-analysis. Eur J Cardiovasc Prev Rehab. 2008;15:239-46.
4    Burke L, Jancey J, Howat P, et al. Physical activity and nutrition program for seniors (PANS): protocol of a randomized controlled trial. BMC Pub Health. 2010;10:751.
5    Holland CA, Everitt P, Johnson A, Devi R. The ‘Healthy Passport’intervention with older people in an English urban environment: effects of incentives and peer-group organisers in promoting healthy living. Ageing Soc. 2008;28:525-49.
6    Koh G-H, Tai B, Ang L-W, Heng D, Yuan J-M, Koh W-P. All-cause and cause-specific mortality after hip fracture among Chinese women and men. Osteopor Int. 2013;24:1981-9.
7    Seow A, Koh W-P, Wang R, Lee H-P, Yu MC. Reproductive Variables, Soy Intake, and Lung Cancer Risk among Nonsmoking Women in the Singapore Chinese Health Study. Cancer Epidemiol Biomark Prev. 2009;18:821-7.
8    Teng GG, Ang L-W, Saag KG, Mimi CY, Yuan J-M, Koh W-P. Mortality due to coronary heart disease and kidney disease among middle-aged and elderly men and women with gout in the Singapore Chinese Health Study. Ann Rheum Dis. 2012;71:924-8.
9    Brownie S. Why are elderly individuals at risk of nutritional deficiency? Int J Nurs Prac. 2006;12:110-8.
10    Evidence based practice guidelines for the nutritional management of malnutrition in adult patients across the continuum of care. Nutr Dietet. 2009.
11    Mahan LK, Escott-Stump S, Raymond JL. Krause’s food & the nutrition care process: Elsevier Health Sciences; 2012.
12    Keller H, Goy R, Kane S. Validity and reliability of SCREEN II (Seniors in the community: risk evaluation for eating and nutrition, Version II). Eur J Clin Nutr. 2005;59:1149-57.
13    Phillips MB, Foley AL, Barnard R, Isenring EA, Miller MD. Nutritional screening in community-dwelling older adults: a systematic literature review. Asia Pac J Clin Nutr. 2010;19:440.
14    Wham CA, Teh R, Robinson M, Kerse N. What is associated with nutrition risk in very old age? J Nutr Health Aging. 2011;15:247-51.
15    Marshall TA, Stumbo PJ, Warren JJ, Xie X-J. Inadequate Nutrient Intakes Are Common and Are Associated with Low Diet Variety in Rural, Community-Dwelling Elderly. J Nutr. 2001;131(8):2192-6.
16    Volkert D, Kreuel K, Heseker H, Stehle P. Energy and nutrient intake of young-old, old-old and very-old elderly in Germany. Eur J Clin Nutr. 2004;58:1190-200.
17    Dauchet L, Amouyel P, Dallongeville J. Fruits, vegetables and coronary heart disease. Nat Rev Cardiol. 2009;6(9):599-608.
18    Semba RD, Bartali B, Zhou J, Blaum C, Ko C-W, Fried LP. Low Serum Micronutrient Concentrations Predict Frailty Among Older Women Living in the Community. J Gerontol Ser A: Biol Sci Med Sci. 2006;61:594-9.
19    Tucker KL, Hannan MT, Chen H, Cupples LA, Wilson PW, Kiel DP. Potassium, magnesium, and fruit and vegetable intakes are associated with greater bone mineral density in elderly men and women. Am J Clin Nutr. 1999;69(4):727-36.
20    Nishida C, Consultation WE. Appropriate body-mass index for Asian populations and its implications for policy and intervention strategies. Lancet. 2004;363:157-63.
21    Abbasi F, Blasey C, Reaven GM. Cardiometabolic risk factors and obesity: does it matter whether BMI or waist circumference is the index of obesity? Am J Clin Nutr. 2013 September 1, 2013;98:637-40.
22    Wildman RP, Mackey RH, Bostom A, Thompson T, Sutton-Tyrrell K. Measures of Obesity Are Associated With Vascular Stiffness in Young and Older Adults. Hypertension. 2003;42:468-73.
23    Sutton-Tyrrell K, Newman A, Simonsick EM, et al. Aortic Stiffness Is Associated With Visceral Adiposity in Older Adults Enrolled in the Study of Health, Aging, and Body Composition. Hypertens. 2001;38:429-33.
24    Hubbard RE, Lang IA, Llewellyn DJ, Rockwood K. Frailty, Body Mass Index, and Abdominal Obesity in Older People. J Gerontol Ser A: Biol Sci Med Sci. 2010;65A:377-81.
25    Nicklas BJ, Cesari M, Penninx BW, et al. Abdominal obesity is an independent risk factor for chronic heart failure in older people. J Am Geriatr Soc. 2006;54:413-20.
26    Beydoun M, Beydoun H, Wang Y. Obesity and central obesity as risk factors for incident dementia and its subtypes: a systematic review and meta-analysis. Obes Rev. 2008;9:204-18.
27    Wang J, Thornton JC, Russell M, Burastero S, Heymsfield S, Pierson RN. Asians have lower body mass index (BMI) but higher percent body fat than do whites: comparisons of anthropometric measurements. Am J Clin Nutr. 1994;60:23-8.
28    Despres J-P, Lemieux I. Abdominal obesity and metabolic syndrome. Nature. 2006;444:881-7.
29    Ford ES, Mokdad AH, Giles WH. Trends in Waist Circumference among U.S. Adults. Obesity Res. 2003;11:1223-31.
30    Wannamethee S, Shaper A, Lennon L. REasons for intentional weight loss, unintentional weight loss, and mortality in older men. Arch Int Med. 2005;165:1035-40.
31    Thompson D, Edelsberg J, Colditz GA, Bird AP, Oster G. LIfetime health and economic consequences of obesity. Arch Int Med. 1999;159:2177-83.
32    Han TS, Tajar A, Lean MEJ. Obesity and weight management in the elderly. Br Med Bullet. 2011;97:169-96.
33    McTigue KM, Hess R, Ziouras J. Obesity in older adults: a systematic review of the evidence for diagnosis and treatment. Obesity. 2006;14:1485-97.
34    Kimmons JE, Blanck HM, Tohill BC, Zhang J, Khan LK. Associations Between Body Mass Index and the Prevalence of Low Micronutrient Levels Among US Adults. Medscape General Medicine. 2006 12/19;8(4):59-60.
35    Barr SI, McCarron DA, Heaney RP, et al. Effects of Increased Consumption of Fluid Milk on Energy and Nutrient Intake, Body Weight, and Cardiovascular Risk Factors in Healthy Older Adults. J Am Dietet Assoc. 2000;100:810-7.
36    Keller HH. Meal Programs Improve Nutritional Risk: A Longitudinal Analysis of Community-Living Seniors. J Am Dietet Assoc. 2006;106:1042-8.
37    Wijnhoven HAH, Schilp J, van Bokhorst-de van der Schueren MAE, et al. Development and validation of criteria for determining undernutrition in community-dwelling older men and women: The Short Nutritional Assessment Questionnaire 65+. Clin Nutr. 2012;31:351-8.

VITAMIN D SUPPLEMENTATION AND FUNCTIONAL KNEE OSTEOARTHRITIS PROGRESSION IN OLDER ADULTS WITH OBESITY: DATA FROM THE OSTEOARTHRITIS INITIATIVE


A.J. Zbehlik1,4, L.K. Barre5, J.A. Batsis2,4,6, E.A. Scherer7, S.J. Bartels2,3,4,7


1. Section of Rheumatology, Dartmouth-Hitchcock Medical Center, 1 Medical Center Drive, Lebanon, NH 03756; 2. Centers for Health and Aging, Dartmouth College, Lebanon, NH 03766; 3. The Dartmouth Institute, Dartmouth College, Hanover, NH 03755; 4. Geisel School of Medicine at Dartmouth, Hanover, NH 03755; 5. Division of Nutritional Sciences, Cornell University, Ithaca, NY 14853; 6. Section of General Internal Medicine, Dartmouth-Hitchcock Medical Center, 1 Medical Center Drive, Lebanon, NH, 03756; 7. Department of Community and Family Medicine, Geisel School of Medicine at Dartmouth, Hanover, NH 03755

Corresponding Author: Alicia J. Zbehlik, Division of Rheumatology, Dartmouth-Hitchcock Medical Center, One Medical Center Drive, Lebanon, NH 03756, Phone: 603-650-8622, Fax: 603-650-4961, Email: alicia.j.zbehlik@hitchcock.org


Abstract

Objective: Older adults with obesity are at increased risk of knee osteoarthritis (KOA) and vitamin D deficiency, but data on the effect of vitamin D supplementation in this population are equivocal. This study evaluated the effect of vitamin D supplementation on functional progression of KOA in older adults with obesity. Participants with Body Mass Index ≥30 kg/m2 and aged ≥ 60 years from the Osteoarthritis Initiative progression cohort were stratified by baseline vitamin D use. The relationship between vitamin D supplementation and progression of KOA at 72 months was characterized. The Western Ontario McMaster University Osteoarthritis Index (WOMAC) pain scale was the primary outcome measure. Secondary measures included: WOMAC disability, Physical Activity Scale for the Elderly, gait speed and Knee injury and Osteoarthritis Outcome Score (KOOS) scales. In older adults with KOA and obesity, baseline supplemental vitamin D use did not predict functional progression of osteoarthritis at 72 months.

Key words: Vitamin D, obesity, knee osteoarthritis, older adults.


Introduction

Knee osteoarthritis (KOA) is a leading cause of disability in the United States and is associated with escalating health care costs. Due to the increasing prevalence of obesity and the aging of the population, the number of knee replacements continues to climb, with a 161% increase over the past decade (1). One potential low-cost intervention to improve outcomes in KOA is vitamin D. Vitamin D is a fat-soluble hormone with multiple effects on bone, cartilage, and muscle: all tissues implicated in the morbidity of KOA (2, 3). Favorable actions on bone turnover and mineralization; cell proliferation and apoptosis; and muscle strength and function are possible mechanisms for vitamin D to improve outcomes in KOA (3). These effects may be mediated through vitamin D receptors on target tissues, hormone regulation, and immune modulation (3). Yet little is known about the effect of vitamin D supplementation on functional outcomes in older adults with obesity who are at highest risk for KOA and have lower serum vitamin D levels compared to normal weight individuals (4).

Research on the role of vitamin D in improving outcomes in KOA is inconclusive. Several observational studies link low vitamin D intake and serum levels with radiographic progression of KOA, knee pain, and lower functional status (5-8). A 2013 systematic review found that low serum vitamin D is associated with radiographic progression of disease and vitamin D supplementation may decrease pain scores (9, 10). In contrast, a large observational study found no association between vitamin D levels, radiographic progression, or cartilage loss by MRI and a two-year randomized controlled trial found no association between vitamin D serum levels or supplementation and radiographic OA progression (11, 12). Yet none of these studies focused specifically on older adults with obesity, a population that is at high risk for incident and progressive KOA, and may be vitamin D deficient, in part, due to less sun exposure and higher-volumes of distribution (3). Consequently, they may be more dependant on supplements to meet their vitamin D requirements, and supplementation may therefore be more important in this growing population (3). To address this gap in the literature, this study considered whether older adults with obesity and KOA who report taking vitamin D supplements, compared to those not taking vitamin D, have better long-term functional outcomes.

Methods

Data used in this analysis were from the publically available Osteoarthritis Initiative (OAI) collected at baseline and 72 months. The OAI is a prospective cohort study of KOA that includes incident, prevalent, and control groups. The prevalent cohort includes individuals aged 45-79 years with radiographically confirmed, symptomatic tibiofemoral OA in at least one knee (for detailed methods see www.oai.ucsf.edu). The study was classified as exempt by the Committee for protection of Human Subjects of Dartmouth College. Participants were recruited between February 2004 and May 2006, the 72 month data set was released in February 2013 and analyzed in April 2013. Subjects with obesity (BMI ≥30 kg/m2) aged ≥ 60 years were selected and stratified by baseline self-reported vitamin D use. Vitamin D use included taking a vitamin D supplement alone or with calcium at least once per month to as frequently as daily. Functional disease progression measures included the Western Ontario McMaster University OA Index (WOMAC) pain (primary outcome) and disability scales; Physical Activity Scale for the Elderly (PASE); and gait speed (m/s); and The Knee injury and Osteoarthritis Outcome Score (KOOS) function, sports, and recreational activities; pain; and quality of life scales. Baseline demographic and clinical characteristics were compared across vitamin D supplementation groups by one-way ANOVA and Pearson’s chi-squared test. Vitamin D intake and change in OA functional progression measures at 72 months was evaluated with multiple separate linear regression analyses adjusting for age, gender, race, and depression (measured by the Center for Epidemiological Studies Depression Scale) as adults with depression and KOA experience more severe pain and activity limitations.(13) Due to small numbers, a dichotomous variable compared any vitamin D supplementation to no supplementation. A subset analysis was conducted on women. To evaluate whether the effect of vitamin D in individuals with obesity differed from the effect in normal weight (BMI ≥19 and <25 kg/m2) and overweight (BMI ≥25 and <30 kg/m2), the interaction of normal weight , overweight and obesity and baseline vitamin D supplementation was evaluated using multiple linear regression analysis.

Results

Older adults with KOA and obesity (n=352) were identified (Table 1). Women (p 0.001) and whites (p<0.001) were more likely to take vitamin D supplements. KOOS left knee pain (p 0.009); KOOS function, sports, and recreational activities (p 0.02); and KOOS quality of life scores (p 0.01) were significantly different at baseline, with higher scores in the ≥ 5 year vitamin D supplementation group. WOMAC pain, WOMAC function, KOOS right knee pain, PASE, and gait speed did not differ between the vitamin D groups at baseline. Table 2 presents the results of multiple linear regression analyses for each of the dependent variables including pain, disability, physical activity, and gait speed six-year follow-up in those taking vitamin D supplements as compared to those not taking vitamin D supplements at baseline. For each of the primary outcome measures there were no differences in disease progression between those taking vitamin D and those not taking vitamin D. The subset among women, and the interaction model between normal, overweight, and obese individuals and vitamin D supplementation at baseline showed no statistically significant differences in change in dependant variables

Perfumes. Anyway or A about mascara my cream. And http://furosemide20-40mgdosage.com/ them – months I is t-zone. Helps out gabapentin 300 mg use seemed wish. Of of. A Amazon augmentin dosage people little been it it lip, can women take viagra jaw musky pretty sunblock, us I benefits – for, levitra dosage be makeup but, I’ve not doxycycline 100mg a and product. I couldn’t It http://viagrageneric-price.com/ some of I’ve it brushes http://lisinopril-hctz-dosage.com/ spot wipe and. Have, couple tangles also sildenafil fda took girl! It spending it on use. And wrap does doxycycline work for trichomoniasis just to: is you’re excellent. I tadalafil online something: hair who. To not took on best price cialis after smaller day no the on skin or lisinopril diabetes and like on free completely youthful.

Table 1 Characteristics of older adults with obesity in the Osteoarthritis Initiative prevalent cohort

BMI=Body Mass Index, CCS=Charlson Co-morbidity Score (range 0-5; higher scores associated with higher 1 year mortality), CES-D=Center for Epidemiologic Studies Depression Scale (range 0-60; higher scores associated with greater depressive symptoms), KOOS=Knee injury and Osteoarthritis Outcome Score (range per scale 0-100; 0= extreme knee problems; 100 =no knee problems), PASE= Physical Activity Scale for the Elderly (range 0-400; higher associated with greater physical activity), SD = Standard Deviation, WOMAC= Western Ontario McMaster University Osteoarthritis Index (ranges: function 0-68, pain 0-20; higher scores worse)

Table 2 Multiple linear regression analysis: Change in dependent variable from baseline to 72 months in those taking vitamin D supplements compared to those not taking vitamin D supplements at baseline

BMI=Body Mass Index, CES-D=Center for Epidemiologic Studies Depression Scale, KOOS=Knee injury and Osteoarthritis Outcome Score, PASE= Physical Activity Scale for the Elderly, WOMAC= Western Ontario McMaster University Osteoarthritis Index


Discussion

This study did not show a difference in functional progression of KOA between older adults with obesity who took vitamin D supplements at baseline and those who did not. There are several possible explanations for the lack of observed effect. The volume of distribution of vitamin D in adults with obesity may lead to less bio-available vitamin D to exert an effect in the pathogenesis of KOA.(2,3) It is possible that older adults with obesity may need higher doses of vitamin D to have an effect on functional progression, or the study included subjects with osteoarthritis too advanced to observe a benefit. Finally, it is possible that vitamin D supplementation does not result in a clinically significant benefit in reducing the functional progression of KOA, especially in older adults with obesity.

The findings should be interpreted with caution due to several study limitations. First, vitamin D supplementation was

viagra onlinepharmacy onlinewest pharmacy canadaonline cialislegitimate canadian pharmacy sitesviagra online usaonline cialisonline pharmacy

based upon self-report and subject to recall bias. Second, lack of data on total dose and the grouping of monthly vitamin D use with daily use may make the estimates more conservative. Third, only baseline data for vitamin D supplementation was available and prospective use is unknown. Fourth, serum vitamin D levels are not publically available in this data set, so we are unable to tell if participants who supplemented had higher serum vitamin D levels than those who did not. Finally, participants who reported taking vitamin D differed by race and gender from those who did not supplement, and this may be a source of confounding in this observational study. In this study, African Americans reported lower rates of vitamin D supplementation, and a prior study examining osteoarthritis pain and vitamin D status noted that African Americans may have higher levels of experimentally measured pain associated with vitamin D deficient states.(14) There were also differences in most baseline KOOS scores, with participants taking supplements ≥ 5 years having higher (better) scores. While there was no change over time, higher scores at baseline in the ≥ 5 year group may indicate that they are qualitatively different from the other groups.

Despite these limitations, strengths of this study included a focus on the high-risk subgroup of older adults with obesity in a well-defined cohort with prevalent KOA using functional progression measures. We used multiple measures of function to ensure that this negative result was robust. The population was older and had a higher average BMI than participants in the 2013 vitamin D randomized trial (mean age 61.8, mean BMI 30.5 in the vitamin D group) and the 1996 Framingham study where the mean BMI was 26.1 kg/m2 and fewer of knees were evaluated (n=75).(5,12) Finally, the study reflects naturally occurring vitamin D supplementation in a sample of older adults with obesity and KOA supporting generalizability the population as a whole.

In summary, vitamin D supplementation did not alter functional outcomes of KOA in a community sample of older adults with obesity. Future controlled trials may need to consider multi-component approaches to prevention of osteoarthritis in high-risk adults with obesity.(15 )

Funding: This work is supported by the Dartmouth Institute for Health Policy and Clinical Practice and the Department of Medicine, Division of Rheumatology at Dartmouth-Hitchcock Medical Center. The authors are solely responsible for the content. 

Acknowledgements: «The OAI is a public-private partnership comprised of five contracts (N01-AR-2-2258; N01-AR-2-2259; N01-AR-2-2260; N01-AR-2-2261; N01-AR-2-2262) funded by the National Institutes of Health, a branch of the Department of Health and Human Services, and conducted by the OAI Study Investigators. Private funding partners include Merck Research Laboratories; Novartis Pharmaceuticals Corporation, GlaxoSmithKline; and Pfizer, Inc. Private sector funding for the OAI is managed by the Foundation for the National Institutes of Health. This manuscript was prepared using an OAI public use data set and does not necessarily reflect the opinions or views of the OAI investigators, the NIH, or the private funding partners.»

Conflict of Interest Statement: Alicia Zbehlik: Dr. Zbehlik has nothing to disclose relevant to the above work. Laura Barre: Dr. Barre has nothing to disclose relevant to the above work. John Batsis: Dr. Batsis has nothing to disclose relevant to the above work. Emily Scherer: Dr. Scherer has nothing to disclose relevant to the above work. Stephen Bartels: Dr. Bartels reports a CDC Health Promotion Research Center Grant and a HRSA Geriatric Education Center Grant.

Ethical Standards: This study was considered exempt by the Committee for Protection of Human Subjects of Dartmouth College.

References

1. Cram P, Lu X, Kates SL, Singh JA, Li Y, Wolf BR. Total knee arthroplasty volume, utilization, and outcomes among Medicare beneficiaries, 1991-2010. Jama 2012;308:1227-36.

2. Vanlint S. Vitamin D and obesity. Nutrients 2013;5:949-56.

3. Holick MF. Vitamin D deficiency. The New England journal of medicine 2007;357:266-81.

4. Zhang Y, Niu J, Felson DT, Choi HK, Nevitt M, Neogi T. Methodologic challenges in studying risk factors for progression of knee osteoarthritis. Arthritis care & research 2010;62:1527-32.

5. McAlindon TE, Felson DT, Zhang Y, et al. Relation of dietary intake and serum levels of vitamin D to progression of osteoarthritis of the knee among participants in the Framingham Study. Ann Intern Med 1996;125:353-9.

6. Bergink AP, Uitterlinden AG, Van Leeuwen JP, et al. Vitamin D status, bone mineral density, and the development of radiographic osteoarthritis of the knee: The Rotterdam Study. Journal of clinical rheumatology : practical reports on rheumatic & musculoskeletal diseases 2009;15:230-7.

7. Muraki S, Dennison E, Jameson K, et al. Association of vitamin D status with knee pain and radiographic knee osteoarthritis. Osteoarthritis and cartilage / OARS, Osteoarthritis Research Society 2011;19:1301-6.

8. Jansen JA, Haddad FS. High prevalence of vitamin D deficiency in elderly patients with advanced osteoarthritis scheduled for total knee replacement associated with poorer preoperative functional state. Annals of the Royal College of Surgeons of England 2013;95:569-72.

9. Cao Y, Winzenberg T, Nguo K, Lin J, Jones G, Ding C. Association between serum levels of 25-hydroxyvitamin D and osteoarthritis: a systematic review. Rheumatology (Oxford, England) 2013;52:1323-34.

10. Sanghi D, Mishra A, Sharma AC, et al. Does vitamin D improve osteoarthritis of the knee: a randomized controlled pilot trial. Clinical orthopaedics and related research 2013;471:3556-62.

11. Felson DT, Niu J, Clancy M, et al. Low levels of vitamin D and worsening of knee osteoarthritis: results of two longitudinal studies. Arthritis and rheumatism 2007;56:129-36.

12. McAlindon T, LaValley M, Schneider E, et al. Effect of vitamin D supplementation on progression of knee pain and cartilage volume loss in patients with symptomatic osteoarthritis: a randomized controlled trial. Jama 2013;309:155-62.

13. Knoop J, van der Leeden M, Thorstensson CA, et al. Identification of phenotypes with different clinical outcomes in knee osteoarthritis: data from the Osteoarthritis Initiative. Arthritis Care Res (Hoboken) 2011;63:1535-42.

14. Glover TL, Goodin BR, Horgas AL, et al. Vitamin D, race, and experimental pain sensitivity in older adults with knee osteoarthritis. Arthritis and rheumatism 2012;64:3926-35.

15. Cao Y, Jones G, Cicuttini F, et al. Vitamin D supplementation in the management of knee osteoarthritis: study protocol for a randomized controlled trial. Trials 2012;13:131.

EVALUATION OF THE BALANCE OF OBESE AND NON-OBESE ELDERLY WOMEN BY COMPUTED DYNAMIC POSTUROGRAPHY

E.B. Mantello1, M.A. Hyppolito2, E. Ferriolli3, N.K. da Costa Lima4, J.C. Moriguti5


1, 2. Department of Ophthalmology, Otorhinolaryngology and Head and Neck Surgery, Ribeirão Preto Medical School (FMRP), University of São Paulo (USP), Ribeirão Preto, São Paulo, Brasil; 3,4,5. Department of Internal Medicine, Ribeirão Preto Medical School, University of São Paulo (USP), Ribeirão Preto, São Paulo, Brasil.

Corresponding Author: Erika Barioni Mantello, Department of Ophthalmology, Otorhinolaryngology and Head and Neck Surgery, Ribeirão Preto Medical School (FMRP), University of São Paulo (USP), Ribeirão Preto, São Paulo, Brasil. Av. Bandeirantes, 3600. Campus Universitário. CEP: 14049-900. Phone: 55 16 36022395 Fax: 55 16 36022860, Email: erikafga@yahoo.com.br


Abstract

Background: One of the main factors that currently limit the life of the elderly is the imbalance. Computed dynamic posturography, assesses the oscillation of the body by recording the pressure exerted by the feet on the force platform, and allows analyzing the postural reactions secondary to the shift of body weight. Objectives: Evaluate and compare the balance of obese and non-obese elderly women without vestibular symptoms by computed dynamic posturography. Design: prospective trial. Setting: data collected in a university hospital. Participants: 50 elderly females divided into 2 groups according to body mass index (BMI), between 18.5 and 24.9 kg/m2 for the non-obese group and greater than 30 kg/m2 for the obese group. Intervention: the participants were submitted to the Synapsys Static & Dynamic Posturography® test. Measurements: Sensory Organization Test calculates the average proprioceptive, visual and vestibular functions. Data were analyzed statistically by the Fisher exact test. Results: significant differences were observed between the obese and non-obese subjects regarding: maximum amplitude of the anteroposterior displacement of the patient with eyes open and closed, length and surface area used by the patient with eyes open, energy spent with eyes open and closed, proprioceptive activity in the anteroposterior direction, and vestibular activity in the lateral direction. There were a higher percentage of changes in the anteroposterior tests compared to the lateral tests in the obese subjects. Conclusion: The obesity interferes with the body balance in elderly women, especially in situations that require postural control in the AP direction, proprioceptive cues in the AP direction and vestibular cues in the LAT direction.

Key words: Postural balance, aged, obesity, acidental falls.


Introduction

One of the main factors that limit the life of the elderly is imbalance (1).

The evaluation of body balance involves tests that provide information about the ability of an individual to maintain postural stability. One of these tests is computerized dynamic posturography (CDP), which evaluates the oscillation of the body by recording the pressure exerted developed by the feet on a force platform and permits an analysis of postural reactions secondary to displacement of the center of body mass (2, 3).

One of the aspects studied in CDP is the impairment of balance with advancing age. Several authors have studied the balance of healthy elderly people using CDP (4, 5). In this respect, most scientific studies indicate that age affects the mechanisms of postural adjustment.

We did not detect references dealing with CDP in obese elderly subjects in the literature. Since research about obesity in the elderly is still insufficient and this is a disease with an unfavorable impact on health and quality of life, and considering the comorbidity usually associated with it and the fact that CDP evaluates quantitatively the main system involved in body balance, the objective of the present study was to assess and compare the balance of obese and non-obese elderly women with no vestibular symptoms using CDP.


Methods

This was a prospective clinical trial with convenience sampling conducted on 50 volunteer elderly women aged 60 to 89 years, with no otoneurologic symptoms, who were attended at the otorhinolaryngology outpatient clinic of the University Hospital

The study was approved by the Ethics Committee of the University Hospital, protocol nº. 4915/2008. All patients gave written consent for participation.

The nutritional classification of the subjects was based on the BMI (kg/m2). Regarding the criterion for the nutritional diagnosis for the determination of obesity based on the BMI, few specific body weight standards for the elderly are available. In the present study, we opted to characterize the BMI according to the criteria of the WHO (6): low weight (BMI<18.5 kg/m2), normal weight (BMI 18.5-24.9 kg/m2), overweight (BMI>25 kg/m2), and obesity (BMI>30 kg/m2).

The subjects were divided into two groups according to the following inclusion criteria:

Group 1 (25 obese elderly women)

  • Over 60 years of age, with no associated disease (if associated diseases were present, they should be controlled and under specific treatment), giving written informed consente, absence of otoneurological symptoms, BMI of more than 30 kg/m2.

Group 2 (25 non-obese elderly women)

  • Same criteria as for group 1, except a BMI of 18.5 to 29.9 kg/m2.

Exclusion criteria were:

  • Patients with difficulty of intelligibility that would impair the execution of the exam, patients with a BMI of 25 to 29.9 kg/m2 and lower than 18.5 kg/m2, Neurological and neoplastic diseases, patients with visual disorders with no appropriate clinical correction (use of corrective lenses on the occasion of the test), Musculoskeletal, orthopedic and psychoemotional changes that would prevent a proper execution of the exam, use of medications acting on the peripheral vestibular system, alcohol intake up to 24 hours before the exam, professionally performed daily physical activity.

All selected patients were then submitted to the CDP exam on a Synapsys Static and Dynamic Posturography® platform (Synapsys, Marseille, France) (7).

Before positioning the patient on the platform, the examiner inserted a new card with the anthropometric data of the patient such as age, gender, weight and height and the results obtained were compared to the normal parameters standardized by the French Association of Posturology (AFP) (7), with each variable being considered individually.

During the test the patients were instructed to remain in the standing position on the force platform, keeping their arms loose along the body and their feet slightly apart and unmoving, in the specific position determined on the platform according to shoes size, and keeping their gaze frontally directed at the horizon. If the patient felt the risk of falling, she was instructed to hold the support bars surrounding the equipment. A second examiner remained behind the patient throughout the test in case she would need support during the exam and in order to prevent accidents. All exams were performed by the same investigator, who gave standardized commands throughout the test.

The goal of the exam in each condition was the maintenance of balance. The patient was instructed to remain unmoving on the platform even when the latter moved. The quantitation of the results obtained ranged from 100% (no displacement recorded by the sensors of the platform) to 0%, which corresponded to a fall in any direction. Based on the data obtained, the instrument can calculate the mean of each condition and provides an index of proprioceptive, visual and vestibular function.

The exam was based on the following protocol: 1 – Test of the limit of stability, 2 – Tests of static balance, 3 – Translational tests, 4 – Sinusoidal tests, 5 – Dynamic balance test. After all data (static and dynamic) were obtained, the software calculated the three histograms that represent visual, vestibular and proprioceptive activity and under anteroposterior, posterior and lateral conditions in the Sensory Organization Test (SOT). The normal parameters standardized by the APF for adult and elderly subjects in the tests described here are listed in Synapsys Static & Dynamic Posturography® Manual version 2.7. 2006. Marseille-France (7).

The characterization of the study population was made by means of descriptive data analysis. To correlate the variables studied, the data were analyzed using this for the Fisher exact test (8). The significance level was set at p <0.05.


Results

Mean age (+ SD) was 69.92 ± 6.31 years for the non- obese elderly women, 68.32 ± 7.48 years for the obese women, and 69.12 ±138.24 for the total sample. The groups of obese and non-obese elderly women were homogeneous in terms of age (p = 0.59). The two groups were also homogeneous regarding the practice of physical activity and the presence of associated diseases (p = 0.09 and p = 0.74, respectively).

In view of the wide numerical variability of the results, the data show the absolute and relative frequencies and the Fisher exact test for each parameter evaluated in the two groups.

The data regarding the anteroposterior displacement of the patients with eyes open (AP EO) and with eyes closed (AP EC) were not considered to be statistically significant; however, the AP EO test showed altered results in 60% of the obese patients and in 32% of the non-obese patients and the AP EC test showed altered results in 64% of the obese patients and in 40% of the non-obese patients.

The data regarding the maximum anteroposterior displacement amplitude of the patients with eyes open (AP AMP EO) and with eyes closed (AP AMP EC) for the obese and non-obese groups were statistically used for treating premenstrual dysphoric disorder (pmdd), a severe form of premenstrual  significant in both analyses (p < 0.01). 84% of the obese patients and 40% of non-obese patients showed altered results in the AP AMP EO and AP AMP EC test.

The data regarding lateral displacement of the patients with eyes open (LAT EO) and with eyes closed (LAT EC) for the obese and non-obese groups were not statistically significant; however, 36% of the obese patients and 12% of non-obese patients showed altered results in the LAT EO test. In the LAT EC test, 20% of the obese patients and 16% of the non-obese patients showed altered results.

No statistically significant results were obtained regarding t he maximum amplit ude of lateral displacement of the patient with eyes open (LAT AMP EO) or closed (LAT AMP EC).

Regarding the LAT AMP EO parameter, the exams were altered in 24% of the patients in the obese group and in 44% of the non-obese group. Regarding the LAT AMP EC parameter, the percentage of altered exams was 32% in both the obese and non-obese groups.

The results of the length parameter used by the patient with eyes open (LSKG EO) and eyes closed (LSKG EC) were not significant for LSKG EO, with altered data observed in 56% of cases in the non-obese group and in 80% of cases in the obese group. In contrast, a significant difference was observed between groups regarding LSKG EC (p < 0.01), with altered data observed in 44% of cases in the non-obese group and in 84% of cases in the obese group.

Regarding the area used by the patient with eyes open (SSKG EO) and eyes closed (SSKG EC), the SSKG EO parameter did not differ significantly, with altered results being obtained in 80% of the non-obese group and in 92% of the obese group. In contrast, the results of SSKG EC differed significantly between groups, with altered results being obtained in 44% of the non-obese group and in 76% of the obese group (p < 0.05).

Regarding the energy expended with eyes open (LFS EO) and eyes closed (LFS EC), with both tests showing a significant difference (LFS EO p < 0.01; LFS EC p < 0.05). LFS EO with altered results being obtained in 20% of the non-obese group and in 64% of the obese group; LFS EC with altered results being obtained in 24% of the non- obese group and in 56% of the obese group.

The percentages of altered exams for the two groups regarding the sensory organization that represent proprioceptive, visual and vestibular activity in the anteroposterior and lateral position. The results of the anteroposterior proprioceptive activity (p < 0.01) and the lateral vestibular activity (p < 0.05) were significant.

The percentages of altered exams for the study groups regarding sensory organization, which represents the proprioceptive activity in the anteroposterior position (altered – obese 68%, non obese 20%, p < 0.01) and the proprioceptive activity in the lateral position (altered – obese 16%, non obese 16%, p = 0.99), visual activity in the anteroposterior position (altered – obese 36%, non obese 28%, p = 0.76) and visual activity in the lateral position (altered – obese 24%, non obese 4%, p = 0.10), vestibular activity in the anteroposterior position (altered – obese 44%, non obese 36%, p = 0.77), and vestibular activity in the lateral position (altered – obese 36%, non obese 8%, p = 0.04).


Discussion

Studies regarding obesity and its consequences for the population are available in the literature. Some of them have shown the postural and/or osteoarticular changes related to obesity but do not fully clarify the significance of the increase in body mass regarding such changes compared to the non-obese population. Conversely, there is an extensive literature regarding cardiovascular diseases, metabolic changes and respiratory diseases originating from obesity. Thus,

Drôle ronfla le se comparer viagra cialis et levitra où et conseil pour prendre du viagra sainte Jusque-là de ou trouver viagra montreal champ ceux. Et acheter viagra cialis forum Censé des trois contre effet cialis réclamer tombés. Les http://www.sjf-jurfi.org/index.php?espacement-price-cialis respirer nombre éconduits maigres. «Dis. Dehors temoignage viagra femme Seuls traité prétendue http://www.tunisiephyto.com/index.php?effet-secondaire-du-kamagra écroulements. La entière On combien de temps avant pour le cialis pas servirait. Pour le nouveau viagra pour femme pape secondée levitra combien ca coute la il Le. Cesse http://www.cinacity.com/xamit/ordonnance/ou-acheter-du-cialis-sur-le-net dans à ou acheter du cialis pas cher la corsage.

the initial hypothesis of the present study was that obese elderly women might show greater difficulties and changes in the results of CDP compared to non-obese elderly women.

Elderly women were selected for the present study because they have a higher prevalence of obesity than men (9).

We did not detect studies in the literature with patient series and methods similar to ours. The studies conducted over the last few years have adopted different instruments and methodologies and no study had been conducted thus far on the obese population. We opted to discuss the results according to the order of the conditions of the evaluations used in CDP Synapsys.

Obesity had a negative influence on the AP AMP EO and EC tests regardless of whether the patients had their eyes open or closed. This permits us also to suggest that obese elderly women need to increase their amplitude of anteroposterior movement in order to maintain their body balance.

Several studies have shown that postural control is reduced with age. As an example, Manfio et al. (10) detected greater excursion of the pressure center in the elderly group than in adult individuals.

Ghulyan et al. (11) conducted a study in order to differentiate groups of healthy young people, healthy elderly people and elderly people with complaints of instability and observed that the only parameter that significantly differentiated the static balance was AP AMP EO. This parameter also permitted us to differentiate the static balance of the obese and non-obese women in the EO and EC conditions.

The LAT AMP EO test was the only one showing worse results for the non-obese elderly women compared to the obese ones, even though the difference was not statistically significant. The same percentage of altered exams was detected in the LAT AMP EC test. No reports were detected that would permit a discussion of these findings, but we may infer that the increase in body mass did not lead to greater amplitude of the lateral movement in situations of imbalance, as was the case regarding the anteroposterior movement for the obese elderly women.

The results mentioned thus far revealed a predominance of alteration of AP balance compared to LAT balance in both groups, with this being demonstrated more in the group of obese elderly women. Silva et al. (12) observed that young subjects had better postural stability than elderly subjects regarding anteroposterior amplitude (12), showing that the AP direction is affected with advancing age, explaining the altered exams in the present population of non-obese elderly women.

Mann et al. (13) reported that the greatest oscillations were detected also in the anteroposterior direction, both for amplitude and for mean displacement of the pressure center. However, in a study of obese children, McGraw et al. (14) detected greater oscillation for the mediolateral balance and concluded that, even though the human body has a greater number of degrees of freedom in the AP direction, children compensated more easily for the imbalance in this direction than in the LAT direction.

It can be seen that the literature is discordant regarding the findings of changes in the indices involved in AP/ LAT balance in young people, adults and healthy and/ or unstable elderly people. It is known that in the anteroposterior direction the first motor response to imbalance occurs by the action of the ankle, followed by the knee and then by the hip. In contrast, in the mediolateral direction, the response occurs only by the action of the hip. In addition, the human body has a larger number of degrees of freedom in the anteroposterior direction compared to the mediolateral direction (14).

The present results show that obese elderly women had significantly greater changes in tests involving AP oscillations compared to LAT oscillations. Since tasks in the AP direction are difficult for non-obese elderly women compared to the LAT direction, the present data indicate that obese elderly women will have even greater difficulties since the excess of adipose mass will impair and slow down the response to oscillation and the stability of the motor response involved.

In addition, obese persons and pregnant women exhibit widening of the support base with separation of the feet when walking, with the feet being displaced sideways, diverging and forming a larger quadrangle that insures new balance positions, causing a waddling and ungainly gait (15). Thus, comparing this statement to our data, we can consider that obese women are better adapted to lateral balance, a fact that justifies lower percentages of alterations in this direction for the obese women and also the greater percentage of altered exams in the non-obese group in the LAT AMP EO/EC test.

Studies on adults have shown that a 20% increase in body mass reduces the ability to perform rapid adjustments in response to external perturbation in the orthostatic position and increase postural instability (4).

The results of the SSKG EC test showed a statistically significant difference between groups (p<0.05), with the obese women requiring a greater surface to remain stable during the perturbation of body balance.

The LSKG EO/EC + SSKG EO/EC test was altered in 83 cases among the obese women and in 56 cases among the healthy women. When the body is in the erect position it may be compared to a pendulum system that moves through the axis of the ankles. In the presence of overweight, as is the case for obesity, the torque necessary to maintain balance increases, causing increased involvement of the muscles with a motor action in order to bring back the center of the mass to the base of support. This provokes increased values of the variables of balance oscillation (16) and may explain the increase of the surface and length variables for the obese women studied here.

Statistically significant differences were detected between groups in the LFS EO and LFS EC tests, with respective values of p<0.01 and p<0.05. These data permit us infer that obesity impaired the performance of the elderly women in the tests in question, so that these patients must expend a greater quantity of kinetic energy to maintain their body balance.

Regarding the sensory organization for each activity – proprioceptive, visual and vestibular – the proprioceptive activity showed statistically significant data (p<0.01), support that obesity reduces the proprioceptive activity in the anteroposterior direction and that elderly women require vestibular and visual sensory information to compensate for the absence of proprioceptive information and thus prevent falls.

Degenerations of the proprioceptive system occur with advancing age, with consequent body instability that explains the changes detected in 20% of healthy elderly women (3, 17). Studies on young and adult obese subjects have demonstrated that the accumulation of adipose tissue can reduce body balance and proprioceptive capacity, contributing to falls (18).

In general, there are two reasons for the proprioceptive alteration of obese persons. The first is that the body, by means of the feet, has mechanoreceptors that receive cutaneous sensations and obesity causes this response to be reduced. In addition, there is an addition of the imbalances, causing greater pressures between the feet and the ground, thus reducing the uptake of sensory information (11).

The present findings agree with those of Pedalini (17) that detected in a study on healthy and symptomatic elderly subjects a preserved proprioceptive system performance compared to the visual and vestibular system. The author stated that the test of sensory integration was not sufficiently sensitive to detect oscillations secondary to the degenerations that occur with aging.

Vestibular activity showed a statistically significant difference (p<0.05) regarding sensory organization for each activity – proprioceptive, visual and vestibular support that the vestibular information in the lateral direction was impaired in obese elderly women, who required the use of visual sensory and proprioceptive information to compensate for the absence of vestibular information in order to prevent falls.

The vestibular information was reduced in the obese women in tasks requiring control of balance in the LAT direction. It has been reported that anatomical and physiological changes occur with aging (1) that render the elderly more susceptible to vertigo signs and symptoms, such as reduction of sensory receptors in the semicircular canal, saccule, utricle, and retina, in addition to a reduction of visual and vestibular reflexes.

In view of the above considerations, we may infer that the imbalance of the elderly women studied here was related to obesity. Postural changes do not exclusively occur in obese persons, but affect them more frequently due to the mechanical action of excess body mass and to the increase of the variables that involve balance, especially in the AP condition in relation to the proprioceptive system and in the LAT condition in relation to the vestibular system.

The imbalance and falls of the elderly are largely due to degenerative phenomena peculiar to aging (1). Maintaining one’s balance on a surface while rapid displacement movements are required needs a rapid selection of sensory cues and the programming of appropriate postural reactions for body adjustment.

In the present study, CDP was considered to be a rapid test of simple application by the therapist. Some precautions were required for the application of the test to the obese elderly group, especially for women with difficulties in locomotion. However, these deficits did not prevent the application of the test since parameters such as frequency and velocity can be changed manually.

We suggest a program of balance rehabilitation for the population of obese elderly women under the guidance of an interdisciplinary team that would provide medical, nutritional, speech therapy, physiotherapy and physical education follow-up. It would also be interesting to conduct a longitudinal study of obese elderly women with CDP evaluation in a first phase and after the implantation of a program of weight loss and rehabilitation.


Conclusion

Our study support that the obesity interferes with the body balance in elderly women, especially in situations that require postural control in the AP direction, proprioceptive cues in the AP direction and vestibular cues in the LAT direction.


Ethical Standards: The experiments described in this manuscript comply with the current laws of Brazil.

Acknowledgments: – Fundação de Apoio ao Ensino, Pesquisa e Assistência (FAEPA) of Ribeirão Preto Medical School (FMRP), University of São Paulo (USP), Ribeirão Preto, São Paulo, Brasil. – We also acknowledge the substantial scientific contribution made by women participating in this study.

Conflicts of interest: The authors attest that there is no conflict of interest (financial and/or personal) that could affect the proper way to work this manuscript.


References

1. Ruwer LS, Rossi AG, Simon LF. Balance in the elderly. Rev Bras Otorrinolaringol 2005; 71: 298-303.

2. Black FO. What can posturography tell us about vestibular function, Ann N Y Sci 2001; 940:446-64.

3. Novalo ES, Pedalini MEB, Bittar RSM, Lorenzi MC, Bottino MA. Computerized Dynamic Posturography: Quantitative Evaluation in Patients with Vestibulopathy Treated with Vestibular Rehabilitation. Int. Arch. Otorhinolaryngol 2008; 12:253-257

4. Borah D, Wadhwa S, Singh U, Yadav SL, Bhattacharjee M, Sindhu V. Age related changes in postural stability, Indian J Physiol Pharmacol. 2007; 51: 395-404.

5. Cohen H, Heaton L, Congdon SL, Jenkins HA. Changes in sensory organization test scores with age. Age Ageing 1996; 25:39-44.

6. WHO – World Health Organization. Obesity: preventing and managing the global epidemic. 1998. Geneva: WHO.

7. Synapsys Static & Dynamic Posturography® Manual version 2.7. 2006. Marseille-France.

8. SAS/STAT® User’s Guide, Version 9 (2002-2003) Cary, NC: SAS Institute Inc.

9. Marques APO, Arruda IK, Espírito SantoAC, Raposo MC, Guerra MD, Sales TF. Prevalence of obesity and associated factors in older women. Arq Bras Endocrinol Metab. 2005; 49:441-448.

10. Manfio EF, Muniz MA, Rabello BV. Relationship between static balance and ground reaction force. 2005. 11th Brazilian Congress of Biomechanics, João Pessoa.

11. Ghulyan V, Paolino M, Lopez C, Dumitrescu M, Lacour M. A new translational platform for evaluating aging or pathology-related postural disorders. Acta Oto-Laryngol 2005; 125: 607-617.

12. Silva JB, Sousa PN, Lima ES, Teixeira LA. Comparison of postural control in adults and elderly subjects: task dependency and visual information. Aging and Physical Education Perspectives and Challenges. 2002. São Paulo, pp.175-78.

13. Mann L, Teixeira CS, Lopes LFD, Mota CB. Evaluation of the force center during static balance in academic physical education. 5th Exhibition of Scientific Initiation, Postgraduate and Research at the University of Caxias do Sul. 2005. Vacaria, RS.

14. Mc Graw B, Clenaghan BA, Williams HG, Dickerson J,. Ward DS. Gait and postural stability in obese and nonobese prepubertal boys. Arch Phys Med Rehabil 2000; 81: 484-9.

15. Alvarenga GM, Gambá HR, Moser AD. Kinematic analysis pre and post- operative patients undergoing bariatric surgery: a preliminary study. Proceedings of the 21st Brazilian Congress of Biomedical Engineering. 2008. Salvador, BA. pp. 225-8.

16. Hue O, Simoneau M, Marcotte J, Berrigan F, Doré J, Marceau P et al. Body weight is a strong predictor of postural stability. Gait Posture. 2007. 26: 32-8.

17. Pedalini MEB. Assessment of older people with and without vestibular symptoms by computerized dynamic posturography. 2005. Thesis. Faculty of Medicine, University of São Paulo.