jarlife journal
Sample text

AND option

OR option

NUTRITIONAL ASSESSMENT IN PATIENTS WITH EARLY-ONSET AUTOSOMAL DOMINANT ALZHEIMER’S DISEASE DUE TO PSEN1- E280A GENETIC VARIANT: A CROSS-SECTIONAL STUDY


M. Gómez-Vega1,2, E. Garcia-Cifuentes2,3, D. Aguillon1,2, J.E. Velez2, A. Jaramillo-Jimenez1,2,4,5, D. Vasquez2,6, C. Gómez-Henck2, C. Andrés Tobon1, G.C. Deossa Restrepo7, F. Lopera2


1. Grupo Neuropsicología y Conducta, Facultad de Medicina, Universidad de Antioquia, Institución Prestadora de Servicios de Salud – IPS Universitaria, Medellín, Colombia; 2. Grupo Neurociencias de Antioquia, Facultad de Medicina, Universidad de Antioquia, Medellín, Colombia; 3. Semillero de Neurociencias y Envejecimiento, Facultad de Medicina, Instituto de Envejecimiento, Pontificia Universidad Javeriana, Bogotá, Colombia; 4. Centre for Age-Related Medicine (SESAM), Stavanger University Hospital. Stavanger, Norway; 5. Faculty of Health Sciences, University of Stavanger. Stavanger, Norway; 6. Grupo de investigación en Epidemiología y Bioestadística, Universidad CES, Medellín, Colombia; 7. Escuela de nutrición y dietética, Universidad de Antioquia, Medellín, Colombia.ORCID digit: Manuela Gómez-Vega: 0000-0002-2000-4901; Elkin Garcia-Cifuentes: 0000-0003-4214-0266; David Aguillon: 0000-0003-2283-536X; Juan Esteban Velez: 0000-0002-0800-5709; Alberto Jaramillo-Jimenez: 0000-0001-5374-6410; Daniel Vasquez: 0000-0002-2586-162X; Clara Gómez Henck: 0000-0003-0848-8330; Carlos Andrés Tobon: 0000-0002-5787-6279; Gloria Cecilia Deossa Restrepo: 0000-0002-1635-1601; Francisco Lopera: 0000-0003-396-1484

Corresponding author: Manuela Gómez Vega, Grupo Neuropsicología y Conducta, Facultad de Medicina, Universidad de Antioquia, Institución Prestadora de Servicios de Salud – IPS Universitaria, Medellín, Colombia E:mail: manugomezvega@gmail.com; Tel: (+57) 319 5245304; Fax: (+574) 219 6444

J Aging Res & Lifestyle 2021;10:32-38
Published online June 6, 2021, http://dx.doi.org/10.14283/jarlife.2021.6


Abstract

Background: Weight loss and malnutrition are frequent findings in late-onset and sporadic presentations of Alzheimer’s Disease (AD). However, less is known about nutritional status in Early-Onset Autosomal Dominant AD (EO-ADAD). Objective: To analyze the association between nutritional status and other clinical and sociodemographic characteristics in individuals with a genetic form of EO-ADAD. Design, settings, and participants: Cross-sectional study with 75 non-institutionalized participants from a cohort of Autosomal Dominant AD (13 with mild cognitive impairment and 61 with dementia, ages from 38 to 67 years) underwent a structured clinical assessment with emphasis on nutritional status. Measurements: Primary outcome was nutritional status and it was measured using the Mini Nutritional Assessment (MNA). Patients were categorized according to MNA total score, as undernourished (MNA ≤23.5) and well-nourished (MNA ≥ 24). Sociodemographic and clinical variables identified as potential predictors or confounders of nutritional status were also collected. Results: Undernourishment by MNA was present in 57.3% of the sample. Forty-two percent of participants had abnormal BMI values considered lower than 18.5 or higher than 24.9 kg/m2. Total BMI values were similar in well and undernourished patients (median 24.2 IQR 3.59 and median 23.9 IQR 4.42, respectively, p=0.476). When comparing well and undernourished groups, we found statistically significant differences for variables: severity of dementia (p=0.034), frailty (p=0.001), multimorbidity (p=0.035) and, polymedication (p=0.045). Neither adjusted logistic regression nor the Poisson regression showed that any clinical or sociodemographic variables explained undernourishment. Conclusions: Undernourishment was a frequent finding in our sample of EO-ADAD, especially in later stages of the disease. Patients with polymedication, multimorbidity, frailty and severe dementia show differences in their nutritional status with a tendency to be more frequently undernourished. Further studies with larger sample sizes are needed to establish this association.

Key words: Autosomal Dominant Alzheimer’s Disease, Mini Nutritional Assessment, malnutrition.


Introduction

Alzheimer’s Disease (AD) is the main cause of dementia worldwide (1). Less than 1% of all AD cases are due to a genetic variant with familial aggregation. However, these forms of dementia are usually more severe and have an earlier onset (before age 65) (2). As a case in point, the Group of Neurosciences of Antioquia (GNA by its name in Spanish: Grupo de Neurociencias de Antioquia) in Colombia, has longitudinally followed around 6000 individuals at risk of Early-Onset Autosomal Dominant AD (EO-ADAD), 20% of them potentially carrying a single genetic variant, E280A (Glu280Ala) in Presenilin 1 (PSEN1), responsible for the disease (3). In this population, the mean age of onset for Mild Cognitive Impairment (MCI) is 44 years of age and 49 years of age for dementia (4), which is approximately 20 years younger than in late-onset AD (2).
Changes in nutritional status and weight loss have been widely studied before the onset and during the course of sporadic AD (5) representing a mortality predictor (6). Some mechanisms involved are neurodegeneration of specific brain regions (7), inflammatory processes (8) and, olfactory and taste dysfunction (9). Besides, some dementia-specific symptoms such as executive function and planning impairments, amnesia, behavioral and neuropsychiatric disorders (10, 11) dysphagia, side effects of pharmacotherapy (12), among others, lead to reduced dietary intake and malnutrition.
Malnutrition is related to modification of many epigenetic markers, resulting in the development of complex systemic disorders such as diabetes, obesity and hypertension: all related to higher cardiovascular risk and greater progression of AD (13–15). Malnutrition increases mortality rates in adults with dementia, causes reduced muscle mass, loss of autonomy, increased falls, decubitus ulcers, systemic infections (11) and rapid cognitive decline (16).
Approximately 44% of cognitively impaired elderly subjects are at risk of malnutrition and 15% suffer from it, albeit with variations in measurement from one region to another (17). Despite wide availability of information on malnutrition in late and sporadic forms of AD, only a few studies have assessed nutritional variables either in early-onset AD or in preclinical stages of ADAD (18–22). Studying the relationship between nutrition and EO-ADAD may provide a basis for effective preventive strategies as a public health priority against malnutrition, as well as a better understanding of morbimortality risk, due more to dementia than aging itself.
The purpose of the current study is to analyze the association between nutritional status in individuals with a genetic form of EO-ADAD and some clinical and sociodemographic potential determinants of malnutrition.


Methods

Study design and population

This is a cross-sectional study with a convenience sample of 75 individuals. The study population consisted of a sub-group of the longitudinal cohort of participants with EO-ADAD due to a genetic variant in PSEN1 (E280A) followed by the GNA. Major eligibility criteria included: diagnosis of cognitive impairment provided by an expert neurologist based on clinical and neuropsychological aspects (23, 24), carrier status of the PSEN1-E280A genetic variant and written informed consent from the participant or authorized proxy. Exclusion criteria were: functional limitation defined as a Global Deterioration Scale ≥6 (25) and clinical diagnosis of cerebrovascular disease.
Data was collected from records of 75 non-institutionalized patients (13 with MCI and 62 with dementia) participating in the ongoing project of the GNA called “Characterization of frailty syndrome in a population with early-onset Alzheimer’s Disease due to a genetic variant in PSEN1-E280A, using the evaluation methodology: Multimodal Approach for the Patient with Alzheimer’s and other Dementias (AMPAD)”, in Spanish: “Caracterización del síndrome de fragilidad en población con Enfermedad de Alzheimer de inicio precoz por variante genética PSEN1- E280A usando la metodología de evaluación: Abordaje Multimodal al Paciente con Alzheimer y otras Demencias (AMPAD)”. The genotypification of PSEN1-E280A variant is regularly conducted by the GNA using the molecular method PCR-RFLP (26), in all the members of the kindred that is being longitudinally followed since the 1990s (3).
Written informed consent was obtained from participants and their caregivers before study enrollment. The study was approved by the ethics committee of the Institute of Medical Research – School of Medicine of the University of Antioquia act 005 /2020.

Clinical assessment

Demographic and clinical data were obtained by a trained physician with a simultaneous interview of both participants and their caregivers. Polymedication was defined as taking ≥ 3 medications (24) and multimorbidity as having ≥ 2 chronic conditions (29). Hypertension, dyslipidemia and diabetes mellitus 2 were assessed by having it recorded in a previous medical record.
Frailty status was assessed through the Short Physical Performance Battery (SPPB) and the Timed Up and Go Test following standardized methods. The SPPB classifies individuals as non-frail or pre-frail/frail with a total score > 9, and ≤ 9, respectively (30). Participants who could not complete the SPPB because of major cognitive impairment were assessed using gait speed, classifying those with speed on a 6 meter walk < 1m/s as pre-frail/frail (31).
Anthropometric measures included brachial, calf and abdominal circumference obtained with a measuring tape SECA 101 (sensibility 0.1 cm). The abdominal perimeter was measured at the midpoint between the last rib and the upper border of the iliac crest and was categorized as normal or at risk of metabolic syndrome (women ≥ 80, men ≥90 cm) (32). Weight was measured in light clothing to the nearest 0.1 kg using SECA 813 electronic scale (sensibility 0.1 kg) and height using a wall-mount SECA 206 stadiometer. World Health Organization`s classification was used for Body Mass Index (BMI) (body weight [kg] divided by body height squared [m2]): underweight <18.5, normal weight 18.5 – 24.9, overweight 25 -29.9 and obesity ≥30 (33).

Main outcome measure

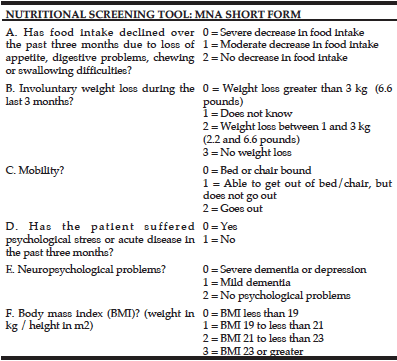
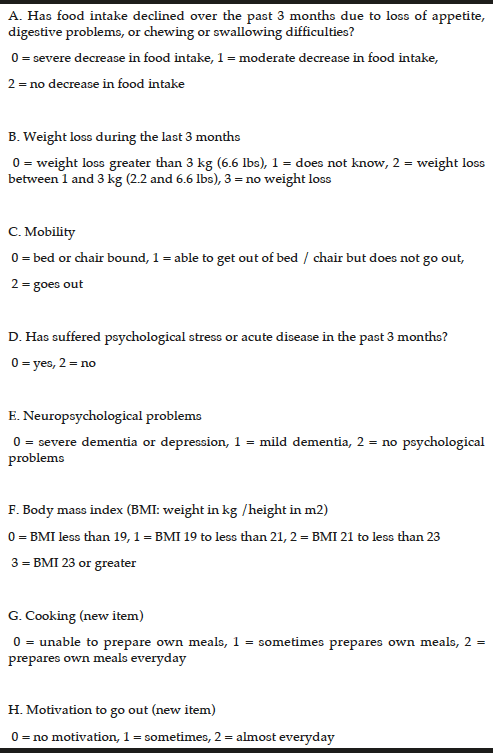
Main outcome for nutritional status was the total score on the Mini Nutritional Assessment® Guideline (MNA) questionnaire (including both screening and assessment). MNA has been validated for the evaluation of nutritional status of frail elderly including those with AD (17, 34). It has shown high sensitivity, specificity, and positive predictive value (96%, 98% and, 97% respectively) (35). MNA has also been used in younger populations (36). Brachial and calf circumferences were measured as described in the MNA guideline (37). It classifies patients into well-nourished (MNA score >23.5), at risk of malnutrition (MNA score=17.0–23.5), or malnourished (MNA score <17).

Neuropsychological assessment

All participants evaluated in the longitudinal follow-up of the Group of Neurosciences of Antioquia undergo a standardized neuropsychological assessment by a trained clinician based on the research group protocol (38). For the dementia stage grading, we collected neuropsychological data from visits in the prior three months to the clinical evaluation. We included: Mini-Mental State Examination from 0 to 30, where higher values indicate a better cognitive function (39), Global Deterioration Scale used to establish cognitive and functional impairment ranging from 1 to 7, and Barthel Index (40) for impairment in basic activities of daily living, lower scores indicating greater dependency.

Statistical analysis

Absolute and relative measures of demographic and clinical variables were obtained for qualitative data, central tendency and dispersion measures were evaluated using median and interquartile range. For statistical purposes, we categorized subjects according to the MNA total score into well-nourished (MNA score >23.5), and undernourished (MNA score ≤23.5) groups. Therefore, the undernourished group consisted of both: subjects at risk of malnutrition (n = 37) as well as those classified as malnourished (n = 6) according to the MNA total score.
To compare demographic and clinical variables between the well-nourished and undernourished groups, group differences in demographic (i.e. age, gender, and years of education) and clinical variables (i.e. severity of dementia, frailty, multimorbidity, polymedication, BMI, diagnosis of diabetes mellitus type 2, hypertension, dyslipidemia and risk of metabolic syndrome) were evaluated with independent samples Mann-Whitney U or T-test (depending on normal distribution according to Shapiro Wilk test) and Chi-square test for continuous and categorical variables, respectively.
To analyze the association between nutritional status and clinical and demographic characteristics, we performed a bivariate and multivariate analysis using logistic regression models. Unadjusted models included each clinical and demographic variable as explicative variables and nutritional status as a binary outcome (i.e. well-nourished and undernourished categories). The variables included in the bivariate analysis were used to adjust the estimators in the multivariate analysis and all of them had Variance Inflation Factors (VIF) values smaller than 2. Thus, an adjusted model included relevant demographic and clinical predictors mutually adjusted, and nutritional status as a binary outcome. Besides, these results were also verified by estimating the Prevalence Ratios (instead of Odds ratios) for undernutrition and well-nourishment groups, thus, Poisson regressions with robust variance estimation using the White’s estimator with an Omega value of 1 (Supplementary material 1), following previously published recommendations for cross-sectional designs with a binary outcome (41, 42). However, no major differences were evidenced between both methods. All the hypothesis tests were performed using an alpha value of 0.05 and a confidence interval of 0.95. The statistical analysis was performed using R software (version 3.6.1) (43).


Results

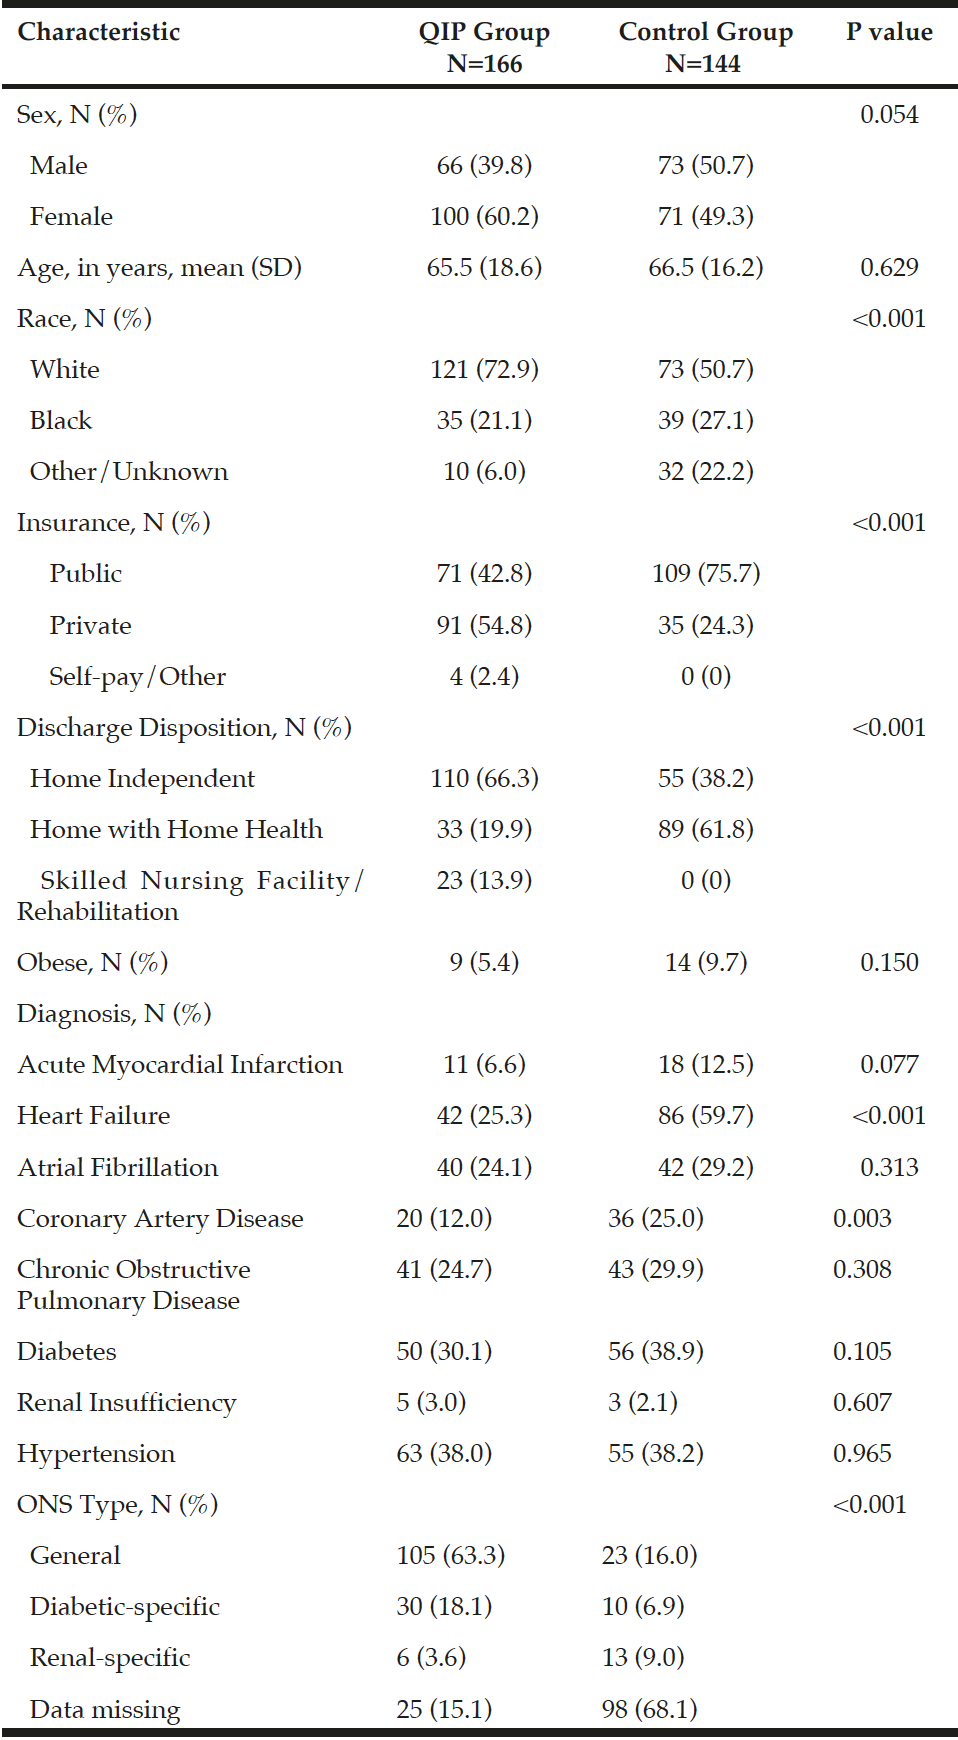
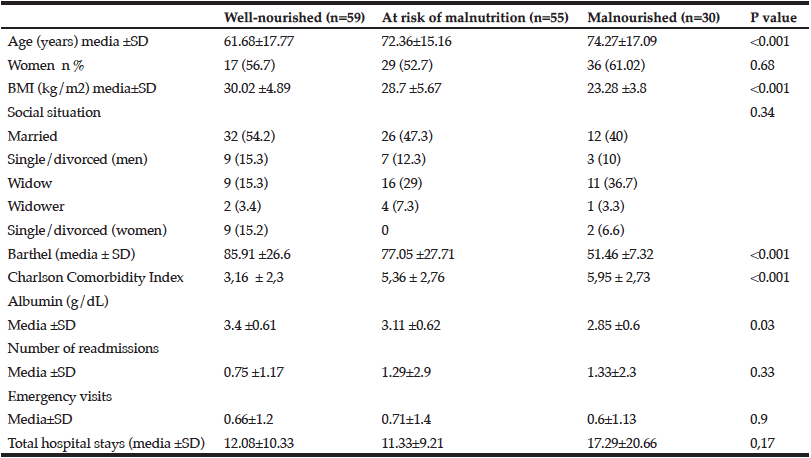
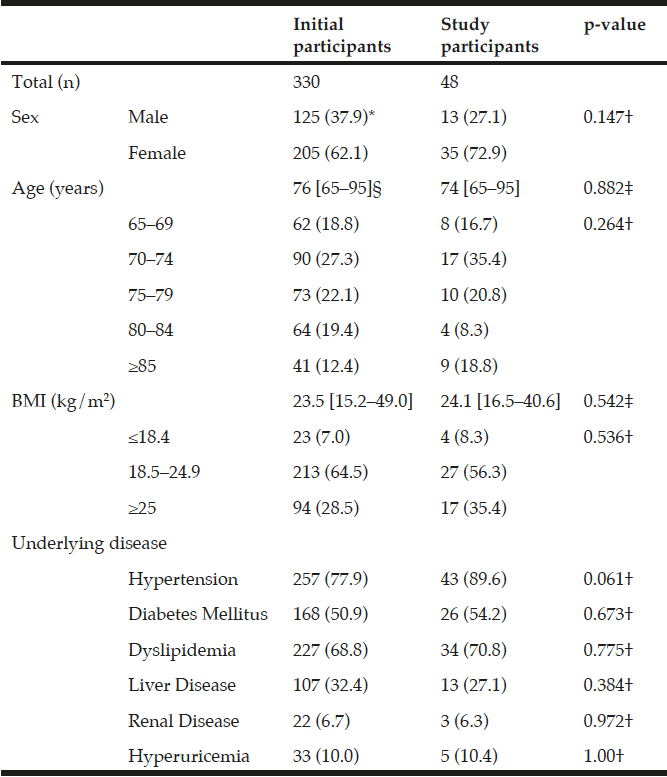
The demographic and clinical characteristics of the sample are shown in Table 1. Ages varied from 38-67 years with a median of= 49 years of age, IQR=8. We found an overall frequency of undernutrition of 57.3% (n=43) in patients with EO-ADAD by MNA. Of those in the undernourished group, 67.5% (n=29) were in later stages of AD (moderate and severe dementia). Forty-two percent (n=32) of the sample had abnormal BMI values distributed as underweight n=2, overweight n=25, obesity n=5. BMI values were similar in well and undernourished patients (median =24.2 IQR = 3.59 and median=23.9 IQR= 4.42, respectively, p=0.476).
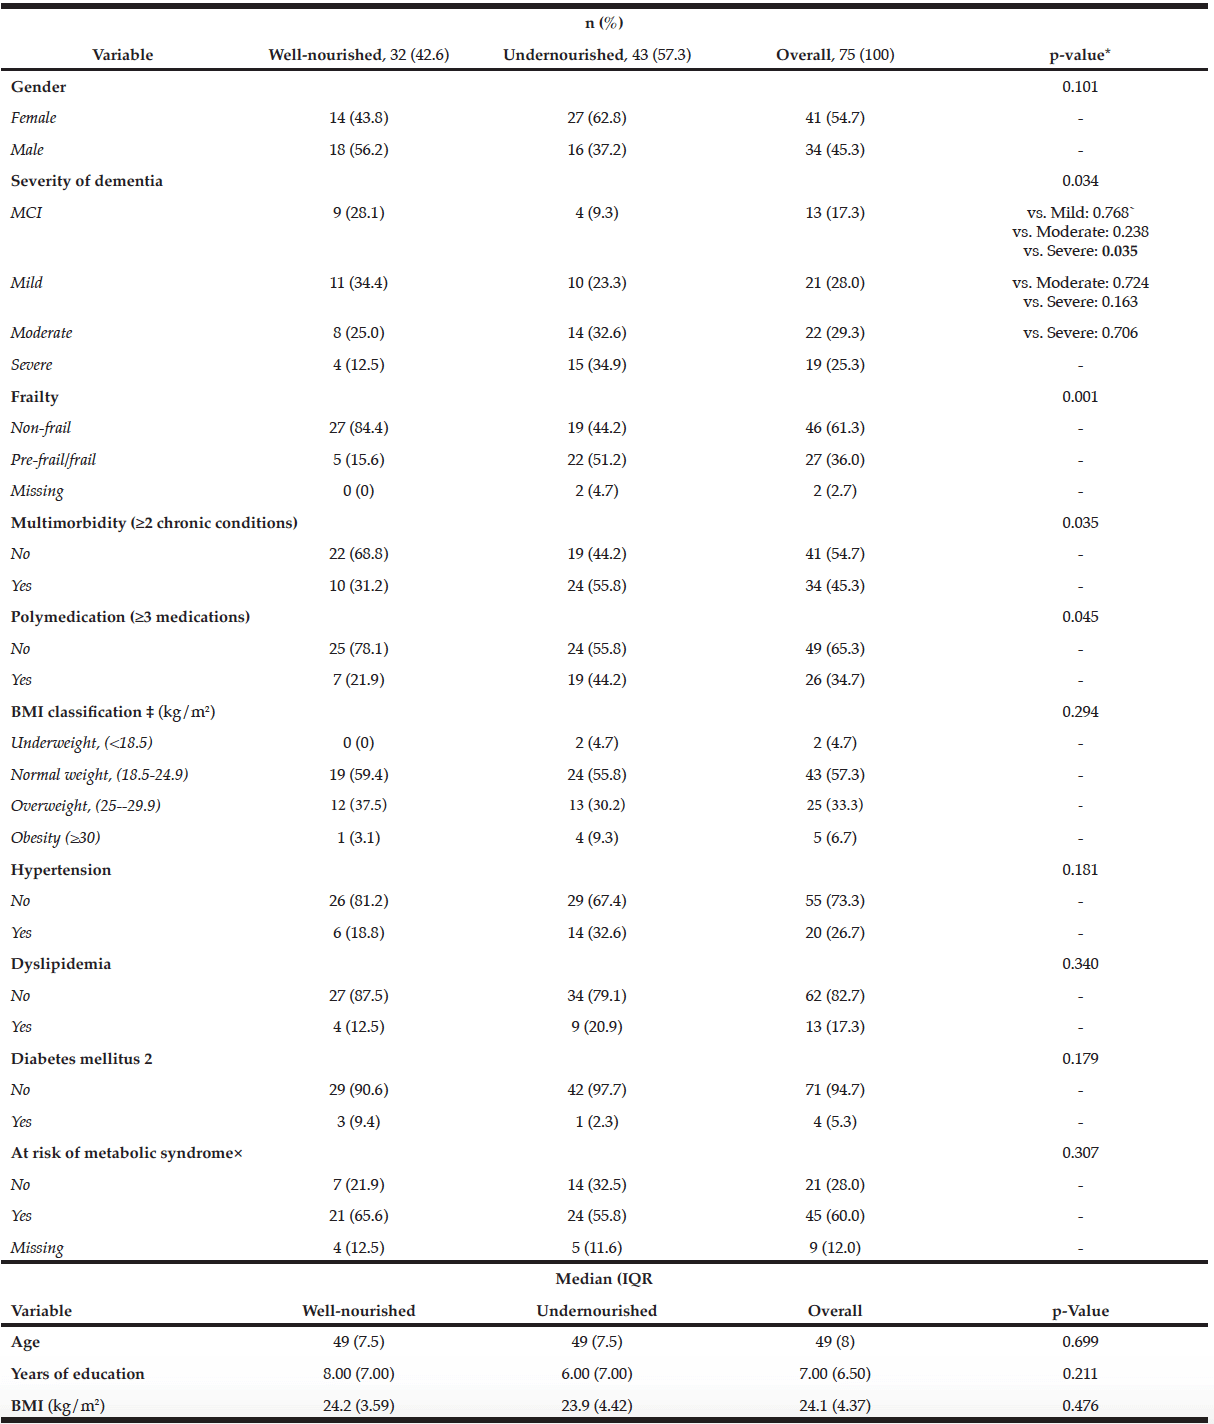
Table 1
Demographic and clinical characteristics of the sample according to nutritional status

BMI: Body Mass Index; MCI = Mild Cognitive Impairment, IQR=Interquartile Range. *p-Values for differences between Well-nourished and Undernourished groups using independent samples T-test, and Chi-squared, multiple comparisons for severity of dementia were adjusted with Tukey test. ‡ BMI classification using the World Health Organization reference values. ×Risk of metabolic syndrome was defined as an abdominal perimeter >80 cm for women and >90 cm for men.


There were statistically significant differences for the variables: severity of dementia, frailty, multimorbidity and, polymedication when comparing well and undernourished groups. Undernourished patients tend to be more commonly frail (n=22, 52.1%) than well-nourished patients (n=5, 15.6%) p=0.001. Likewise, the differences between the groups regarding severity of dementia were significant (p=0.034), particularly when comparing MCI vs. severe dementia (p = 0.035). For the other variables, we found no statistically significant differences (see Table 1).

Associations between clinical variables and nutritional status

In the unadjusted bivariate analysis, the variables moderate or severe dementia, frailty, polymedication, and multimorbidity were associated with the undernourished category. However, after adjusting for all clinical variables included in the analysis, there was no significant association for any of the variables (Table 2).
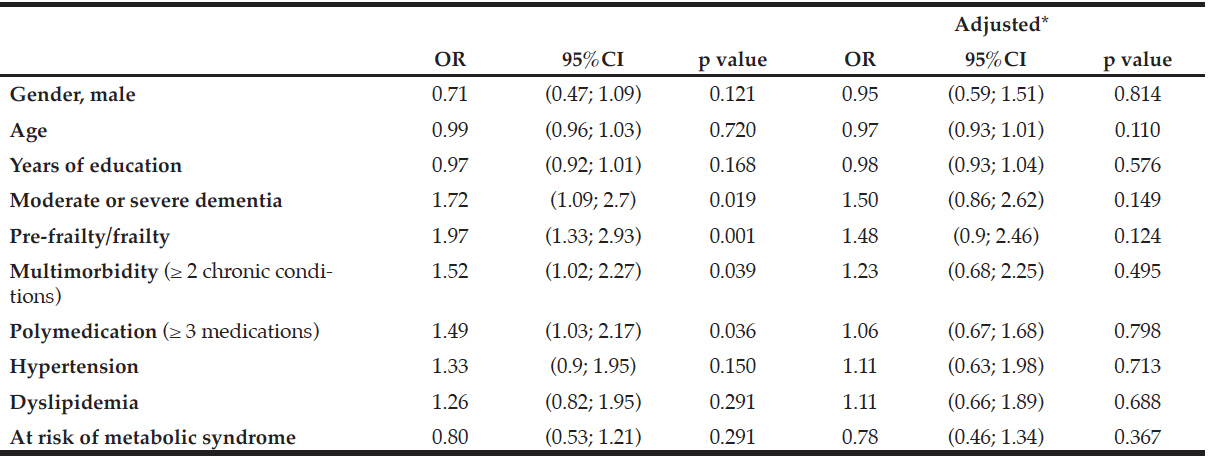
Table 2
Associations between clinical and sociodemographic variables with undernourishment

OR = Odds Ratio; 95%CI = 95% confidence interval. * All the variables included in the bivariate analysis were used to adjust the estimators in the multivariate analysis.


Discussion

Our study analyses the association between nutritional status in individuals with a genetic form of EO-ADAD (median age 49 years) and some clinical and sociodemographic characteristics. Overall, we found undernutrition to be present in 57.3% (n=43) of the sample. We did not find other studies that use MNA in any kind of early-onset dementia. Nevertheless, these results are comparable to previous studies conducted in elderly adults with cognitive impairment due to AD, which show a similar frequency of undernutrition by MNA score similar to the one found: in Korea (46%) (44), Japan (57%) (10), Netherlands (14.1% ) (45), in France (21-25%) (17,34), and as high as 96% in Italy (46). These differences might be explained by disease duration, clinical-stage, study design and culture. However, considering that dementia is a common variable between these studies and our study, we suggest that undernutrition might be present independently from age of onset, and perhaps it is attributable by different mechanisms to the dementia syndrome.
Thirty-two patients (42.6%) had abnormal BMI values (including under/overweight and obesity), which is consistent with a study of cardiovascular risk factors of a French cohort of early-onset AD (18). Furthermore, it is remarkable that n=13 (40%) of these patients with abnormal BMI values were part of the well-nourished group, which could be probably explained because the BMI cut-off values of the MNA differ from the WHO reference values for middle-aged adults. After analyzing BMI as a continuous variable, we did not observe any differences between the well-nourished and undernourished groups. Likewise, we did not find any differences when comparing brachial, calf and abdominal circumferences. Therefore, despite the common use of BMI and other anthropometric variables to classify nutritional status, these results suggest, that anthropometric variables (as an independent measure) are not well related to nutritional status according to MNA in this population of middle-aged adults with dementia. For clinical purposes, we suggest, the importance of complementing the nutritional evaluation with both MNA and BMI in this population. Future studies are needed to address results adapting thresholds of BMI, brachial, and calf circumferences on the MNA in early-onset dementia, to increase its sensibility.
The tendency of frail patients to be more likely in the undernourished group found in our study has been previously proven in older adults, leading to the consideration of MNA as an appropriate tool to measure frailty (47). Likewise, multimorbidity and therefore polypharmacy have been postulated, by different mechanisms, to exert a negative impact on nutrition, due to disorders in food intake, insufficient absorption of nutrients and indirect metabolic effects (21, 48). Nevertheless, in the multivariate analysis, no association was found when adjusting for all variables included. This result could be partly attributable to the underestimation of any significant difference caused by grouping participants “at risk of malnutrition” and “malnutrition” as one variable, since those “at risk of malnutrition” could be differentiated to a lesser extent with the comparison group “well-nourished”. Another explanation may be given by other variables not included in our analysis that have been proven to have a relation with malnutrition in dementia, such as nutrient intake, Apolipoprotein E status and inflammation (49, 50) or due to the sample size.
The frequency of multimorbidity, polymedication, and frailty in our sample was consistent with the prevalence of the same geriatric syndromes in older patients (51). An in-vitro study of our group in carriers of the same E280A genetic variant found that cholinergic neurons (differentiated from multipotent mesenchymal cells) display high levels of reactive oxygen species, loss of mitochondrial membrane potential and DNA fragmentation unlike other mesenchymal-derived cells (52). Therefore, to date, we cannot attribute the similarities between the geriatric syndromes in our middle-aged adults and older people only to the genetic variant. On the other hand, neuropathology that leads to cognitive impairment has been proven to directly affect indicators of frailty, which could be in our case, a possible explanation for our findings (53). Thus, the novelty of our study lies in the high frequency of geriatric syndromes, including undernutrition, in a group of patients with EO-ADAD, raising the importance of a complete clinical assessment with emphasis on nutrition of middle-aged adults with dementia.

Strengths and limitations

We analyzed a convenience sample (N=75) which causes a lack of adequate statistical power. The sampling methodology and cross-sectional design do not allow us to establish causality and therefore, results and conclusions should be read with precaution for other populations. Nevertheless, we acknowledge the value of our findings given the infrequent presentation of EO-ADAD. Healthy control groups should be desirable to contrast our hypothesis in further studies. Other forms of evaluation such as food-frequency and food-security questionnaires and the measurement of plasma levels of nutrients should be applied in future research. Some limitations of the MNA in our context, are the questionable reliability and validity of responses from participants with dementia regarding self-perception, and the applicability of the thresholds of anthropometric variables validated in elderly populations but not in middle-aged adults. The MNA is a useful tool for grading nutritional status, but adaptations in anthropometric and self-graded parameters may be required for its use in EO-ADAD.


Conclusion

Undernourishment, determined by MNA score, is a frequent finding in patients with EO-ADAD, especially in those at later stages of the disease or those who are frail. However, BMI, brachial and calf circumferences as independent measures are not different between well and under-nourished groups. Polymedication and multimorbidity seem to have a direct relationship with an altered nutritional status. Likewise, frail patients with ADAD and those with severe dementia are more likely to be undernourished. Understanding the specific aspects of nutritional status that better describe this population may potentially improve diagnosis, treatment, and prognosis, slow cognitive decline, reduce comorbidity and impact quality of life and caregiver burden.


Author contributions: MGV was responsible for conducting the literature search, designing the research protocol, evaluating participants, interpreting results, writing the protocol and manuscript. EGC was responsible for designing the research protocol, evaluating participants, extracting and analyzing data, and interpreting results. DA was responsible for designing the protocol, evaluating participants, and interpreting results. CGH was responsible for conducting the literature search and writing the report. DV was responsible for extracting and analyzing data and creating the tables and figures. AJ contributed to the design of the research protocol, clinical evaluation of participants, and extraction of data. JEV contributed to the research protocol, evaluated participants, and extracted data. GDR was responsible for methodological review of the protocol, literature search, interpreting results and conclusions. CAT contributed to interpreting results and reviewing and editing the report. FL helped interpreting the results and provided feedback on the report.

Conflict of interest: Dr. Gomez Vega, Dr. Aguillon and Dr. Tobon report grants from Ministerio de Ciencia, Tecnología e Innovación-Minciencias, during the conduct of the study; Dr. Lopera reports grants from Minciencias, during the conduct of the study; grants from API COLOMBIA, outside the submitted work; Dr. Garcia-Cifuentes, Dr. Velez, Dr. Jaramillo-Jimenez, Dr. Vasquez, Dr. Gomez Henck, and Dr. Deossa Restrepo have nothing to disclose.

Ethical standards: Written informed consent was obtained from participants and their caregivers before study participation and publication. The study was approved by the ethics committee of the Institute of Medical Research – School of Medicine of the University of Antioquia act 005 /2020. All procedures followed were following the ethical standards of the Helsinki Declaration.

Acknowledgments: We thank the participants and family members enrolled in the longitudinal follow-up by the Group of Neurosciences of Antioquia for their kind contribution to science during the last 30 years. We also thank the Ministry of Sciences of Colombia and Colciencias for their support in providing research funding awarded to MGV in the Joven Investigador Profesional de Colciencias call (JIC-14-2019).

Funding sources: This research was supported by the Ministry of Sciences of Colombia and Colciencias, immersed in the project: “Identificación de biomarcadores preclínicos en enfermedad de Alzheimer a través de un seguimiento longitudinal de la actividad eléctrica cerebral en poblaciones con riesgo genético” executed by the Group of Neurosciences of Antioquia and Group Neuropsychology and Conduct (Project number: 111577757635). The sponsors had no role in the design and conduct of the study; in the collection, analysis, and interpretation of data; in the preparation of the manuscript; or the review or approval of the manuscript.

Availability of data and material: All authors have full access to the data.


SUPPLEMENTARY MATERIAL1


References

1. Querfurth HW, Laferla FM. Alzheimer’s Disease. N Engl J Med. 2010;362(4):329–44.
2. Acosta-Baena N, Sepulveda-Falla D, Lopera-Gómez CM, Jaramillo-Elorza MC, Moreno S, Aguirre-Acevedo DC, et al. Pre-dementia clinical stages in presenilin 1 E280A familial early-onset Alzheimer’s disease: A retrospective cohort study. Lancet Neurol. 2011;10(3):213–20.
3. Lopera F, Ardilla A, Martínez A, Madrigal L, Arango-Viana JC, Lemere CA, et al. Clinical features of early-onset Alzheimer disease in a large kindred with an E280A presenilin-1 mutation. J Am Med Assoc. 1997;277(10):793–9.
4. Ryman DC, Acosta-Baena N, Aisen PS, Bird T, Danek A, Fox NC, et al. Symptom onset in autosomal dominant Alzheimer disease. Neurology. 2014;83(3):253–60.
5. García-Ptacek S, Faxén-Irving G, Čermáková P, Eriksdotter M, Religa D. Body mass index in dementia. Eur J Clin Nutr. 2014;68(11):1204–9.
6. White H, Pieper C, Schmader K. The Association of Weight Change in Alzheimer’s Disease with Severity of Disease and Mortality: A Longitudinal Analysis. J Am Geriatr Soc. 1998;46(10):1223–7.
7. Grundman M, Corey-Bloom J, Jernigan T, Archibald S, Thal LJ. Low body weight in Alzheimer’s disease is associated with mesial temporal cortex atrophy. Neurology. 1996;46(6):1585–91.
8. Engelhart MJ, Geerlings MI, Meijer J, Kiliaan A, Ruitenberg A, Van Swieten JC, et al. Inflammatory Proteins in Plasma and the Risk of Dementia: The Rotterdam Study. Arch Neurol. 2004;61(5):668–72.
9. Stanciu I, Larsson M, Nordin S, Adolfsson R, Nilsson LG, Olofsson JK. Olfactory Impairment and Subjective Olfactory Complaints Independently Predict Conversion to Dementia: A Longitudinal, Population-Based Study. J Int Neuropsychol Soc. 2014;20(2):209–17.
10. Kimura A, Sugimoto T, Kitamori K, Saji N, Niida S, Toba K, et al. Malnutrition is Associated with Behavioral and Psychiatric Symptoms of Dementia in Older Women with Mild Cognitive Impairment and Early-Stage. Nutrients. 2019;11(8):1–14.
11. Tamura B, Masaki K, Blanchette P. Weight Loss in Patients with Alzheimer’s Disease. J Nutr Elder. 2008;26(3–4):21–38.
12. Little MO. Updates in nutrition and polypharmacy. Curr Opin Clin Nutr Metab Care. 2018;21(1):4–9.
13. Magierski R, Kłoszewska I, Sobow T. Evaluation of the influence of metabolic processes and body composition on cognitive functions: Nutrition and Dementia Project (NutrDem Project). Eur J Clin Nutr. 2014;68(11):1200–3.
14. Lefèvre-Arbogast S, Wagner M, Proust-Lima C, Samieri C. Nutrition and Metabolic Profiles in the Natural History of Dementia: Recent Insights from Systems Biology and Life Course Epidemiology. Curr Nutr Rep. 2019;8(3):256–69.
15. Nicolia V, Lucarelli M, Fuso A. Environment, epigenetics and neurodegeneration: Focus on nutrition in Alzheimer’s disease. Exp Gerontol J. 2014;1–5.
16. Soto ME, Secher M, Gillette-Guyonnet S, Van Kan GA, Andrieu S, Nourhashemi F, et al. Weight Loss and Rapid Cognitive Decline in Community-Dwelling Patients with Alzheimer’s Disease. J Alzheimer’s Dis. 2012;28(3):647–54.
17. Vellas B, Lauque S, Gillette-Guyonnet S, Andrieu S, Cortes F, Nourhashemi F et al. Impact of nutritional status on the evolution of Alzheimer’s disease and on response to acetylcholinesterase inhibitor treatment. J Nutr Heal Aging. 2005;9(2):75–80.
18. Chen Y, Sillaire AR, Dallongeville J, Skrobala E, Wallon D, Dubois B, et al. Low Prevalence and Clinical Effect of Vascular Risk Factors in Early-Onset Alzheimer’s Disease. J Alzheimer’s Dis. 2017;60(3):1045–54.
19. Gu Y, Scarmeas N, Cosentino S, Brandt J, Albert M, Blacker D, et al. Change in Body Mass Index Before and After Alzheimer’s Disease Onset. Curr Alzheimer Res. 2014;11(4):349–56.
20. Muñoz AM, Agudelo GM, Lopera FJ. Diagnóstico del estado nutricional de los pacientes con demencia tipo Alzheimer registrados en el Grupo de Neurociencias, Medellín, 2004. Biomédica. 2006;26(1):113–25.
21. Gerritsen AAJ, Bakker C, Verhey FRJ, de Vugt ME, Melis RJF, Koopmans RTCM, et al. Prevalence of Comorbidity in Patients With Young-Onset Alzheimer Disease Compared With Late-Onset: A Comparative Cohort Study. J Am Med Dir Assoc. 2016;17(4):318–23.
22. Panegyres PK, Chen HY. Differences between early and late onset Alzheimer’s disease. Am J Neurodegener Dis. 2013;2(4):300–6.
23. Petersen RC, Doody R, Kurz A, Mohs RC, Morris JC, Rabins P V., et al. Current Concepts in Mild Cognitive Impairment. Arch Neurol. 2001;58(12):1985–92.
24. McKhann G, Knopman DS, Chertkow H, Hyman BT, Jack Jr CR, Kawas CH, et al. The diagnosis of dementia due to Alzheimer’s disease: Recommendations from the National Institute on Aging- Alzheimer’s Association workgroups on diagnostic guidelines for Alzheimer’s disease. Alzheimers Dement. 2012;7(3):263–9.
25. Reisberg B, Ferris S, De Leon M, Crook T. The Global Deterioration Scale for Assessment of Primary Degenerative Dementia. Am J Psychiatry. 1982;139(9):1136–9.
26. Clark RF, Hutton M, Fuldner M, Froelich S, Karran E, Talbot C et al. The structure of the presenilin 1 (S182) gene and identification of six novel mutations in early onset AD families. Nat Genet. 1995;11(2):219–22.
27. Barbe C, Jolly D, Morrone I, Wolak-Thierry A, Dramé M, Novella J-L, et al. Factors associated with quality of life in patients with Alzheimer’s disease. BMC Geriatr. 2018 Jul;18(1):159.
28. Berndt S, Maier C, Schütz HW. Polymedication and medication compliance in patients with chronic non-malignant pain. Pain. 1993 Mar;52(3):331–9.
29. Navickas R, Petric V-K, Feigl AB, Seychell M. Multimorbidity: What Do We Know? What Should We Do? J Comorbidity. 2016;6(1):4–11.
30. da Câmara SMA, Alvarado BE, Guralnik JM, Guerra RO, Maciel ÁCC. Using the Short Physical Performance Battery to screen for frailty in young-old adults with distinct socioeconomic conditions. Geriatr Gerontol Int. 2013;13(2):421–8.
31. Savva GM, Donoghue OA, Horgan F, O’Regan C, Cronin H, Kenny RA. Using Timed Up-and-Go to identify frail members of the older population. J Gerontol A Biol Sci Med Sci. 2013 Apr;68(4):441–6.
32. Alberti KGMM, Eckel RH, Grundy SM, Zimmet PZ, Cleeman JI, Donato KA, et al. Harmonizing the metabolic syndrome: A joint interim statement of the international diabetes federation task force on epidemiology and prevention; National heart, lung, and blood institute; American heart association; World heart federation; International . Circulation. 2009;120(16):1640–5.
33. World Health Organization. El estado físico: Uso e interpretación de la antropometría [Internet]. OMS, Serie de Informes Técnicos. 1993. Available from: http://whqlibdoc.who.int/trs/WHO_TRS_854_spa.pdf?ua=1
34. Guerin O, Soto ME, Brocker P, Robert PH, Benoit M, Vellas B et al. Nutritional status assessment during Alzheimer’s disease: results after one year (the REAL French Study Group). J Nutr Heal Aging. 2005;9(2):81—84.
35. Vellas B, Guigoz Y, Garry PJ, Nourhashemi F, Bennahum D, Lauque S, et al. The Mini Nutritional Assessment (MNA) and Its Use in Grading the Nutritional State of Elderly Patients. Nutrition. 1999;15(2):116–22.
36. Demirel B, Atasoy BM. Comparison of Three Nutritional Screening Tools to Predict Malnutrition Risk and Detect Distinctions Between Tools in Cancer Patients Receiving Radiochemotherapy. Nutr Cancer. 2018;70(6):867–73.
37. Nestle Nutrition Institute. Cribado Nutricional. Guía para rellenar el formulario Mini Nutricional Assessment [Internet]. Nestle Nutr Inst Workshop Ser. 2015. p. 20. Available from: http://www.mna-elderly.com/forms/mna_guide_spanish.pdf
38. Torres VL, Vila-Castelar C, Bocanegra Y, Baena A, Guzmán-Vélez E, Aguirre-Acevedo DC, et al. Normative data stratified by age and education for a Spanish neuropsychological test battery: Results from the Colombian Alzheimer’s prevention initiative registry. Appl Neuropsychol. 2019;0(0):1–15.
39. Folstein MF, Folstein SE, McHugh PR. “Mini-Mental State” A practical method for grading the cognitive state of patients for the clinician. J psychiat Res. 1975;12:189–98.
40. Mahonei FI, Barthel DW. Functional Evaluation: The Barthel Index. Md State Med J. 1965;14:61–5.
41. Zou G. A Modified Poisson Regression Approach to Prospective Studies with Binary Data. Am J Epidemiol. 2004;159(7):702–6.
42. Barros AJD, Hirakata VN. Alternatives for logistic regression in cross-sectional studies: An empirical comparison of models that directly estimate the prevalence ratio. BMC Med Res Methodol. 2003;3:1–13.
43. R Core Team. R: A language and environment for statistical computing. R Foundation for Statistical Computing [Internet]. Viena, Austria; 2019. Available from: https://www.r-project.org/.
44. Jang JW, Kim Y, Choi YH, Lee JM, Yoon B, Park KW, et al. Association of nutritional status with cognitive stage in the elderly Korean population: The Korean brain aging study for the early diagnosis and prediction of alzheimer’s disease. J Clin Neurol. 2019;15(3):292–300.
45. Droogsma E, Van Asselt DZB, Scholzel-Dorenbos CJM, Van Steijn JHM, Van Walderveen PE, Van Der Hooft CS. Nutritional status of community-dwelling elderly with newly diagnosed Alzheimer’s disease: Prevalence of malnutrition and the relation of various factors to nutritional status. J Nutr Heal Aging. 2013;17(7):606–10.
46. Tombini M, Sicari M, Pellegrino G, Ursini F, Insardá P, Di Lazzaro V. Nutritional Status of Patients with Alzheimer’s Disease and Their Caregivers. J Alzheimer’s Dis. 2016;54(4):1619–27.
47. Abellan Van Kan G, Vellas B. Is the mini nutritional assessment an appropriate tool to assess frailty in older adults? J Nutr Heal Aging. 2011;15(3):159–61.
48. Zadak Z, Hyspler R, Ticha A, Vlcek J. Polypharmacy and malnutrition. Curr Opin Clin Nutr Metab Care. 2013;16(1):50–5.
49. Olde Rikkert MGM, Verhey FR, Sijben JWC, Bouwman FH, Dautzenberg PLJ, Lansink M, et al. Differences in nutritional status between very mild Alzheimer’s disease patients and healthy controls. J Alzheimer’s Dis. 2014;41(1):261–71.
50. Volkert D, Chourdakis M, Faxen-Irving G, Frühwald T, Landi F, Suominen MH, et al. ESPEN guidelines on nutrition in dementia. Clin Nutr. 2015;34(6):1052–73.
51. Kane RL, Shamliyan T, Talley K, Pacala J. The association between geriatric syndromes and survival. J Am Geriatr Soc. 2012;60(5):896–904.
52. Soto-Mercado V, Mendivil-Perez M, Velez-Pardo C, Lopera F, Jimenez-Del-Rio M. Cholinergic-like neurons carrying PSEN1 E280A mutation from familial Alzheimer’s disease reveal intraneuronal sAPPβ fragments accumulation, hyperphosphorylation of TAU, oxidative stress, apoptosis and Ca2+ dysregulation: Therapeutic implications. PLoS One [Internet]. 2020;15(5):1–29. Available from: http://dx.doi.org/10.1371/journal.pone.0221669
53. Robertson DA, Savva GM, Kenny RA. Frailty and cognitive impairment-A review of the evidence and causal mechanisms. Ageing Res Rev [Internet]. 2013;12(4):840–51. Available from: http://dx.doi.org/10.1016/j.arr.2013.06.004

MALNUTRITION POINT-PREVALENCE FROM 2012 TO 2019 AND ASSOCIATED HEALTH-OUTCOMES IN ADULT PATIENTS IN RURAL HOSPITALS

E. Lopez1, M. Banbury2,3, E. Isenring4, S. Marshall5

1. MNutrDietPrac, Accredited Practising Dietitian, Faculty of Health Sciences and Medicine, Bond University, Australia; 2. BSc (Hons) Applied Human Nutrition & Dietetics. Accredited Practising Dietitian. Northern NSW Local Health District; 3. Faculty of Health Sciences and Medicine, Bond University, Australia; 4. PhD. Advanced Accredited Practising Dietitian. Bond University Nutrition & Dietetics Research Group, Faculty of Health Sciences and Medicine, Bond University, Australia; 5. BNutr&Diet (Hons), PhD. Accredited Practising Dietitian. Bond University Nutrition & Dietetics Research Group, Faculty of Health Sciences and Medicine, Bond University, Australia

Corresponding Author: Skye Marshall, Nutrition & Dietetics, Bond University, Robina, Queensland, 4226, Australia. Email: skye_marshall@bond.edu.au; Phone: 07 5595 3337.

J Aging Res Clin Practice 2019;8:91-97
Published online January 20, 2020, http://dx.doi.org/10.14283/jarcp.2019.16


Abstract

Background: Malnutrition negatively impacts hospitalised patients and the healthcare system. Objectives: 1) report point-prevalence of hospital malnutrition from 2012 to 2019; and 2) determine if there was an association between nutrition status and health-related outcomes. Design: Point-prevalence of malnutrition was determined by three (2012, 2014, and 2019) cross-sectional studies. Health-related outcomes, assessed by a prospective cohort study in 2014, were length of stay, in-hospital mortality, hospital readmission, infection, falls, fractures, and pressure wounds. Setting: three Australian rural hospitals. Participants: Adult inpatients. Measurements: Nutrition status was assessed with the Subjective Global Assessment (SGA) tool. Results: Malnutrition point prevalence was 39% in 2012 (n=62), 48% in 2014 (n=128), and 28% in 2019 (n=96); where the prevalence in 2019 was significantly lower than in 2014 (p<0.017). The 2019 (median age 70 years) sample was younger than the 2012 (median age 80 years) and 2014 (median age 78 years) samples (p<0.05). Mortality and falls rate were higher in the severely malnourished participants (p=<0.05); and severe malnutrition may predict mortality (Adjusted OR: 3.47 (95%CI: 0.94, 12.78] p=0.061). Conclusions: Nutrition status did not predict other health-related outcomes. The rate of malnutrition in rural hospitals was consistently high and may increase the risk of in-hospital mortality.

Key words: Malnutrition, hospitals, nutrition assessment, subjective global assessment, mortality.


Introduction

Protein-energy malnutrition (herein referred to as ‘malnutrition’) negatively impacts the patient and healthcare system alike (2, 3), a major concern as the prevalence has been reported internationally at 30-50% across inpatient and residential settings, and 1-25% across community settings (4-8). Malnutrition is the unintended loss of lean mass (muscle, immune and blood cells, viscera), with or without fat loss, due to inadequate intake, uptake, and/or utilisation of protein and energy to meet requirements (4, 9). Older adults are at greater risk of malnutrition due to their susceptibility of aetiological factors including psychological, socio-economic, and physiological changes and an overall increase in multi-morbidities and polypharmacy (9). A consequence of malnutrition is further morbidity, requiring increased healthcare resources including but not limited to hospital beds, multidisciplinary staff, and pharmaceutical and nutritional medicine (10). In particular, malnutrition increases risk of infection, pressure ulcers, poor wound healing, decreased response to medical treatment and pharmaceuticals, decreased respiratory function, decreased muscle repair, and overall functional impairment; leading to decreased quality of life and increased risk of mortality (3, 6, 11).
While several large-scale studies have reported the prevalence and outcomes of hospital malnutrition, the rural context requires specific examination as populations in rural areas are ageing more rapidly than in urban areas (11, 15-17). Rural areas face increased challenges in providing health and aged care due to the higher cost of establishing and delivering services, the limited availability of and access to health professionals, and less availability of informal care networks (12-14). Not only is access to health care more limited in rural areas, rural-dwelling older adults are also more in need of health and aged care services. A recent meta-analysis and meta-regression of international data found the prevalence of malnutrition in rural-dwelling older adults living at home was double that of urban-dwelling older adults (5). Therefore, the prevalence and health-related outcomes of malnutrition in rural hospitals is of interest, so that policies may appropriately support patients in the continuum of care from hospital to home or residential care.

Research aims

In adult patients admitted to three rural hospitals in Australia, the aims of this study were to: 1) report point-prevalence of malnutrition from 2012 to 2019; and 2) determine if there was an association between nutrition status and health-related outcomes.

Materials and Methods

Study design

The point-prevalence of malnutrition was assessed using three cross-sectional studies conducted in 2012, 2014, and 2019. The association between malnutrition and health-related outcomes was evaluated using a prospective observational study in 2014. Participants gave their verbal consent to participate in the study. The project was approved by the Human Research Ethics Committees in April 2018 (QA249) as a quality assurance project. This study has been reported according to the STROBE Statement for cohort studies (15) and was retrospectively registered with ANZCTR (ACTRN12619000342112) (19).

Setting and sample

All three hospitals within a rural government-funded local health district in northern New South Wales, Australia, were conveniently sampled in 2012. Reflecting the staffing resources available for each cross-sectional study, the medical, surgical, general (not diagnosis or treatment specific), and/or rehabilitation wards were sampled (Table 1).

Table 1 Rural hospitals and wards sampled by the three cross-sectional studies

Table 1
Rural hospitals and wards sampled by the three cross-sectional studies

* This sample was also that used in the prospective observational study.

The prospective cohort study was conducted using the 2014 sample due to availability of data and its larger sample size. Patients were eligible if they were 18 years or older and were admitted as inpatients to study sites during the recruitment phase of one to two weeks. No exclusion criteria were applied.

Participant characteristics and potentially confounding variables

Participant characteristics of age (years) and sex (male/female) were recorded for all participants. The 2014 sample were also described by comorbidities and medications. The number of active comorbidities were categorised into medical diagnostic groups: cancer, digestive, musculoskeletal, circulatory, respiratory, nervous, skin, reproductive, kidney, infectious, endocrine, injuries, ear, blood, and other. The number of medications were categorised into 24 drug classes based on the profile of medications recorded from the cohort (16).

Outcomes

Malnutrition was determined by the SGA tool which rates patients as A = well nourished, B = mild-moderate malnutrition, or C = severe malnutrition (17, 18).  The presence of malnutrition was the primary outcome to answer the first research question (point-prevalence) and the independent variable to answer the second research question (health-related outcomes).
The primary health-related outcome was length of hospital stay, defined by the number of days including the day of admission and discharge. Secondary health-related outcomes were in-hospital mortality (yes/no), hospital readmission (yes/no), in-hospital fall (yes/no), fall in subsequent hospital admissions (yes/no), pressure ulcer (yes/no), fracture acquired in hospital (yes/no), urinary tract or respiratory tract infection (yes/no). Health-related outcomes were measured from the day of hospital admission to three months post-discharge.

Data Collection

In 2012 and 2014, nutrition status was assessed by department dietitians over a 7-day period within each ward using the SGA. In 2019, nutrition status was assessed by one student-dietitian (EL) using the SGA over two weeks. Only the student dietitian in 2019 received training in correct SGA use, whereas department dietitians were expected to be competent in nutrition assessment due to years of experience. The SGA is comprised of two main components: medical and physical assessment. Changes in weight, dietary intake, gastrointestinal symptoms, and nutrition-related functional capacity were observed from a combination of patient records and patient interview for the medical component; while evidence of oedema, ascites, and loss of subcutaneous fat and muscle was assessed during a physical examination to inform the physical component. A patient who demonstrated negative changes to their oral intake and failed to meet their nutritional requirements with evidence of muscle and fat deterioration were classified as exhibiting a degree of malnutrition. Participant characteristics and the health-related outcomes were observed from the medical record.

Data Analysis

Data analysis was completed using IBM SPSS Statistics 25 [IBM Corp. Released 2017. IBM SPSS Statistics for Windows, Version 25.0. Armonk, NY: IBM Corp]. Descriptive statistics were used to summarise characteristics and outcome data. Continuous variables were considered non-normal if their skewness and kurtosis divided by their standard error exceeded +2 or -2; parametric variables were reported as mean (standard deviation) and non-parametric as median (IQR). Participants were considered “malnourished” if they were rated as SGA B or C, and “well-nourished” if rated SGA A. To determine if there was a significant difference in age, nutrition status, and sex between the samples, the Kruskal-Wallis H Test was applied. If significance was observed, post-hoc testing using Mann-Whitney U was used for pairwise comparisons between cohorts. Here, the Bonferroni correction was applied at 0.05 level and adjusted for three groups; therefore, the cut-off value for significance for Mann-Whitney U tests was at p<0.017. If significance was observed, post-hoc testing using Mann-Whitney U was used between pairs of cohorts. Post hoc power analysis using G*Power (version 3.1.9.2) was conducted on independent group means which showed significant difference. Extreme outliers (interquartile range rule with multiplier of 3) were removed from continuous variables. Binary logistic regression was used to determine the effect of the sample (2012, 2014, or 2019) on nutrition status, with age and sex as a confounding variables.
For the 2014 cohort, differences between nutrition status and outcomes were tested by the Mann-Whitney U Test or Chi-squared test. Associations with health-related outcomes were tested according to the level of severity, with patients considered as “malnourished” (SGA rating B or C), and “severely malnourished” (SGA rating C). Multiple linear regression was used to determine the impact of nutrition status on LOS, and multiple logistic regression was used to determine the impact of nutrition status on secondary outcomes, accounting for participant characteristics which met assumptions for the model. Statistical significance was considered at the p<0.05 level two tailed unless otherwise indicated.

Results

Participant characteristics

A total of 286 participants were recruited; n=62 in 2012, n=128 in 2014, and n=96 in 2019 (Table 2). There was no difference in the sex ratio or the prevalence of malnutrition between the sexes in any sample. The 2019 sample (median age 70 years) was found to be significantly younger than the 2012 (median age 80 years) and 2014 (median age 78 years) samples (p < 0.017). In the 2014 sample, a circulatory condition was the most common comorbidity experienced (72%), followed by musculoskeletal and respiratory conditions (40% and 38% respectively) (Table 3). Cancer was more prevalent in malnourished (33%) than well-nourished participants (16%) (p=0.028); where prevalence and total number of other comorbidities between groups were similar. Both groups had a median of six classes of medications prescribed during hospitalisation; where the malnourished group had a higher range (IQR 5, 7.25) than the well-nourished group (IQR 3, 6.25) (p=0.024). Malnourished participants were also more likely to be prescribed nutritional supplements (p=0.008) and proton-pump inhibitors (p=0.013), and less likely to be prescribed medication for insomnia (p=0.037).

Table 2 Age, sex, and malnutrition point-prevalence of the 2012, 2014, and 2019 participant samples

Table 2
Age, sex, and malnutrition point-prevalence of the 2012, 2014, and 2019 participant samples

* Kruskal-Wallis H Test applied followed by Mann-Whitney U tests to determine significance between cohort years. The Bonferroni correction was applied at 0.05 level. Cut-off value for significance for Mann-Whitney U tests at p=0.017 (0.05/3) for 3 pairwise comparisons between cohorts. Significance for age found between pairs 2012 vs 2019 and 2014 vs 2019 cohorts; † No significance found between sex across cohorts; ‡ Malnourished = B (mild-moderate malnutrition) and C (severe malnutrition) rating combined; § Kruskal-Wallis H Test applied followed by Mann-Whitney U tests to determine significance between cohort years. The Bonferroni correction was applied at 0.05 level. Cut-off value for significance for Mann-Whitney U tests at p=0.017 (0.05/3) for 3 pairwise comparisons between cohorts. Significance for malnourished patients only found between 2014- and 2019-year groups; || No significance found for sex effect on malnutrition across cohorts.

Table 3 Comorbidity and medication characteristics of 2014 sample

Table 3
Comorbidity and medication characteristics of 2014 sample

* Comorbidity data in the medical record was unavailable for n=4 participants; † Comparison of well-nourished (SGA rating A) and malnourished (SGA rating B or C) groups; ‡  Number of comorbidities experienced by a single participant; data presented mean (SD); § PPI = proton pump inhibitor; ||  Number of medication classes taken by a single participant; data presented median (IQR)

Point-prevalence of malnutrition from 2012 to 2019

Across the three time-points, malnutrition according to the SGA shows a peak in the 2014 cohort (48%), which was significantly higher than in 2019 (28%), but not 2012 (39%) (Table 2). The prevalence of participants assessed as severely malnourished (SGA rating C) decreased over time from 15% in 2012, 13% in 2014, to 2% in 2019 (p=0.005); whereas the prevalence of well-nourished fluctuated from 61% in 2012, 52% in 2014, to 72% in 2019 (p=0.005). In a model adjusted for age and sex, regression analyses found that only age was a predictor of malnutrition, where each year of life increased the odds of malnutrition by 2% (OR: 1.020 [95%CI: 1.003, 1.036] p=0.018) but explained only 5% of variation in the model.
‘Effect size’ and ‘chance of impact’ was reported for comparisons between year groups for nutrition status to determine the magnitude of the difference between groups and whether or not the outcome was likely to have an actual impact. The pairwise comparison for nutrition status between 2014 and 2019 had a medium effect and 93% chance of impact. For age comparison, 2014 versus 2019 had a medium effect and 89% chance of impact. The 2012 versus 2019 comparison has a small effect size and a 35% chance of impact.

Association of malnutrition with health-related outcomes

In the 2014 sample, there were five extreme outliers for LOS that were removed. The average LOS was 12 (IQR: 6, 22) days and 60% of participants were readmitted to hospital within 3-months. Malnourished participants (SGA rating B or C) had a higher rate in-hospital mortality but this did not quite reach significace (21% versus 9%; p=0.059); groups did not differ on other outcomes (Table 4). Malnutrition was not a significant predictor of any health-related outcome in adjusted regression models.
Severely malnourished participants (SGA C) had a higher rate in-hospital mortality (38% versus 12%; p=0.006), and a lower rate of falls during subsequent admissions (0% versus 22%; p=0.035); but groups did not differ on other outcomes (Table 5). Severe malnutrition increased the risk of in-hospital mortality by 457% (OR: 4.57 [95%CI: 1.42, 14.66], p=0.011); but in a model adjusted for age, cancer diagnosis, and prescription of nutrition supplements (confounders which met assumptions), this was reduced to 347% with a trend for significance [OR: 3.47 (95%CI: 0.94, 12.78] p=0.061). Severe malnutrition was not a predictor of other health-related outcomes in adjusted or unadjusted models.

Table 4 Health-related outcomes of the 2014 sample according to well-nourished or malnourished

Table 4
Health-related outcomes of the 2014 sample according to well-nourished or malnourished

Data expressed as median (IQR) or n (%) ; * Comparison of well-nourished (SGA rating A) and malnourished (SGA rating B or C) groups;  † Test performed on log10 normalised data

Table 5 Health-related outcomes of the 2014 sample according to severely malnourished or not severely malnourished

Table 5
Health-related outcomes of the 2014 sample according to severely malnourished or not severely malnourished

Data expressed as median (IQR) or n (%); * Comparison of no severe malnutrition (SGA rating A or B) and severely malnourished (SGA rating C) groups; † Test performed on log10 normalised data

Discussion

This study has reported a consistently high prevalence of malnutrition in three rural hospitals in northern NSW from 2012 to 2019; however, in 2019 the prevalence was 11% and 20% lower than in the previous samples, and the prevalence of severe malnutrition was very low at 2%. The 2014 sample reported the highest prevalence of malnutrition in any Australian hospital (45%); which exceeds the rate reported in three remote Australian hospitals (42%) (19-21). The lowest prevalence reported in 2019 aligns with prevalence rates in Australian metropolitan hospitals. As nutrition status comparison between the 2014 and 2019 cohorts had a calculated medium effect size and high impact value, there is high confidence in the measured prevalence rates. Relevant for the Australian health care system, the SGA tool used to determine prevalence is synonymous with the International Classification for Diseases, 10th revision, Australian Modification (ICD-10-AM) classification of protein-energy malnutrition (22), and therefore directly linked to case-mix funding.
The differing rates in malnutrition prevalence over time is partially explained by the age of participants; however, the impact of age cannot account for the changes in prevalence alone. The lower rate of malnutrition in 2019 compared 2014 may also be due to variations in the sampled wards and hospital sites. The 2019 sample did not include a 34-bed rehabilitation ward; a setting which has previously been reported to have a high prevalence of malnutrition at 53% (23). There are also likely causes of variation in the prevalence of malnutrition over time which were not captured by this study, including demographics such as socio-economic status or ethnicity, inter-rater variability of SGA assessment, or changes in hospital policies and priorities to address malnutrition. Interestingly, the rate of malnutrition did not vary according to sex. A recent meta-analysis of worldwide data found that females had a 45% increased risk of malnutrition (OR: 1.45 [95%CI: 1.27, 1.66] p<0.00001) in the community setting, which included post-hospital samples.
It has been well established that malnutrition increases the risk of poor health outcomes in the hospital setting, (21, 24, 25). This study confirms that malnourished participants had higher rates of in-hospital mortality; however, only severe malnutrition was a predictor of this outcome. The clinical importance of this is still relevant despite the rate of severe malnutrition being reduced to only 2% in 2019, as there is a possibility of inter-rater variability in application of the SGA. To confirm if the risk of malnutrition-related in-hospital mortality has been eradicated with the decrease in severe malnutrition rates, health outcomes of the 2019 would need to be examined. A high rate of false positives in the 2014 sample would also explain why many participant characteristics usually associated with malnutrition were not significant predictors in multivariable models. Although severe malnutrition appeared to have a lower rate of falls in subsequent hospital admissions compared to better nourished participants, this is explained by very low rates of hospital readmission reflecting the high rate of in-hospital mortality in this group.
Of clinical significance, less than 50% of malnourished participants in the 2014 sample were provided with nutritional supplementation, and non-supplementation was a predictor of poor health-related outcomes in the adjusted models, including the high rate of hospital readmission within 3-months. Additionally, prescription of proton-pump inhibiters, which inhibit nutrient digestion, was higher in malnourished participants. Overall, the 2014 sample had a high rate of polypharmacy, a risk factor for malnutrition (26). Although comorbidities were highly prevalent, the only disease which was higher in the malnourished participants was cancer. Whilst malnutrition in cancer is known to highly prevalent (27); previous studies have identified that patients with other hypermetabolic conditions such as hepatic, cardiovascular, and gastrointestinal disease, depression, and dementia also have increased risk of malnutrition (28, 29).

Limitations

As discussed above, this study is limited by potential poor inter-rater reliability for the SGA assessment between samples, and not including further demographic data to explore variation in the multivariable models. In addition, as the SGA assessments were implemented cross-sectionally, the ratio of pre-existing malnutrition (i.e. admitted to hospital with malnutrition) to hospital acquired malnutrition within the reported prevalence is unclear. Finally, the 2014 sample may have been underpowered to detect differences in health-related outcomes, particularly risk of in-hospital mortality (p=0.059).

Conclusion

Although the prevalence of malnutrition decreased over time, the rate of malnutrition in the sampled rural hospitals was consistently high; and is associated with increased risk of in-hospital mortality. Research should continue to monitor the rate of malnutrition in acute hospitals in rural areas to evaluate the impact of health service policies and procedures to address this problem.

Key Question Summary

What is known about the topic? Malnutrition is highly prevalent in the acute hospital setting in Australia at 30-40% and up to 71% in older adults (1). The Australian health system faces unique challenges related to high proportions of older adults living in geographically rural and remote areas. The rates and health-related complications of malnutrition in rural and remote Australian hospitals is unexplored.
What does this paper add? This study reported the highest ever recorded prevalence of malnutrition in Australia, at 48% in 2014; which was associated with increased risk of death. However, in 2019 the prevalence has reduced to 28%, and severe malnutrition was almost eradicated (down to 2%).
What are the implications for practitioners? Although the prevalence of malnutrition decreased over time, the rate of malnutrition in the sampled rural hospitals was consistently high; and was associated with increased risk of in-hospital mortality. Less than 50% of malnourished participants were provided with nutritional supplementation, and non-supplementation was a predictor of poor health-related outcomes in adjusted models, including in-hospital mortality.

Acknowledgements: A great thank you to Bond University statistician Evelyn Rathbone and the staff at Tweed, Murwillumbah, and Byron Bay Hospitals for their support of this study.

Conflicts of Interest: MB is the nutrition and dietetics department manager for the sampled sites and oversaw the implementation of all three cross-sectional studies. MB was not involved in the analysis of results. All other authors declare no existing or potential conflict of interest.

Funding sources: This research did not receive any specific grant from funding agencies in the public, commercial, or not-for-profit sectors.

Author contributions: All authors contributed to the conception of the study. EL and MB contributed to data collection. EL and SM contributed to data analysis. EL drafted the manuscript, and all authors contributed to manuscript revision. All authors approve the final version of the manuscript.

References

1.    Banks M, Ash S, Bauer J, Gaskill D. Prevalence of malnutrition in adults in Queensland public hospitals and residential aged care facilities. Nutrition & Dietetics. 2007;64(3):172-8.
2.    Camilo ME. Disease-related Malnutrition: An Evidence-based Approach to Treatment. Clinical Nutrition. 2003;22(6):585.
3.    Marshall S, Bauer J, Isenring E. The consequences of malnutrition following discharge from rehabilitation to the community: a systematic review of current evidence in older adults. J Hum Nutr Diet. 2014;27(2):133-41.
4.    Marshall S. Protein-energy malnutrition in the rehabilitation setting: Evidence to improve identification. Maturitas. 2016;86:77-85.
5.    Crichton M, Craven D, Mackay H, Marx W, de van der Schueren M, Marshall S. A systematic review, meta-analysis and meta-regression of the prevalence of protein-energy malnutrition: associations with geographical region and sex. Age Ageing. 2018;48(1):38-48.
6.    Agarwal E, Ferguson M, Banks M, Batterham M, Bauer J, Capra S, et al. Malnutrition and poor food intake are associated with prolonged hospital stay, frequent readmissions, and greater in-hospital mortality: results from the Nutrition Care Day Survey 2010. Clin Nutr. 2013;32(5):737-45.
7.    Agarwal E, Marshall S, Miller M, Isenring E. Optimising nutrition in residential aged care: a narrative review. Maturitas. 2016;92:70-8.
8.    Pirlich M, Schütz T, Norman K, Gastell S, Lübke HJ, Bischoff SC, et al. The German hospital malnutrition study. Clin Nutr. 2006;25(4):563-72.
9.    Marshall S. Why is the skeleton still in the hospital closet? A look at the complex aetiology of malnutrition and its implications for the nutrition care team. J Nutr Health Aging. 2018;22:26-9.
10.    Curtis LJ, Bernier P, Jeejeebhoy K, Allard J, Duerksen D, Gramlich L, et al. Costs of hospital malnutrition. Clin Nutr. 2017;36(5):1391-6.
11.    Marshall S, Agarwal E. Comparing characteristics of malnutrition, starvation, sarcopenia and cachexia in older adults. Handbook of famine, starvation, and nutrient deprivation: from biology to policy. 2017:1-23.
12.    Caring for Older Australians, Volume 1. Canberra: Productivity Commission; 2011.
13.    Living Longer. Living Better. Aged Care Reform Package. Canberra: Australian Government Department of Health and Ageing; 2012.
14.    Caring for Older Australians, Volume 2. Canberra: Productivity Commission; 2011.
15.    Von Elm E, Altman DG, Egger M, Pocock SJ, Gøtzsche PC, Vandenbroucke JP, et al. The Strengthening the Reporting of Observational Studies in Epidemiology (STROBE) statement: guidelines for reporting observational studies. Prev Med. 2007;45(4):247-51.
16.    Agarwal E, Ferguson M, Banks M, Vivanti A, Batterham M, Bauer J, et al. Malnutrition, poor food intake, and adverse healthcare outcomes in non-critically ill obese acute care hospital patients. Clinical Nutrition. 2019;38(2):759-66.
17.    Detsky AS, McLaughlin JR, Paker JP, Johnston N, Wittaker S, Mendelson RA, et al. What is subjective global assessment of nutritional status. JPEN. 1987;11:8-11.
18.    Marshall S, Craven D, Kelly J, Isenring E. A systematic review and meta-analysis of the criterion validity of nutrition assessment tools for diagnosing protein-energy malnutrition in the older community setting (the MACRo Study). Clin Nutr. 2018;37(6A):1902-12.
19.    Morris NF, Stewart S, Riley MD, Maguire GP. The burden and nature of malnutrition among patients in regional hospital settings: A cross-sectional survey. Clinical Nutrition ESPEN. 2018;23:1-9.
20.    Allard JP, Keller H, Jeejeebhoy KN, Laporte M, Duerksen DR, Gramlich L, et al. Decline in nutritional status is associated with prolonged length of stay in hospitalized patients admitted for 7 days or more: A prospective cohort study. Clinical Nutrition. 2016;35(1):144-52.
21.    Agarwal E, Ferguson M, Banks M, Batterham M, Bauer J, Capra S, et al. Malnutrition and poor food intake are associated with prolonged hospital stay, frequent readmissions, and greater in-hospital mortality: results from the Nutrition Care Day Survey 2010. Clin Nutr. 2013;32(5):737-45.
22.    Australian coding standards for I.C.D.-10-AM. Sydney: National Centre for Classification in Health; 2008.
23.    Marshall S, Young A, Bauer J, Isenring E. Malnourished older adults admitted to rehabilitation in rural New South Wales remain malnourished throughout rehabilitation and once discharged back to the community: a prospective cohort study Journal of Aging Research and Clinical Practice. 2015;4(4):197-204.
24.    Allard JP, Keller H, Jeejeebhoy KN, Laporte M, Duerksen DR, Gramlich L, et al. Malnutrition at Hospital Admission-Contributors and Effect on Length of Stay: A Prospective Cohort Study From the Canadian Malnutrition Task Force. JPEN J Parenter Enteral Nutr. 2016;40(4):487-97.
25.    Sanson G, Bertocchi L, Dal Bo E, Di Pasquale CL, Zanetti M. Identifying reliable predictors of protein-energy malnutrition in hospitalized frail older adults: A prospective longitudinal study. Int J Nurs Stud. 2018;82:40-8.
26.    Nutrition screening as easy as mna. A guide to completing the Mini Nutritional Assessment (MNA). Swizterland Nestle Nutrition Institute.
27.    Segura A, Pardo J, Jara C, Zugazabeitia L, Carulla J, de las Penas R, et al. An epidemiological evaluation of the prevalence of malnutrition in Spanish patients with locally advanced or metastatic cancer. Clin Nutr. 2005;24(5):801-14.
28.    Konturek PC, Herrmann HJ, Schink K, Neurath MF, Zopf Y. Malnutrition in Hospitals: It Was, Is Now, and Must Not Remain a Problem! Medical science monitor : international medical journal of experimental and clinical research. 2015;21:2969.
29.    Bonetti L, Terzoni S, Lusignani M, Negri M, Froldi M, Destrebecq A. Prevalence of malnutrition among older people in medical and surgical wards in hospital and quality of nutritional care: A multicenter, cross-sectional study. Journal of clinical nursing. 2017;26(23-24):5082-92.
29.    Faul, F., Erdfelder, E., Buchner, A., & Lang, A.-G. (2009). Statistical power analyses using G*Power 3.1: Tests for correlation and regression analyses. Behavior Research Methods, 41, 1149-1160.

VALIDITY OF MALNUTRITION UNIVERSAL SCREENING TOOL (MUST) IN GERIATRIC PATIENTS: APPROPRIATE SCREENING TOOL IN HOSPITAL; MUST OR FULL-MNA?


S. Hormozi1, M. Alizadeh-Khoei2,1, F. Sharifi1, M. Chehrehgosha3, R. Esmaeili4, F. Rezaie-Abhari5, R. Aminalroaya2, Z. Madadi1


1. Elderly Health Research Center, Endocrinology and Metabolism Population Sciences Institute, Tehran University of Medical Sciences, Tehran, Iran;
2. Gerontology & Geriatric Department, Medical School, Tehran University of Medical Sciences, Tehran, Iran; 3. Gerontology Department, University of Social Welfare and Rehabilitation Sciences, Tehran, Iran ; 4. Orthopedic Research Center, Mazandaran University of Medical Sciences, Sari, Iran; 5. Midwifery Department, Nursing and Midwifery School, Mazandaran University of Medical Sciences, Sari, Iran

Corresponding Author: Dr. Mahtab Alizadeh-Khoei, Associated professor of clinical gerontology, Medical school Tehran University of Medical Sciences, and Elderly Health Research Center, Endocrinology and Metabolism Population Sciences Institute, Tehran, University of Medical Sciences, Tel.: +98-21-88220085,  Email: alizadeh-m@sina.tums.ac.ir , mahtabalizadeh@yahoo.com

J Aging Res Clin Practice 2019;8:74-79
Published online October 7, 2019, http://dx.doi.org/10.14283/jarcp.2019.13


Abstract

Abstract: Background: Since malnutrition of geriatric hospitalized patients has an impact on treatment and care management, the aim was to define the accuracy of Malnutrition Universal Screening Test (MUST) for malnutrition screening in the Iranian hospitalized elderly. Methods: In this cross-sectional study elderly 60 ≥ years (N= 192) were selected from two hospitals, anthropometric measures (BMI, MAC, and CC), laboratory test (Albumin), and nutrition tool (Full-MNA) applied and analyzed at P<0.05 level. Results: Elderly participants had a mean age of 68.86 ± 7.46 years and BMI 24.08± 4.64.  Elderly patients (28%) lost their weight (>10%) in the last six months and loss of appetite observed in (33.4%) participants. In MUST tool rating, high-risk elderly patients for malnutrition were 33.3%. The AUC for MUST, according to Full-MNA was obtained 90.41%, with sensitivity 90.0% and specificity 73.25%.  The MUST showed the strongest correlation with Full-MNA (r = -0.7) and BMI (r = – 0.51); but, the lowest correlation observed with Alb (r= -0.274). Most AUC was belonging to weight loss (0.96) and BMI (0.94). NConclusion: The MUST tool like full-MNA could diagnose malnutrition in geriatric patients in the hospital setting.

Key words:  Iranian elderly, Validity, Malnutrition, Hospital, Full-MNA, MUST.


Introduction

Malnutrition in elderly hospitalized patients is often was neglected, because of less priority of malnutrition disorders comparing to other geriatric problems, lack of clinical knowledge in applying appropriate screening tools, and time limitation for staff in geriatric units (1). Older adults due to more hospitalization for illness, injuries, and surgeries, are more at risk of malnutrition that made a loss of Lean Body Mass (LBM). According to a correlation between malnutrition and clinical outcomes, appropriate nutritional screening in the hospital should be done at admission time for geriatric patients by applying validated screening tools (2). Mini Nutritional Assessment (MNA) and Malnutrition Universal Screening Tool (MUST) as valid nutritional screening tools have similarities (3), both need more time to fill and calculating, but MUST tool gives a better estimation for patient’s nutritional status (4)
The MUST tool designed to identify elderly nutritional needs in treatments and finding the correlation between malnutrition statuses and impaired functions (4, 5), also can predict the clinical outcomes in geriatric patients, according to the length of stay in the hospital, and re-hospitalization. Moreover, it’s a subjective clinical instrument that could score with any general expertise (5).
Since the MUST, in comparison with the other nutritional tools is a specific instrument in hospitals to malnutrition screening, our aims were the validity of the Iranian version MUST to detect malnutrition in hospitalized elderly and to discriminate the risk of malnutrition in malnourished geriatric patients.


Materials and Methods

Participants

This study was designed to risk assessment of malnutrition in hospitalized elderly in two general hospitals in Tehran capital city of Iran as a cross-sectional validation study from October 2018 to March 2019. According to inclusion and exclusion criteria and by using a simple random sampling method, a total of 192 elderly patients aged ≥ 60 years, were enrolled in this study. The inclusion criterion was the ability to communicate verbally and participate in an interview. Elderly patients were assessed by a trained nurse and a nutritionist in those hospitals. From all participants were asked to declare if been willing to participate in this study, then only, who filled consent form were included. Also, Patients’ rights and information confidentiality were considered.
All participants  from the point of view mental illness, severe cognitive impairment by Mini-Mental State Examination (MMSE) <23 (6), depression by Geriatric Depression Scale (GDS-15) ≥8 (7), dysphasia, blindness, deafness, terminal illness, confusion, unconsciousness, emergency situations, and inability to give informed consent were evaluated. Bedridden patients or amputation were excluded from the study, due to a limitation in weight measuring.
The project approved by the ethics Committee of Endocrinology and Metabolism Research Institute (EMRI) Tehran University of Medical Sciences (project number EC-1613-00305). In addition, Helsinki statement and the Iranian Ministry of Health and Medical Education guidelines considered in.

Translation process

After permission from the developer, the English version of Malnutrition Universal Screening Tool (MUST) was translated into the Persian language in accordance International Quality of Life Questionnaire (IQOLA) protocol (8). Then, two native Persian translators who were professional in English translated the English version into the Persian language separately, and then in a common reviewing session, they reached an agreement with the two translated texts to the final version tool.
To determine the difficulty in insertion items in the questionnaire, a verified Persian version was given to 10 educated elderly and their informal caregivers, based on 100-mm Linear Analog Scale Assessment (LASA).
The score of 100 represented “Most difficulty “and zero scores “No difficulty” to understand the questions. The mean difficulty accepted level was ≤ 30 scores in the questionnaire. Then, quality of translation in three domains (clarity, the common language applied, and conceptual equivalence) was rated by the two other translators. The quality ≥ 60 scores for each three domain were acceptable (8). Then, the two other translators performed a backward translation. Finally, the backward translation and original English version of MUST were compared through another English specialist.

Data collection

Anthropometry measures were performed for each patient, based on Body Mass Index (BMI), Mid Arm Circumference (MAC), Calf Circumference (CC), waist, full- MNA, and blood test (serum albumin). Some demographic data (age, sex, and medical conditions) and Malnutrition Universal Screening Tool (MUST) were gathered in hospital visits from patients for malnutrition risk assessment (5).
Patients’ weight measures were done with the least possible clothes, without shoes by means of SECA (880 to kg in the nearest decimals)(9). The height was assessed by a portable and freestanding stadiometer, based on the standard method (3). For assessing nutritional status, the unintentional weight loss during last month and the previous 6 months were asked from geriatric patients. Then, the percentage of unintentional weight loss was calculated based on patient reports.
The severity of malnutrition is defined according to one or more following conditions; BMI <18.5 (5, 9), Unwanted weight loss around 5% over the past month and 10% over the past 6 months (9). So, if patients had 5-10% unwanted weight loss within the last six months, they were moderately malnourished (5). If patients were in the age group <65, with BMI >20 or in aged group ≥65 with BMI >22 and had an unintentional weight loss <5% in the last 6 months were considered at risk of malnutrition. Weight loss percentage would use to indicate acute malnutrition, whereas, low BMI would consider as chronic malnutrition (2, 3).
The MAC was measured by a flexible, non-stretched tape to the nearest 0.1 cm, between acromion and olecranon process on the non-dominant arm (10). Serum albumin was evaluated as a blood biomarker of nutritional status with albumin Test Kit (Pars albumin Test Kit, Auto-analyzer, Hitachi 902, Japan), with cutoff level < 3.5 g/DL was considered as malnutrition (10).

Nutritional anthropometric assessment

The applied tools to determine the risk of malnutrition were included full-MMA (3) and MUST.

Malnutrition Universal Screening Tool (MUST)

The MUST is a malnutrition screening tool in geriatric patients in the hospital setting. The MUST measures the BMI status, unintentional weight loss around 5 -10% in previous 3-6 months, and acute illness in a patient, who could not eat over 5 consecutive days. Comparing to the others is an easy tool, has high reliability to detect protein-energy malnutrition and could predict the risk of malnutrition incidence in the future (5).
The maximum MUST score is 6, where 0 point indicates low risk, score =1 as moderate risk, and score ≥ 2 indicates a high risk of malnutrition(11).

Statistical analysis

Descriptive statistics and cross-tabulations were used for diagnostic accuracy in terms of sensitivity, specificity, Positive Predictive Value (PPV), Negative Predictive Value (NPV), and likelihood ratios. The MUST Spearman’s rank correlation coefficients with full-MNA, serum albumin, and BMI considered as a criterion validity to the MUST.
Confidence Intervals (CI) were calculated in 95%. All analyses were considered statistically significance at α < 0.05 levels and performed by STATA 12.
To accuracy in diagnosing of malnutrition in the hospitalized Iranian elderly and compared with the Persian version of full-MNA, we integrated three MUST subgroups to the two subgroups: the one group as low risk and the other as moderate and high risk for malnutrition.
Meanwhile, we integrated the two subgroup of MNA tool: one group as a well-nourished, and the other as Malnutrition and at risk for malnutrition(12, 13). In this study, cut-off points for MUST, full-MNA, BMI, MAC, and CC indices were based on Doroudi., et al., study (28)  albumin cut-off point based on Kuzuya et al., study(10).


Results

A total of 192 patients with mean age 68.86 ± 7.46 years and BMI 24.08± 4.64 studied. Weight loss>10% in the last six months, was observed only in 28% of geriatric inpatients, and loss of appetite were 33.4% (N=32) in the participants. Other characteristics of the elderly participants reported in [Table 1].

Table 1 Characteristics of the hospitalized geriatric patients (n = 192)

Table 1
Characteristics of the hospitalized geriatric patients (n = 192)

MUST: Malnutrition Universal Screening Tool, MNA:  Mini Nutritional Assessment, BMI: Body Mass Index; MAC: Mid-Arm Circumference; CC: Calf Circumference; *MUST, MNA,BMI, MAC, CC categorized based on Doroudi., et al study (33); **Alb:  categorized based on Kuzuya., et al study (32)


According to the rating of MUST, low-risk patients for malnutrition were 34.4% and high-risk elderly patients for malnutrition were 33.3%. While elderly patients 44.8% were well-nourished with the full-MNA tool and 37.5% were at risk for malnourishment. Diagnostic accuracy MUST instrument, according to full-MNA was 83.3%, with sensitivity 90.0% and specificity 73.25% [Table 2].

Table 2 Sensitivity and specificity of the Iranian version MUST

Table 2
Sensitivity and specificity of the Iranian version MUST


The correlation of total MUST score with full-MNA scores, anthropometrical measurements (BMI, MAC, and CC), and serum albumin presented in [Table 3]. The MUST tool were correlated with full-MNA (r=-0.7), and with BMI (r=- 0.51); moreover, the lowest correlation (r=-0.274) observed with Albumin.

Table 3 Correlations between the Iranian version MUST and full-MNA score, anthropometric measurements, and clinical parameter

Table 3
Correlations between the Iranian version MUST and full-MNA score, anthropometric measurements, and clinical parameter


In ROC curve analysis and anthropometric measurements (BMI), clinical parameter (serum albumin), and full-MNA assessing was not found a cut-off point to MUST tool.  The highest sensitivity was obtained in weight loss >10%, BMI<18.5, full-MNA<17, and Alb <3.5, respectively. The highest AUC were belong to weight loss (0.96; 95%CI, 0.94 – 0.98) and BMI (0.94; 95%CI, 0.89 – 0.98) [Fig1].


Figure 1
ROC curve of the Iranian version MUST with MNA, BMI, Alb, Weight loss as criteria for malnutrition detection

FIG 1 ALIZE

a. ROC MUST by Alb


FIG 2 ALIZEH
b. ROC MUST by BMI


FIG 3 ALIZEH
c. ROC MUST by full-MNA

FIG 4 ALIZEH
d. ROC MUST by weight loss


Discussion

In validation study of the Iranian version MUST tool observed the strongest correlation with Full-MNA and BMI but, the lowest correlation observed with Alb. Most AUC was belonging to weight loss and BMI in hospitalized geriatric patients.
A benefit of MUST tool is potential use in nutrition counseling in high-risk geriatric patients and patients’ evaluating with a moderate risk of malnutrition after hospital admission (13).
The MUST tool has applied in cancer patients validation studies (12, 14) and used also for screening patients in different settings (Intensive Care Unit) in other researches (15, 16).
Since validity measurement of a tool cannot be carefully evaluated (15) (), we used several criteria. To prevent feasible errors in use BMI, the other criteria (MAC, CC, full-MNA, and weight loss 3-6 month) and serum albumin, also used to determine sensitivity and specificity as the gold standard to MUST tool in hospitalized elderly. Same as other studies, we also used BMI as a measure of disease-related malnutrition, which is a gold standard to determine under-nutrition in hospitalized elderly patients (10, 16). Results of the present study showed BMI had a high correlation with the MUST malnutrition screening tool same as Zhang study (17); although in reports by Van Tonder, et al., in hospitalized adult patients in South African, there was no significant relationship between BMI and MUST (18). Meanwhile in Intensive Care Unit (ICU) hospitalized elderly, Carvalho et al., (2017) were not observed statistical differences, based on MUST, BMI, and serum albumin between survivors’ elderly patients and non-survivors. As a gold standard, nutritional screening tool (BMI) viewed as important numerical scale and score indicator for nutritional status. Although, there are the other variables also that could be affected by objectivity and quantity, especially in the elderly population; therefore, differences in research results might be, due to variations in clinical settings (outpatients, hospitalization, and nursing homes) (14)
Evaluating of serum albumin for malnutrition screening in hospitalized elderly patients has been reported in some studies. Serum albumin level is a key measurement in protein-energy malnutrition in elderly patients; although, there is still ambiguity about this issue (10).
It should be noted that serum albumin level is often altered in elderly patients with non-nutritional factors such as inflammation, capillary leakage, liver disease, and hydration (14) so, serum albumin interpretation as a malnutrition risk factor would be difficult in elderly patients. According to a study in frail hospitalized patients (19), reported no relationship between albumin and MUST score; our results, also found a weak correlation between the patient’s albumin level and MUST tool. In assessing malnutrition in geriatric hospitalized patients, also a significant difference in albumin between malnutrition group and well-nourished with MUST was reported (2). Serum proteins (albumin and pre-albumin) measuring are widely used by physicians to determine patients’ nutritional status. However, recently the focus is more on physical examination to diagnosis malnutrition in older patients, and since the clinical tests are not reliable alone, should be used them as a compliment with a physical examination by a screening tool (20).
Due to comprehensive geriatric approach to distinguish between malnourished older patients, and at risk of malnutrition, the full-MNA tool could be helpful as one of the MUST validation criteria in the hospital setting (3). The results in present study showed that full-MNA have the best correlation with the MUST. In assessing nutritional status in nursing homes, Doninital et al., reported “Fair” agreement (21) between MNA and MUST (k = 0.270; P< .001). In another study to assess the nutritional status of elderly women with three evaluation tools (MNA, MNA-SF, and MUST), a “Good” agreement between the nutritional assessment tools was reported. Although in a study on elderly nursing home residents in Nuremberg (22) Kappa agreement between MNA and MUST was reported low (κ = 0.16), that might be, due to differences in aged care settings and special conditions in elderly patients.
Malnutrition screening in the older population, due to being heterogeneous group is difficult; meanwhile, disease processes (spinal cord degeneration, edema, infections, and inflammation) can often affect the assessment of malnutrition; therefore, screening approaches before care can be beneficial (23). On the other hand, nutrition screening tests should be able to determine not only the caloric intake but could also determine the severity and possible causes of malnutrition (2), which both MUST and full-MNA tools include this feature.
The anthropometric measurements (CC and MAC) was proposed by Bonnefoy et al., as a relevant parameters to assess nutritional status and malnutrition prediction in hospitalized elderly patients who are require regular monitoring (24). In our study, there was no correlation between CC and MAC with MUST tool; but, Baek and Heo (2015) reported significant differences in MAC and CC parameters with the MUST screening tool, between the two groups (malnutrition and well nourished) in hospitalized geriatric patients (2).
In under-nutrition status, in the low level of metabolism in tissues (subcutaneous fat and skeletal muscle) usually catabolizing increased, that made decreasing MAC more than BMI. Since high infection or severe malnutrition status in both healthy and sick people make increasing catabolism in skeletal muscles (25); so distinguishing between decreased MAC due to malnutrition or disease would be difficult. Therefore, an effective, validated, and practical nutritional screening tool should be fast and simple to facilitate the proper patient’s referral to a nutritionist(3).
In assessing MUST tool, in this study, sensitivity and specificity were observed, with the four criteria (full-MNA, Alb, BMI, and weight loss in the past 3-6 month). Same to our findings, Beak and Heo (2015) also has reported a “Good” validity (sensitivity 80.6% and specificity 98.7%) with the MUST (2); but, we could not find any study to determine the MUST validation with our used measurements (Alb, BMI, and weight loss in past 3-6 month).
In ROC curve analysis with anthropometric measurement (BMI), clinical parameter (serum albumin), and full-MNA, we have not found a cut-off point for the MUST tool. The other similar studies (Floor Neelemaa, 2011 ; Myoung-Ha Baek, 2015 ; Daradkeh, 2018) also have not found a ROC curve (2).
From view the strength, this is the first study to measure the applicability of MUST tool with different anthropometric measurements (MAC, CC, and full-MNA)(16)  and blood criterion (albumin), also in both applied screening tools; the self-report method was not used. The major our limitation was the lack of assessing the elderly patients in both admission and discharge times for gathering nutritional parameters’ information during a hospital stay. Moreover, because of the cross-sectional nature of this research, we could not identify malnutrition outcomes in malnourished subjects and the impact of malnutrition outcomes in re-hospitalization and length of hospital stay.


Conclusion

It seems the MUST tool need a shorter time than the full-MNA and like as full-MNA could be effective in the assessment of nutritional status in elderly hospitalized patients, could distinguish patients at risk of malnutrition from severe malnutrition in hospitalized elderly. Besides, applying anthropometric measures (BMI) and blood measure (serum albumin) recommended at the same time. For further studies, we suggest that the accuracy of the MUST tool in patients undergoing re-admission and the effect of the length of stay of the elderly patient in hospitals should be evaluated.


Funding: This study was supported by Endocrinology and Metabolism Research Institute of Tehran University of Medical Sciences with grant number [1613-99-01-2015].

Acknowledgments: The authors would like to thank contributions of all the patients and members of the team (dieticians, nurses and medical staffs) would appreciate in interviewing with patients.

Conflict of interest statement: The authors state, they have no conflict of interest.

Ethical standard: The study was carried out respecting all applicable confidentiality rules.

References


1.    Waitzberg DL, Caiaffa WT, Correia MI. Hospital malnutrition: the Brazilian national survey (IBRANUTRI): a study of 4000 patients. Nutrition (Burbank, Los Angeles County, Calif). 2001;17(7-8):573-80.
2.    Baek MH, Heo YR. Evaluation of the efficacy of nutritional screening tools to predict malnutrition in the elderly at a geriatric care hospital. Nutrition research and practice. 2015;9(6):637-43.
3.    Young AM, Kidston S, Banks MD, Mudge AM, Isenring EA. Malnutrition screening tools: comparison against two validated nutrition assessment methods in older medical inpatients. Nutrition (Burbank, Los Angeles County, Calif). 2013;29(1):101-6.
4.    van Bokhorst-de van der Schueren MA, Guaitoli PR, Jansma EP, de Vet HC. Nutrition screening tools: does one size fit all? A systematic review of screening tools for the hospital setting. Clinical nutrition (Edinburgh, Scotland). 2014;33(1):39-58.
5.    Stratton RJ, Hackston A, Longmore D, Dixon R, Price S, Stroud M, et al. Malnutrition in hospital outpatients and inpatients: prevalence, concurrent validity and ease of use of the ‘malnutrition universal screening tool’ (‘MUST’) for adults. The British journal of nutrition. 2004;92(5):799-808.
6.    Ansari NN, Naghdi S, Hasson S, Valizadeh L, Jalaie S. Validation of a Mini-Mental State Examination (MMSE) for the Persian population: a pilot study. Applied neuropsychology. 2010;17(3):190-5.
7.    Malakouti SK, Fatollahi P, Mirabzadeh A, Salavati M, Zandi T. Reliability, validity and factor structure of the GDS-15 in Iranian elderly. International journal of geriatric psychiatry. 2006;21(6):588-93.
8.    Fukuhara S, Bito S, Green J, Hsiao A, Kurokawa K. Translation, adaptation, and validation of the SF-36 Health Survey for use in Japan. Journal of clinical epidemiology. 1998;51(11):1037-44.
9.    Neelemaat F, Kruizenga HM, de Vet HC, Seidell JC, Butterman M, van Bokhorst-de van der Schueren MA. Screening malnutrition in hospital outpatients. Can the SNAQ malnutrition screening tool also be applied to this population? Clinical nutrition (Edinburgh, Scotland). 2008;27(3):439-46.
10.    Kuzuya M, Izawa S, Enoki H, Okada K, Iguchi A. Is serum albumin a good marker for malnutrition in the physically impaired elderly? Clinical nutrition (Edinburgh, Scotland). 2007;26(1):84-90.
11.    Rasheed S, Woods RT. Predictive validity of ‘Malnutrition Universal Screening Tool’ (‘MUST’) and Short Form Mini Nutritional Assessment (MNA-SF) in terms of survival and length of hospital stay. e-SPEN Journal. 2013;8(2):e44-e50.
12.    Boleo-Tome C, Monteiro-Grillo I, Camilo M, Ravasco P. Validation of the Malnutrition Universal Screening Tool (MUST) in cancer. The British journal of nutrition. 2012;108(2):343-8.
13.    Sharma Y, Thompson C, Kaambwa B, Shahi R, Miller M. Validity of the Malnutrition Universal Screening Tool (MUST) in Australian hospitalized acutely unwell elderly patients. Asia Pacific journal of clinical nutrition. 2017;26(6):994-1000.
14.    Chao PC, Chuang HJ, Tsao LY, Chen PY, Hsu CF, Lin HC, et al. The Malnutrition Universal Screening Tool (MUST) and a nutrition education program for high risk cancer patients: strategies to improve dietary intake in cancer patients. BioMedicine. 2015;5(3):17.
15.    Power L, Mullally D, Gibney ER, Clarke M, Visser M, Volkert D, et al. A review of the validity of malnutrition screening tools used in older adults in community and healthcare settings – A MaNuEL study. Clinical nutrition ESPEN. 2018;24:1-13.
16.    Leistra E, Langius JA, Evers AM, van Bokhorst-de van der Schueren MA, Visser M, de Vet HC, et al. Validity of nutritional screening with MUST and SNAQ in hospital outpatients. European journal of clinical nutrition. 2013;67(7):738-42.
17.    Zhang Z, Pereira SL, Luo M, Matheson EM. Evaluation of Blood Biomarkers Associated with Risk of Malnutrition in Older Adults: A Systematic Review and Meta-Analysis. Nutrients. 2017;9(8).
18.    van Tonder E, Gardner L, Cressey S, Tydeman-Edwards R, Gerber K. Adult malnutrition: prevalence and use of nutrition-related quality indicators in South African public-sector hospitals. South African Journal of Clinical Nutrition. 2019;32(1):1-7.
19.    Slee A, Birch D, Stokoe D. The relationship between malnutrition risk and clinical outcomes in a cohort of frail older hospital patients. Clinical nutrition ESPEN. 2016;15:57-62.
20.    Bharadwaj S, Ginoya S, Tandon P, Gohel TD, Guirguis J, Vallabh H, et al. Malnutrition: laboratory markers vs nutritional assessment. Gastroenterology report. 2016;4(4):272-80.
21.    Donini LM, Poggiogalle E, Molfino A, Rosano A, Lenzi A, Rossi Fanelli F, et al. Mini-Nutritional Assessment, Malnutrition Universal Screening Tool, and Nutrition Risk Screening Tool for the Nutritional Evaluation of Older Nursing Home Residents. Journal of the American Medical Directors Association. 2016;17(10):959.e11-8.
22.    Diekmann R, Winning K, Uter W, Kaiser MJ, Sieber CC, Volkert D, et al. Screening for malnutrition among nursing home residents – a comparative analysis of the mini nutritional assessment, the nutritional risk screening, and the malnutrition universal screening tool. The journal of nutrition, health & aging. 2013;17(4):326-31.
23.    Green SM, Watson R. Nutritional screening and assessment tools for older adults: literature review. Journal of advanced nursing. 2006;54(4):477-90.
24.    Bonnefoy M, Jauffret M, Kostka T, Jusot JF. Usefulness of calf circumference measurement in assessing the nutritional state of hospitalized elderly people. Gerontology. 2002;48(3):162-9.
25.    Collins S. Using middle upper arm circumference to assess severe adult malnutrition during famine. Jama. 1996;276(5):391-5.

ASSESSING THE IMPACT OF A NUTRITION-FOCUSED QUALITY IMPROVEMENT PROGRAM IN CARDIOPULMONARY PATIENTS


M.R. Costanzo1, S. Kozmic1, S. Sulo2, F. Dabbous1, B. Warren1, J. Partridge2, A. Brown1, K. Sriram1


1. Advocate Health Care, Downers Grove, Illinois, USA; 2. Abbott Nutrition Research & Development, Columbus, Ohio, USA; All authors take responsibility for all aspects of the reliability and freedom from bias of the data presented and their discussed interpretation.

Corresponding Author: Maria Rosa Costanzo, MD, 801 South Washington Street, Naperville, Illinois 60540, Email: mariarosa.costanzo@advocatehealth.com

J Aging Res Clin Practice 2019;8:63-69
Published online August 11, 2019, http://dx.doi.org/10.14283/jarcp.2019.11


Abstract

Background: Patients with cardiopulmonary diagnoses are at high risk for hospital readmissions and prolonged hospitalizations. Nutrition-focused quality improvement programs (QIPs) can improve the care of malnourished hospitalized patients. Objectives: Data collected previously was analyzed to evaluate the impact of a nutrition-focused QIP on health outcomes in patients with cardiopulmonary diseases. Design: The QIP consisted of malnutrition risk screening, prompt initiation of oral nutritional supplements (ONS), and nutrition education. Setting: A total of 4 hospitals implemented the QIP–2 teaching hospitals and 2 community hospitals. Participants: Eligible QIP participants were hospitalized patients with any diagnosis, 18 years of age or older, at risk for malnutrition at admission, and able to consume food and beverages orally. Measurements: Data collected from the QIP patients was compared to data from historical controls to assess differences in readmission rates and length of stay (LOS). Results: Patients were mainly older adults (66 ± 17.4 years) and non-obese (85%). Univariate analysis showed significant reductions in 30-day readmission rates for the QIP group when compared with the controls (13.9% for QIP vs. 26.4% for controls), with the QIP group experiencing a 55% reduction in the odds of being readmitted (OR = 0.45, p = 0.006). Similarly, a significant reduction in LOS was reported for the QIP group (5.4 ± 5.7 days for QIP vs. 6.8 ± 5.7 days for controls) corresponding to a relative risk reduction (RR) of 20% (RR = 0.80, p = 0.0085). Logistic regression adjusting for patient characteristics showed that the QIP patients were 33% less likely to be readmitted (p = 0.33), and had a 6% RR (RR = 0.94, p = 0.55) in LOS versus controls. Conclusions: Malnourished hospitalized cardiopulmonary patients participating in a nutrition-focused QIP experienced fewer readmissions and improved LOS compared to controls. These results underscore the importance of nutrition-focused interventions as a key part of treatment for cardiopulmonary patients.

Key words: Quality improvement, malnutrition, cardiopulmonary, readmission rates, length of stay.


Introduction

Cardiopulmonary patients are at high risk for hospital readmissions and prolonged hospitalizations. About 25% of patients hospitalized with heart failure (HF) are readmitted within 30 days (1-4). Efforts to reduce readmissions after HF hospitalizations have been largely unsuccessful; according to national data, readmission rates for these patients have not dropped significantly during the past two decades (5). Advancements in treatment have improved in-hospital survival for cardiopulmonary patients, resulting in a greater number of survivors being discharged into the community and thus at risk for readmission (6). The hospital length of stay (LOS) for cardiopulmonary patients also remains high at an average of 6.33 days compared to 4.5 days for all patients (7). Risk factors such as advanced age and malnourishment may further extend a patient’s LOS. Studies have shown that the LOS for malnourished patients is double that of their well-nourished counterparts (8), and older patients hospitalized for cardiopulmonary diseases could experience LOS exceeding 12 days (9). In fact, the negative consequences of malnutrition on health outcomes are even more pronounced among older patient populations (65 years and older) who are at higher risk for developing malnutrition as a result of limited dietary intake and diet quality and multiple chronic conditions (10, 11).
Bradley et al. outlined six strategies that hospitals in the United States commonly use to reduce 30-day readmission rates among HF patients (i.e., partnering with community physicians and physician groups, partnering with local hospitals, having nurses responsible for medication reconciliation, arranging for follow-up visits before discharge, having a process in place to send all discharge or electronic summaries directly to the patient’s primary care physician, and assigning staff to follow up on test results after the patient is discharged). However, none of these strategies included nutrition risk assessment and treatment (12), a key omission as malnutrition increases morbidity and mortality, specifically in catabolic state diseases such as HF (13). Malnutrition affects about 50% of patients worldwide upon admission to the hospital (14, 15) and many patients also experience a decline in nutritional status during their hospital stay, leading to higher 30-day readmission rates and prolonged hospitalizations. As a result of this increased healthcare resource utilization, the annual economic burden of disease-associated malnutrition has been found to be approximately $157 billion (in 2010 USD). For chronic obstructive pulmonary disease (COPD) the economic burden is $43.2 billion, while for coronary heart disease the economic burden is estimated to be $23.9 billion (15).
Interventions that decrease hospital readmissions are crucial to improve the quality and lower the cost of care for patients with cardiopulmonary diagnoses, especially the older patient populations. Quality improvement programs (QIP) are an example of these types of interventions that can dramatically improve patient outcomes. A study by Nuckols et al. found that QIPs can successfully improve health outcomes for patients with HF, with an average readmission reduction of 12.1% and a mean net savings to the health system per patient of $972 (16). Nutrition is one area where QIPs can make an impact on patient outcomes. Patients with cardiopulmonary diagnoses often have a number of chronic comorbid conditions, notably diabetes, which complicate their nutrition status and lead to poorer health outcomes (17).
Several studies have found that addressing the nutritional needs of hospitalized patients through QIPs reduces both readmission and LOS (18-19). Therefore, the purpose of this post-hoc analysis was to evaluate the impact of nutrition-focused QIP interventions on 30-day unplanned readmissions and LOS in the cohort of patients with cardiopulmonary diagnoses.


Methods

Eligible QIP participants were hospitalized patients with any diagnosis, 18 years of age or older, at risk for malnutrition (malnutrition scoring tool [MST] score ≥ 2, see Appendix A) at admission, and able to consume food and beverages orally.
The QIP consisted of malnutrition risk screening at admission via electronic medical record (EMR), prompt initiation of oral nutritional supplements (ONS) for at-risk patients, and nutrition education for the inpatients and caregivers. All QIP patients were screened at hospital admission using the MST (20). The EMR was upgraded to trigger appropriate dietitian consultations and selection of standard or disease-specific ONS for all at-risk patients by the admitting nurse as long as there was no physician order to keep the patient nil by mouth. ONS was either ordered by EMR-cue based on MST score or manually by the dietitian. The treatment protocol provided two bottles of ONS daily, delivered with meals. Patients were matched to the ONS formula type per the patient’s overall dietary orders prescribed by the admitting physician (i.e., standard, diabetes-specific, or renal-specific ONS). This study was approved by the Advocate Health Care (AHC) Institutional Review Board. The study is registered with clinicaltrials.gov (NCT02262429). Additional details regarding the study methodology were described by Sriram et al (18).
Data were divided into categories based on diagnosis related groups (DRGs). The cardiopulmonary DRG was the largest group and was comprised of 310 patients. Common cardiopulmonary diagnoses using the International Statistical Classification of Diseases and Related Health Problems – 9th edition (ICD-9) codes identified included HF (ICD 428-428.99), hypertension (ICD 401-401.9, I10, 437.2, 642-642.04), and COPD, a condition which is associated with an increased risk of right ventricular dysfunction, pulmonary hypertension and arrhythmias (ICD 490-496, 500-505, 506.4, J440, J441, J449).
Data collected from the QIP patients was compared to data from a group of historical control patients to assess pre-post group differences in patient outcomes following implementation of the QIP.

Main outcome measures

The two outcome measures used for this analysis were 30-day unplanned readmission (all-cause) and hospital LOS, calculated by subtracting admission day from discharge day.

Statistical analysis

Patient characteristics by group (QIP vs. control) were tabulated. Age was defined in years as the difference in years between date of birth and index admission date. Race was categorized into White, Black, and Other/Unknown. Insurance was categorized as private (including 4 self-insured/other patients) or public. Patients were considered obese if they had a body mass index ≥ 30. Chi-square test for categorical variables and student’s t-test for continuous variables were used to compare the distributions of variables between the QIP and control groups. The two-sample exact Wilcoxon test was used to compare the LOS between QIP and controls. Logistic regression was used to estimate the probability of readmission adjusting for group (QIP vs. control), age in years, gender, race, insurance, obesity, acute myocardial infarction, HF, coronary artery disease, and atrial fibrillation. To compare the LOS between the two groups, generalized linear model with log link and Gamma distribution adjusting for group, age in years, gender, race, insurance, obesity, acute myocardial infarction, HF, coronary artery disease, and atrial fibrillation was performed. All analyses were performed using SPSS 22.0 (SPSS, Chicago, IL). A 2-tailed p level < 0.05 was considered statistically significant.


Results

Of the 310 cardiopulmonary DRG patients, 166 (53.5%) were QIP patients, and 144 (46.5%) were control patients. Information regarding demographic characteristics is reported in Table 1. Compared to the controls, QIP patients were more likely to be female (60.2% vs. 49.3%), White (72.9% vs. 50.7%), and have private insurance (54.8% vs. 24.3%). There were no statistically significant differences between the QIP and control patients in age or obesity, with most patients being older adults (66 ± 17.4 years) and non-obese (85%). In terms of the clinical characteristics, the QIP patients were less likely to have AMI (6.6% vs. 12.5%, p = 0.07) and HF (25.3 vs. 59.7%, p = 0.001). Diabetes and COPD distributions were similar between the two groups. Additionally, the QIP group had 23 (13.9%) patients who were discharged to a skilled nursing facility (SNF) or a rehabilitation program while the control group did not have any patients discharged to these locations.
As 34.2% of the patients were also identified as having diabetes, data was collected on the type of ONS that was ordered for the patient during their hospital admission and are reported in Table 1. In the QIP population, 30 (18.1%) patients received diabetic-specific ONS, 105 (63.3%) patients received general ONS, and 6 (3.6%) patients received renal-specific ONS (p < 0.001). Data regarding ONS type for the control group was missing for most patients (68.1%) as ONS ordering guidelines and documentation standards were not followed consistently prior to the implementation of the QIP.
The 30-day readmission rates and hospital LOS for the QIP and control patients are presented in Table 2. Statistically significant reductions in readmission rates were seen in the QIP versus control group, where QIP patients had a 30-day readmission rate of 13.9% versus 26.4% in the control group. This decrease represents a 55% reduction in the odds of being readmitted in the QIP group relative to the controls (OR = 0.45, [CI 0.25- 0.79], p = 0.006). Similarly, in the adjusted logistic regression model, the QIP patients were 33% less likely to be readmitted compared to the controls (OR = 0.67, [CI 0.34- 1.33], p = 0.24) (Table 3).
LOS was significantly shorter in the QIP than in the control group, where QIP patients had a LOS of 5.4 ± 5.7 days versus 6.8 ± 5.7 days for control patients, corresponding to a relative risk reduction (RR) of 20% (RR = 0.80, [0.67-0.94], p = 0.0085) for the QIP group. However, the RR was 6% after accounting for patient demographic and clinical characteristics (RR = 0.94, [CI 0.77-1.15], p = 0.56) (Table 4).

Table 1 Demographic and Clinical Characteristics of Study Subjects (N = 310)

Table 1
Demographic and Clinical Characteristics of Study Subjects (N = 310)

Abbreviations: SD, Standard Deviation; QIP, Quality Improvement Program; ONS Oral Nutritional Supplement


Table 2 Univariate Comparisons of 30-day Readmission Rate and Length Of Stay

Table 2
Univariate Comparisons of 30-day Readmission Rate and Length Of Stay

Abbreviations: N, Number; OR, Odd Ratio; CI, Confidence Intervals; SD, Standard Deviation; QIP, Quality Improvement Program; RR, Relative Risk


A sensitivity analysis was conducted excluding the 23 patients that were discharged to a SNF or a rehabilitation program in the QIP group. Similar results were observed as compared to the full cohort (n = 310). Statistically significant reductions in readmission rates were again seen in this QIP group versus controls where QIP patients had a 30-day readmission rate of 13.4% versus 26.4% for control patients (p = 0.009) and the adjusted odds ratio was (OR = 0.68, [CI 0.32-1.47], p = 0.33), which represents a 32% RR in readmission rates. LOS was also significantly shorter in this QIP (4.9 ± 5.4 days) versus controls (6.8 ± 5.7), representing a RR reduction of 29% (RR = 0.71, [0.60-0.85], p = 0.0001). However, the RR was 6% after accounting for patient demographic and clinical characteristics (RR = 0.94, [CI 0.77-1.14], p = 0.53) (data not tabulated).

Table 3 Adjusted Logistic Regression for the Probability of 30-day Readmission Rate

Table 3
Adjusted Logistic Regression for the Probability of 30-day Readmission Rate

Abbreviations: N, Number; LCL, Lower Confidence Limit; UCL, Upper Confidence Limit

Table 4 Generalized Linear Model with Gamma Distribution and Log Link to Estimate the Average Length of Stay

Table 4
Generalized Linear Model with Gamma Distribution and Log Link to Estimate the Average Length of Stay

Abbreviations: N, Number; RR, Relative Risk; LCL, Lower Confidence Limit; UCL, Upper Confidence Limit


DISCUSSION

Malnourished hospitalized cardiopulmonary patients participating in a nutrition-focused QIP experienced improved readmission rates and LOS compared to historical control patients. Interventions that result in improved outcomes for cardiopulmonary patients are noteworthy, as this population continues to have unacceptably high readmission rates (1-4, 6). Considering the high prevalence of HF alone, even relatively modest effects of implemented interventions could improve transitions in care for over 850,000 patients per year, reduce the readmission penalty for older patients of any individual hospital (12), and therefore result in significant cost savings for patients and healthcare systems.
Malnourished hospitalized patients with HF tend to have a poorer prognosis than those with an adequate nutritional status, particularly patients 65 years and older who possess a multitude of nutrition risk factors due to the physiological changes of ageing (10). Malnutrition can act as a mediator of disease progression and a predictor of poor prognosis among HF patients, especially for patients in advanced disease stages (21). Nutritional intervention in HF patients however can reduce the risk of death from any cause in addition to reducing the risk of readmission for worsening HF (22). It is therefore important to provide proper nutrition care to patients with cardiopulmonary diseases, and especially older adults with HF to further optimize their health outcomes and aging process.
Prior research has demonstrated that ONS use was associated with reductions in probability of 30-day readmissions by 12.0% in acute MI, and 10.1% in HF. LOS decreases of 10.9% in acute MI and 14.2% in HF were associated with ONS use, as were decreases in hospitalization costs for acute MI and HF of 5.1% and 7.8%, respectively (19). Another study  investigating the impact of ONS administration on Medicare COPD patients found a 13.1% decrease in the probability of 30-day readmissions, a 21.5% decrease in LOS, and a 12.5% hospitalization cost reduction (23). Although ONS use has been found to be associated with improved health and economic outcomes among Medicare patients with a cardiopulmonary diagnosis, ONS alone may not be adequate to reduce readmission rates and/or LOS for all patient groups, especially those with HF. To further optimize nutrition care for adult patients receiving care for cardiopulmonary conditions, similar nutrition-focused QIPs should be further researched together with other ways to improve care that can lead to reduced readmissions, and in particular reduced LOS in this population (23, 24).
This study revealed that a significant portion of the cardiopulmonary patients also had diabetes, thus supporting the use of diagnosis-specific ONS for the QIP patients. Diabetes adds to the complexity of care, and treating physicians need to be aware of the implications of this common comorbid condition. Specifically, clinicians should consider recommending diabetes-specific ONS as part of a comprehensive treatment plan (25, 26).

Study limitations

There are several limitations to this study. The data were collected from the study by Sriram et al. and thus will have similar limitations as documented previously.{18} ONS consumption was not recorded due to staffing and time limits. However, improved outcomes were noted even when assuming that not all patients were compliant with the ordered ONS regimen. Measures to track and increase consumption compliance would likely lead to similar, if not greater, reductions in readmissions and LOS (27). Although our study utilized QIP methodologies that can be subject to bias, QIPs also offer insight into real-world clinical experiences and provide important information about the effectiveness of nutrition programs in clinical practice settings (28). Specific to this study, some differences between the QIP and control groups were noted; a portion of patients in the QIP group were discharged to a SNF or rehabilitation facility. The fact that even these sicker patients experienced fewer readmissions and shorter LOS lends further support to the importance of nutritional therapy in patients with cardiopulmonary diseases. To mitigate the impact of the unbalanced characteristics between the QIP and historical controls, multivariate models were fit. However, it is noteworthy to mention that the study was not powered to detect a statistical difference between the two groups. To detect a statistically significant odds ratio of 0.67 with 80% power, and a 5% significance level, a sample of 1,133 patients equally distributed between QIP and controls would be needed. Furthermore, a sensitivity analysis performed after removal of the patients that were discharged to SNF or rehabilitation facilities showed that the differences between groups in terms of readmissions and LOS remained significant. The sample size of the study also impacted the ability to subdivide this population into specific cardiopulmonary diagnoses groups. A topic for future study could be looking at how these results translate to the three diagnoses specifically – HF, COPD, or MI. As a post-hoc analysis, the outcomes may not be directly attributed to the QIP program; however, at the time of QIP implementation, no other efforts were undertaken in patients at risk for malnutrition (18). Lastly, data on ONS use was missing for a large portion of the historical control patients. This is to be expected as the QIP focused on improving ONS ordering and documentation practices.
This study highlights the importance of real-world evidence methodologies and the potential of QIPs to significantly improve key health outcomes such as 30-day readmissions and LOS among patients with cardiopulmonary diagnoses. However, additional education, awareness, and training on the benefits of nutrition care is needed among the cardiologists and pulmonologists that treat these patients as well as geriatricians to promote better outcomes and healthy aging throughout the different patient populations with HF and especially the older patients. This is particularly important given that the current treatment guidelines do not reflect the importance of nutrition in the cardiopulmonary space. For example, the HF guidelines currently view nutritional supplements as Class III-no benefit (29). However, the results of this study clearly demonstrate a benefit of a comprehensive QIP on hospitalized malnourished cardiopulmonary patients in reducing readmissions and LOS, which could in turn result in significant cost savings. Treatment of malnutrition should be evaluated in the future with QIP-like studies with larger sample sizes and prospective controlled trials (30-35), which may alter the current recommendations, at least in hospitalized malnourished cardiopulmonary patients. In the meantime, these results, which emphasize the importance of nutrition-focused interventions becoming a key part of the comprehensive treatment plan for cardiopulmonary patients by different healthcare providers, should be carefully considered. A conventional, disease-specific perspective may not always lead clinicians to the underlying cause of malnutrition (36). Therefore, nutrition screening/assessment and treatment should be a routine part of care for all cardiopulmonary patients across different settings of care.


Funding: Financial support for the study was provided by Abbott, Chicago, IL, USA. The ClinicalTrials.gov Identifier for this study is: NCT02262429.

Conflicts of interest: Advocate Health Care received funding from Abbott for this research. Drs. Costanzo and Brown have not received any direct funding from Abbott. Dr. Sriram has received consultancy fees from Abbott outside of the present work. Dr. Sulo and Dr. Partridge are employees of Abbott. The other authors have no conflicts of interest to report.

Ethical standard: This study was conducted according to the guidelines laid down in the Declaration of Helsinki and all procedures involving human subjects were approved by the Advocate Health Care Institutional Review Board. Verbal informed consent was obtained from all subjects. Verbal consent was witnessed and formally recorded.

COSTANZO_MOESM1_ESM

References

1.    Hernandez AF, Greiner MA, Fonarow GC, et al. Relationship between early physician follow-up and 30-day readmission among Medicare beneficiaries hospitalized for heart failure. JAMA. 2010;303:1716-1722.
2.      Bueno H, Ross JS, Wang Y, et al. Trends in length of stay and short term outcomes among Medicare patients hospitalized for heart failure, 1993-2006. JAMA. 2010;303:2141-2147.
3.     Jencks SF, Williams MV, Coleman EA. Rehospitalizations among patients in the Medicare fee-for-service program. N Engl J Med. 2009;360:1418-1428.
4.     Simmering JE, Polgreen LA, Comellas AP, Cavanaugh JE, Polgreen PM. Identifying patients with COPD at high risk of readmission. Chronic Obstr Pulm Dis. 2016;3(4):729-738.doi:http://doi.org/10.15326/jcopdf.3.4.2016.0136
5.     Chen J, Normand SL, Wang Y, Krumholz HM. National and regional trends in heart failure hospitalization and mortality rates for Medicare beneficiaries, 1998-2008. JAMA. 2011;306:1669-1678.
6.     Dunlay SM, Weston SA, Killian JM, Bell MR, Jaffe AS, Roger VL. Thirty Day Hospital Readmissions Following Acute Myocardial Infarction: A Community Study. Ann Intern Med. 2012;157(1):11–18. doi:10.7326/0003-4819-157-1-201207030-00004
7.     Weiss AJ, Elixhauser A. Overview of Hospital Stays in the United States, 2012. HCUP Statistical Brief #180. 2014; Agency for Healthcare Research and Quality, Rockville, MD. http://www.hcup-us.ahrq.gov/reports/statbriefs/sb180-Hospitalizations-United-States2012.pdf
8.     Barker L, Gout S, Crowe, T. Hospital Malnutrition: Prevalence, Identification and Impact on Patients and the Healthcare System. Int J Environ Res Public Health. 2011;8(2):514–527.
9.     Statistics on Hospital Stays and Hospital Readmission using 2013 National Statistics, Healthcare Cost and Utilization Project (HCUP), Agency for Healthcare Research and Quality, Rockville, MD.
10.     Sheean P, Farrar IC, Sulo S, Partridge J, Schiffer L, Fitzgibbon M.  Nutrition risk among an ethnically diverse sample of community-dwelling older adults.  Public Hlth Nutr. 2019;22(5):894-902.  doi:10.1017/S1368980018002902.
11.     McKeever L, Farrar IC, Sulo S, Partridge J, Sheean P, Fitzgibbon M.  Nutritional adequacy and oral nutritional supplementation in older community-dwelling adults. J Aging Res Clin Pract. 2019;8:7-14.
12.     Bradley EH, Curry L, Horwitz LI, et al. Hospital strategies associated with 30-day readmission rates for patients with heart failure. Circulation: Cardiovasc Qual Outc. 2013;6:444-450.https://doi.org/10.1161/CIRCOUTCOMES.111.000101.
13.     Doehner W, Frenneaux M, Anker SD. Metabolic Impairment in Heart Failure The Myocardial and Systemic Perspective. JACC. 2014;64(13):1389-1400.
14.     Roller RE, Eglseer D, Eisenberger A, Wirnsberger GH. The Graz Malnutrition Screening (GMS): a new hospital screening tool for malnutrition. Br J Nutr. 2016;115(4):650-7.
15.     Snider JT, Linthicum MT, Wu Y, et al. Economic burden of community-based disease-associated malnutrition in the United States. JPEN. 2014;38(2):77S-85S.
16.     Nuckols TK, Keeler E, Morton S, et al. Economic Evaluation of Quality Improvement Interventions Designed to Prevent Hospital Readmission: A Systematic Review and Meta-analysis. JAMA Intern Med. 2017;177(7):975–985.doi:10.1001/jamainternmed.2017.1136
17.     Leon BM, Maddox TM. Diabetes and cardiovascular disease: Epidemiology, biological mechanisms, treatment recommendations and future research. World J Diabetes. 2015;6(13):1246–1258.
18.     Sriram K, Sulo S, VanDerBosch G, et al. A comprehensive nutrition-focused quality improvement program reduces 30-day readmissions and length of stay in hospitalized patients. J Parenter Enteral Nutr. 2017;41(3):384-391.
19.     Lakdawalla DN, Snider JT, Perlroth DJ, et al. Can Oral Nutritional Supplements Improve Medicare Patient Outcomes in the Hospital? Forum for Health Economics & Policy. 2014;17(2):131-151.doi:10.1515/fhep-2014-0011
20.     Ferguson M, Capra S, Bauer J, Banks M. Development of a valid and reliable malnutrition screening tool for adult acute hospital patients. Nutrition. 1999;15(6):458-64.
21.     Agra Bermejo RM, González Ferreiro R, Varela Román A, et al. Nutritional status is related to heart failure severity and hospital readmissions in acute heart failure. Int J Cardiol. 2017;230:108-114.doi:10.1016/j.ijcard.2016.12.067
22.     Bonilla-Palomas JL, Gámez-López AL, Castillo-Domínguez JC, et al. Nutritional Intervention in Malnourished Hospitalized Patients with Heart Failure. Arch Med Res. 2016;47(7):535-540.doi:10.1016/j.arcmed.2016.11.005
23.     Thornton Snider J, Jena AB, Linthicum MT, et al. Effect of Hospital Use of Oral Nutrition Supplementation on Length of Stay, Hospital Cost, and 30-Day Readmissions Among Medicare Patients With COPD. CHEST. 2015;147(6):1477-1484.
24.     Babb EB, Rohrer J. Oral nutritional supplement use in relation to length of stay in heart failure patients at a regional medical center. J Eval Clin Pract. In press.doi:10.1111/jep.12762.
25.     Whitman D. Nutrition management of diabetes in acute care. Can J Diabetes. 2014;38(2):90-3.doi:10.1016/j.jcjd.2014.01.00
26.     Swift CS, Boucher JL. Nutrition therapy for the hospitalized patient with diabetes. Endocr Pract. 2006;12(3):61-7.
27.     Sriram K, Sulo S, Summerfelt WT. Author Response. J Parenter Enteral Nutr. 2017;41(4):528-529.
28.     Drazen JM, Harrington DP, McMurray JJV, Ware JH, Woodcock J. Evidence for health decision making – Beyond randomized, clinical trials. NEJM. 2017;377(5):465-475.
29.     Yancy CW, Jessup M, Bozkurt B, et al. 2013 ACCF/AHA guideline for the management of heart failure: a report of the American College of Cardiology Foundation/American Heart Association Task Force on Practice Guidelines. 2013;62(16):e147-239.
30.     Azuma J, Sawamura A, Awata N. Usefulness of taurine in chronic congestive heart failure and its prospective application. Jpn Circ J. 1992;56:95–9.
31.     Fazio S, Sabatini D, Capaldo B, et al. A preliminary study of growth hormone in the treatment of dilated cardiomyopathy. N Engl J Med. 1996; 334:809–14.
32.     Ferrari R, De Giuli F. The propionyl-L-carnitine hypothesis: an alternative approach to treating heart failure. J Card Fail. 1997;3:217–24.
33.     Ghatak A, Brar MJ, Agarwal A, et al. Oxy free radical system in heart failure and therapeutic role of oral vitamin E. Int J Cardiol. 1996;57:119–27.
34.     Hamilton MA, Stevenson LW. Thyroid hormone abnormalities in heart failure: possibilities for therapy. Thyroid. 1996;6:527–9.
35.     Soja AM, Mortensen SA. Treatment of congestive heart failure with coenzyme Q10 illuminated by meta-analyses of clinical trials. MolAspects Med. 1997;18:159–68.
36.     Evans C. Malnutrition in the elderly: a multifactorial failure to thrive. Perm J. 2005; 9(3): 38–41.

EVALUATION OF INPATIENTS’ NUTRITIONAL STATUS AND PROGNOSTIC INVOLVEMENT


J. Ares Blanco1,*, L. Moreno Díaz1, E. Fernández-Fernández1, A.J. López-Alba1


1. Endocrinology and Nutrition section, Hospital of Jove, Gijón; * Principality of Asturias Health Investigation Institute (ISPA)

Corresponding Author: Jessica Ares Blanco, C/ Bernardino Guardado 30, 33403 Avilés Asturias, Spain, Tel 652157275, jessiaresb@gmail.com.

J Aging Res Clin Practice 2019;8:15-19
Published online January 24, 2019, http://dx.doi.org/10.14283/jarcp.2019.3


Abstract

Background: There is an association between malnutrition and mortality. However, it is unclear if this association is truly independent of confounding factors. Objectives: The objective of this study is to evaluate nutritional status, defined according to the three categories defined in the Nutritional Screening Tool “Mini Nutritional Assessment”, and to investigate its prognostic involvement. Design, Setting and Participants: Single cohort retrospective observational study in hospitalized patients between December 2013 and January 2014, who were placed under observation until September 2015 (21 months) (n=144). Nutritional status was determined by MNA short form at the beginning of the study, as well as clinical and epidemiological data. Results: Based on categories defined by MNA SF, 59 (40.97%) were well nourished, 55 (38.19%) were at risk of malnutrition, and 30 (20.83%) patients showed malnutrition. 45 patients died during follow up (31.25%). Of them, 40% (18) were malnourished, 38% (17), at risk of malnutrition, and 22% (9), well nourished. After adjusting for confounding factors, hazard ratio (95% CI) for all-cause mortality was significantly greater in the malnourished group (3.44 (1,27-9,31: p 0,015)), comparing to the reference group (well-nourished patients). Conclusions: Nutritional status defined according to the 3 categories defined in MNA short form predicts the probability of mid-term death in hospitalized patients, after adjusting for confounding factors as age and comorbidities. These data show the importance of knowing nutritional status during hospitalization for avoiding potential complications and helping the patient to overcome them

Keywords: Malnutrition, nutrition screening tool, survival, comorbidities, elderly.


Introduction

It is widely described that there is a direct relationship between malnutrition and life expectance in elderly people (1). In fact, in Europe one out of three elderly patients who is admitted to the hospital shows malnutrition (2-4). This leads to longer hospital stays, higher number of hospital admissions and functional cognitive impairment (5, 6).
European Society for Clinical Nutrition and Metabolism (ESPEN) has defined malnutrition as a complex interaction between consequences of and underlying disease and its metabolic disturbance, and reduction of availability of nutrients (reduction of food intake and/or its absorption and/or increased losses) or a combination of them (7).
A review article published in 2012 about nutritional screening in hospitalized patients concluded that malnutrition was associated with increased mortality (8), although it is still unclear if this association is independent of confounding factors such as age and comorbidities.
On the recommendation of ESPEN (9), the most used nutritional screening tool in elderly people is MNA (2, 8). To facilitate data collection, we used MNA short form, which was based on the former tool, and validated in 2009 (10). According to the score, population is divided in 3 groups: well nourished ((≥12), at risk of malnutrition (8-11), and malnourished ((≤7)
The objective of the study is to confirm the importance of nutritional status in hospitalized patients as an independent prognostic factor, having previously adjusted for confounders (Charlson comorbidity index).


Methods

Study design and participants

Cohort of hospitalized patients in Jove Hospital between December 2013 and January 2014, who were placed under observation until September 2015 (21 months) (n=144). Nutritional status (based on MNA short form) and epidemiological and clinical data were determined.
Jove Hospital is located in Gijón, Asturias, and is provided with 261 beds, mostly distributed in the departments of Internal Medicine, General Surgery, Gynecology and Orthopedics.
The study was approved by the ethics committee of the hospital. Informed consent was obtained from the patient prior to testing.

Data collection

The initial phase of the project (December 2013-January 2014) collected baseline nutritional status during hospitalization determined by MNA short form (table 1). This tool consist of 6 items and classifies patients in 3 categories depending on nutritional status: 0-7 malnutrition, 8-11 at risk of malnutrition, and 12-14 well-nourished. In order to analyze the relationship between nutritional status and mortality, digital medical history was consulted (Selene®), according to our hospital protocol. During hospital stay, we collected data about comorbidities associated to the cause of hospitalization according to CIE-10 classification, as well as anthropometrical characteristics like weight, height or body mass index (BMI). The second phase of the study took place in September 2016, when cohort’s vital state was determined (through direct visualization in Selene®). We also searched for the number of hospital readmissions and emergency visits.

Table 1 Nutritional Screening Tool: MNA Short Form, performed in this study

Table 1
Nutritional Screening Tool: MNA Short Form, performed in this study

Screning Score: maximum 14 points 12-14 points: Normal nutritional status 8-11 points: At risk of malnutrition; 0-7 points: Malnourished


Statistical analysis

The main objective of this study was to examine the association between nutritional status according to MNA (malnourished, at risk of malnutrition and well-nourished) and survival during follow up. Time to death was calculated from the date MNA was done and the time of death.
Regarding descriptive statistics, data from categorical variables have been shown as frequencies and percentages (%), while discrete and quantitative variables have been shown as arithmetical medias and standard deviations.
Differences between the three groups were analyzed in Pearson test for categorical variables, Kruskal-Wallis for quantitative discrete variables and ANOVA for continuous quantitative variables.
The hazard ratio for median overall survival was calculated using the Cox regression model. Nutritional status was included as a categorical variable with 3 levels: well-nourished, at risk of malnutrition and malnourished. As confounding factors, age and Charlson comorbidity index (ChCI) were included.   ChCI comprises 17 comorbidity categories obtained through anamnesis and/or the patient’s medical history. Each category was assigned a score based on 1-year mortality risk. Patient’s score was the result of the sum of comorbidities contemplated in ChCI.
Cox regression model was conducted in two steps. First step was comprised of nutritional status and possible confounders (age, ChCI, sex, BMI). Age and BMI were considered quantitative continuous variables; ChCI and sex, quantitative discrete. Thus, statistically significant variables (age and ChCI) were included in second step, using a multivariable logistic statistical model. Data were analyzed by IBM SPSS Statistics v 21.0®.


Results

Patient’s characteristics

144 patients were first evaluated. Average age was 67.8±2.9 years, with female predominance (54.1%).
Patients hospitalized in Short Stay Unit were excluded.
Table 1 shows baseline characteristics related to previous nutritional status. According to basal MNA, 59 (40.97%) were well nourished, 55 (38.19%) were at risk of malnutrition and 30 (20.83%) were malnourished. Malnourished patients were statistically older, with lower body mass and Barthel Indexes, and higher comorbidity index according to Charlson Classification.
Re-evaluation of our population showed greater number of readmissions in the group of patients with MNASF lower than 7, not statistically significant. Malnourished patients showed longer hospital stays (including subsequent admissions). Due to small sample size, this differences did not reach statistical significance (Table 2).

Figure 1 Survival curve determined by nutritional status adjusted for confounders

Figure 1
Survival curve determined by nutritional status adjusted for confounders


Table 2 Baseline clinical and anthropometrical characteristics during follow-up

Table 2
Baseline clinical and anthropometrical characteristics during follow-up


Survival analysis

Follow-up period was 21 months. Over that time, 45 patients died (31.25%). Survival rate was different depending on nutritional status. For well-nourished people, it was 78%; malnourished, 60%, and at risk of malnutrition, 62% (p<0.001).
The hazard ratio (HR) (95% CI) for all-cause mortality was calculated using the univariate Cox regression model. For people at risk of malnutrition, it was  2.47 (0.91-6.76) (p 0.077); malnourished, 6.44 (2.34-17.72), compared to well-nourished patients (reference group).
After adjusting for confounders (age and ChCI) in a multivariate Cox regression model, HR (95% CI) for all-cause mortality was significantly higher in malnourished group: 3.44 (1.27-9.31: p 0.015), compared to reference group. These data are shown on Figure 1.


Discussion

From a physical point of view, malnutrition can result in loss of muscle and fat mass, reduction of respiratory musculature and cardiac function, and organ atrophy (11-13). 15% of unintended weight loss can result in reduction of muscle and respiratory strength, while a 23% loss is associated with a 70% decrease of physical abilities, 30% decrease of muscle mass and 30% increase in depression incidence (14).
From a psychological point of view, malnutrition is associated with asthenia and apathy, which leads to a delay in the disease recovery and further exacerbates anorexia and increases time for convalescence (13).
It is widely described that malnutrition is associated with an increase of hospital stay (15, 16). As stated in an US study about hospitalized patients for a minimum of 7 days with the aim to studying the negative impact of hospital stay in nutritional status. Results showed that patients who were malnourished at the time of admission and those who experienced deterioration in their nutritional status had longer hospital stays (an average of 4 extra days) than patients who were well nourished at the time of admission and discharge (17). Similarly, an Australian study found statistically significant differences between hospital stays of malnourished and well-nourished patients (5 days extra) (18).
PREDyCES® (19) study was developed in 2011 and included 1,576 patients attended at 31 health centers in the Spanish National Health System. According to this study, 23.7% of patients showed malnutrition at the time of hospital admission (using NRS-2002 screening tool). This percentage is similar to that found in our study, which also shows longer hospital stay in malnourished patients.
Therefore, we can interpret that, as in this metacentric study, expenditure per patient is increased according to nutritional status.
Despite evidence indicates that nutritionally-compromised patients suffer from more complications during hospital stay, it is difficult to isolate the influence of confounders and demonstrate that malnutrition on its own is related to increase of mortality. The fact that numerous international studies, in a wide variety of groups of patients and areas, describe similar findings, reinforces the idea that malnutrition consists in a decrease in survival. Thus, health authorities must concern population nutritional status.
According to our data, we can finally state that nutritional status acts as an independent risk factor for mortality (having previously adjusted by comorbidities and age).
Main weakness of this study is sample size, as hospital characteristics did not allow larger sample size. In fact, we were successful in knowing data of 80% inpatients in that moment (261 beds).
Malnutrition prevalence resulted in 20% of inpatients analyzed. There are multiple causes of malnutrition at hospital, those regarding hospitalization, disease itself, lack of dietitians or a Hospital Nutrition Unit, as occurs in our case (20).
There are several studies published about the relationship between malnutrition and mortality, most them being made without Logistical regression (5, 21-23), and only reporting hospital mortality, but two studies, the one published by Söderström et al (23) in 2014, which directly relates malnutrition in 1,767 patients aged 65 or over, and increase of 50-month mortality (HR 3.71 (2.28-6.04)); and other retrospective Australian study of 476 patients which found a HR for malnourished group of 3.4 (1.07-10.87), having previously adjusted for comorbidities at the time of admission (24). Moreover, a small Scandinavian study with prospective data analyzed 3 categories in MNA to predict malnutrition in 101 hospital inpatients aged 65 or more. After adjusting for age, sex and Charlson Comorbidity Index, they did not find any association between malnutrition and mortality after one year follow-up (25).


Conclusion

Our results show that performing nutritional screening at the time of hospital admission is a useful tool to determine the probability of having complications and poor outcome in a short period of time.
According to our data, MNA short form can be considered as a valid test to differentiate which patients are well-nourished from malnourished. There is no big difference between being at risk of malnutrition and malnourished regarding mortality.
We believe that we must encourage health authorities to worry more about this fact, by improving the access to nutritional screening tools in every hospital in order to provide the best patient care and decrease further costs.


Acknowledgements: I express my gratitude to Dr. López Alba for giving me the opportunity to do this study, and to Nutricia (particularly, Gonzalo Álvarez), for the resources they provided.

Funding: This study has been funded by Nutricia®.

Conflict of interest: This study has been funded by Nutricia®, but it has not been observed any attempt to access to confidential information by them.

This manuscript has been presented as a poster in SENPE (Sociedad Española de Nutrición Enteral y Parenteral) 2016 congress.

Ethical standard: All procedures followed were in accordance with the ethical standards of Jove Hospital and with the Helsinki Declaration of 1975, as revised in 2000. Informed consent was obtained from all patients for being included in the study.


References

1.    Norman K, Pichard C, Lochs H, Pirlich M. Prognostic impact of disease-related malnutrition. Clin Nutr 2008;27(1):5-15.
2.     Guigoz Y. The Mini Nutritional Assessment (MNA) review of the literature. What does it tell us? J Nutr Health Aging 2006;10(6):466-85.
3.     Kaiser MJ, Bauer JM, Ramsch C, Uter W, Guigoz Y, Cederholm T, et al. Frequency of malnutrition in older adults: a multinational perspective using the mini nutritional assessment. J Am Geriatr Soc 2010;58(9):1734-8.
4.     Meijers JM, Schols JM, van Bokhorst-de van der Schueren MA, Dassen T, Janssen MA, Halfens RJ. Malnutrition prevalence in The Netherlands: results of the annual Dutch national prevalence measurement of care problems. Br J Nutr 2009;101(3):417-23.
5.     Amaral TF, Matos LC, Teixeira MA, Tavares MM, Alvares L, Antunes A. Undernutrition and associated factors among hospitalized patients. Clin Nutr 2010;29(5):580-5.
6.     Saka B, Kaya O, Ozturk GB, Erten N, Karan MA. Malnutrition in the elderly and its relationship with other geriatric syndromes. Clin Nutr 2010;29(6):745-8.
7.     Muscaritoli, M.; Anker, S.D.; Argiles, J.; Aversa, Z.; Bauer, J.M.; Biolo, G.; Bioirie, Y.; Bosaeus, I.; Cederholm, T.; Costelli, P.; Fearon, K.C.; Laviano, A.; Maggio, M.; Rossi Fanelli, F.; Schneider, S.M.; Schols, A.; Sieber, C.C. Consensus definition of sarcopenia, cachexia and pre-cachexia: Joint document elaborated by Special Interest Groups (SIG) ―cachexia-anorexia in chronic wasting diseases‖ and ―nutrition in geriatrics‖. Clin. Nutr. 2010, 29, 154-159.
8.     Dent E, Visvanathan R, Piantadosi C, Chapman I. Nutritional screening tools as predictors of mortality, functional decline, and move to higher level care in older people: a systematic review. J Nutr Gerontol Geriatr 2012;31(2):97-145.
9.     Kondrup J, Allison SP, Elia M, Vellas B, Plauth M. ESPEN guidelines for nutrition screening 2002. Clin Nutr 2003;22(4):415-21.
10.     Kaiser MJ, Bauer JM, Ramsch C, et al. Validation of the Mini Nutritional Assessment Short-Form(MNA®-SF): A practical tool for identification of nutritional status. J Nutr Health Aging. 2009;13: 782-788
11.     Chandra, R.K. Nutrition and the immune system: an introduction. Am. J. Clin. Nutr. 1997, 66, 460S-463S.
12.     Holmes, S. The effects of undernutrition in hospitalised patients. Nurs. Stand. 2007, 22, 35-38.
13.     Kubrack, C.; Jensen, L. Malnutrition in acute care patients. Int. J. Nurs. Stud. 2007, 44, 1036-1054.
14.     Allison, S.P. Malnutrition, disease and outcome. Nutrition 2000, 16, 590-593.
15.     Braunschweig, C.; Gomez, S.; Sheean, P.M. Impact of declines in nutritional status on outcomes in adult patients hospitalized for more than 7 days. J. Am. Diet. Assoc. 2000, 100, 1316-1322
16.     Thomas, D.R.; Zdrowski, C.D.; Wilson, M.-M.; Conright, K.C.; Lewis, C.; Tariq, S.; Morley, J.E. Malnutrition in subacute care. Am. J. Clin. Nutr. 2002, 75, 308-313.
17.     Kruizenga, H.M.; Tulder, M.W.V.; Seidell, J.C.; Thijs, A.; Ader, H.J.; van Bokhurst-de van der Schueren, M.A.E. Effectiveness and cost-effectiveness of early screening and treatment of malnourished patients. Am. J. Clin. Nutr. 2005, 82, 1082-1089.
18.     Middleton, M.H.; Nazarenko, G.; Nivison-Smith, I.; Smerdely, P. Prevalence of malnutrition and 12-month incidence of mortality in two Sydney teaching hospitals. Int. Med. J. 2001, 31, 455-461.
19.     J. Álvarez-Hernández , M. Planas Vila , M. León-Sanz , A. García de Lorenzo , S. Celaya-Pérez , P. García-Lorda , K. Araujo , B. Sarto Guerri. Prevalence and costs of malnutrition in hospitalized patients; the PREDyCES® Study. Nutr Hosp. 2012; 27(4):1049-1059
20.     Ulibarri JI, Burgos R, Lobo G, Martínez MA, Planas M, Péres de la Cruz A, et al. Recomendaciones sobre la evaluación del riesgo de desnutrición en los pacientes hospitalizados. Nutr Hosp 2009; 24(4): 467-472
21.     Donini LM, Savina C, Rosano A, De Felice MR, Tassi L, De Bernardini L, et al. MNA predictive value in the follow-up of geriatric patients. J Nutr Health Aging 2003;7(5):282-93.
22.     Van Nes MC, Herrmann FR, Gold G, Michel JP, Rizzoli R. Does the Mini Nutritional Assessment predict hospitalization outcomes in older people? Age Ageing 2001;30(3):221-6.
23.     Lisa Söderström a,b,*, Andreas Rosenblad a,d, Eva Thors Adolfsson a,e, Anja Saletti b, f,Leif Bergkvist. Nutritional status predicts preterm death in older people: A prospective cohort study. Clinical Nutrition 33 (2014) 354-359
24.    Charlton K, Nichols C, Bowden S, Milosavljevic M, Lambert K, Barone L, et al. Poor nutritional status of older subacute patients predicts clinical outcomes and mortality at 18 months of follow-up. Eur J Clin Nutr 2012;66(11):1224-8
25.     Holst M, Yifter-Lindgren E, Surowiak M, Nielsen K, Mowe M, Carlsson M, et al. Nutritional screening and risk factors in elderly hospitalized patients: association to clinical outcome? Scand J Caring Sci. 2013 Dec;27(4):953-61

THE NOVEL FRAILTY INDEX (NFI) CORRELATES WITH A VALUE OF PHASE ANGLE AND MNA IN HOSPITALISED AND FREELIVING ELDERLY – PRELIMINARY REPORT


E. Wernio1, J.A. Dardzińska1, H. Kujawska-Danecka2, A. Hajduk2, Z. Zdrojewski2, S. Małgorzewicz1


1. Department of Clinical Nutrition and Dietetics, Medical University of Gdańsk, Poland; 2. Department of Internal Medicine, Connective Tissue Diseases and Geriatrics, Medical University of Gdańsk, Poland

Corresponding Author: Jolanta Anna Dardzińska M.D., Ph. D. Department of Clinical Nutrition, Medical University of Gdańsk, Dębinki St. 7, 80-211 Gdańsk, Poland, e-mail: annadar@gumed.edu.pl, Tel/Fax: +48 58 349 27 23

J Aging Res Clin Practice 2018;7:123-127
Published online October 15, 2018, http://dx.doi.org/10.14283/jarcp.2018.21


Abstract

Introduction: To improve the quality of life and health of the elderly, attention is paid to the early detection of frailty syndrome. Unfortunately, one simple and practical screening tool has not been established yet. Recently came the proposal of the Novel Frailty Index (NFI) created by Yamada and Arai. Therefore, the purpose of this study was to assess the relationship between nutritional status and NFI of the elderly. Materials and methods: In a group of 67 elderly patients (27 hospitalised and 40 living in the home environment) we used the NFI and evaluated nutritional status with the use of full-MNA together with SNAQ (appetite questionnaire), manual dynamometry and bioimpedance analysis. Results: Based on the NFI results, frailty syndrome was diagnosed in more than half of hospitalised elderly. The syndrome was significantly less prevalent in free-living older people (15% vs 63%, p<0.001).We found the significant correlations of NFI values with age (r=0.031, p=0.03), co-morbidity(r=0.295, p=0.016), phase angle (r=-0.407, p<0.001), full-MNA score (r=-0.515, p<0.001). Conclusions: Our preliminary results suggest the relevant association between NFI results and age, phase angle as well comorbidity and nutritional status. So further evaluation of NFI as a screening tool for frailty syndrome diagnose is needed.

Key words: Novel frailty index, elderly, nutritional status, malnutrition.

Abbreviations: BIA: Bioelectrical impedance analysis; BMI: Body Mass Index; ESPEN: European Society for Clinical Nutrition and Metabolism; MNA: Mini Nutritional Assessment; MM: Muscle mass; MMI: Muscle mass index; NFI: the Novel Frailty Index by Yamada and Arai; SNAQ: Simplified Nutritional Appetite Questionnaire.


Introduction

The life expectancy is constantly increasing. By the end of 2014, the number of people reaching the advanced age constituted 22.2% of the Polish population. This percentage will increase and probably in 2050 more than 40% of all Poles will reach at least 60 years (1). To the important medical problems in the elderly populations belong also the frailty syndrome. It has recently attracted the attention of both scientists and clinicians. Unfortunately, there is still lacking a widely accepted definition of this state and, what is even more important, simple criteria for recognition (2). Recently a new tool to screen for frailty was developed by Yamada and Arai.  It is the 5-question self-report questionnaire, that includes nutrition/shrinking, physical function, physical activity, forgetfulness and emotion/exhaustion.  The answers are scored 0/1 points, so the total score is from 0 to 5 points.  Obtaining 3 or more points by the respondent is intended for the presence of the frailty syndrome (3). The new index was presented at the ESPEN (European Society for Clinical Nutrition and Metabolism) Congress in 2016 by Suzuki et al. as Novel Frailty Index (NFI) and frailty assessment based on it was associated with malnutrition and predicted prognosis in outpatients with chronic heart failure (4).
The inseparable characteristics of the frailty syndrome include the risk of developing malnutrition or existing malnutrition and related loss of muscle mass and function. For many years, the MNA has met expectations for a simple, useful tool for assessing the nutritional status of the elderly in clinical practice (5).  Both parts of MNA (Short Form and Assessment) are characterised by high sensitivity and specificity (6).
So the aim of our study was to compare the results of the NFI evaluation with the effects of the traditional nutritional assessment using the Full-MNA, SNAQ, manual dynamometry and bioimpedance analysis in the group of elderly people.


Material

The study group consisted of 67 elderly patients, including 27 patients hospitalised at the clinical hospital in Gdańsk, in the Department of Pneumology and Allergology and in the Department of Geriatrics. The control group was composed of 40 healthy volunteers in age >65 years old. The study was conducted in October 2016 y.
In Table 1 the characteristic of the study group is presented.

Table 1 Characteristics of the studied population

Table 1
Characteristics of the studied population

Legend: BMI-body mass index.


The average age of hospitalised elderly was notably higher compared to those living in the environment (73.9 vs 69.0,  p=0.012), they had also more chronic disease than control group (3 vs 2, p=0.006) (Tab.1).
Main causes of hospitalisation of studied group were chronic obstructive pulmonary disease (in 25% of women, 53% of men). The other reasons for admitting to a hospital ward were hypertension (in 17% of women, 8% of men), diabetes type 2 (in 17% of women and 17% of men), asthma (in 17% of women, 8% of men). Furthermore, in the female group – psoriasis (7%), acute myeloid leukaemia (7%), Sjögren’s syndrome (7%) and in male group coronary artery disease (8%), rheumatic polymyalgia (8%) constituted reasons for hospitalisation.
Free-living elderly suffered mainly from hypertension (in 57% of women, 80% of men), hypercholesterolemia (in 43% of women, 30% of men), coronary artery disease (in 7% of women, 10% of men), hypothyroidism (in 17% of women). In addition gastritis (7% of women), hiatus hernia (in 3% of women, 20% of men), Sjögren’s syndrome (in 3% of women), celiac disease (in 3% of women), prostatic hyperplasia (in 10% of men), chronic obstructive pulmonary disease (in 10% of men) were present in free-living elderly.
The inclusion criteria were: age ≥65 and informed consent to participate in the study.
The exclusion criteria were: disagreement and lack of ability to cooperate, a severe condition of the patient making impossible to answer questions. People with cardioverter defibrillator were also excluded due to the inability to evaluate body composition by electric bioimpedance.
The work was performed as part of the research number 02-0048 and conducted in the Department of Clinical Nutrition, Medical University of Gdansk. The study was approved by the University Ethics Committee.


Methods

The medical history was taken from all participants. Body height (cm) and body weight (kg) were examined. Based on the obtained data BMI [kg/m2] as weight [kg] /height [m] were calculated.
The measurement of hand grip strength was carried out using an analog hand-held dynamometer (Baseline 12-0240, USA) in the upright position, with the arm lowered along the torso and the dynamometer firmly in the palm of the hand. Norms for HGS >20kg for women and >30kg for men were adopted from The European Working Group on Sarcopenia in Older People (27).
Body composition was assessed by electric bioimpedance using the Maltron BioScan 920-2 analyser, which is a four-frequency device (5 kHz, 50 kHz, 100 kHz and 200 kHz). Four self-adhesive electrodes were placed on the right hand and right-hand skin. The measurement was done in the fasting state. The phase angle was tested at 50 kHz (the value ≥8° was considered as a norm).
For the evaluation of nutritional status, the full version of Mini Nutritional Assessment (f-MNA) was used. The patient was considered as well nourished when their f-MNA ranged between 24 and 30, as being at risk of malnutrition between 17 and 23.5 points and as having malnutrition if the score was less than 17 (25).
Appetite was evaluated by the Simplified Nutrition Assessment Questionnaire (SNAQ). Obtaining ≤14 points indicated the risk of weight loss within 6 months (26).
Novel Frailty Index was used to assess frailty syndrome. This 5-question self-report questionnaire includes nutrition/shrinking, physical function, physical activity, forgetfulness and emotion/exhaustion. The answers are scored 0/1 points, so the total score is from 0 to 5 points. When the patient received ≥ 3points, the syndrome was diagnosed (3).

Statistical analysis

Statistical analysis was performed with Statistica 12.0 for Windows. Distribution of variable was assessed with the Shapiro-Wilk test. The differences were tested with t-Student test or U-Mann Whitney test depending on the distribution of variables. Data are presented as the mean ± standard deviation (SD) or median and ranges. χ2 Pearson test was also used. Analysis of correlations was performed using Spearman test. P-value of <0.05 was considered as statistically significant.

Figure 1 Comparison of parameters of nutritional status, appetite in elderly with and without frailty syndrome according to Novel Frailty Index (NFI)

Figure 1
Comparison of parameters of nutritional status, appetite in elderly with and without frailty syndrome according to Novel Frailty Index (NFI)


Results

In Table 2 comparative analysis of hand grip strenght and phase angle value are presented.  Hospital patients had lower phase angle (7.8º vs. 8.8º, p=0.003). Hand grip strenght did not differ among groups (Tab.2).

Table 2 Comparison of hand grip strenght and phase angle value among hospitalised and free-living elderly

Table 2
Comparison of hand grip strenght and phase angle value among hospitalised and free-living elderly

Legend: HGS- hand grip strength.


Nutritional Status and NFI

In Table 3 results of full-MNA, SNAQ and NFI are summarized.
According to full-MNA results, 85% in the hospitalised group were malnourished or at risk of malnutrition. On the other hand, in the group of patients in the home environment, only 2% (n=2) of the women and none of the men were affected (Tab.3).
The risk for significant weight loss (>5% in 6 months) assessed by the SNAQ (≤14p) was also significantly higher in hospitalised patients.
Based on the NFI, the frailty syndrome was more common in hospitalised older patients than in free-living elderly, regardless of gender (respectively 63% vs. 15%, χ2=22.3, df=7, p=0.002).
Considering all studied elderly 34% of all subjects were recognized as a frail and 66%  as a non-frail according to NFI. Significant differences between frail and non-frail elderly have been observed solely in age (respectively 73.9±7 vs 69±6, p=0.01,), phase angle value (7.8±1.8 vs 8.7±1.2, p=0.001), MNA [21 (6-29) vs 27 (18.5=30), p=<0.001] and SNAQ [ 15 (6-19) vs 17 (12-20) p=0.01] results. Frail elderly were older and in poorer nutritional status, had worse appetite and lower phase angle in comparison with non-frail (Fig.1).

Table 3 The results of the nutritional status and NFI

Table 3
The results of the nutritional status and NFI

Legend: MNA- Mini Nutritional Assessment, SNAQ- Simplified Nutritional Appetite Questionnaire, NFI- Novel Frailty Index


Analysis of the correlation

Analysis of the correlation in the group of 67 elderly participants showed statistically significant associations of NFI score with age, the number of reported diseases, phase angle value and nutritional status (full-MNA). The age and number of reported diseases correlated positively. Conversely, the negative relationship was demonstrated for the value of the phase angle and the MNA score (data are shown in Table 4).

Table 4 The relationship between the Novel Frailty Index and components of the assessment of nutritional status

Table 4
The relationship between the Novel Frailty Index and components of the assessment of nutritional status

NFI- Novel Frailty Index , HGS- hand grip strength, BMI- body bass index, SNAQ- Simplified Nutritional Appetite Questionnaire, MNA- Mini Nutritional Assessment


Discussion

Frailty in one of most burning problems in countries with aging populations and this issue recently focus more attention of both scientists and clinicians. There is no doubt that frailty implies increased morbidity and mortality and is connected with the need for long-term care (7-9). Despite all these unrelenting facts, we still didn’t have a good screening tool to diagnose frailty or pre-frail state. Current methods of recognizing this syndrome require a number of tests, which often need to be performed by specialists (2, 13). That is why this study investigated the usefulness newly proposed by Yamada and Arai, self-reported 5-question screening index in association with markers of nutritional status, muscle mass, and strength.
The risk of developing frailty syndrome increases with age and it is often described as a physiological decline in late life (14, 15). Data from the Cardiovascular Health Study (n=5317) demonstrated that discussed syndrome is more common in advanced age people. According to mentioned study, 3.2% of free-living elderly in 65-70 age and 25.7% of those ≥ 85 years were frail (7). Results of research presented in the paper show similar relationship. There was a statistically significant positive association of NFI values with age. Moreover, in comparative analysis, frail elderly were older than non-frail (respectively 73.9±7 vs 69±6) and the percentage of people ≥75 years was higher (43% vs 14%).
It should be highlighted that among hospitalised older people, the prevalence of frailty syndrome may be properly higher, due to often severe clinical condition, comorbidities, advanced age (16). Our study demonstrated that frailty syndrome was significantly more common in hospitalised older people than in community-dwelling elderly (respectively 15% vs 63%). Furthermore, hospitalized respondents were affected with more chronic diseases, had a worse appetite and nutritional status, also men were older in comparison with free-living older people.
Many studies emphasize the strong correlation between malnutrition and frailty which were assessed by various diagnostic criteria (10-12). To our knowledge, the NFI has been used so far only by Suzuki et al. own to screen for frailty and its relationship with malnutrition in the elderly patients with chronic heart failure (4). Researchers have shown a statistically significant relationship between the NFI results and the MNA score (r= -0,590, p<0,001). In our study group, we also found strong relationships between NFI and MNA ( r = -0.515, p <0.001). Moreover, frail respondents were in worse nutritional status than non-frail elderly. It is worth pointing out, that 22% of frail elderly were well-nourished according to the full-MNA, which might indicate that the exclusive use of this assessment tool may be insufficient to identify the frail person. Boulos et al. published similar findings, where in a group of 399 frail participants 36.1% were well-nourished (17). Many authors describe malnutrition and frailty as related, but distinct conditions and both should be detecting (17-19).
Frailty syndrome is associated with decreased not only muscle mass but also muscle strength and power. Diagnostic criteria of this syndrome involve also evaluation of muscle function (20, 21). In the presented study, hand grip strength was assessed and the relationship between NFI and HGS was not recorded. However, a frequent decreased of HGS in both groups has been noticed. This may indicate the great need for nutritional status assessment not only hospitalized but also free-living elderly people.
The most important parameter measured in BIA is the phase angle (PA), which reflects the quantity of the cellular mass in the body, as well cell membrane function. The prognostic value of PA has been well established especially in severe health conditions i.a. in COPD, HIV, lung cancer or in dialysis patients and in relation to poor nutritional status (22, 23). In the Third National Health and Nutritional Examination Survey, in a sample of 4.667 older participants, showed that low phase angle was related to a four-fold higher odds of frailty among women and a three-fold higher odds of frailty among men (24). In the presented study the phase angle appears to be the most valuable parameter. PA positively correlates with NFI and is significantly lower in frail and hospitalized older adults in both genders.
In our opinion Novel Frailty Index is undoubtedly a simple tool for rapid screening and might be important in clinical practice in the future. The use of NFI does not require any special equipment for diagnostics. On the other hand, the tool requires a validation process. So far, there is too little data indicating the predictive value of this tool. Yamada and Arai examined 5852 elderly people living in the community and showed that the NFI can be a predictor of disability (3). Furthermore Suzuki et. al. indicated that NFI may predict poor outcome in chronic heart failure outpatients (4). Our study shows that the Novel Frailty Index is associated with a poor health condition, advanced age, poor nutritional status, lack of appetite and impairment of body cell mass. The important limitation of our study is the small sample of enrolled patients. Hence results of our study should be taken with caution.


Conclusions

Early diagnosis of frailty syndrome could be helpful to clinicians to potentially reduce the risk of complications connected with the implemented treatment, so we decided to assess in our study the new screening tool NFI. Preliminary results of our research indicate the relationship between the NFI score and the relevant parameters associated with the frailty syndrome (age, comorbidities, nutritional status, phase angle). Therefore, we highlight the need for further evaluation of NFI as a useful tool for screening of frailty syndrome.


Conflict of Interest: Nothing to disclose.


References

1. Główny Urząd Statystyczny. Ludność w wieku 60+. Struktura demograficzna i zdrowie.(http://stat.gov.pl/obszary-tematyczne/ludnosc/ludnosc/ludnosc-w-wieku-60-struktura-demograficzna-i-zdrowie,24,1.html),downloaded 10.07.17r.
2. Stoicea N, Baddigam R, Wajahn J, Sipes AC, Arias-Morales CE, Gastaldo N, Bergese SD. The Gap Between Clinical Research and Standard of Care: A Review of Frailty Assessment Scales in Perioperative Surgical Settings. Front Public Health. 2016;21;4:150.
3. Yamada M1, Arai H2. Predictive Value of Frailty Scores for Healthy Life Expectancy in Community-Dwelling Older Japanese Adults. J Am Med Dir Assoc. 2015; 1;16(11):1002.e7-11
4. Suzuki N., Kida K., Watanabe S., Kawashima Y., Ito C., Ashikaga K., Suzuki K., Omiya K., Harada T., Akashi Y.J.: Novel Frailty Index is Closely Related to Malnutrition in Outpatients with Chronic Heart Failure. Clinical Nutrition 2016; 35(S1): s.208
5. Vellas B., Villars H., Abellan G., Soto M.E., Rolland Y., Guigoz Y., Morley J.E., Chumlea W., Salva A., Rubenstein L.Z., Garry P.: Overview of the MNA – Its history and challenges. The Journal of Nutrition, Health & Aging 2006; 10(6): s.456-463.
6. Cereda E.: Mini nutritional assessment. Current Opinion in Clinical Nutrition and Metabolic Care 2012; 15(1): s.29-41.
7. Fried LP, Tangen CM, Walston J, Newman AB, Hirsch C, Gottdiener J, Seeman T, Tracy R, Kop WJ, Burke G, McBurnie MA; Cardiovascular Health Study Collaborative Research Group. Frailty in older adults: evidence for a phenotype. J Gerontol A Biol Sci Med Sci. 2001 Mar;56(3): M146-56. PMID: 11253156.
8. Furtado G, Patrício M, Loureiro M, Teixeira AM, Ferreira JP. Physical Fitness and Frailty Syndrome in Institutionalized Older Women. Percept Mot Skills. 2017;124(4):754-776.
9. Mandelblatt JS, Cai L, Luta G, Kimmick G, Clapp J, Isaacs C et al. Frailty and long-term mortality of older breast cancer patients: CALGB 369901 (Alliance). Breast Cancer Res Treat. 2017;164(1):107-117.
10. Ferriolli E, Pessanha FPADS, Moreira VG, Dias RC, Neri AL, Lourenço RA. Body composition and frailty profiles in Brazilian older people: Frailty in Brazilian Older People Study-FIBRA-BR. Arch Gerontol Geriatr. 2017;71:99-104.
11. Artaza-Artabe I, Sáez-López P, Sánchez-Hernández N, Fernández-Gutierrez N, Malafarina V. The relationship between nutrition and frailty: Effects of protein intake, nutritional supplementation, vitamin D and exercise on muscle metabolism in the elderly. A systematic review. Maturitas. 2016;93:89-99
12. Cruz-Jentoft AJ, Kiesswetter E, Drey M, Sieber CC. Nutrition, frailty, and sarcopenia. Aging Clin Exp Res. 2017;29(1):43-48.
13. Laur CV, McNicholl 1, Valaitis R, Keller HH. Malnutrition or frailty? Overlap and evidence gaps in the diagnosis and treatment of frailty and malnutrition. Appl Physiol Nutr Metab. 2017;42(5):449-458.
14. Clegg A, Young J, Iliffe S, Rikkert MO, Rockwood K. Frailty in elderly people. Lancet. 2013;381:752–762.
15. Chen X, Mao G, Leng SX. Frailty syndrome: an overview. Clinical Interventions in Aging. 2014;9:433-441. doi:10.2147/CIA.S45300.
16. Oliveira DR1, Bettinelli LA, Pasqualotti A, Corso D, Brock F, Erdmann AL. Prevalence of frailty syndrome in old people in a hospital institution. Rev Lat Am Enfermagem. 2013;21(4):891-8.
17. Boulos C, Salameh P, Barberger-Gateau P. Malnutrition and frailty in community dwelling older adults living in a rural setting. Clin Nutr. 2016;35(1):138-43.
18. Laur CV, McNicholl T, Valaitis R, Keller HH. Malnutrition or frailty? Overlap and evidence gaps in the diagnosis and treatment of frailty and malnutrition. Appl Physiol Nutr Metab. 2017;42(5):449-458.
19. Bollwein J, Volkert D, Diekmann R, Kaiser MJ, Uter W, Vidal K, et al. Nutritional status according to the mini nutritional assessment (MNA®) and frailty in community dwelling older persons: a close relationship. J Nutr Health Aging.2013;17(4):351e6.
20. Frailty in Older People. Lancet. 2013;381(9868):752-762. doi:10.1016/S0140-6736(12)62167-9.
21. Cesari M, Leeuwenburgh C, Lauretani F, et al. Frailty syndrome and skeletal muscle: results from the Invecchiare in Chianti study. The American journal of clinical nutrition. 2006;83(5):1142-1148.
22. Gupta D1, Lis CG, Dahlk SL, Vashi PG, Grutsch JF, Lammersfeld CA. Bioelectrical impedance phase angle as a prognostic indicator in advanced pancreatic cancer. Br J Nutr. 2004;92(6):957-62.
23. Kyle UG1, Genton L, Pichard C. Low phase angle determined by bioelectrical impedance analysis is associated with malnutrition and nutritional risk at hospital admission. Clin Nutr. 2013 Apr;32(2):294-9.
24. Wilhelm-Leen ER1, Hall YN, Horwitz RI, Chertow GM. Phase angle, frailty, and mortality in older adults. J Gen Intern Med. 2014 Jan;29(1):147-54.
25. A guide to completing the Mini Nutritional Assessment. (http://www.mna-elderly.com/forms/mna_guide_english_sf.pdf), downloaded 20.07.2017r.
26. Wilson MM, Thomas DR, Rubenstein LZ, Chibnall JT, Anderson S, Baxi A, Diebold MR, Morley JE. Appetite assessment: simple appetite questionnaire predicts weight loss in community-dwelling adults and nursing home residents. Am J Clin Nutr 2005; 82: 1074-1081.
27. Cruz-Jentoft AJ, Baeyens JP, Bauer JM, et al. Sarcopenia: European consensus on definition and diagnosis: Report of the European Working Group on Sarcopenia in Older People. Age and Ageing. 2010;39(4):412-423. doi:10.1093/ageing/afq034

KNOWLEDGE AND PRACTICES GOVERNING THE IMPLEMENTATION OF NASOGASTRIC TUBE FEEDING AS A TEMPORARY UNDERNUTRITION MANAGEMENT MEASURE IN ACUTE GERIATRIC CARE: A QUALITATIVE RESEARCH-BASED ANALYSIS


E. Fercot1, L. Marty2, C. Bouteloup3, Y. Lepley4, J. Bohatier1, M. Bonnefoy4, B. Lesourd5, Y. Boirie6, S. Dadet7


1. Gérontopôle, CHU Clermont-Ferrand, Clermont-Ferrand, France;
2. Anthropologue de la santé, Département de Médecine Générale, Université Clermont Ferrand Auvergne, Clermont-Ferrand, France; 3. Université Clermont Auvergne, INRA, UNH,Unité de Nutrition Humaine, CHU Clermont-Ferrand, Service de médecine digestive et hépatobiliaire, CRNH Auvergne, Clermont-Ferrand, France; 4.  Université Claude Bernard Lyon 1, Faculté Lyon-Sud, France, Inserm U1060, Université Lyon 1, France, Service de médecine gériatrique, Hospices civils de Lyon, France; 5. Université Clermont Auvergne, Clermont-Ferrand, France; 6. Université Clermont Auvergne, INRA, UNH, Unité de Nutrition Humaine, CHU Clermont-Ferrand, Service de Nutrition Clinique, CRNH Auvergne, Clermont-Ferrand, France; 7. Université Clermont Auvergne, INRA, UNH, Unité de Nutrition Humaine, CHU Clermont-Ferrand, CHU Clermont-Ferrand, Gérontopôle, CHU Clermont-Ferrand, France.

Corresponding Author: Elise Fercot, Gérontopôle, CHU Clermont-Ferrand, F-63000 Clermont-Ferrand, France, fercote@hotmail.fr

J Aging Res Clin Practice 2018;7:115-122
Published online October 15, 2018, http://dx.doi.org/10.14283/jarcp.2018.20


Abstract

Introduction: Nasogastric tube feeding appears underused in acute geriatric care units. The objective of this study was to identify the knowledge, practice, fears or behaviors of care givers governing implementation. Material and Methods: Multicentric qualitative research study based on interviews with geriatricians and care staff. Coding of patterns and thematic analysis of the data were used to extract key concepts tied to the objective. Results: Ten geriatricians and eleven care staff were interviewed individually and in a focus-group setting. Undernutrition was perceived as a prognosis-worsening comorbidity, not a disease. Early screening for undernutrition appeared essential, but care management and monitoring was within the remit of downstream structures. A handful of indications are reported to justify moves to start nasogastric tube feeding, often as part of adjuvant care, when real benefit is expected, when the individualized feeding plan is part of a comprehensive care plan, with the patient consciously involved and after consulting with the family. Patients’ fear of complications, cognitive disorders, and uncertain life expectancy often fuel concerns of a form of unreasonable obstinacy. Finally, doctors and care staff alike think that decisions on nasogastric intubation in this patient population require a multidisciplinary-team process. Conclusion: Nasogastric tube feeding in acute geriatric care remains fraught with issues. It looks a viable option, but should be part of a comprehensive care plan, based on multidisciplinary decision-making by appropriately-trained teams, where the goals of care are the patient’s comfort and quality of life.

Key words: Enteral nutrition, frailty, care management, geriatrics, malnutrition, quality of life.


Introduction

According to French health authorities (HAS-Haute Autorité de Santé) figures, the prevalence of hospital undernutrition in France approaches 30–70% in patients over 80 years (1, 2). Acute illnesses increase protein-energy needs, while intakes are often inadequate due to episodic loss of appetite, eating difficulties or malabsorption (1, 3). This deficit can lead to protein-energy undernutrition, which increases the risk of sarcopenia, frailty (4), loss of functional capabilities (5), infectious risk (6), length of stay at hospital (7) impair functional outcomes and recovery (8) and mortality (9, 10). Effective nutritional management is therefore  necessary, and various academic societies have proposed strategies that include artificial nutrition (1, 11, 12). These care decision strategies can be constructed as decision trees, such as that of the French society for clinical nutrition and metabolism (SFNEP), but are rarely adapted to very old patients (13). The HAS and the European society for clinical nutrition and metabolism (ESPEN) issued guidelines in 2006 and 2007 specifically addressing factors unique to geriatric care : patient life expectancy, functional capabilities, frailty, neurocognitive disorders and comorbidities (1, 12). In practice, while nasogastric tube (NGT) feeding for enteral nutrition (EN) may be recommended in acute-phase hospital care, it is a lot more problematic in the acute geriatric care unit (AGCU) (13) and reluctance for a enteral nutrition may exist because of lack of education, knowledge, communication, or team work (14). In an effort to improve nutrition management in these units, an improvement in a deeper understanding of the practices and of the difficulties among the clinicians and care staff teams is expected.
Therefore, the objective of the present study was to identify the knowledge and practices governing the implementation of NGT feeding in AGCU wards. The aim was to survey geriatric care professionals to capture their opinion on nutrition management, evaluate their knowledge of the issue, characterize their expectations and perceptions, and identify the reasons that frustrate or facilitate the process of prescribing NGT placement.


Matherials and methods

Description of the study

This multicentric qualitative research study was led in AGCU wards at different Main City Hospitals (MCH) in the Auvergne region, France.

Choice of method

Qualitative research explores complex phenomena, arising from the ‘human factor’ of care delivery, in their natural environment. It attempts to make sense of the participant experiences and interpret the meanings they attribute to them. The process of analysis is approached inductively, in contrast to deductive approaches that systematically verify a pre-determined hypothesis. The method of inquiry used is based on the 32-item COREQ 2007 criteria, spanning 3 domains: research team and reflexivity, study design, and analysis and findings (15). Data was collected through semi-structured interviews-either individual or in focus-group format. Individual interviews give interviewees the freedom to open up and express themselves, while focus groups enable interaction based on group-effect dynamics and dialogue, thus facilitating the emergence of knowledge, opinion and experience by bringing different personal perspectives together. The open-ended questions addressed topics defined in an interview guide. People interviewed were free to address other concepts not initially agendaed. The study secured approval from the local French ethics committee (‘CPP’ Sud-Est VI) for the protection of human subjects.

Sampling

The sample of geriatric doctors and care staff (Registered Nurses (RN) and Registered Nursing Care Assistants (RNCA))-all of whom were volunteers-had to be heterogeneous in order to capture the broadest possible range of opinions, experiences and practices. Age, gender, place of practice, career path, time in the job, and further training and education had to be as varied as possible. We continued to include material until thematic saturation.

Interview guide

Two interview guides were developed and tested to fit each professional (one for doctors and one for care staff, both of which served for the individual interviews and the focus group) in order to explore the various themes exposed in the literature on enteral nutrition. The guides were modified after the early exploratory interviews, as the questions were not open-ended enough, which hinded in free-flowing conversation. Likewise, certain questions asking about the knowledge held by doctors and care staff were deleted to rule out any value judgment.

Process and flow of the interviews

The interviewers opened by explaining the aim of the interview or focus group and the objectives targeted. They then had the time to outline the interview process, guaranteeing that everything shared would be anonymous and confidential and in no way critical or judgemental. The interviewer then collected the credentials of the people interviewed and their consent to record the conversation.
a) Process and flow of a semi-structured individual interview:
The interview started with the interviewee telling their story of an experience-whether good or bad-with NGT feeding. The questions were then cued by the interview guide until all the themes had been addressed. The same interviewer, mainly at the participants’ place of work, conducted all the interviews.
b) Process and flow of a semi-structured focus group:
The focus group was asked to talk over one or more experiences concerning NGT feeding. Two investigators were mobilized to take part in the focus group-one as facilitator, the other as observer to collect expressions of nonverbal communication. The moderator used a set of questions to keep dialogue and discussion focused, making sure that all the focal topics in the interview guide were addressed.

Collection of the data material

All the interviews were recorded end-to-end on an OLYMPUS-brand digital dictaphone. All digital capture was transcribed in depersonalized format into a verbatim-record Microsoft Word document. No digital data records were kept.

Method of analysis

The process of thematic analysis based on verbatim accounts started right from the first interview. The content of the verbalized conversation was collapsed into themes that were then subcategorized. The interview transcripts were then re-read and reviewed a second time using this list.


Results

Description of the people interviewed

The interviews were conducted from February to August 2015.

Interviews with doctors

Interviews were led in-hospital, in 5 different MCH including 4 AGCU, on the 10 geriatric doctors reported in Table 1, thus compiling 4h22 of recorded material. The sample was positively heterogeneous for age, gender, experience and place of practice. The focus of background training tended to be on palliative care and neurodegenerative diseases. Only one of the doctors had been university-trained on nutrition.

Table 1 Doctor characteristics

Table 1
Doctor characteristics


Interviews with care staff

Interviews were led in the same MCH hosting 3 different AGCU, on the 11 care staff reported in Table 2, thus compiling 4h04 of recorded material. Two participants were interviewed by phone and one at home. The sample was positively heterogeneous for age, gender, and professional experience. The most common focus of background training was palliative care and neurodegenerative diseases, and only two of the 11 care staff had been given training on nutrition.

Table 2 Care staff characteristics

Table 2
Care staff characteristics

RN¹ Registered Nurse, NCA² Nursing Care Assistant


Analysis of the main findings

Various major themes and concepts emerged.

Knowledge and training levels of the geriatric care professionals

Interviews with doctors

The geriatric doctors claim they are undertrained on nutrition. “You can’t say ‘trained’. You learn on the job.” (Doctor #5) “By our department heads and colleagues.” (Doctor #6)

Interviews with care staff

The RN feel undertrained on EN, especially on technical procedure. “I think the nurses in general don’t know enough about placing the NGT, because, it’s true, at nursing school you only get a brief look at it” (RN #1) “Er, the training goes back 15 years ago […] but the first one I got to place, that was later on, once I had started work” (RN #2).

Nutrition in hospital practice

Screening for undernutrition

Screening appears to be a routine phase, but with different approaches. “It’s a routine practice on the admission tests for all elderly subjects”. (Doctor #1) “Weight, height, body mass index chemistry panel-systematically” (Doctor #4). The geriatricians also think they are more undernutrition-aware than other speciality practitioners. “We screen them as soon as they come in […] We’re optimal on that, we’re in good shape”(Doctor #1). However, there is variability in the resources mobilized for the nutritional status assessment, and the doctors voiced their issues, given how exhaustive investigation is just not feasible. “It’s always made hard by the fact they already have some kind of inflammatory syndrome, so we struggle to quantify their baseline nutritional status” (Doctor #3) “It only really starts getting useful if you’ve got past weight figures”. (Doctor #3). Close monitoring of food intakes is voiced more by the care staff, who also feel they are screening-aware. “We generally do the 3-day food and drink record chart” (RN #3). “If they don’t eat anything, there are written messages, verbal messages, it gets flagged up.” (RNCA #1).

Management of undernutrition

For the doctors, oral nutrition remains the best care plan going forward. “So if oral intake is possible, then you put them straight on oral nutritional supplements (ONS) already […] you maintain oral feeding, which takes priority” (Doctor #1). “In most cases, elderly patients are undernourished. So what I sometimes do is, rather than wait to get low blood Proteins, I put them straight on refeeding protocol with two ONS/day.” (Doctor #1) Certain hypercatabolic-syndrome settings nevertheless prompt them to start thinking oral nutrition is not enough. “When pressure ulcers or cancers come back, these situations where you know you need far higher intakes-where you have no time to lose.” (Doctor #2)

Follow-up on undernutrition care throughout the hospital stay

Some geriatricians feel that undernutrition management should be pushed back to later. “In the AGCU, you assess: the hospital stay is too short to re-assess your NS-backed feeding programme […]. When you come to re-assess, they are often already be in Subacute Care and Rehabilitation (SCR)” (Doctor #2). However, they do feel that they could also push their engagement further to prepare the ground for enteral feeding when the nutritional management rolls over into SCR “Say, OK, this patient has a severe undernutrition, to be re-assessed in x amount of time and if not reversed, place the NGT.” (Doctor #2). The care staff, though, manifestly voice a disconnect between their routine nursing and the medical management process. “You do food record charts for people who are eating loads, and when you flag up that the person isn’t eating, you don’t do a food record chart […] there’s a gap there, and you tell yourself nothing gets done.” (RNCA #7)

Elements considered for medical decision

Indications for NGT placement

The doctors appear to share a consensus that it is essential to optimally feed patients admitted for pressure ulcer, dysphagia after a stroke, or to ready for surgery or chemotherapy. “After that, deep pressure ulcer might be an issue” (Doctor #3) “a lady who had a haemorrhagic stroke, there it’s undeniably a good indication […] there is hope for recovery once the hematoma resorbs” (Doctor #5) “It’s presurgery nutrition to support better tolerance.” (Doctor #9). Anorexia against a background of depression with decline in general status also emerges as a consensus indication. “We were clearly looking at a care plan including antidepressants, and it worked out that way.” (Doctor #7). There is no clear consensus for infection management, even though the geriatricians appeared to recognize this indication. “I think that one of the best indications is to get through an acute-phase flare of infection or inflammation when you know it is likely to resolve.” (Doctor #3) This was voiced in the focus group without any objection from the co-attendees, and again in individual interview. “It’s in situations of acute stress-where there are going to be difficulties over one week, difficulties getting enough intake during major hypercatabolism-may be situations like that where, from time to time, we could be proposing the patient artificial nutritional support, but we don’t.” (Doctor #10)

Patient information and consent

All the doctors interviewed uphold and respect the principle that the patient’s wishes come ahead of any medical rationale. “Me, I work to the principle that if they are against it, then I don’t fit it” (Doctor #10). Many doctors reported that even when patients are fully informed and give their consent, they will still rip their NGT out eventually. “He ripped the catheter out, we offered to re-place it, and as he answered a very clear ‘no’, we didn’t do it” (Doctor #2) Over and above consent, the decisive factor is ultimately active patient participation. “A patient who was really engaged in cooperation, active collaboration, which makes everything so much easier […] he really was a stakeholder in his own care plan”. (Doctor #5)

Relationship with the family

The family holds a central position as the primary caregivers to go through when communication or decision-making are out of the older patient’s reach, when no advance care directives to go on. “She didn’t want any artificial support, so we held off the enteral nutrition in accordance with the directive that the patient had-supposedly-left but that her two daughters had passed on” (Doctor #5). That said, the opinion of the caregivers can put the practitioner in a difficult position, under pressure from the family to provide an enteral nutrition that the practitioner sees as unreasonable. “The family is always all for it, because their perception is that the nutrition is what is going to save them” (Doctor #10) Conversely, at other times, the family may be against an enteral nutrition that the doctor wants to implement. “We were pretty much pushing-and this was against the family’s wishes-to keep the enteral feeding going, and what ultimately happened was that the patient almost completely recovered as she was able to resumed normal feeding.” (Doctor #5) Even if the family are a primary proxy in geriatrics, the patient remains the primary decision-maker. “He is cognitively healthy, so we don’t need to call the family in-it’s his decision.” (Doctor #1). There is a unanimous view that it is vital to inform the family to foster their acceptance and participation in care. “If you explain everything properly, there’s no reason the family won’t accept it. Information is actually the be-all and end-all.” (Doctor #3)

Care-team decision-making

A collegial forum is something that the doctors and especially the care staff want. “These are still tough decisions to make, so I do find that the staff meeting helps get a clear picture of the issues.” (Doctor #2) Care staff want to be involved in the decision process, to understand it, as their assessments sometimes diverge from those made by the doctors. “Us, the nurses and nursing care assistants, as a rule, it just gets done, no-one asks us for any input. You show up in the morning, NGTs have been placed without anyone asking us if it’s a good idea, a bad idea” (RNCA #6) “When you don’t get consulted, you don’t necessarily understand […] whereas if you’re involved, whether you agree with it or not, at least you can understand.” (RNCA #6)

Benefits expected

The doctors are unable to give a clear picture of the real benefit expected from NGT feeding as a nutrition support measure in this population. “What really clouds the issue is that we just can’t properly measure the impact” (Doctor #5) “My feeling would be that more often than not it’s a failure” (Doctor #3). There appears to be some kind of dichotomy between the confirmed need for a NGT and doubts over the benefit expected. “Is always reasoning in terms of the patient’s best interests, over and above any biological formula or loss of weight, really going to bring them something?” (Doctor #10).

Importance of the care plan

The comprehensive care plan approach is a mainstay of geriatric medicine. “Either way, more than any kind of across-the-board assessment, it’s really going to be typically geriatric, […] What do they want? Is it worth it?” (Doctor #7) The majority of geriatricians was for including nutrition management and NGT feeding into a coherent comprehensive care plan as one of the factors of the parameters of geriatric patient assessment-quality-of-life included. “Geriatrics is never all about a nutrition plan. For me, it’s always about a plan for the future, a plan to make it out of the acute-care period.” (Doctor #7) “What is the plan, what is the potential for recovery?” (Doctor #5).

Prescription practice influenced by geriatric-ward experience

Those practitioners most exposed to care dependency and pathological aging are quick to confide how it may colour their thinking. “Personally I think I have been also conditioned by my experience of long-term hospital care […] a dozen patients on enteral feeding for months, years sometimes, all spent fighting with the adverse effects […] I’ve seen all the negatives of extended enteral, the ethics conversations, the families who just want it all to stop”. (Doctor #5) “Often, with the patients we have here at the AGCU, it’s hard to really go for it when you know the complications” (Doctor #2).

Barriers to implementing EN

Factors connected to the geriatric care environment

Preconceptions and perceptions of geriatricians

The perception seems to be that undernutrition is a comorbidity rather than an independent disease, and the doctors anticipate how patients will react to a problem they often ignore. “The patient’s going to turn round and say ‘but I’ve got no complaint. All I want is to not be in pain, the infection is under control, and right now I don’t feel I’m suffering from undernutrition’ ” (Doctor #5) As a rule, the geriatricians feel that they do start thinking about EN, but often  too late on. “Let’s just say that if you start asking yourself whether you should be putting them on it, then it’s that things are already a bit desperate.” (Doctor #3) This delay may be explained by their doubts over the benefit expected and their overriding concern to put patient quality-of-life first. “I firmly believe that for someone extremely undernourished, trying desperately to refeed them is already a stupid idea-it just won’t work” (Doctor #3). The time factor thus emerges as essential, and for many geriatricians, as soon as the patient is taking even a little food on board, the decision to engage a nutritional intervention can be pushed back to later. “The crux of the issue in AGCU care is that even if you register severe undernutrition, regardless of the criteria you base it on, if food intakes are any good at all, then you can use up time to attempt to recorrect through oral feeding” (Doctor #2).

Preconceptions and perceptions of care staff

The care staff tend to consider that a drop in food intakes is a normal sign of the natural ageing process, culminating in a form of anorexia synonymous with refusal of care: “the person is in her early nineties, you can see that she’s tired of life and that the refusal to eat is her way of showing that she’s had enough” (RN 1). This means that nutrition management decisions-regardless of whether for or against intervention-are often misunderstood, and can sometimes even add a burden of distress to care staff teams who want to be kept informed and their voice heard. “Me, if there’s things I struggle to accept, I go and see the doctors, because if no-one tells me what’s happening, I can’t let it go” (RNCA #11) “sometimes, as care staff, we really struggle when we see someone for weeks, like the guy who died this morning, for weeks he wasn’t eating, and we kept telling them, telling them […] So you get the impression no-one listened to a word we say, nothing gets done about it, that you’re letting them starve to death”. (RNCA #9) That said, even in the situations where the care staff feel disarmed, there is still some ambivalence over the NGT. “I must say, I do find that at it’s still a procedure that is quite violent, in that it’s, after all, still an invasive procedure” (RN #1) The geriatric care teams remain underfamiliarized with using it, and they often experience placing the NGT as an assault on the patient. “I’m still not real comfortable with it, because-well, sure, I haven’t placed many, and as interventions go, it can’t be easy to live with” (RN #4). Today’s better hardware has nevertheless brought tangible progress, which the teams readily accept. “You have these special catheters now, with guidewires, that make procedure so much easier” (RN #2).

Fear of complications

Geriatrics, more than any other ward, seems to suffer the stigma of the incidence of complications. “It’s mainly inhaling stuff, yeah-I had the case of a patient who suffered a major aspiration pneumonia, which he never recovered from”(Doctor #10) “You’re often reluctant to place catheters-you can’t just place catheters and be done, without mulling it over” (Doctor #1).

Difficulties in practice

Interviewees raised several difficulties unique to geriatric care, such as tube feeding at night, the risk of prolonging the hospital stay and difficulties home-front continuation of care, although they also gave some positive feedback. “I’m personally not too happy with them being fed at night because there’s one nurse for 33 patients” (RN #2). “The NGT is not something you can go back home with-not unless you’re on in-home care” (Doctor #4) “I have already had two reports back from a care provider following her at home, and with that, she’s absolutely fine with her NGT” (Doctor #10).

The alternative-parenteral nutrition

Parenteral nutrition (PN) is not perceived as an alternative to NGT feeding, and appears to be rarely used in practice. “Personally I never put a patient on parenteral. Either I decide to talk about the nasogastric tube and then a Percutaneous Endoscopic Gastrostomy (PEG), or it’s a no.” (Doctor #2) Some doctors find that PN may be indicated when the care plan has not be clearly established or when it is difficult to gauge the patient’s acceptance. “Why not use parenteral nutrition more in acute cases when you’re not sure of where you’re going, rather than placing a NGT?”(Doctor #6).

Factors connected to the elderly population

Very old age and unreasonable obstinacy

Many doctors and care staff alike challenge the ethical soundness of starting this type of treatment in very old age, when patients are dependent on care and life expectancy is short, often to the point that it crosses the border into unreasonable obstinacy. “You have to admit that in paediatrics you are thinking about a life ahead, so there’s nothing distressing about putting a feeding tube on a baby in neonatal care because it’s just something you have to do to give them every chance of making it through, whereas in geriatrics you tend to hold back on it, because is NGT really worth it, is the patient consenting?” (Doctor #4) Practitioners regularly struggle with lingering doubts over the outcome of this type of care protocol. “Is it really going to bring the patient some kind of relief, because we’ve all had times when we’ve set up nutrition in patients who deceased shortly after.” (Doctor #10)

Cognitive disorders

The prevalence of cognitive disorders in the geriatric-care population emerges as a real barrier to the use of EN. “They’re just going to rip it out, because they just don’t understand what’s going on.” (Doctor #7) “When you have to fit wrist restraints just to keep the NGT in place, I consider that we’ve lost all sight of common sense and that we’re bordering on abuse to get someone feeding” (Doctor #10). The doctors remain well aware of the risk of under-evaluating the right indications for enteral nutrition. “You get so conditioned by all these patients who are very old or have cognitive disorders […] it prompts behaviours in patients who would likely benefit and we maybe end up overcompensating and excluding them.” (Doctor #5)

The long-term-care perspective

The geriatric doctors appear to fear the withdrawal of the NGT or the risk of having to move to a long-term PEG they feel is unreasonable. “You are withdrawing food, which in people’s minds means you are killing the patient […] Withdrawing it is a really tough call.” (Doctor #6) “Why didn’t we put him on PEG? You have to do something to stop short of overaggressive obstinacy […] there are situations where you have to know when it’s time to stop, because once you take the road of a nutrition management process, after there’s no turning back.” (Doctor #4)

Patient comfort and quality of life

The staff struggle to square integrating an invasive protocol like NGT feeding into a care plan where the goals are supposed to be the patient’s comfort and quality of life. “You feel like you’re creating them unnecessary hassle, given that in 10 days’ time, they’ll be back at home.” (Doctor #5)


Discussion

Main findings

The objective of this study was to analyze the knowledge and practices governing implementation of nasogastric tube feeding as an enteral nutrition support measure in AGCU wards. Our findings highlight a number of factors that create a disconnection between real-life bedside care practices and guidelined medical nutrition management. Even though practitioners can lead on HAS and ESPEN guidelines, our study effectively shows that the issue remains fraught with complexity-a complexity that can be translated into several explanatory concepts to help better grasp the difficulties faced by geriatric health care teams.
Foremost, the geriatric health care teams are essentially trained in the management of cognitive disorders and end-of-life care, which revolves around a comprehensive care plan approach focused on the patient’s comfort and quality of life. Our results do show that undernutrition is perceived as a latent phenomenon, commonly emerging in elderly patients, and patterned perhaps more as a comorbidity to be dealt with than a disease to be treated.  The most common care consists in screening and oral nutrition, and geriatricians often think that Subacute Care and Rehabilitation is a better ward for nutrition care than AGCU. NGT feeding does not appear to be considered a solution to improve way to improved protein-energy intakes. It does feature in the therapeutic arsenal of geriatric medicine, but does not appear to get used unless to support adjuvant care for other diseases when framed within a comprehensive care plan (13). It is perceived as an invasive, aggressive therapeutic measure, which increases the risk of confusion, and often leads geriatric care teams to feel they are going against their primary goals of care, i.e. the patient’s comfort and quality of life.
Then, when its use seems needed, several concepts converge to influence medical decision-making in the AGCU ward, and thus determine certain preconditions. Information and consent are vital yet insufficient factors. Active patient participation, which goes further than a straight yes/no consent, is absolutely pivotal and will be dictated by how the NGT intervention plan is presented to the patient, how far the patient can trusts the doctor and how the patient can understand the information. Another concept is the role of the primary caregivers. Even though the medical decision has always been grounded in the wishes of the patient, it appears essential to have their collaborative involvement. The long-term-care perspectives can also prove problematic. Firstly, organizing EN at home for care-dependent patients can prove a real hurdle. Secondly, the uncertainty about the patient’s progress may lead to fear of a form of unreasonable medical care with the risk of becoming forced to look at a PEG. Last but not least, ethical factor remains a key factor being systematically addressed in this population where life expectancy is uncertain and prevalence of cognitive disorders is high. Consequently, the expected benefit of an NGT intervention seems uncertain for care teams and has to be more clear whereas they affraid over crossing the border into unreasonable obstinacy. Thus, the care staff teams-like the doctors-voice their need for a medical decision to be taken by multidisciplinary collegial consensus.
The circumspective position manifested by the geriatricians is probably legitimate given the potential consequences of an NGT in the most frail elderly (16). While the guidelines do not rule out NGT feeding as a very-short-term measure in patients with cognitive impairment, extended long-term delivery of EN via PEG is not advisable (1,12). The ESPEN prompts practitioners to think hard about the expected benefits of EN, and the HAS is equally prudent, advising EN only when expected benefit is considered to outweigh the procedure-related risks (1,12). Furthermore, the legal framework tends to improve comfort-only and support care first (17, 18). Even though the guidelines argue for enteral nutritional support to maintain normal intakes (1,11,12), the literature fails to confirm any real benefit in very old inpatients outside of certain indications for orthopedic surgery or as treatment for pressure ulcers (19-22).  Nutritional interventions studies seems effective but often concern younger patients, and few of them bring evidence that would encourage geriatricians to start a nutritional intervention in the oldest age-bracket patients (23-25). A recent review of the literature confirms the struggle to characterize the groups of elderly inpatients most likely to benefit from nutritional support (26). However, the geriatric care teams appear too undertrained on EN to be able to confidently assess this benefit–risk ratio and they have probably to expand their use of EN. Some of the concepts highlighted should be considered in order to initiate an EN as part of a global care project.
The qualitative approach adopted here enabled us to explore complex phenomena beyond the grasp of other scientific approaches. However, this method of inquiry does impose certain limitations, that we sought to minimize here using COREQ criteria (15).


Conclusion

Active nutrition management for undernourished elderly patients in the AGCU is problematic as a process when the goals of the care plan are the patient’s comfort and quality of life. Although various sets of recommendations have been released to help to guide clinicians in their decision-making, there is no solid data to confidently assert the benefit of EN in very-old-age patients and confirm the grounds for its indication. The good use of NGT in AGCU remains to be defined despite the guidelines of ESPEN and HAS.


Ethical standards: The study secured approval from a french committee for the protection of human subjects.

Conflict of Interest: The authors have no conflict of interest.


References

1.    Haute Autorité de Santé – Stratégie de prise en charge en cas de dénutrition protéino-énergétique chez la personne âgée. has-santé.fr. http://www.has.sante.fr/portail/jcms/fc_1249588/fr/accueil-2012
2.     Potter J, Klipstein K, Reilly JJ, Roberts M. The nutritional status and clinical course of acute admissions to a geriatric unit. Age Ageing. 1995;24(2):131-6.
3.     Patel MD, Martin FC. WHY DON’T ELDERLY HOSPITAL INPATIENTS EAT ADEQUATELY? J Nutr Health Aging. 2008;12(4):227-31.
4.     Bonnefoy M, Berrut G, Lesourd B, Ferry M, Gilbert T, Guérin O, et al. Frailty and nutrition: searching for evidence. J Nutr Health Aging. 2015;19(3):250-7.
5.     Galanos AN, Pieper CF, Cornoni-Huntley JC, Bales CW, Fillenbaum GG. Nutrition and function: is there a relationship between body mass index and the functional capabilities of community-dwelling elderly? J Am Geriatr Soc. 1994;42(4):368-73.
6.     Paillaud E, Herbaud S, Caillet P, Lejonc J-L, Campillo B, Bories P-N. Relations between undernutrition and nosocomial infections in elderly patients. Age Ageing. 2005;34(6):619-25.
7.     Herrmann FR, Safran C, Levkoff SE, Minaker KL. Serum albumin level on admission as a predictor of death, length of stay, and readmission. Arch Intern Med. 1992;152(1):125-30.
8.     Sullivan DH. The role of nutrition in increased morbidity and mortality. Clin Geriatr Med. 1995;11(4):661-74.
9.     Wallace JI, Schwartz RS, LaCroix AZ, Uhlmann RF, Pearlman RA. Involuntary weight loss in older outpatients: incidence and clinical significance. J Am Geriatr Soc. 1995;43(4):329-37.
10.     Payette H, Coulombe C, Boutier V, Gray-Donald K. Weight loss and mortality among free-living frail elders: a prospective study. J Gerontol A Biol Sci Med Sci. 1999;54(9):M440-5.
11.     Bouteloup C, Thibault R. Arbre décisionnel du soin nutritionnel. Nutr Clin Metabol 2014;28(1):52-6.
12.     Volkert D, Berner YN, Berry E, Cederholm T, Coti Bertrand P, Milne A, et al. ESPEN Guidelines on Enteral Nutrition: Geriatrics. Clin Nutr 2006; 25(2): 330-60.
13.     Bruhat A, Bos C, Sibony-Prat J, Bojic N. L’assistance nutritionnelle chez les malades âgés dénutris. Presse Med. 2000 ;29(39) :2191-201.
14.     Jaafar MH, Mahadeva S, Subramanian P, Tan MP. Perceptions of Healthcare Professionals on the Usage of Percutaneous Endoscopic Gastrostomy in a Teaching Hospital from a Middle-Income South East Asian Country. J Nutr Health Aging. 2017;21(4):473-479.
15.     Tong A, Sainsbury P, Craig J. Consolidated criteria for reporting qualitative research (COREQ): a 32-item checklist for interviews and focus groups. Int J Qual Health Care. 2007;19(6):349.
16.     Lubart E, Leibovitz A, Dror Y, Katz E, Segal R. Mortality after nasogastric tube feeding initiation in long-term care elderly with oropharyngeal dysphagia–the contribution of refeeding syndrome. Gerontology. Karger Publishers; 2009;55(4):393-7.
17.     Loi N. Loi: 303 du 4 mars 2002 relative aux droits des malades… – Google Scholar. Journal officiel; 2002. 1 p.
18.     Aubry R, Puybasset L, Devalois B, Morel V, Viallard M-L. Loi du 2 février 2016 créant de nouveaux droits en faveur des malades et des personnes en fin de vie : analyse et commentaires. Médecine Palliative : Soins de Support – Accompagnement – Éthique. 2016;15(3):165-70.
19.     Bastow MD, Rawlings J, Allison SP. Benefits of supplementary tube feeding after fractured neck of femur: a randomised controlled trial. Br Med J 1983;287(6405):1589-92.
20.     Beattie AH, Prach AT, Baxter JP, Pennington CR. A randomised controlled trial evaluating the use of enteral nutritional supplements postoperatively in malnourished surgical patients. Gut. 2000;46(6):813-8.
21.     Hartgrink HH, Wille J, König P, Hermans J, Breslau PJ. Pressure sores and tube feeding in patients with a fracture of the hip: a randomized clinical trial. Clin Nutr. 1998;17(6):287-92.
22.     Stratton RJ, Ek A-C, Engfer M, Moore Z, Rigby P, Wolfe R, et al. Enteral nutritional support in prevention and treatment of pressure ulcers: a systematic review and meta-analysis. Ageing Res Rev. 2005;4(3):422-50.
23.     Milne AC, Avenell A, Potter J. Meta-analysis: protein and energy supplementation in older people. Ann Intern Med. 2006;144(1):37–48.
24.     Feldblum I, German L, Castel H, Harman-Boehm I, Shahar DR. Individualized nutritional intervention during and after hospitalization: the nutrition intervention study clinical trial. J Am Geriatr Soc. 2011;59(1):10-7.
25.     Hegerová P, Dědková Z, Sobotka L. Early nutritional support and physiotherapy improved long-term self-sufficiency in acutely ill older patients. Nutrition. 2015;31(1):166-70.
26.     de van der Schueren MAE, Wijnhoven HAH, Kruizenga HM, Visser M. A critical appraisal of nutritional intervention studies in malnourished, community dwelling older persons. Clin Nutr. 2016;35(5):1008-14.

DENTITION AND MALNUTRITION RISK IN COMMUNITYDWELLING OLDER ADULTS


R. Zelig1,2, L. Byham-Gray1, S.R. Singer2, E.R. Hoskin3, A. Fleisch Marcus1, G. Verdino1, D.R. Radler1,2, R. Touger-Decker1,2


1. School of Health Professions’ Department of Nutritional Sciences at Rutgers University; 2. School of Dental Medicine, Department of Diagnostic Sciences, at Rutgers University; 3. School of Dental Medicine, Department of Restorative Dentistry, at Rutgers University

Corresponding Author: Rena Zelig, DCN, RDN, CDE, CSG, 65 Bergen Street #157, Newark, NJ 07107, (973)-972-5956, zeligre@shp.rutgers.edu

J Aging Res Clin Practice 2018;7:107-114
Published onlineAugust 7, 2018, http://dx.doi.org/10.14283/jarcp.2018.19


Abstract

Background and Objective: Older adults are at risk for both impaired oral health and suboptimal nutritional status. The objective of this study was to explore the relationships between malnutrition risk and missing teeth in community-dwelling older adults. Design: This was a retrospective cross-sectional analysis of data obtained from the electronic health records of 107 patients aged 65 and older who attended an urban northeast US dental school clinic between June 1, 2015 and July 15, 2016. Odontograms and radiographs were used to identify teeth numbers and locations; malnutrition risk was calculated using the Self-Mini Nutritional Assessment (Self-MNA). Relationships between numbers of teeth and malnutrition risk were assessed using bivariate logistic regression. Results: Participants (N=107) were 72.6 years (SD=5.6) of age; 50.5% were female. Mean Self-MNA score was 12.3 (SD=2.0) reflective of normal nutrition status; 20.6% were at risk for malnutrition, 4.7% were malnourished. Greater than 87% were partially or completely edentulous. Those with 10-19 teeth had lower Self-MNA scores (mean=11.6, SD=2.5) than those with 0-9 teeth (mean=12.7, SD=1.3) or 20 or more teeth (mean=12.6, SD=1.8) and had an increased risk for malnutrition (OR=2.5, p=0.076). Conclusion: The majority of this sample of older adults were partially edentulous and of normal nutritional status. Those with 10-19 teeth were more likely to be at risk for malnutrition. Further studies are needed to examine relationships between tooth loss and malnutrition risk and the impact of impaired dentition on the eating experience in a larger sample and to inform clinical practice.

Key words: Nutrition, Nutrition Assessment), MNA, Self-MNA, malnutrition, dentition, tooth loss, elderly.


Introduction

The relationships between nutrition and oral health are synergistic. The mouth is the entry way for food and fluid intake. If its integrity is impaired, the functional ability of an individual to consume an adequate diet may be adversely impacted. Older adults are a vulnerable population at high risk for both impaired oral health and malnutrition (1-4). Petersen (1) et al reported that 30% of older adults ages 65-74 globally were completely edentulous and many more were missing some of their natural teeth. Data from the United States (US) National Health and Nutrition Examination Survey (NHANES) 2011–2012, revealed that approximately 13% of those aged 65–74 and 26% of those aged 75 and over were edentulous (2).
Tooth loss may affect the ability of an individual to consume an adequate diet (5-9). Prior research has demonstrated relationships between nutritional status, nutrient intake, oral health and diet quality (5-9). The number and distribution of teeth impact masticatory function. Large population studies (5-9) have found that partial and complete edentulism are associated with changes in food and nutrient intake in older adults including decreased consumption of fruit, vegetables, dietary fiber, calcium, iron, and other vitamins.  Independent of its cause, inadequate intake in older adults leads to weight loss, malnutrition, and ultimately increased morbidity and mortality (10, 11).
The etiology of malnutrition in older adults is multifaceted and may be related to physiological and psychological changes that contribute to variable food and nutrient intake (12-14). Kaiser and colleagues (3) pooled analyses from multinational studies which used the Mini Nutritional Assessment (MNA) to evaluate malnutrition prevalence and risk and reported that 22.8% of the older adults studied were malnourished and 46.2% were at risk for malnutrition. Huhmann et al (4) explored malnutrition risk in community dwelling older adults using the Self-MNA , a validated self-administered version of the MNA and found that 27% of subjects were malnourished, 38% were at risk of malnutrition, and 35% had normal nutrition status (4).
A systematic review by Zelig et al (15) exploring the associations between missing teeth and nutritional status (determined by MNA score) in community dwelling older adults revealed conflicting findings. Significant associations were found in five of eight studies between missing teeth (16-18) or the use of dental prostheses (19, 20) and malnutrition risk. MNA scores were significantly lower in those with fewer teeth/limited occlusion as compared to those with more teeth and/or more posterior occluding teeth pairs.  However, other researchers did not report significant associations between occlusal status (21) or dental status (22) and MNA score.
Similarly, Toniazzo et al (23) systematically explored associations between malnutrition risk assessed by MNA or Subjective Global Assessment (SGA), and oral health status in elders and found that individuals with or at risk for malnutrition had significantly fewer teeth than those with normal nutritional status (23). However, similar to Zelig et al, a significant relationship between edentulism and malnutrition risk was not consistently identified.
Given the heterogeneity of the findings in this area (15, 23), the aim of this study was to explore the associations between nutritional status (as defined by the Self-MNA) and dentition status (missing teeth and edentulism with and without denture replacement) in older adults (=>65 years old) who came to the Rutgers School of Dental Medicine (RSDM) clinics in Newark, New Jersey (NJ), between June 1, 2015 and July 15, 2016.  Analyses from the NHANES surveys conducted from 1999-2010 have consistently shown that partial and complete edentulism are more common in females, in persons who are Black or Hispanic, and in those who are of a lower socio-economic status (24, 25). The population of patients treated at the RSDM provided a convenience sample of vulnerable individuals at high risk for impaired dentition status and malnutrition given their racial diversity and low socio-economic status (24-26). We hypothesized that Self-MNA scores will be significantly lower in those with fewer teeth/limited occlusion as compared to those with more teeth and/or more posterior occluding teeth pairs (15, 23).


Materials and Methods

Sample Design and Sample Selection

This was a retrospective cross-sectional analysis of data obtained from the electronic health records (EHR), (Axium, EXAN, Vancouver, BC, Canada) of patients who attended the RSDM clinic in Newark, NJ between June 1, 2015 and July 15, 2016. The EHR report contained select data provided by patients (n=192) during initial screening which included demographic characteristics, medical and dental history, and Self-MNA data. Patients were excluded (n=85) if they were younger than 65 years, height and/or weight were not available in the dental record, Self-MNA data were incomplete, and/or the number and location of teeth could not be accurately mined from the EHR. This study was approved by the Rutgers University Biomedical and Health Sciences Institutional Review Board.

Assessment of Nutritional Status

Data regarding nutritional status were obtained from the EHR using patient responses to the Self-MNA tool (Nestle Nutrition, available at http://www.mna-elderly.com/forms/Self_MNA_English_Imperial.pdf).
The original 18-item Mini Nutritional Assessment (MNA) was developed and validated in 1994 by Nestle Nutrition to detect risk for malnutrition in adults aged 65 and older (27).  A condensed version of the MNA, the Mini Nutritional Assessment Short Form (MNA-SF), containing only six questions, was validated to further facilitate rapid nutritional screening in older adults, as it takes only three to five minutes to administer and retains the diagnostic accuracy of the full MNA (28, 29). In 2013, the Self-Administered MNA (Self-MNA) was adapted from the MNA-SF and validated by Huhmann et al (4) to allow the patient to provide a self-assessment of their nutritional status (4). The Self-MNA requires that the patient or their caregiver complete the assessment prior to their appointment with the healthcare provider; it can then be reviewed with the healthcare provider to identify risk factors for malnutrition (4). The Self-MNA contains six questions which address recent changes in intake and weight, mobility, recent stress, illness, dementia and sadness, as well as body mass index (BMI). A score of 0-7 is considered malnourished, 8-11 is at risk of malnutrition and 12-14 reflects normal nutritional status (4).

Assessment of Dentition Status

Number and location of teeth were mined from the EHR using patient digital radiography and odontogram data. A research assistant, trained and calibrated with a prosthodontist, recorded tooth numbers as either “present” or “missing”. If the tooth surface had been restored with a permanent crown, implant, or fixed bridge the tooth was reported as “present.” The four third molars/wisdom teeth were not included as they are not consistently present in all individuals. The presence and location of these permanent natural or restored tooth surfaces was also used to categorize the number of anterior and posterior occluding pairs of teeth (AOP and POP, respectively), defined as the “presence of a natural (or restored permanent) tooth on the maxilla and corresponding mandible, excluding remaining roots or root caps (page 316)” (30). Number of natural or restored teeth was categorized in a manner similar to prior research into those with 0-9 teeth, 10-19 teeth and 20 or more teeth (17, 31, 32).

Data Analysis

All statistical analyses were conducted using the Statistical Package for Social Sciences (version 22.0, SPSS Inc., Chicago, IL). A sample size of 85 was determined to be needed to establish if a correlation existed between the number of remaining teeth and Self-MNA score, based on a two-tailed test with an a priori alpha of p≤0.05 and 80% power to detect  an small-moderate effect of at least 0.3 (33). Statistical significance was set at p<0.05.
Descriptive statistics were used to summarize all of the study variables. To test the hypothesis that Self-MNA scores will be significantly lower in those with fewer teeth / limited occlusion as compared to those with more teeth and/or more posterior occluding teeth pairs, Spearman’s Correlation Coefficient was used. Associations between categorical variables were evaluated using the chi-squared test; non-parametric Mann-Whitney and Kruskal-Wallis tests were used to compare groups. Simple logistic regression was used to assess the odds of being at risk for malnutrition or malnourished related to number of teeth present. To determine potential confounding by demographic characteristics, bivariate analyses were conducted in accordance to age, gender, race and ethnicity as well as prior medical history.


Results

Characteristics of the study sample

Records from 107 community dwelling older adults who came for care to the RSDM clinics in Newark, NJ between June 1, 2015 and July 15, 2016 were included in the analyses (Figure 1). Their mean age was 72.6 years (SD=5.6) with a range of 65-91 years. Table 1 describes demographic and clinical characteristics of participants.
The mean Self-MNA score of this sample was 12.3 (SD=2.0) reflective of normal nutrition status. Twenty percent (20.6%, n=22) were at risk for malnutrition and 4.7% (n=5) were malnourished according to their Self-MNA responses. A moderate to severe decrease in food intake was reported by 27.1% (n=29) of the patients; 32.7% (n=35) indicated a weight loss of two or more pounds in the past three months (Table 2). Of those who reported a weight loss of more than seven pounds in three months (n=14), all were either at risk for malnutrition (n=10) or malnourished (n=4).
Of the five who were categorized as having malnutrition; 80% (n=4) reported a severe or moderate decrease in food intake, a weight loss greater than seven pounds in three months, and that they had been stressed or severely ill in the past three months; 60% (n=3) of these also had positive responses for severe dementia and/or prolonged sadness; 40% (n=2) were unable to get out of bed or a chair without assistance.
Using the Centers of Disease Control and Prevention (34) (CDC) BMI categories, 21.5% (n=23) were in the normal weight range, 43.0% (n=46) were overweight and 35.5% (n=38) were obese. All those whose Self-MNA score reflected malnutrition (n=5) were obese (mean BMI = 31.6, SD =4.5) with higher BMI values than those who had a normal nutritional status (mean BMI = 29.0, SD=5.0) or who were at risk for malnutrition (mean BMI = 27.6, SD=4.7).


Table 1 Select demographic and clinical characteristics of the study sample (N=107)

Table 1
Select demographic and clinical characteristics of the study sample (N=107)

Note: Sample size for each question varied as participants were able to choose to not answer questions on the registration forms.

Table 2 Responses to Self-MNA questions by nutritional status category (N=107)

Table 2
Responses to Self-MNA questions by nutritional status category (N=107)


The majority of participants were partially edentulous (n=94, 87.8%); 4.7% (n=5) were completely edentulous and 7.5% (n=8) were fully dentate. Fifty-one (47.7%) had at least 20 teeth, 29.9% (n=32) had 10-19 teeth and 22.4% (n=24) had 0-9 teeth. Approximately one-third (35.5%, n=38) of the sample had no posterior occlusion and 7.5% (n=8) had complete posterior occlusion; approximately one quarter (26.2%, n=28) had no anterior occlusion and 43.0% (n=46) had complete anterior occlusion.
The mean number of natural or restored teeth decreased from 17.4 among those with normal nutritional status to 14.4 among those classified as having malnutrition; however, these differences were not statistically significant (p=0.656). Median values of teeth declined in a similar pattern, from 20 among those with normal nutritional status to 18 among those at risk for malnutrition and 15 among those categorized as having malnutrition (Figure 2).


Figure 1 Flow chart of study sample

Figure 1
Flow chart of study sample


Figure 2 Boxplot of number of natural or restored teeth by nutritional status category (N=107)

Figure 2
Boxplot of number of natural or restored teeth by nutritional status category (N=107)


Analyses of the relationships between dental and occlusal status and Self-MNA Score revealed no linear relationships between the Self-MNA score and the number of natural teeth (r=0.104, p=0.285), posterior occluding pairs (POP) of teeth (r=0.173, p=0.074) or anterior occluding pairs (AOP) of teeth (r=0.049, p=0.619).   Although mean differences were not significant (Kruskal-Wallis, p=0.116), those with 10-19 teeth had lower Self-MNA scores (mean=11.6, SD=2.5) than those with 0-9 teeth (mean=12.7, SD=1.3) or 20 or more teeth (mean=12.6, SD=1.8) (Figure 3). When MNA Score was dichotomized into those who were at risk for malnutrition or malnourished (25.2%, n=27) compared to those with normal nutritional status (74.8%, n=80), those with 10-19 teeth had 2.5 times the odds of being at risk for malnutrition/malnourished than those with 20 or more teeth (OR=2.5, p=0.076). Bivariate analyses yielded no statistically significant confounding effects of age, gender, race/ethnicity or medical history.

Figure 3 Boxplot of Self-MNA scores among those with different categories of natural or restored teeth (N=107)

Figure 3
Boxplot of Self-MNA scores among those with different categories of natural or restored teeth (N=107)


Discussion

The aim of this study was to explore the associations between nutritional status and dentition status among older adults who presented for care at the RSDM clinics in Newark, NJ.  The study hypothesis that Self-MNA scores will be significantly lower in those with fewer teeth / limited occlusion as compared to those with more teeth and/or more posterior occluding teeth pairs was not supported as a significant direct relationship between Self-MNA score and number of natural or restored teeth was not found.
The majority of the sample had some degree of tooth loss (87.8% partially edentulous; 4.7% completely edentulous). Although not statistically significant, there was a trend whereby the mean number of natural or restored teeth decreased from 17.4 in those with normal nutritional status to 14.4 in those classified as having malnutrition, suggesting a link between having fewer teeth and an increased risk of malnutrition. Those with 10-19 teeth had lower Self-MNA scores than those with 0-9 teeth or 20 or more teeth and, among those with 10-19 teeth the odds of being at risk for malnutrition/malnourished were 2.5 times those with 20 or more teeth. Interestingly, the patients with malnutrition had 10-19 teeth; none were fully dentate or fully edentulous.   Furuta et al (17) also noted a similar trend whereby those with 10-19 teeth had the lowest MNA-SF scores as compared to those with 0-9 teeth or greater than 20 teeth. While not significant, this finding suggests that those who are missing one third to two thirds of their natural teeth may be most at risk for becoming malnourished.
In contrast to our findings, Kikutani et al (16), Starr et al (18), and Furuta et al (17), reported significant associations between MNA scores and number of missing teeth whereby MNA scores were significantly lower in those with fewer teeth / limited occlusion as compared to those with more teeth and/or more posterior occluding teeth pairs of teeth. Kikutani et al found that individuals with more missing teeth and inadequate occlusion were more likely to be at risk for malnutrition, and those with functionally inadequate occlusion and no dentures had a 3.189 fold greater malnutrition risk than those with natural dentition and adequate function (16). Similarly, Starr et al demonstrated that individuals who were completely edentulous had significantly lower MNA scores than those who were partially or completely dentate (p = 0.028) (18). In bivariate models, Furuta et al found that those with 0-19 teeth had lower MNA scores than those with 20 or more teeth (p = 0.041), however, in a multivariate path analysis, no direct relationship was noted between oral health status and MNA score (17).
While the results of the current study showed similar trends they did not reach the level of statistical significance reported by others. Possible explanations for the variation in results lie in the differences in the populations studied. The subjects in our study were all patients of an urban northeast US dental school clinic in Newark, NJ, and were younger than participants in other studies (16-18). The combined 25% prevalence of malnutrition and risk for malnutrition was relatively lower than the 13.3% malnourished and additional 51.7% at risk for malnutrition reported by Kikutani et al (16), and 14.0% malnourished / 55.2% at risk of malnutrition reported by Furuta et al (17). Participants in the current study had more teeth (mean of 17.0 ±8.5 compared to 8.6 +/- 9.9) (17) and were less likely to be edentulous then those studied by Furuta et al (17). In contrast, the population studied by Starr et al represented healthy older adults who were free of medical conditions and medications at baseline, and as a whole had relatively high MNA scores with a mean of 8.0 or greater out of a maximum score of 9 using their version of the MNA tool (18).
Our findings are consistent with preceding studies, which were unable to find statistically significant relationships between number of teeth (35), occlusal status (21) or dental status (22) and MNA score. Systematic reviews of the evidence (15, 23), have similarly found much conflicting results due in part to the heterogeneity of the studies comparing these variables. Nutritional status and dentition status can be assessed in a variety of ways.  Varying clinical and demographic characteristics of the populations sampled such as age, health status and country of origin add to the complexity of this area of research.
Natural dentition and adequate function are important to maintain nutritional status. Missing teeth and inadequate occlusion affect masticatory function and can result in a decline in overall quality and quantity of intake (5-9) and/or replacement of difficult to chew foods with softer foods that may be more calorically dense and/or nutrient poor which could lead to changes in weight and overall nutritional status (36, 37). Further studies that address diet quality and quantity are necessary to better understand these relationships and guide implications for practice.

Strengths and Limitations

Although the study sample was adequately powered and representative of the population of older adults who attend the RSDM clinic, the majority were overweight/obese and of normal nutrition status. The findings are limited to a single institution and not generalizable to other community dwelling dental settings. Given the retrospective design of this study, a cause and effect relationship between variables could not be established.   Risk for malnutrition may be better assessed using a tool such as the MNA-SF, which considers oral health factors specifically when looking at inadequate intake.
Strengths include data collection over a 13-month timespan to assure an adequate sample size, the availability of all of the data in the EHR, and the verification of dentition status by a research assistant, who was trained and calibrated with a prosthodontist, using digital radiography and the patient’s odontogram. The subjective nature of all self-reported data, including all demographic characteristics, height, weight, and Self-MNA data is a potential limitation. Although the Self-MNA is a validated tool to assess malnutrition prevalence and risk, it lacks the details found in the MNA-SF  that prompts the healthcare professionals to assess the etiology behind a decline in food intake such as loss of appetite, digestive problems, chewing or swallowing difficulties (4).


Conclusion

The findings of this study did not support relationships between the number of natural or restored teeth and Self-MNA score in this sample of community dwelling older adults. Although not statistically significant, the mean number of natural or restored teeth declined as nutritional status declined, which may be clinically relevant. Those classified as having malnutrition had higher rates of weight loss, decreased intake and more frequently reported dementia and/or depression, and severe illnesses than those with a normal nutritional status. Similarly, those classified as being at risk of malnutrition were more likely to experience weight loss and a moderate decline in intake than those who were classified as being of normal nutritional status.

Implications for Research

Our findings add to the heterogeneity of research outcomes in this area. The conflicting findings between studies is in part due to the use of different measures of nutrition and dental status as well as variations in demographic characteristics. Further research with larger samples, in different populations of community dwelling older adults with varying health conditions is needed to better understand the associations between nutrition and oral health and increase the generalizability of results. Prospective studies to determine and compare changes in nutritional status over time with changes in dentition and denture usage can help to determine cause and effect. Qualitative research aimed at understanding how impaired dentition affects intake, the eating experience and overall nutritional status can also help to shed light on these relationships, and can provide the necessary data upon which to develop practice based interventions and guidelines for this vulnerable population.  Although the Self-MNA has been validated as a self-administered tool to determine malnutrition prevalence and risk in community dwelling older adults, research in this area may benefit from using the MNA-SF, which is administered by a healthcare professional as older adults may require more clarification of questions to elicit more accurate results. The MNA-SF also includes a question related to decline in intake attributed to chewing or swallowing difficulties.

Implications for Practice

The dental clinic setting may be an ideal location to perform nutritional status screenings. As reported by Greenberg et al, both oral healthcare professionals and patients were receptive to screening for various medical conditions at the time of a dental visit (38, 39). This could be expanded to include nutritional status screening to identify patients at risk for malnutrition who may not regularly attend visits with a primary care provider. The results of the current study revealed that over 25% of the sample of older adults in this research who came for care at the RSDM clinic had malnutrition or were at risk for malnutrition. Based on these results and previous studies that estimated the prevalence of malnutrition to be over one third in older adults (3, 4), the use of nutritional screening tools by oral healthcare professionals could help to provide timely referrals to primary care physicians or Registered Dietitian Nutritionists for these individuals. Referrals to community assistance programs (such as Meals on Wheels) could also be made as appropriate to prevent decline in nutrition status.


Ethical standards: This study was approved by the Rutgers University Biomedical and Health Sciences Institutional Review Board.

Funding agency: Sackler Institute for Nutritional Sciences. PI Rena Zelig received an early career investigator’s grant from the Sackler Institute for Nutrition Sciences for a project entitled “Exploring the Associations between Dentition Status, Nutritional Status, and the Eating Experience in Older Adults – A Mixed Methods Study.” The sponsors had no role in the design and conduct of the study; in the collection, analysis, and interpretation of data; in the preparation of the manuscript; or in the review or approval of the manuscript.

Acknowledgements: Funding for this project was provided by the Sackler Institute for Nutritional Sciences of the New York Academy of Sciences. The authors wish to acknowledge Dr. Michael Conte and the Office of Clinical Affairs and the Information Technology Department at the Rutgers School of Dental Medicine, Newark, NJ as well as Steven Britton, DMD, and Veronica Jones, MPH, Research Assistants for their help with this study.

Conflict of Interest Disclosure: All authors report that they have no conflicts of interest to disclose related to this research and manuscript.


References

1.    Petersen PE, Kandelman D, Arpin S, Ogawa H. Global oral health of older people–call for public health action. Community Dent Health 2010;27(4 Suppl 2):257-67
2.     Dye BA, Thornton-Evans G, Li X, Iafolla TJ. Dental Caries and Tooth Loss in Adults in the United States, 2011–2012. NCHS data brief, no 197. Hyattsville, MD. National Center for Health Statistics. 2015. Available at:
https://www.cdc.gov/nchs/data/databriefs/db197.pdf. Accessed January 12, 2018.
3.     Kaiser MJ, Bauer JM, Ramsch C, et al. Frequency of malnutrition in older adults: a multinational perspective using the mini nutritional assessment. J Am Geriatr Soc  2010;58(9):1734-8 doi: 10.1111/j.1532-5415.2010.03016.
4.     Huhmann MB, Perez V, Alexander DD, Thomas DR. A self-completed nutrition screening tool for community-dwelling older adults with high reliability: a comparison study. J Nutr Health Aging 2013;17(4):339-44 doi: 10.1007/s12603-013-0015-x
5.     Sahyoun NR, Lin CL, Krall E. Nutritional status of the older adult is associated with dentition status. J Am Diet Assoc 2003;103(1):61-6 doi: 10.1053/jada.2003.50003
6.     Sheiham A, Steele J. Does the condition of the mouth and teeth affect the ability to eat certain foods, nutrient and dietary intake and nutritional status amongst older people? Public Health Nutr 2001;4(3):797-803
7.     Zhu Y, Hollis JH. Tooth loss and its association with dietary intake and diet quality in American adults. J Dent 2014;42(11):1428-35 doi: 10.1016/j.jdent.2014.08.012
8.     Iwasaki M, Taylor GW, Manz MC, et al. Oral health status: relationship to nutrient and food intake among 80-year-old Japanese adults. Community Dent Oral Epidemiol 2014;42(5):441-50
9.     Ervin RB, Dye BA. Number of natural and prosthetic teeth impact nutrient intakes of older adults in the United States. Gerodontology 2012;29(2):e693-702 doi: 10.1111/j.1741-2358.2011.00546.x
10.     Zajacova A, Ailshire J. Body Mass Trajectories and Mortality Among Older Adults: A Joint Growth Mixture-Discrete-Time Survival Analysis. Gerontologist 2013 doi: 10.1093/geront/gns164
11.     Lundin H, Saaf M, Strender LE, Mollasaraie HA, Salminen H. Mini nutritional assessment and 10-year mortality in free-living elderly women: a prospective cohort study with 10-year follow-up. Eur J Clin Nutr 2012;66(9):1050-3 doi: 10.1038/ejcn.2012.100
12.     Lorenzo-Lopez L, Maseda A, de Labra C, Regueiro-Folgueira L, Rodriguez-Villamil JL, Millan-Calenti JC. Nutritional determinants of frailty in older adults: A systematic review. BMC Geriatr 2017;17(1):108 doi: 10.1186/s12877-017-0496-2
13.     Favaro-Moreira NC, Krausch-Hofmann S, Matthys C, et al. Risk Factors for Malnutrition in Older Adults: A Systematic Review of the Literature Based on Longitudinal Data. Adv Nutr 2016;7(3):507-22 doi: 10.3945/an.115.011254
14.     van der Pols-Vijlbrief R, Wijnhoven HA, Schaap LA, Terwee CB, Visser M. Determinants of protein-energy malnutrition in community-dwelling older adults: a systematic review of observational studies. Ageing Res Rev 2014;18:112-31 doi: 10.1016/j.arr.2014.09.001
15.     Zelig R, Touger-Decker R, Chung  M, Byham-Gray L. Associations between Tooth Loss, with or without Dental Prostheses, and Malnutrition Risk in  Older Adults: A Systematic Review. Top Clin Nutr 2016;31(3):232-47
16.     Kikutani T, Yoshida M, Enoki H, et al. Relationship between nutrition status and dental occlusion in community-dwelling frail elderly people. Geriatr Gerontol Intl 2013;13(1):50-4 doi: 10.1111/j.1447-0594.2012.00855.x
17.     Furuta M, Komiya-Nonaka M, Akifusa S, et al. Interrelationship of oral health status, swallowing function, nutritional status, and cognitive ability with activities of daily living in Japanese elderly people receiving home care services due to physical disabilities. Community Dent Oral Epidemiol 2013;41(2):173-81 doi: 10.1111/cdoe.12000
18.     Starr JMH, R. J.;Macintyre, S.;Deary, I. J.;Whalley, L. J. Predictors and correlates of edentulism in the healthy old people in Edinburgh (HOPE) study. Gerodontology 2008;25(4):199-204
19.     Cousson PY, Bessadet M, Nicolas E, Veyrune JL, Lesourd B, Lassauzay C. Nutritional status, dietary intake and oral quality of life in elderly complete denture wearers. Gerodontology 2012;29(2):e685-92 doi: 10.1111/j.1741-2358.2011.00545.x
20.     McKenna G, Allen PF, Flynn A, et al. Impact of tooth replacement strategies on the nutritional status of partially-dentate elders. Gerodontology 2012;29(2):e883-90 doi: 10.1111/j.1741-2358.2011.00579.x
21.     Soini H, Routasalo P, Lauri S, Ainamo A. Oral and nutritional status in frail elderly. Spec Care Dent 2003;23(6):209-15
22.     Soini H, Routasalo P, Lagstrom H. Nutritional status in cognitively intact older people receiving home care services–a pilot study. J Nutr Health Aging 2005;9(4):249-53
23.     Toniazzo MP, Amorim PS, Muniz FW, Weidlich P. Relationship of nutritional status and oral health in elderly: Systematic review with meta-analysis. Clin Nutr 2017 doi: 10.1016/j.clnu.2017.03.014
24.     Dye BA, Li X, Thornton-Evans G. Oral Health Disparities as Determined by Selected Healthy People 2020 Oral Health Objectives for the United States, 2009–2010. NCHS data brief: US Department of Health and Human Services, Centers for Disease Control and Prevention, National Center for Health Statistics, 2012.
25.     National Institutes of Health. National Institute of Dental and Craniofacial Research. Tooth Loss in Seniors (Age 65 and Over). Tooth Loss in Seniors (Age 65 and Over)  March 11, 2014. Available at: https://www.nidcr.nih.gov/DataStatistics/FindDataByTopic/ToothLoss/ToothLossSeniors65andOlder.htm. Accessed January 12, 2018.
26.     Bureau USC. QuickFacts. Newark city, New Jersey. Available at: https://www.census.gov/quickfacts/table/PST045215/3451000,34. Accessed January 12, 2018.
27.     Guigoz Y, Vellas B. The Mini Nutritional Assessment (MNA) for grading the nutritional state of elderly patients: presentation of the MNA, history and validation. Nestle Nutrition workshop series. Nestle Nutr Workshop Ser Clin Perform Programme 1999;1:3-11; discussion 11-2.
28.     Rubenstein LZ, Harker JO, Salva A, Guigoz Y, Vellas B. Screening for undernutrition in geriatric practice: developing the short-form mini-nutritional assessment (MNA-SF). J Gerontol A Biol Sci Med Sci 2001;56(6):M366-72
29.     Kaiser MJ, Bauer JM, Ramsch C, et al. Validation of the Mini Nutritional Assessment short-form (MNA-SF): a practical tool for identification of nutritional status. J Nutr Health Aging 2009;13(9):782-8
30.     Yoshida M, Kikutani T, Yoshikawa M, Tsuga K, Kimura M, Akagawa Y. Correlation between dental and nutritional status in community-dwelling elderly Japanese. Geriatr Gerontol Intl 2011;11(3):315-9 doi: 10.1111/j.1447-0594.2010.00688.x
31.     Ostberg AL, Nyholm M, Gullberg B, Rastam L, Lindblad U. Tooth loss and obesity in a defined Swedish population. Scand J Public Health 2009;37(4):427-33
32.     Syrjala AMY, P.;Hartikainen, S.;Sulkava, R.;Knuuttila, M. Number of teeth and selected cardiovascular risk factors among elderly people. Gerodontology 2010;27(3):189-92
33.     Portney L, Watkins M. Foundations of Clinical Research, Applications to Practice. 3 ed. Upper Saddle River, NJ: Pearson Education, Inc, 2009.
34.     Centers for Disease Control and Prevention. Healthy Weight. Secondary Healthy Weight. Available at: http://www.cdc.gov/healthyweight/assessing/bmi/adult_bmi/index.html. Accessed January 12, 2018.
35.     Lopez-Jornet P, Saura-Perez M, Llevat-Espinosa N. Effect of oral health dental state and risk of malnutrition in elderly people. Geriatr Gerontol Int 2013;13(1):43-49 doi: 10.1111/j.1447-0594.2012.00853.x
36.     Musacchio EP, E.;Binotto, P.;Sartori, L.;Silva-Netto, F.;Zambon, S.;Manzato, E.;Corti, M. C.;Baggio, G.;Crepaldi, G. Tooth loss in the elderly and its association with nutritional status, socio-economic and lifestyle factors. Acta Odontol Scand 2007;65(2):78-86
37.     Ikebe KM, K.;Morii, K.;Nokubi, T.;Ettinger, R. L. The relationship between oral function and body mass index among independently living older Japanese people. Int J Prosthodont 2006;19(6):539-46
38.     Greenberg BL, Glick M, Frantsve-Hawley J, Kantor ML. Dentists’ attitudes toward chairside screening for medical conditions. J Am Dent Assoc 2010;141(1):52-62
39.     Greenberg BL, Kantor ML, Jiang SS, Glick M. Patients’ attitudes toward screening for medical conditions in a dental setting. J Public Health Dent 2012;72(1):28-35 doi: 10.1111/j.1752-7325.2011.00280.x

DIVERSIFIED ANALYSIS OF NUTRITIONAL STATUS IN COMMUNITY-DWELLING OLDER ADULTS IN JAPAN


M. Kawashima1, M. Kubota1,2, H. Saito1, S. Shinozuka3


1. Department of Human Life and Environment, Nara Women’s University, Nara, Japan; 2. Faculty of Agriculture, Department of Food and Nutrition, Ryukoku University, Shiga, Japan; 3. Shinozuka Clinic, Osaka, Japan

Corresponding Author: Masaru Kubota, Faculty of Agriculture, Department of Food and Nutrition, Ryukoku University, Shiga, Japan, e-mail: masaru_kubota@chime.ocn.ne.jp

J Aging Res Clin Practice 2017;6:223-228
Published online November 8, 2017, http://dx.doi.org/10.14283/jarcp.2017.30


Abstract

Objectives: This study aimed to comprehensively analyze the nutritional status of community-dwelling older adults in Japan. Design and Participant: Participants included 48 outpatients (13 males and 35 females) aged ≧65 years who visited a private clinic in an urban city. Body height, body weight, and blood variables, including albumin, lymphocyte counts and total cholesterol, and pre-albumin, were obtained from the patient charts. The MNA-SF and nutritional intakes, using an established semiquantitative questionnaire, were conducted by an interview with a dietitian. Results: Nutritional risk assessment by MNA-SF revealed that 13 patients (27.1%) were at a risk of malnutrition and 4 patients (8.3%) demonstrated thinness, i.e., BMI <18.5 kg/m2. No statistical difference in terms of sex was found in the MNA-SF or BMI analyses. The caloric, protein, and lipid intake, adjusted by body weight, were significantly higher in females than in males. The daily caloric intake of 15 patients (31.3%) was below the estimated energy requirements defined by Dietary Reference Intakes for Japanese (2015), and the frequency of low estimated energy requirements was significantly higher in males than in females. Multiple regression analysis demonstrated that both BMI and MNA-SF were associated with albumin levels. Conclusions: Our findings suggest that malnutrition is not prevalent among community-dwelling older adults in Japan. Albumin may work as indicators for predicting malnutrition. Considering the lower caloric, protein, and lipid intake of males compared with females, caregivers should note that older adult males may be at a higher risk of malnutrition.

Keywords: Malnutrition, older adults, MNA-SF, albumin, nutritional intake.


Introduction

The number of individuals aged ≥65 years, hereafter referred to as older adults, has rapidly increased in developed countries. In Japan, according to the national census in 2015, approximately 27% of the entire population falls into this category (1). Under these circumstances, healthcare for older adults has become important in terms of minimizing both acute and chronic comorbidities and promoting healthy, active lifestyles. Nutritional care plays an integral role in health, regardless of the type of dwelling (i.e., community, nursing-care, or hospital) (2-4).
For adequate achievement of nutritional care, nutritional assessment is a necessary initial step. There are several methods for nutritional assessment, including short screening questionnaires, anthropometric measures, and laboratory markers. The Mini Nutritional Assessment (MNA) is a widely used screening tool for identifying individuals with malnutrition or those at a risk of malnutrition (5). Because MNA contains specific questions related to older adults (i.e., independence, cognition, quality of life, and morbidity), the European Society for Clinical Nutrition and Metabolism recommends MNA as a commonly acceptable tool for nutritional screening in older adults (6). Recently, the MNA Short-Form (MNA-SF), which includes six questions from the original MNA, has been validated as a more suitable tool for older adults (7). Anthropometric measures, such as body weight, BMI, and calf circumferences, are also useful (8). Finally, among various laboratory markers, albumin level has been used as the gold standard for the diagnosis of malnutrition, although its accuracy and precision can be affected by inflammation or hepatic functions (9,10). In order to compensate for this limitation, the Nutritional Control Status (CONUT) system, which utilizes several laboratory tests simultaneously, including albumin levels, total cholesterol levels and total lymphocyte counts has been developed for clinical use (11).
A nutritional intake study is a distinguished approach for the nutritional assessment, since it tries to focus on a causative factor of malnutrition. A careful investigation of nutrition, both quantitative (i.e., energy intake) and qualitative (i.e., nutrient quality), may provide means of preventing malnutrition (12); however, this method has limitations in the older adult population, given the higher rates of cognitive and functional decline, which may hamper the accuracy of dietary assessment (13). In addition, the standard of nutritional intakes, for example, estimated energy requirements (EER), may differ among countries, making it difficult to compare across populations of different countries. Therefore, it is essential to establish and utilize the standard values specific to each country (14).
As described above, each nutritional assessment methodology has its advantages and limitations. Therefore, our study utilized a mixed-methods approach (i.e., measurement of MNA-SF, BMI, laboratory markers, and nutritional intake measurements) to obtain a more comprehensive understanding of malnutrition prevalence and characteristics among community-dwelling older adults in Japan.


Materials and methods

Study design and subjects

This study was conducted between May and July 2014 on outpatients who visited Shinozuka Clinic, Higashi-Osaka, a private clinic specializing in internal medicine. Higashi-Osaka is one of the satellite cities of Osaka, with a population of approximately 500,000, 27% of which are aged ≥65 years. Among patients visiting the clinic during that period, 330 patients fulfilled the following inclusion criteria: (i) age ≥65 years (definition of older adults in Japan), (ii) ambulant patients, and (iii) had data on body height and weight recorded within the last month. We asked these patients whether they were able to participate in the subsequent nutritional intake study, and 48 were finally enrolled in the study. The basic characteristics, such as sex, age, BMI, and underlying disease status, in these 48 patients were comparable with the 330 patients initially selected to participate (Table 1). This project was approved by the ethical and epidemiological committee of Nara Women’s University.

Measurement of body height, weight, MNA-SF and blood markers

Body height and weight were measured by well-trained nurses. Height was measured to the nearest 0.1 cm, and weight was measured to the nearest 0.1 kg. BMI was calculated by dividing the body weight (kg) by the square of height (m). Nutritional risk assessment was performed using MNA-SF (7). Scores between 8 and 11 and ≤7 were defined as malnutrition at risk and malnutrition, respectively. Data on serum albumin, total leukocytes counts with their differentials, total cholesterol, and pre-albumin levels were obtained from the recent patient charts within 1 month. C-reactive protein (CRP) levels at the time of sampling were <1.0 mg/dl in all patients. The cutoff of albumin level (<3.5 g/dl), total cholesterol levels (<180 mg/dl) and total lymphocyte counts (<1600/μl) were obtained from the CONUT study. CONUT scores were calculated as described by Ignacio de Ulibarri et al. (11), and the scores were classified as follows: healthy, 0–1; light undernutrition, 2–4; moderate undernutrition, 5–8; and severe undernutrition, 9–12. For pre-albumin levels, we used a cutoff of <21.0 mg/dl, described by Takeda et al. (15).


Table 1 Basic characteristics of participants

Table 1
Basic characteristics of participants

* Numbers in parentheses indicate percentages. § Median and range in brakets are shown; †Chi-squared test or Fisher’s exact test. ‡Mann-Whitney U test

Nutritional intake study

We collected nutritional information from each patient (i.e., nutritional intake in the last 1 week), using the established semiquantitative questionnaire “Excel Eiyou-kun, FFG3.5” (Kenpaku-sha, Tokyo, Japan) (16). FFG3.5 consists of 29 food groups and estimates the amount of food group and nutrient ingested based on self-reported intake data (i.e., portion size and frequency). Portion size is a simple, countable unit used to describe the approximate amount of food in each dish. Our dietitian and chief investigator, MK, conducted face-to-face interviews with the patients to obtain this information and demonstrated approximate portion sizes of different foods.

Statistical analysis

Differences in categorical variables were examined using the Chi-squared test or Fisher’s exact test and differences in continuous variables were examined using the Mann–Whitney U test. Correlation between albumin and pre-albumin levels was estimated using the Spearman’s rank-order test. Multiple regression analysis was performed using BMI or MNA-SF as a response variable. All statistical analyses were performed using Excel Statistics (Version 2012). A p-value of <0.05 was considered significant.


Results

Nutritional parameters

Data on various nutritional parameters are summarized in Table 2. Results from MNA-SF showed that 13 patients (27.1%) were at a risk of malnutrition, whereas no patients were malnourished. In contrast, BMI of <18.5 kg/m2, an indicator of thinness, was seen only in four patients (8.3%). Analysis of the blood markers, using the CONUT criteria (11), albumin, total cholesterol levels and total lymphocyte counts, were low in 3 (6.3%), 21 (43.8%), and 12 patients (25.0%), respectively. The results did not significantly differ between sexes; however, when evaluated as a continuous variable, albumin level was significantly lower in males than in females. While differences in terms of sex was marginal (0.05<p<0.1), total cholesterol levels tended to be higher in females than in males. Low pre-albumin levels, as judged by the Japanese criteria, were found in 5 patients (11.1%). Correlation efficiency between albumin and pre-albumin levels was 0.27, demonstrating weak statistical significance (p = 0.059). Finally, in the comprehensive analysis of laboratory tests consisting of 3 parameters (albumin, total cholesterol levels and total lymphocyte counts), 40 patients (83.3%) were found to be healthy, whereas only 1 patient (2.1%) was found to be moderately undernourished.

Table 2 Comparison of various nutritional parameters

Table 2
Comparison of various nutritional parameters

* Median and range in brakets are shown. § Numbers in parentheses indicate percentages; Comparison between “Male” and “Female” groups done by†Mann-Whitney U test ‡ Chi-squared test or Fisher’s exact test

Nutritional intakes

Table 3 depicts the nutritional intakes obtained by FFG3.5. Analysis of caloric intake and ingestion of 3 major nutrients (protein, lipid, and carbohydrate), as adjusted by body weight, showed that females consumed more than males except carbohydrate. In contrast, no difference was found in total daily caloric and protein intakes between males and females. 15 patients (31.3%) showed caloric intakes below EER and 6 (12.5%) patients showed protein intakes below estimated average requirement (EAR) established on the Dietary Reference Intakes for Japanese (2015) (17). This reference recommends 2100 kcal/day for males aged 50–69 years, 1850 kcal/day for males aged >70 years, 1650 kcal/day for females aged 50–69 years, and 1500 kcal/day for females aged >70 years. EAR for protein recommends 50 g/day for males and 40 g/day of protein for females. The rate of males below EER recommendations was significantly higher than that of females.

Table 3 Comparison of nutritional intakes

Table 3
Comparison of nutritional intakes

* EER: Estimated Energy Requirement indicates in males, 2100 (kcal/day) for 50-69 years,1850 (kcal/day) for over 70 years,   in females, 1650 (kcal/day) for 50-69 years, 1500 (kcal/day) for over 70 years, EAR: Estimated Average Requirement   for protein indicates 50 (g/day) in males, and 40 (g/day) in females.  These values are based on “Dietary Reference Intakes for Japanese (2015)”. § Median and range in brakets are shown. ∏ Numbers in parentheses indicate percentages. Comparison between “Male” and “Female” groups done by†Mann-Whitney U test ‡ Chi-squared test or Fisher’s exact test

Multiple regression analysis

As shown in Table 4, significant, positive associations were found between albumin levels and both BMI and MNA-SF. Furthermore, a negative association was found between females and MNA-SF.


Table 4 Correlation between BMI or MNA-SF and various parameters by multiple regression analysis

Table 4
Correlation between BMI or MNA-SF and various parameters by multiple regression analysis

* Coefficient of determination (R2) for BMI, 0.38; MNA-SF, 0.49


Discussion

Nutritional status is a key determinant of health, particularly in the older adult population (2-4). Dwelling type and age have been found to influence malnutrition prevalence of malnutrition.  There are nutritional assessments that focus on older adults within certain dwellings, including community dwellings (18-22), hospital (23) and nursing home (24). In reviewing available data on malnutrition by MNA, Cereda et al. reported considerable differences in malnutrition prevalence by clinical setting, with 3.1% prevalence in communities, 8.7% in homecare services, 22.0% in hospitals, and 29.4% in rehabilitation/sub-acute care clinics (25). Considering the growing older adult population, the nutritional assessment of those living in community settings is essential for early detection and early intervention of malnutrition.
This study used MNA-SF as a screening tool for malnutrition and risk of malnutrition. Consequently, 13 patients (27.1%) were found to be at a risk of malnutrition, without differences in terms of sex. None of our patients were found to be malnourished. Previous studies performed in Japan revealed that 12.6% were at a risk of malnutrition based on MNA (18) and 34.7% (26) on MNA-SF. On the other hand, the reports from Europe (19, 21, 22) and China (20) using either MNA or MNA-SF demonstrated the rates of the sum of malnutrition at risk and malnutrition were 22.5-76.1%. Subject numbers of these studies are not large enough to discuss the reason(s) for the different prevalence at present. However, studies targeting at the population with older age, more than 80 years old, tended to demonstrate higher prevalence of malnutrition (20,21).
Albumin, the most abundant protein in the plasma, works as an indicator of nutritional status, although inflammation and liver function have an effect on its metabolism, which often impacts results (9, 10). When albumin levels of <3.5 g/dl are defined as hypoalbuminemia (11, 27), 3 patients (6.3%) in our study demonstrated hypoalbuminemia, a cutoff value indicating malnutrition.. This prevalence is similar to other studies on the older adult population. One study reported that 3.1% of patients had hypoalbuminemia among 4,115 patients aged 71 years and elder (27), and a Japanese study reported that among 1130 patients aged ≥65 years, 2.4% of males and 1.5% of females had hypoalbuminemia (28). Furthermore, in our multiple regression model, albumin levels were shown to be independently associated with MNA-SF and BMI. This association with MNA-SF is consistent with previous reports by Ülger et al. (19) and Ji et al. (20). Taken together, albumin can work as a good marker for nutritional status assessment in older adults. Pre-albumin is used in evaluating acute nutritional changes because of its shorter half-life than albumin (9). Because the reference value for pre-albumin has not been well established, we used the cutoff value presented by Takeda et al. (15) and demonstrated low levels in 5 patients (11.1%). This prevalence of low pre-albumin was almost identical to a report among the French older adults, using the cutoff of 20 mg/dl (29). This study also demonstrated that pre-albumin levels weakly correlated with albumin levels.
Several methods exist for evaluating nutritional intakes, including validated FFQ, dietary history, 24-h recall, and dietary records of ≥3 days (30). Among them, we have chosen the validated FFQ (16) by a face-to-face interview because of the possible impairment of cognition in the older adult population. EAR for energy presented by the World Health Organization (WHO) is based on a physical activity score of 1.6 and body weight of 80 kg for men and 65 kg for women (30). Because these values are much greater than the Japanese standards, we adapted our own reference values established on the basis of Dietary Reference Intakes for Japanese (2015), to mirror similar Japanese reports (14,16). Our findings indicate that the nutritional intakes in females were more desirable than in males. Namely, caloric and protein intakes in females tended to be higher than those in males. Therefore, older adult males in Japan may have the possibility of becoming malnourished in their later life.
The present study has several limitations. First, the number of subjects was small because only 15% of the 330 initially enrolled patients agreed to participate. However, as shown in Table 1, the basic characteristics, including sex, age, BMI, and underlying disease status, between initially enrolled population and the study population were statistically similar. Second, other factors related to older adult nutritional status (i.e., presence of depression, level of dependence, and physical activity) were not included. In fact, previous studies have shown that these factors were independently associated with malnutrition of older adults in the community (18-22, 25). Finally, although we checked the presence of underlying diseases, including non-communicable diseases, we were unable to incorporate these data into the analysis. The reason behind this is that the status of controlling the disease is quite diverse among patients, even if the clinical diagnosis is the same. In spite of these limitations, the present study is quite informative because comprehensive parameters, i.e., malnutrition screening tool (MNA-SF), anthropometry (BMI), laboratory tests (albumin, pre-albumin, cholesterol, total lymphocyte counts, and CONUT scores), and nutritional intakes (FFQ) were measured simultaneously. In conclusion, Japanese older adults in the community are fairly well nourished; however, the nutritional intake study indicates that older adult males may be at higher risk of malnutrition in the future than women. Community caregivers should take note of this finding and update their care plans accordingly.


Acknowledgments: This research did not receive any specific grant from funding agencies in the public, commercial, or not-for-profit sectors. The authors would like to thank Enago (www.enago.jp) for their pertinent advice on the present review.

Conflict of interests: The authors declare that they have no conflicts of interest. .

Ethical standard: We have obtained only “verbal consent” from the participants. Instead of the formal written consent, the chief physician (S.Shinozuka) explained the details of the study and, when their consent was obtained, he described it in the patient’s chart with his signature. This study was “an observational study” without any invasive procedures. Namely, blood samples were obtained from the participants as one of the regular clinical works, not specifically for this clinical research. In the study of nutritional intake, “no specific” intervention was performed. We just checked the participants’ daily diet life using FFQ. Therefore, we thought that the procedure described above (no.1) was enough from the point of ethics and for protection of patients’ right. This whole procedure of obtaining the informed consent was approved by the ethical committee at Nara Women’s University before starting this research, as described in the text. This study was conducted in accordance with the Declaration of Helsinki


References

1.    Ministry of Internal Affairs and Communications, Japan, A national census (2015), http://www.stat.go.jp/data/kokusei/2015/kekka/kihon1/pdf/youyaku.pdf Accessed 1 April 2016
2.    Artacho R, Lujano C, Sanchez-Vico AB, et al. Nutritional status in chronically-ill elderly patients. Is it related to quality of life? J Nutr Health Aging 2014;18:192-197.
3.    Grattagliano I, Mastronuzzi T. Nutrition as a health determinant in elderly patients. Curr Med Chem 2017 doi: 10.2174/09299867324666170523125806.
4.    Shlisky J, Bloom DE, Beaudreault AR, et al. Nutritional considerations for healthy aging and reduction in age-related chronic disease. Adv Nutr 2017;8:17-26.
5.    Guigoz Y. The Mini Nutritional Assessment (MNA) review of the literature—What does it tell us? J Nutr Health Aging 2006;10:466-485.
6.    Kondrup J, Allison SP, Elia M, Vellas B, Plauth M. Educational and Clinical Practice Committee, European Society of Parenteral and Enteral Nutrition (ESPEN). ESPEN guidelines for nutrition screening 2002. Clin Nutr 2003;22:415-421.
7.    Kaiser MJ, Bauer JM, Ramsch C, et al. Validation of the mini nutritional assessment short-form (MNA-SF): a practical tool for identification of nutritional status. J Nutr Health Aging 2009;13:782-788.
8.    Silva Rodrigues RA, Martinez Espinosa M, Duarte Melo C, Rodrigues Perracini M, Rezende Fett WC, Fett CA. New values anthropometry for classification of nutritional status in the elderly. J Nutr Health Aging 2014;18:655-661.
9.    Omran ML, Morley JE. Assessment of protein energy malnutrition in older persons, part II: Laboratory evaluation. Nutrition 2000;16:131-140.
10.    Cabrerizo S, Cuadras D, Gomez-Busto F, Artaza-Artabe I, Ciancas FM, Malafarina V. Serum albumin and health in older people: Review and meta analysis. Maturitas 2015;81:17-27.
11.    Ignacio de Ulibarri J, González-Madroño A, de Villar NGP, et al. CONUT: A tool for controlling nutritional status. First validation in a hospital population. Nutr Hosp 2005;20:38-45.
12.    Lorenzo-López L, Maseda A, de Labra C, Regueiro-Folgueira L, Rodríguez-Villamil JL, Millán-Calenti JC. Nutritional determinants of frailty in older adults: A systematic review. BMC Geriatr 2017;17:108.
13.    de Vries JHM, de Groot LCPGM, van Staveren WA. Dietary assessment in elderly people: experiences gained from studies in the Netherlands. Eur J Clin Nutr 2009;63(suppl 1) S69-S74.
14.    Iizaka S, Kaitani T, Nakagami G, Sugama J, Sanada H. Clinical validity of the estimated energy requirement and the average protein requirement for nutritional status change and wound healing in older patients with pressure ulcers: A multicenter prospective cohort study. Geriatr Gerontol Int 2015;15:1201-1209.
15.    Takeda H, Ishihama K, Fukui T, et al. Significance of rapid turnover proteins in protein-losing gastroenteropathy. Hepatogastroenterology 2003;50:1963-1965.
16.    Nozue M, Ishikawa M, Takemi Y, et al. Prevalence of inadequate nutritional intake in Japanese community-dwelling older adults who live alone. J Nutr Sci Vitaminol 2016;62:116-122.
17.    Dietary Reference Intakes for Japanese (2015) The Minister of Health, Labor and Welfare (Japan) http://www.mhlw.go.jp/file/06-Seisakujouhou-10900000-Kenkoukyoku/Overview. pdf Accessed 1 April 2016
18.     Iizaka S, Tadaka E, Sanada H. Comprehensive assessment of nutritional status and associated factors in the healthy, community-dwelling elderly. Geriatr Gerontol Int 2008;8:24-31
19.    Ülger Z, Halil M, Kalan I, et al. Comprehensive assessment of malnutrition risk and related factors in a large group of community-dwelling older adults. Clin Nutr 2010;29:507-511.
20.     Ji L, Meng H, Dong B. Factors associated with poor nutritional status among the oldest-old. Clin Nutr 2012;31:922-926.
21.    van Bokhorst-de van der Schueren MAE, Lonterman-Monasch S, de Vries OJ, Danner SA, Kramer MHH, Muller M. Prevalence and determinants for malnutrition in geriatric outpatients. Clin Nutr 2013;32:1007-1011.
22.     Hernández-Galiot A, Goñi I. Quality of life and risk of malnutrition in a home-dwelling population over 75 years old. Nutrition 2017;35:81-86.
23.     Drescher T, Singler K, Ulrich A, et al. Comparison of two malnutrition screening methods (MNA and NRS 2002) and their association with markers of protein malnutrition in geriatric hospitalized patients. Eur J Clin Nutr 2010;64:887-893.
24.     Lilamand M, Kalaiditi E, Demougeot L, Rolland Y, Vellas B, Cesari M. The Mini Nutritional Assessment-Short Form and mortality in nursing home residents—results from the INCUR study. J Nutr Health Aging 2015;19:383-388.
25.     Cereda E, Pedrolli C, Klersy C, et al. Nutritional status in older persons according to healthcare setting: A systematic review and meta-analysis of prevalence data using MNA. Clin Nutr 2016;35:1282-1290.
26.     Htun NC, Ishikawa-Takata K, et al. Screening for malnutrition in community dwelling older Japanese: Preliminary development and evaluation of the Japanese nutritional risk screening tool (NRST). J Nutr Health Aging 2016;20:114-120.
27.     Salive ME, Cornoni-Huntley J, Phillips CL, et al. Serum albumin in older persons: Relationship with age and health status. J Clin Epidemiol 1992;45:213-221.
28.     Gomi I, Fukushima H, Shiraki M, et al. Relationship between serum albumin level and aging in community-dwelling self-supported elderly population. J Nutr Sci Vitaminol 2007;53:37-42
29.     Cals MJ, Bories PN, Devanlay M, et al. Extensive laboratory assessment of nutritional status in fit, health-conscious, elderly people living in the Paris area. Research Group on Aging. J Am Coll Nutr 1994;13:646-657.
30.     ter Borg S, Verlaan S, Mijnarends DM, Schols JM, de Groot L, Luiking YC.  Macronutrient intake and inadequacies of community-dwelling older adults, a systematic review. Ann Nutr Metab 2015;66:242-255.

MODIFICATION OF THE MNA-SF FOR COMMUNITY-DWELLING OLDER ADULTS AT RISK OF MALNUTRITION


I. Nakamura1,2, T. Yoshida1, H. Kumagai1


1. Department of Clinical Nutrition, School of Food and Nutritional Sciences,  University of Shizuoka, Shizuoka, Japan; 2. Division of Home Care Service, Fukuoka Clinic, Tokyo, Japan

Corresponding Author: Hiromichi Kumagai M.D. Professor, Department of Clinical Nutrition, School of Food and Nutritional Sciences, University of Shizuoka, 52-1 Yada, Shizuoka 422-8526, Japan, Fax & phone: +81-54-264-5567, E-mail: kumagai@u-shizuoka-ken.ac.jp

 J Aging Res Clin Practice 2017;6:210-216
Published online October 5, 2017, http://dx.doi.org/10.14283/jarcp.2017.28


Abstract

Objectives: The Mini-Nutritional Assessment Short Form (MNA-SF) may be insufficient for screening and assessing the nutritional status of community-dwelling older adults.  We modified MNA-SF to improve the ability for discriminating those at risk of malnutrition. Setting and participants: 123 community-dwelling elderly Japanese. Methods: Nutritional status was examined by the subjective global assessment (SGA), the geriatric nutritional risk index (GNRI) and MNA-SF.  The reference standard for the diagnosis of “at risk of malnutrition” was composed from the SGA and GNRI.  Specific factors associated with malnutrition in community-dwelling older adults were extracted from a literature survey and classified by a principal component analysis.  A new 8-item MNA-home was constructed by adding two items from these components to the MNA-SF and compared with the MNA-SF by applying a receiver operating characteristic (ROC) curve. Results: Among the various potential MNA-home scores, the ROC curve revealed that the MNA-SF plus two items, namely an inability to prepare own meals and no motivation to go out, produced the largest area under the curve (AUC), this value being greater than that from the MNA-SF.  The score of MNA-home was significantly correlated with serum albumin and hemoglobin, although the score of MNA-SF was not.  The cutoff value for predicting at risk of malnutrition was <14 in the MNA-home. Conclusion: The new MNA-home had a better discriminating ability than the MNA-SF to identify those at risk of malnutrition in community-dwelling older adults.  A subsequent long-term study is necessary to validate this MNA-home for correctly discriminating community-dwelling older adults at risk of malnutrition.

Key words: Malnutrition, elderly, mini nutritional assessment, home care.


Introduction

The number of people aged 65 and over in Japan has been increasing for the recent 20 years, resulting in the pace of aging being the highest among any other country in the world (1).  The rising medical cost caused by this increase of elderly people prompted the Japanese government to develop a policy of substituting a long hospital stay by a community-based service.  This policy has been achieved by long-term care insurance (LTCI) that was introduced in 2000 to support the elderly population by integrating health care services and social support services (2).  However, a number of problem has become apparent since this long-term care system was introduced.  First, many elderly people are insisting to return to their homes without satisfactory health care support.  Second, the main caregivers have been family members, and there are consequently a considerable number of cases of care for the elderly by the elderly.  Third, the number of elderly living alone has been increased to 11% for males and 20% for females (1).  Among these people living alone, many have limited contact with other people or have no person that they can rely on.
It had been thought that community-dwelling elderly people do not tend to be malnourished when compared with other situations.  A meta-analysis has shown that the prevalence of malnutrition or at risk of malnutrition was 37.7% when evaluated by the Mini-Nutritional Assessment (MNA) in community dwellers with a mean age of 79.3 yrs (3).  This percentage of malnutrition or at risk of malnutrition is much lower than that for elderly in hospitals (86.0%), nursing homes (67.2%) or rehabilitation (91.7%) settings for a similar age.  In Japan, however, the prevalence of a poor nutritional status is more common, as 60-72% of the elderly living in a community setting have suffered from malnutrition or at-risk of malnutrition (4-6).  The factors associated with malnutrition in the community-living elderly were similar but not equal to those living in hospitals and nursing homes.  The conditions of physical health, comorbidity, anorexia and psychological problems seem to be most common causes of malnutrition for both community-dwelling and institutionalized elderly.  However, the community-dwelling elderly have other specific problems associated with daily living at home, including food insecurity, human relationships, psychiatric problems and inadequate care (7-14).  These circumstances are resulting in increasing demands for nutritional screening and assessment in community-dwelling elderly.
The MNA is a tool specifically developed for assessing the nutritional status of elderly people (15-16).  The MNA comprises 18 items presenting an anthropometric assessment, general assessment, dietary assessment and subjective assessment, and the first six items have been used for screening people with undernutrition as the MNA-short form (SF) (17).  This MNA-SF was revised in 2009 and proposed as a stand-alone nutritional screening tool by adapting three categories of nutritional classification: well-nourished, at risk of malnutrition and malnutrition (18).  While MNA-SF was developed in Western countries for assessing nursing home and hospital-bound elderly people, it has been accepted that a revised MNA-SF can be applicable to a population of community-dwelling elderly (19) and can also be used in Japan (20) and Taiwan (21) by modifying its cutoff point.
However, MNA-SF does not include items related to the foregoing nutritional risks in community-dwelling elderly people.  If MNA-SF were to be further modified by incorporating these specific nutritional risks, the discriminating ability for those at risk of malnutrition by this nutritional screening tool may be increased.  We attempt in the present study to modify the MNA-SF by including two new items associated with the specific nutritional risks encountered by community-dwelling older adults.


Methods

Subjects

One hundred and twenty-nine community-dwelling elderly Japanese living in Tokyo, Shizuoka and Kochi prefectures (26 men and 103 women; age 81.0 ± 8.3 yr, range 60 – 98 yr) were enrolled in this study.  Any subjects diagnosed with acute infection, cancer or renal failure and those who could not take food by the mouth were excluded from the study (n=6).  The remaining 123 subjects were eligible for the analysis (Table 1).  All the subjects have been receiving various home care services based on public LTCI.  Their care needs were graded into seven levels (support level 1, support level 2, care level 1, care level 2, care level 3, care level 4 and care level 5).  The study protocol was approved by the ethics committee of the University of Shizuoka.  Written consent was obtained from all participants or their legal proxies.

Table 1 Patients’ characteristics

Table 1
Patients’ characteristics

Data are expressed as the mean±SD.  Nutritional status was determined by the joint criterion made from GNRI and SGA.

Anthropometric and serum biochemical measurements

Weight and height were measured for calculating the body mass index (BMI, kg/m2).  The weight (kg) was measured with a portable digital scale and the height (m) was measured by a portable stadiometer.  Those subjects who could not stand up were measured for their recumbent length by a steel measuring tape between two plates placed against the heel and the top of the head (22).  The self-reported height was also used in some cases (22).
A blood sample was taken from each subject at the regular health check, and serum albumin was measured for calculating the geriatric nutritional risk index (GNRI)

Nutritional assessment

Subjective global assessment (SGA), GNRI and MNA-SF were examined in all participants.  SGA is a valid nutritional assessment tool that has been found to be highly predictive of the nutrition-associated clinical outcome (23).  The SGA grade was classified into three levels on the basis of the subject’s history and physical examination: level A, well-nourished; level B, moderately malnourished; level C, severely malnourished.
GNRI is a very simple and objective method for screening the nutritional status of elderly people (24).  It can be calculated by a simple equation in which only three nutritional variables, serum albumin, actual body weight and ideal body weight, are used:
GNRI = [1.489×albumin (g/L)] + [41.7×(weight/ideal weight)]
The weight/ideal weight term is set to unity (1) when the weight exceeds the ideal weight in this equation.  These GNRI values were applied to define four grades of nutritional level in the present study, similar to the original classification: level 1, no risk of malnutrition (GNRI >98); level 2, low risk of malnutrition (GNRI 92 to ≤98); level 3, moderate risk of malnutrition (GNRI 82 to <92); level 4, major risk of malnutrition (GNRI <82).
MNA-SF has also proven to be a simple, non-invasive and valid screening tool for malnutrition in elderly people (17-19).  It comprises six questions chosen from the long form of MNA for identifying individuals at risk of malnutrition.  The maximum possible score of the MNA-SF assessment is 14.  The cutoff point for being at risk of malnutrition might be different between Western and Asian populations.
These nutritional assessments were performed by one well-trained dietitian.

Factors associated with malnutrition in community-dwelling older adults

A systematic literature search was performed to identify all relevant articles in which the specific factors associated with malnutrition in elderly community-dwelling subjects were included.  The bibliographic databases, PubMed and Igaku Chuo Zasshi, were searched from their inception to October 31, 2015.  Search terms expressing “malnutrition” were used in combination with search terms for “community-dwelling and home-bound elderly”. The references of the identified articles written in English and Japanese were searched for relevant publications.
Nine items associated with malnutrition in community-dwelling elderly people were found in these references, after excluding items included in the questions of the original MNA-SF.  These nine items were 1) inability to obtain preferred foods(7, 8), 2) no helper to cook meals (7, 8), 3) inability to prepare own meals (7, 8), 4) no person to eat with (8), 5) feeling of isolation (9), 6) no motivation to go out (10), 7) low income (11-13), 8) insufficient care by caregivers (11, 14), and 9) long distance to grocery stores (8).
The participants were interviewed by using an interview form containing these 9-item questions.  The answers were selected according to three scales: 1, always; 2, sometimes; 3, never or 1, agree; 2, neutral; 3, disagree.

The development of the MNA-home and statistical analyses

A principal component analysis was performed to classify these nine new items associated with malnutrition in community-dwelling elderly people.  The number of components was determined by considering the eigenvalues, scree test and their interpretability.
We chose to develop a new nutritional screening tool called MNA-home to identify those subjects most at risk of malnutrition among the community-dwelling elderly by modifying the MNA-SF.  Two or three items were chosen from the results of the principal component analysis and added to the MNA-SF.  Each item was chosen from the components elicited from the principal component analysis.
A receiver operating characteristic (ROC) curve was generated for various MNA-home candidates to find the best combination of items added to the MNA-SF.  The reference standard was created from the combination of SGA, a subjective nutritional assessment, and GNRI, an objective nutritional risk assessment.  Since the MNA-home would be a nutritional screening tool capable of identifying community-dwelling elderly at risk of malnutrition, the community-dwelling elderly at risk of malnutrition in the reference standard was defined to include either the SGA grade of levels B and C or the GNRI grade of levels 2, 3 and 4 (the joint criterion by GNRI and SGA).  The area under the curve (AUC) for ROC indicates the probability of discriminating a nutritional risk.  Various potential MNA-home candidates incorporating several new items were examined in the ROC curve, and one of them with the largest AUC value was finally selected as the MNA-home.  The cutoff risk point for nutrition was determined by using the ROC curve.  The sensitivity, specificity, accuracy, Youden index (YI, sensitivity + specificity – 1), positive predictive value (PPV) and negative predictive value (NPV) were calculated at various threshold values for both MNA-SF and MNA-home by comparing with the reference standard.
Each variable is presented as the mean ± SD.  Differences between groups were determined by an analysis of variance or the chi-squared test.  The validity of MNA-home was evaluated by comparing the correlation between the anthropometric and biochemical nutritional variables and MNA-home or MNA-SF, using Spearman’s correlation coefficient.  A p-value of less than 0.05 was considered statistically significant.  All statistical analyses were performed by SPSS ver. 20 (IBM, Tokyo, Japan).


Results

The participants were classified into two groups according to the joint criterion made from SGA and GNRI; community-dwelling elderly with good nutrition and those with malnutrition or at risk of malnutrition (Table 1). Most of the individual variables, including the anthropometric and biochemical variables, were significantly lower in the subjects with malnutrition or those at risk of malnutrition.  Furthermore, the values for BMI, serum albumin, total cholesterol and hemoglobin in the subjects with malnutrition or those at risk of malnutrition suggest that this classification was reasonable as a reference standard for evaluating the MNA-home in this study.

Table 2 Classification of factors associated with malnutrition in community-dwelling elderly people by a principal component analysis

Table 2
Classification of factors associated with malnutrition in community-dwelling elderly people by a principal component analysis

These nine items associated with malnutrition in community-dwelling elderly people were found by the reference survey.  A coefficient less than ±0.5 is represented by a dash for simplicity.


The principal component analysis demonstrated that the nine items specifically associated with malnutrition in community-dwelling elderly people could be classified into four components (Table 2).  Since the scree plot showed that the eigenvalue of the first two components was relatively high, the potential MNA-home scores were selected as MNA-SF supplemented with two items chosen from these factors, each item being chosen from different components.  Among these potential MNA-home scores, the ROC curve analysis revealed that MNA-SF plus 2 items, “inability to prepare own meals” and “no motivation to go out”, had the largest AUC value when the above-mentioned reference standard was applied, this AUC value being larger than that of MNA-SF (Fig. 1).  This result suggested that the new 8-item MNA-home score (Table 3) would offer better ability to identify the nutritional risk in community-dwelling elderly people than the MNA-SF.

Figure 1 Receiver operating characteristic (ROC) curve for the MNA-SF and MNA-home as compared with the joint criterion for being at risk of malnutrition made from GNRI and SGA. Areas under the curve were 0.795 for MNA-home (green line) and 0.744 for MNA-SF (blue line)

Figure 1
Receiver operating characteristic (ROC) curve for the MNA-SF and MNA-home as compared with the joint criterion for being at risk of malnutrition made from GNRI and SGA. Areas under the curve were 0.795 for MNA-home (green line) and 0.744 for MNA-SF (blue line)

The various cutoff points for discriminating those elderly persons at risk of malnutrition were derived from these ROC curves of MNA-home and MNA-SF (Table 4).  The sensitivity, specificity, accuracy, YI, PPV and NPV data were compared between various threshold values for both MNA scores in predicting those at risk of malnutrition evaluated from the joint criterion by SGA and GNRI.  Since both the MNA-SF and MNA-home would be used as nutritional screening tools, high sensitivity was given priority over high specificity.  The cutoff values for predicting those at risk of malnutrition were considered best with 12 points in the MNA-SF and 14 points in MNA-home.  This means that the elderly who scored less than 12 in the MNA-SF or less than 14 in the MNA-home would be considered at risk of malnutrition.

Table 3 New 8-item MNA-home for community-dwelling elderly people

Table 3
New 8-item MNA-home for community-dwelling elderly people


Table 4 Diagnostic characteristics of MNA-SF and MNA-home for being at risk of malnutrition relative to the joint criterion by GNRI and SGA

Table 4
Diagnostic characteristics of MNA-SF and MNA-home for being at risk of malnutrition relative to the joint criterion by GNRI and SGA

PPV, positive predictive value; NPV, negative predictive value; YI, Youden index.

The Spearman correlation coefficients (r) of the score for each MNA with age, BMI and nutritional-related biochemical variables were compared between the MNA-SF and the MNA-home (Table 5).  The score for MNA-home was significantly correlated with serum albumin and hemoglobin, while the score for MNA-SF was not correlated with these values.

Table 5 Spearman correlation coefficients of MNA-SF or MNA-home with age, BMI and nutritional-related biochemical variables

Table 5
Spearman correlation coefficients of MNA-SF or MNA-home with age, BMI and nutritional-related biochemical variables

P-values less than 0.1 are shown in this table.


Discussion

We developed in the present study a modified MNA-SF named MNA-home for Japanese community-dwelling elderly by adding two items to the original MNA-SF.  This new 8-item MNA-home had higher discriminating ability for the community-dwelling elderly at risk of malnutrition than MNA-SF when the reference standard of “at risk of malnutrition” was determined by the combination of SGA and GNRI.
There is no accepted standard for the nutritional assessment of community-dwelling elderly people, so we merged the results of SGA and GNRI to devise a reference standard for those at risk of malnutrition.  We consider elderly people to be at risk of malnutrition if either the SGA grade was at level B or C, or the GNRI grade was at level 2, 3 or 4 (GNRI≤98).  This method is similar to that previously suggested by Pablo et al. (25) and Poulia et al. (26).  SGA includes information on weight loss, a change in dietary intake, symptoms from the gastrointestinal tract and functional capacity, all of which were evaluated by the subjective assessment.  SGA has been proven to be a reliable way for estimating a nutrition-related clinical outcome.  Recent literature has demonstrated SGA to be a similar or superior tool for nutritional diagnosis in both surgical and clinical patients when compared with anthropometric and laboratory data analyses (27).  Other instruments, however, might be as capable as or more capable than SGA as a screening tool in detecting important changes in nutritional status related to the occurrence of a worsening clinical outcome (27). On the other hand, GNRI has been calculated only from objective information, including body weight, height and serum albumin (24), and has been proposed and investigated for predicting nutrition-related complications (28).  We therefore presume the combination of SGA and GNRI to be a better reference of nutritional status than each separate tool that may be associated with the clinical outcome.  We did not use the full version of MNA as a reference standard because it has similar problems, as MNA-SF does not include the nutritional issues that are specifically associated with community-dwelling elderly people.
Two items, “inability to prepare own meals” and “no motivation to go out”, that were added to MNF-SF were chosen by the principal component analysis from nine items that might potentially be associated with malnutrition in community-dwelling elderly people.  These 9 items, namely an inability to obtain preferred foods, no helper to cook meals, inability to prepare own meals, no person to eat with, feeling of isolation, no motivation to go out, low income to buy sufficient foods, insufficient care service, long distance to grocery stores, do not seem to be specific to Japanese community-dwelling elderly persons, and are also common among the elderly living in westernized countries, where the number of elderly living alone in the community has been increasing during the most recent one or two decades (29).  The two chosen and added items are considered reasonable in the case of community-dwelling elderly people from the author’s perspective as a home-visiting dietitian.  The ability to prepare own meals is essential for the community-dwelling elderly persons for survival or maintaining a favorable nutritional status in cases of the meal delivery service or home-cooking service by helpers not being fully developed.  Furthermore, no motivation to go out implies social withdrawal and isolation which may be one of the symptoms of depression and has been recognized to be associated with the development of malnutrition (10).
The MNA-home has been developed for screening community-dwelling elderly persons at risk of malnutrition.  This nutritional screening tool is intended for use by health-care professionals like public health nurses and dietitians when they visit the elderly at home.  It therefore needs to be easily applied, and sensitivity should be given priority over specificity since more detailed nutritional assessment will follow.  In this respect, it was appropriate for the optimal cutoff points for MNA-SF and MNA-home as nutritional screening tools to respectively be 12 and 14, whereas the accuracy of these cutoff points was one step lower than each maximal value.
We finally compared the predictive ability of both the MNA-SF and MNA-home for age, BMI and nutritional-related biochemical variables, since these parameters have been widely used to evaluate nutritional status.  The result that the MNA-home only showed a significant correlation with serum albumin and hemoglobin suggests that MNA-home would offer more ability to predict malnutrition than MNA-SF.
Modifying MNA or adjusting the cut-off point has been attempted to improve the discriminating ability to find subjects with malnutrition or those at risk of malnutrition.  Since the MNA was created and developed in Western countries, such a method and the selected cut-off points might not be applicable to Asian populations without any change because of cultural and anthropometric differences between them.  Minor modification or adjustment has been therefore attempted to make the original MNA applicable to an Asian population (20, 21).  However, our modification from MNA-SF to MNA-home in the present study was intended to correct the missing aspects of the MNA-SF, especially for community-dwelling elderly persons, so that this modification might also be useful in Western countries.
There are some limitations to the results of the present study.  First, the sample was small and the subjects were only recruited from three areas of Japan.  Since the life style, dietary habits, comorbidity and public service for the community-dwelling elderly are different between regions, the results might be flawed by potential sampling bias.  However, the mean ± SD value of MNA-SF was 9.4 ± 2.4, and the prevalence of being at risk of malnutrition and being malnourished was almost the same at 65.0% by MNA-SF and 64.2% by MNA-home, similar to the results of other previous studies on Japanese community-dwelling elderly people (4-6).  It was also anticipated that the present study would help to develop the MNA-home by a cross-sectional design.  A long-term follow-up study investigating mortality, morbidity or hospitalization is necessary to examine whether the MNA-home is really useful for identifying elderly persons at risk of malnutrition.
In conclusion, we have developed the MNA-home from MNA-SF by adding two items which are closely associated with the nutritional disturbance occurring to community-dwelling elderly people.  The MNA-home has better discriminating ability to identify the elderly at risk of malnutrition than the MNA-SF in the population studied.  This modification enables dietitians or nurses to more accurately screen elderly persons at risk of malnutrition in a home-care setting.  A subsequent study is necessary to validate this MNA-home for correctly discriminating those at risk of malnutrition in any community-dwelling elderly population worldwide.


Conflict of interest: The authors have no conflict interest to declare.

Acknowledgments: The authors thank Dr. Akira Ohi, Dr. Tatsuo Ohishi and all of the community-care dietitians and nurses who collaborated in this study.

Ethical standards: This research was carried out in accordance with the Declaration of Helsinki of the World Medical Association and received ethical approval from the ethics committee of the University of Shizuoka.


References

1.    Annual report on the aging society FY 2014. Cabinet office, Government of Japan. 2014, at http://www8.cao.go.jp/kourei/english/annualreport/2014/2014pdf_e.html.
2.    Campbell JC, Ikegami N. Long-term care insurance comes to Japan. Health Aff (Millwood). 2000; 19: 26-39.
3.    Kaiser MJ, Bauer JM, Rämsch C, Uter W, Guigoz Y, Cederholm T, Thomas DR, Anthony PS, Charlton KE, Maggio M, Tsai AC, Vellas B, Sieber CC; Mini Nutritional Assessment International Group. Frequency of malnutrition in older adults: a multinational perspective using the mini nutritional assessment. J Am Geriatr Soc. 2010; 58: 1734-8.
4.    Izawa S, Kuzuya M, Okada K, Enoki H, Koike T, Kanda S, Iguchi A. The nutritional status of frail elderly with care needs according to the mini-nutritional assessment. Clin Nutr. 2006; 25: 962-7.
5.    Enoki H, Sugiyama M, Izawa S, Hirose T, Hasegawa J, Iguchi A, Kuzuya M. Factors associated with malnutrition in community-dwelling disabled elderly–the KANAGAWA-AICHI Disabled Elderly Cohort (KAIDEC) Study. Nihon Ronen Igakkai Zasshi. 2014; 51: 547-53 (in Japanese).
6.    Morisaki N, Miura H, Hara S. Relationship between the nutritional status and the oral function among community-dwelling dependent elderly persons. Nihon Ronen Igakkai Zasshi. 2015; 52: 233-42 (in Japanese).
7.    Iizaka S, Tadaka E, Sanada H. Comprehensive assessment of nutritional status and associated factors in the healthy, community-dwelling elderly. Geriatr Gerontol Int. 2008; 8: 24-31.
8.    Keller HH, Goy R, Kane SL. Validity and reliability of SCREEN II (Seniors in the community: risk evaluation for eating and nutrition, Version II). Eur J Clin Nutr. 2005; 59: 1149-57.
9.    Ferry M, Sidobre B, Lambertin A, Barberger-Gateau P. The SOLINUT study: analysis of the interaction between nutrition and loneliness in persons aged over 70 years. J Nutr Health Aging. 2005; 9: 261-8.
10.    Boulos C, Salameh P, Barberger-Gateau P. Malnutrition and frailty in community dwelling older adults living in a rural setting. Clin Nutr. 2016; 35: 138-43.
11.    Locher JL, Ritchie CS, Robinson CO, Roth DL, Smith West D, Burgio KL. A multidimensional approach to understanding under-eating in homebound older adults: the importance of social factors. Gerontologist. 2008; 48: 223-34.
12.    Quine S, Morrell S. Food insecurity in community-dwelling older Australians. Public Health Nutr. 2006; 9: 219-24.
13.    Tamiya N, Kobayashi Y, Murakami S, Sasaki J, Yoshizawa K, Otaki J, Kano K. Factors related to home discharge of cerebrovascular disease patients: 1-year follow-up interview survey of caregivers of hospitalized patients in 53 acute care hospitals in Japan. Arch Gerontol Geriatr. 2001; 33: 109-21.
14.    Oyama Y, Tamiya N, Kashiwagi M, Sato M, Ohwaki K, Yano E. Factors that allow elderly individuals to stay at home with their families using the Japanese long-term care insurance system. Geriatr Gerontol Int. 2013; 13: 764-73.
15.    Guigoz Y, Vellas B, Garry PJ. Assessing the nutritional status of the elderly: The Mini Nutritional Assessment as part of the geriatric evaluation. Nutr Rev. 1996; 54: S59-65.
16.    Guigoz Y. The Mini Nutritional Assessment (MNA) review of the literature–What does it tell us? J Nutr Health Aging. 2006; 10: 466-85.
17.    Rubenstein LZ, Harker JO, Salvà A, Guigoz Y, Vellas B. Screening for undernutrition in geriatric practice: developing the short-form mini-nutritional assessment (MNA-SF). J Gerontol A Biol Sci Med Sci. 2001; 56: M366-72.
18.    Kaiser MJ, Bauer JM, Ramsch C, Uter W, Guigoz Y, Cederholm T, Thomas DR, Anthony P, Charlton KE, Maggio M, Tsai AC, Grathwohl D, Vellas B, Sieber CC; MNA-International Group. Validation of the Mini Nutritional Assessment short-form (MNA-SF): a practical tool for identification of nutritional status. J Nutr Health Aging. 2009; 13: 782-8.
19.    Kaiser MJ, Bauer JM, Uter W, Donini LM, Stange I, Volkert D, Diekmann R, Drey M, Bollwein J, Tempera S, Guerra A, Ricciardi LM, Sieber CC. Prospective validation of the modified mini nutritional assessment short-forms in the community, nursing home, and rehabilitation setting. J Am Geriatr Soc. 2011; 59: 2124-8.
20.    Kuzuya M, Kanda S, Koike T, Suzuki Y, Satake S, Iguchi A. Evaluation of Mini-Nutritional Assessment for Japanese frail elderly. Nutrition. 2005; 21: 498-503.
21.    Tsai AC, Chang TL, Chen JT, Yang TW. Population-specific modifications of the short-form Mini Nutritional Assessment and Malnutrition Universal Screening Tool for elderly Taiwanese. Int J Nurs Stud. 2009; 46: 1431-8.
22.    Frid H, Adolfsson ET, Rosenblad A, Nydahl M. Agreement between different methods of measuring height in elderly patients. J Hum Nutr Diet. 2013; 26: 504-11.
23.    Detsky AS, McLaughlin JR, Baker JP, Johnston N, Whittaker S, Mendelson RA, Jeejeebhoy KN. What is subjective global assessment of nutritional status? JPEN J Parenter Enteral Nutr. 1987; 11: 8-13.
24.    Bouillanne O, Morineau G, Dupont C, Coulombel I, Vincent JP, Nicolis I, Benazeth S, Cynober L, Aussel C. Geriatric Nutritional Risk Index: a new index for evaluating at-risk elderly medical patients. Am J Clin Nutr. 2005; 82: 777-83.
25.    Pablo AM, Izaga MA, Alday LA. Assessment of nutritional status on hospital admission: nutritional scores. Eur J Clin Nutr. 2003; 57: 824-31.
26.    Poulia KA, Yannakoulia M, Karageorgou D, Gamaletsou M, Panagiotakos DB, Sipsas NV, Zampelas A. Evaluation of the efficacy of six nutritional screening tools to predict malnutrition in the elderly. Clin Nutr. 2012; 31: 378-85.
27.    da Silva Fink J, Daniel de Mello P, Daniel de Mello E. Subjective global assessment of nutritional status – A systematic review of the literature. Clin Nutr. 2015; 34: 785-92.
28.    Cereda E, Pusani C, Limonta D, Vanotti A. The ability of the Geriatric Nutritional Risk Index to assess the nutritional status and predict the outcome of home-care resident elderly: a comparison with the Mini Nutritional Assessment. Br J Nutr. 2009; 102: 563-70.
29.    Health Quality Ontario. Social isolation in community-dwelling seniors: an evidence-based analysis. Ont Health Technol Assess Ser. 2008; 8: 1-49.