jarlife journal
Sample text

AND option

OR option

FACTORS ASSOCIATED WITH DIMINISHED COUGH INTENSITY IN COMMUNITY-DWELLING ELDERLY USING DAY CARE SERVICES: A PILOT STUDY


R. Mikiya1, C. Momoki2, D. Habu3


1. Department of Physical Therapy, Faculty of Health Sciences, Morinomiya University of Medical Sciences, Suminoe-ku, Osaka-shi, Osaka, Japan; 2. Department of Food and Nutrition, Faculty of Contemporary Human Life Science, Tezukayama University, Nara-shi, Nara, Japan ; 3. Department of Medical Nutrition, Graduate School of Life Science, Osaka City University, , Sumiyoshi-ku Osaka-shi, Osaka, Japan

Corresponding Author: Ryosuke Mikiya, Department of Physical Therapy, Faculty of Health Sciences, Morinomiya University of Medical Sciences, 1-26-16 Nankokita, Suminoe-ku, Osaka-shi, Osaka 559-8611, Japan, Email: mikiya@morinomiya-u.ac.jp (06-6616-6911, FAX06-6616-6912)
J Aging Res Clin Practice 2019;8:57-62
Published online July  10, 2019, http://dx.doi.org/10.14283/jarcp.2019.10


Abstract

Purpose: We investigated factors affecting diminished cough intensity in community-dwelling elderly using day care services. Participants and Methods: A total of 61 elderly males and females aged ≥65 years who were certified to receive long-term adult day care services were enrolled in this study. Assessments included: Cough intensity (assessed using cough peak flow measurements, as well as possible determinants of cough intensity, lifestyle, and demographic characteristics), nutritional status (using the Mini Nutritional Assessment-Short Form), dietary intake (using the Dietary Variety Score), routine activity (using the Japanese version of the International Physical Activity Questionnaire), care-related factors (including day care services utilization and an oral exercise regimen) as well as age, need for long-term care, gender, sarcopenia status, the Charlson Comorbidity Index, and body mass, limb skeletal mass, and respiratory indices. Results: A reduced cough peak flow (odds ratio 4.46, 95% confidence interval: 1.08–18.43) was associated with sarcopenia and was weakly (not significantly) associated with age, gender, and the Mini Nutritional Assessment-Short Form score. Conclusion: A reduced cough peak flow was independently associated with sarcopenia and associated with age, gender, and nutritional status.

Key words:  Elderly, cough intensity, sarcopenia.


Introduction

Dysphagia is associated with diminished cough intensity (assessed using cough peak flow [CPF] measurements) and impaired airway clearance. Such individuals are predisposed to aspiration pneumonia (1). A study performed by Bach et al. showed that in patients with a neuromuscular disorder who show CPF ≤270 L/min, inadequate expectoration of sputum could cause respiratory insufficiency (2). Previous studies have reported that a reduced CPF in elderly is associated with age, lifestyle, and the maximal inspiratory pressure (MIP) (3, 4). Kim et al. reported that age-related reduction in routine activity accelerates respiratory muscle weakness (5). Expiratory muscle weakness causes generation of inadequate pleural pressure during coughing, thereby reducing the expiratory flow rate. This diminishes the cough intensity in elderly and can predispose these individuals to respiratory diseases.
Sarcopenia is an age-related reduction in muscle strength associated with reduced activity and loss of skeletal muscle mass. Recently, sarcopenia has gained attention as a major factor causing frailty in the elderly. The reduction in muscle mass in patients with sarcopenia can occur even in the respiratory muscles; thus, elderly with sarcopenia demonstrate decreased respiratory muscle strength and endurance (6). Sarcopenia is primarily an age-related condition; however, disuse atrophy secondary to malnutrition and reduced physical activity and disease-induced cachexia can cause sarcopenia (7-9). A study has reported that the prevalence of sarcopenia in elderly Japanese (aged ≥65 years) is approximately 20% for both males and females (10). Thus, a significant number of community-dwelling elderly may have sarcopenia and diminished cough intensity. Previous studies (5, 6) have reported that sarcopenia may be closely associated with a reduced CPF secondary to respiratory muscle weakness.
Adult day care service (day care) in Japan is a system in which community-dwelling elderly with diminished physical or cognitive function who are certified as needing support or long-term care visit facilities specified by ordinances of the Ministry of Health, Labor, and Welfare or day care centers catering to elderly. These facilities provide assistance with bathing, toileting, eating, and other routine activities, as well as functional training to such individuals. An individual must have a formal certification of their need for long-term care in order to avail themselves of the day care services under long-term care insurance. A few studies have identified an association between CPF and respiratory function in community-dwelling elderly who are certified as needing support or long-term care and who use day care services. However, no studies have examined the multifaceted effects of lifestyle (including physical activity and nutritional status) and baseline physical characteristics (age, gender, and body composition) on CPF. Thus, we investigated the effect of the aforementioned factors on the CPF in elderly who are certified as needing support or long-term care and who avail themselves of day care services.


Participants and methods

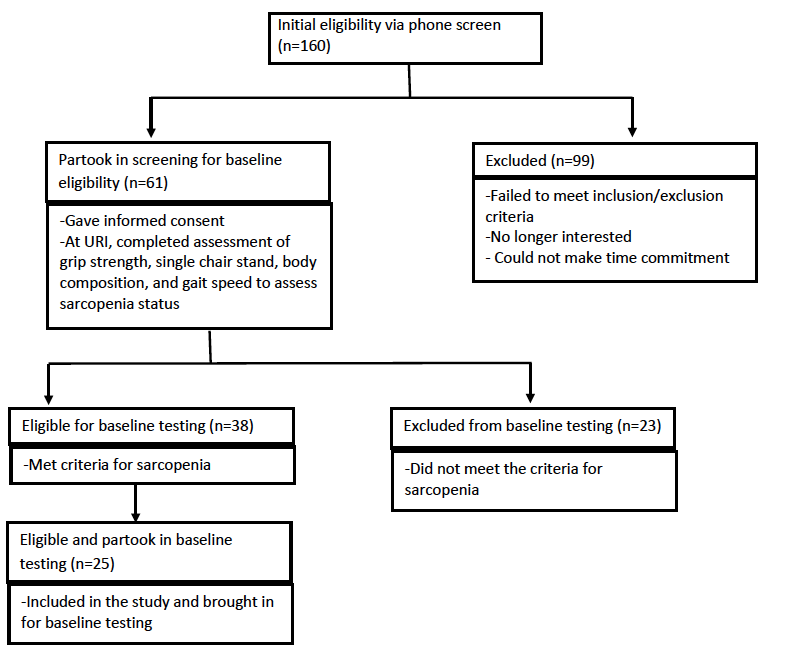
This study is a cross-sectional research design. We investigated 259 elderly who were certified as needing support or long-term care and who used day care services across 4 adult day care centers. The purpose of this study was well explained to potential participants prior to enrollment, and 61 elderly aged ≥65 years (15 males, 46 females) provided written consent to participate in this study. The mean age of participants was 80.4 (±6.2) years. Individuals with cerebrovascular, neuromuscular, respiratory, or cardiovascular disorders with pedal edema, those with cancer or any other condition causing cachexia, individuals previously diagnosed with dementia, and those who were unable to appropriately use the mouthpiece of the spirometer were excluded from the study. Additionally, individuals with a forced expiratory volume <70% in 1 s (based on spirometry evaluation) with suspected chronic obstructive pulmonary disease (COPD) were excluded (Fig. 1).

Figure 1 Study participants flow

Figure 1
Study participants flow


CPF was used as an indicator of voluntary cough intensity. CPF was ranked in tertile, with a flow rate ≥130 L/min indicating a high CPF and a flow rate <130 L/min indicating a low CPF. CPF was measured with a spirometer (Autospiro AS-507, Minato Medical Science, Co., LTD, Osaka, Japan). CPF evaluation was performed with all participants seated in an upright position. Each participant was instructed to firmly hold the mouthpiece to their lips and cheeks to prevent air from escaping, and a nose clip was used to prevent the escape of air from the nose. After participants had attained their maximal inspiratory level, they were instructed to cough thrice, and the maximum value was used. Additionally, respiratory function indices such as the forced vital capacity (FVC) were assessed. A respiratory dynamometer was connected to the aforementioned device, and the maximal expiratory pressure (MEP) and the MIP were measured thrice, and the maximum value recorded during the 3 attempts was used. A previous study has reported the usefulness of the Mini Nutritional Assessment (MNA) instrument to assess nutritional status, particularly in elderly (11). The MNA is an effective screening tool for nutritional status assessment, and the short form of the MNA (MNA-SF) includes the first 6 items present in the MNA (diminished food intake over the past 3 months, weight loss over the past 3 months, mobility, the presence or absence of psychological problems, body mass index (BMI), and calf circumference). A previous study has reported the usefulness of the MNA-SF (12). In the current study, the MNA-SF was used as a screening tool for nutritional status assessment. Participants were divided into 2 groups—adequately nourished individuals (MNA-SF score ≥12 points) and those at risk of being malnourished (MNA-SF score ≤11 points). The Dietary Variety Score (DVS) was used to assess participants’ dietary variety. The DVS assesses the frequency of weekly consumption of 10 types of foods including the following: meat, fish and shellfish, eggs, dairy, soybean products, green and yellow vegetables, seaweed, fruits, potatoes, and foods containing fats and oils (13). A response of “I eat this food almost every day” for a given food group was scored as 1 point and other responses were scored as 0 points. The total score was considered the DVS. Based on a study performed by Kumagai et al, individuals were categorized as those with marked dietary variety (indicated by a DVS score ≥4 points) and those with lesser dietary variety (indicated by a DVS score ≤3 points) (13). The International Physical Activity Questionnaire (IPAQ) is an internationally standardized questionnaire used across 12 countries to assess routine physical activity in adults aged 18–65 years (14). The Japanese version of the IPAQ was used to assess physical activity. The long and short forms of the IPAQ obtain information regarding the number of days a participant performs intense and moderate physical activity on a weekly basis. The energy expended during the weekly physical activity can be calculated (in Kcal). The Japanese version of the IPAQ short form (IPAQ-SF) was used in the current study to calculate the energy expended during physical activity based solely on the intensity of that activity. Based on a study reported by Murase et al., physical activity can be categorized as moderate level activity with energy expenditure ≥600 metabolic equivalents (METs)/week and low level activity with energy expenditure <600 METs/week (15).
The Asian Working Group for Sarcopenia (AWGS) defines sarcopenia as a condition characterized by loss of muscle strength (grip strength: <26.0 kg in males, <18.0 kg in females), diminished limb function (usual gait speed <0.8 m/s), loss of muscle strength and concomitant diminished limb function, as well as a low limb skeletal muscle mass index (SMI) based on bioelectrical impedance analysis (BIA) (<7.0 kg/m2 for males, <5.7 kg/m2 for females) (16). Grip strength was measured using a Smedley hand dynamometer (DT-2177, Toei Light, Sōka, Japan). Grip strength of the dominant hand was measured thrice, and the maximum value among the 3 recordings was used. The usual gait speed (m/s) was calculated based on the time needed to walk 10 m in a straight line with a build-up and a slow-down. Limb skeletal muscle mass was measured with an electrical impedance plethysmograph (InBody S10, InBody Japan, Inc., Tokyo, Japan) using BIA. In participants with some metallic device in their body, the limb skeletal muscle mass was calculated using Sanada’s predictive formula. The result was divided by the square of the height (in m2) to calculate the SMI (17). Participants were categorized as those who performed oral exercises (massaging the salivary glands, stretching from the shoulders to the fingers, cheek and tongue movements, and vocal cord exercises) and those who did not perform oral exercises. Other demographic characteristics evaluated included age, gender, need for long-term care, day care service utilization (in h), the Charlson Comorbidity Index (indicating the type and severity of the comorbidity), and BMI. Continuous variables were categorized as binary categorical variables. Age was categorized as ≥75 years and <75 years, the level of long-term care needed in participants was categorized as need for ≥level 2 long-term care or the need for level 1 long-term care/support, and the use of day care services (in h) was categorized as prolonged use of 7 h or brief use of ≤3 h. The Charlson Comorbidity Index was ≥1 point or 0 points=no comorbidity (18). Similar to the protocol followed by the National Health and Nutrition Examination Survey, elderly aged ≥65 years were categorized as those with BMI ≤20 kg/m2 (indicating that the individual is underweight) and those with BMI >20 kg/m2 (19). Based on the AWGS definition, males were categorized as those with SMI ≥7.0 kg/m2 and those with SMI <7.0 kg/m2. Females were categorized as those with SMI ≥5.7 kg/m2 and those with SMI <5.7 kg/m2.
The CPF was ranked in tertiles for statistical analysis. A Mann–Whitney U test was used for an intergroup comparison (those with a CPF ≥130 L/min and those with a CPF <130 L/min) of participants’ quantitative variables related to demographic characteristics. Univariate analysis was performed with CPF ≥130 L/min and CPF <130 L/min as the outcomes. Subsequently, we performed multiple logistic regression analysis to analyze 4 factors without multicollinearity and with a high odds ratio (age, gender, sarcopenia status, and the MNA-SF score) in univariate analysis. All statistical analyses were performed using SAS, version 9.4 (SAS Institute Inc., Cary, NC USA), and a p value <0.05 was considered statistically significant. This study was approved by the Ethical Review Board of Morinomiya University (approval no.: 2016-097).


Results

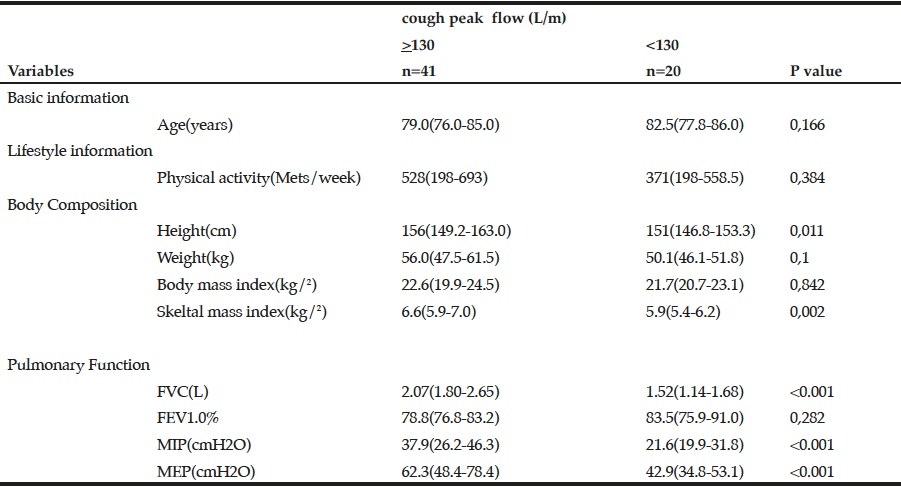
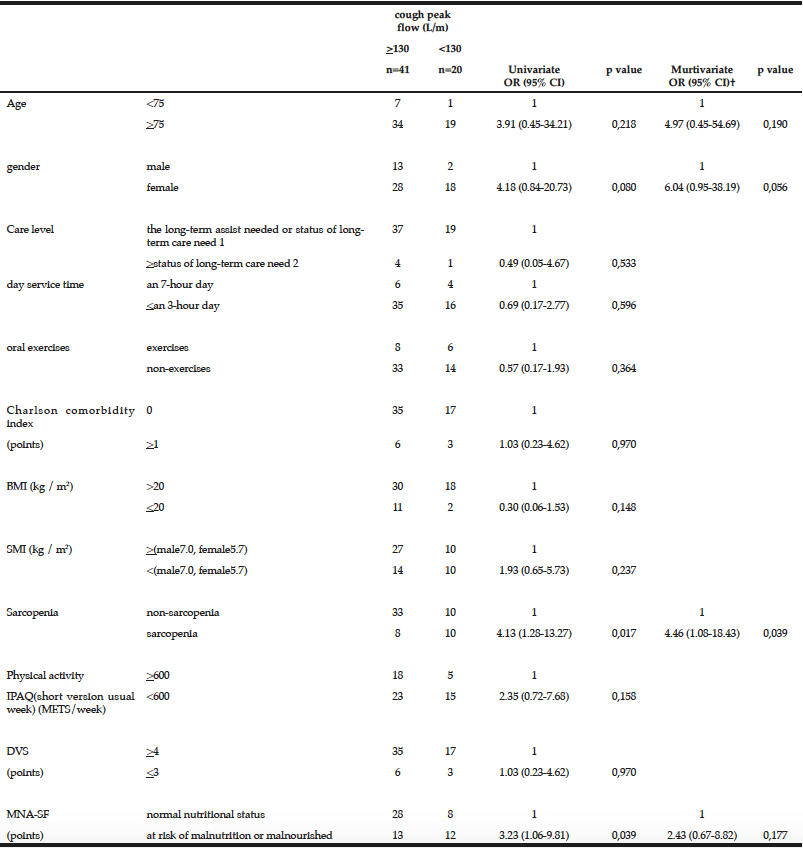
Demographic characteristics of the participants in this study are shown in Table 1. Comparison between 41 participants with a high CPF (≥130 L/m) and 20 participants with a low CPF (<130 L/m) showed significant statistical differences in height, SMI, and respiratory indices (FVC, MIP, and MEP). All these parameters were higher in participants with a high CPF. As a result of univariate and multivariate regression analyses, reduced CPF as the response variable and individual factors as independent variables indicated that sarcopenia (odds ratio [OR] 4.46, 95% confidence interval [CI] 1.08–18.43) was independently associated with a reduced CPF. Additionally, a reduced CPF was weakly associated with age (OR 4.97, 95% CI 0.45–54.69), gender (OR 6.04, 95% CI 0.95–38.19), and the MNA-SF score (OR 2.43, 95% CI 0.67–8.82) (Table 2).

Table 1 The characteristics of analysis participants

Table 1
The characteristics of analysis participants

The values were described as median interquartile range (IQR), and Mann-Whitney U test was performed. FVC: Forced Vital Capacity, FEV: Forced expiratory volume 1.0(s)%, MIP: Maximum inspiratory pressure, MEP: Maximum expiratory pressure


Table 2 Univariate and multivariate OR and 95% CI for cough peak flow

Table 2
Univariate and multivariate OR and 95% CI for cough peak flow

† Model included age, gender, sarcopenia and MNA-SF, ADL: activities of daily living, OR: odds ratio, CI: Confidence interval, BMI: Body mass index, SMI: skeletal muscle mass index, IPAQ: International Physical Activity Questionnaire


Discussion

The results of our study revealed that sarcopenia was independently and significantly associated with a reduced CPF in elderly who used day care services and needed support or long-term care. Additionally, sarcopenia was weakly associated with MNA-SF score (<11 points was malnutrition), as well as with age and gender.
Sarcopenia is typically an age-related condition, although it can occur secondary to diminished activity, malnutrition, or cachexia (7-9). Sarcopenia can affect the respiratory muscles with consequent reduction in respiratory muscle strength and endurance (6). Diminished respiratory muscle strength secondary to sarcopenia was significantly associated with a reduced CPF in our current study. A recent study indicated that the capacity of the pectoralis major observed on chest computed tomography may serve as a predictor of aspiration pneumonia (20). A previous study has reported that sarcopenia is associated with the aspiration pneumonia-related mortality rate in elderly patients. Another study has reported that sarcopenia is a risk factor for postoperative respiratory complications (21, 22). Our current study investigated the factors associated with aspiration pneumonia in elderly who needed support or long-term care, and our results suggested that sarcopenia may contribute to the mechanism of diminished cough intensity.
An association (albeit weak) between CPF and MNA-SF score could be explained by a presumed association between malnutrition and diminished muscle strength. Malnutrition reduces respiratory muscle strength and maximal voluntary ventilation. Arora et al. reported that improved nutrition reduces the occurrence of pulmonary disease (23). Malnutrition reduces respiratory muscle mass, and the lack of energy reduces respiratory muscle activity. Age was also weakly associated with a reduced CPF. A previous study has reported that expiratory and inspiratory muscle strength decrease with age (24), and a similar trend was noted in our current study. Another previous study indicated that respiratory muscle strength is greater in males than in females (6), and this gender difference presumably explains the reduced CPF. Notably, this gender difference was evident even when male and female participants having the same physique were investigated. However, the exact cause that explains this difference remains unclear.
Comparison of participants with a high CPF (≥130 L/m) and participants with a low CPF (<130 L/m) revealed significant differences in respiratory indices—these indices were higher in participants with a high CPF. This finding concurs with a previous study, which reported that CPF was associated with respiratory indices (25). Significant differences between two groups were observed in height and SMI in that these parameters were higher in participants with a high CPF; however, no significant differences were observed in BMI between the 2 groups. This finding could be attributed to the fact that a few participants were diagnosed with obesity and sarcopenia, i.e., they demonstrated a large amount of fat and sarcopenia but a short stature. We intend to investigate this issue in future studies.
A limitation of this study was its small sample size. We preliminarily investigated CPF in a limited sample, and the statistical power of the study was limited. However, sarcopenia was significantly and independently associated with a reduced CPF, which suggests that sarcopenia is a relatively potent contributor to a reduced CPF. Nonetheless, other potent factors cannot be ruled out. We intend to perform large-scale studies in future to clarify the association between a reduced CPF and the aforementioned individual factors.
As stated, we intend to study the aforementioned association followed by a longitudinal evaluation of day care services. If a cause-and-effect relationship can be identified, it would help in determining the factors that require intervention to prevent reduction in CPF and consequent aspiration pneumonia. This finding could lead to new findings with regard to community efforts to obviate the need for long-term care.
In conclusion, this study reveals that sarcopenia is a potent risk factor for diminished cough intensity, which is known to predispose patients to aspiration pneumonia. In our view, our current findings are highly significant in that they provide specific quantitative data highlighting the association between sarcopenia and the development of aspiration pneumonia via the mechanism of “diminished cough intensity.” Additionally, a reduced CPF was observed to be weakly associated with nutritional status by MNA-SF, age, and gender. A reduced CPF is significantly associated with sarcopenia.


Funding and Conflict of interest: None to disclose.

Ethical standard: This study was approved by the Ethical Review Board of Morinomiya University of Medical Sciences (approval no: 2016-097). Data were only collected from those repondants who signed informed consent. This study was conducted in accordance with the Declaration of Helsinki.


References

1.    Marik PE, Kaplan D: Aspiration pneumonia and dysphagia in the elderly. Chest, 2003, 124: 328–336.
2.     Bach JR, Ishikawa Y, Kim H: Prevention of pulmonary morbidity for patients with Duchenne muscular dystrophy. Chest, 1997, 112: 1024–1028.
3.    Freitas FS, Ibiapina CC, Alvim CG, et al.: Relationship between cough strength and functional level in elderly. Rev Bras Fisioter, 2010, 14: 470–476.
4.    Bahat G, Tufan A, Ozkaya H, et al.: Relation between hand grip strength, respiratory muscle strength and spirometric measures in male nursing home residents. Aging Male, 2014, 17: 136–140.
5.    Kim J, Davenport P, Sapienza C: Effect of expiratory muscle strength training on elderly cough function. Arch Gerontol Geriatr, 2009, 48: 361–366.
6.    Chen HI, Kuo CS: Relationship between respiratory muscle function and age, gender, and other factors. J Appl Physiol, 1989, 66: 943–948.
7.    Delmonico MJ, Harris TB, Lee JS, et al.: Alternative definitions of sarcopenia, lower extremity performance, and functional impairment with aging in older men and women. J Am Geriatr Soc, 2007, 55: 769–774.
8.    Goodpaster BH, Park SW, Harris TB, et al.: The loss of skeletal muscle strength, mass, and quality in older adults: The health, aging and body composition study. J Gerontol A Biol Sci Med Sci, 2006, 61: 1059–1064.
9.    Cruz-Jentoft AJ, Baeyens JP, Bauer JM, et al.: Sarcopenia: European consensus on definition and diagnosis: Report of the European Working Group on Sarcopenia in Older People. Age Ageing, 2010, 39: 412–423.
10.    Yamada M, Nishiguchi S, Fukutani N, et al.: Prevalence of sarcopenia in community-dwelling Japanese older adults. J Am Med Dir Assoc, 2013, 14: 911–915.
11.    Izawa S, Kuzuya M, Okada K, et al.: The nutritional status of frail elderly with care needs according to the mini-nutritional assessment. Clin Nutr, 2006, 25: 962–967.
12.    Rubenstein LZ, Harker JO, Salvà A, et al.: Screening for malnutrition in geriatric practice: Developing the Short-form Mini Nutritional Assessment (MNA-SF). J Gerontol A Biol Sci Med Sci, 2001, 56: 366–372.
13.    Kumagai S, Watanabe S, Shibata H, et al.: Effects of dietary variety on declines in high-level functional capacity in elderly people living in a community. Nihon Koshu Eisei Zasshi, 2003, 50: 1117–1124. In Japanese.
14.    Craig CL, Marshall AL, Sjöström M, et al.: International physical activity questionnaire: 12-country reliability and validity. Med Sci Sports Exerc, 2003, 35: 1381–1395.
15.    Murase N, Katsumura T, Ueda C, et al.: Validity and reliability of Japanese version of the International Physical Activity Questionnaire. J Health Welfare Stat, 2002, 49: 1–9. In Japanese.
16.    Chen LK, Liu LK, Woo J, et al.: Sarcopenia in Asia: Consensus report of the Asian Working Group for Sarcopenia. J Am Med Dir Assoc, 2014, 15: 95–101.
17.     Sanada K, Miyachi M, Yamamoto K, et al.: Prediction models of sarcopenia in Japanese adult men and women. Jpn J Phys Fitness Sport, 2010, 59: 291–302.
18.    Charlson ME, Pompei P, Ales KL, et al.: A new method of classifying prognostic comorbidity in longitudinal studies: development and validation. J Chronic Dis, 1987, 40: 373–383.
19    National Health and Nutrition Survey, Retrieved September 30, 2018, from https://www.mhlw.go.jp/content/10904750/000351576.pdf
20.     Sakaguchi K, Hara S: Capacity of the pectoralis major muscle may be a prognostic factor for aspiration pneumonia. Adv Aging Res, 2017, 6: 101–117.
21.    Maeda K, Akagi J: Muscle mass loss is a potential predictor of 90-day mortality in older adults with aspiration pneumonia. J Am Geriatr Soc, 2017, 65: e18–e22.
22.    Soma D, Kawamura YI, Yamashita S, et al.: Sarcopenia, the depletion of muscle mass, an independent predictor of respiratory complications after oncological esophagectomy. Dis Esophagus, 2018.
23.    Arora NS, Rochester DF. Respiratory muscle strength and maximal voluntary ventilation in undernourished patients. Am Rev Respir Dis, 1982, 126: 5–8.
24.    Enright PL, Kronmal RA, Manolio TA, et al.: Respiratory muscle strength in the elderly. Correlates and reference values. Cardiovascular Health Study Research Group. Am J Respir Crit Care Med, 1994, 149: 430–438.
25.    Kang SW, Bach JR. Maximum insufflation capacity: vital capacity and cough flows in neuromuscular disease. Am J Phys Med Rehabil, 2000, 79: 222–227.

DIETARY PROTEIN INTAKE PATTERN AND SOURCES AND THEIR ASSOCIATIONS WITH MUSCLE AND PHYSICAL FUNCTION MEASURES IN OLDER CHINESE ADULTS WITH SARCOPENIA IN HONG KONG


L.-Y. Zhu, R. Chan, L. Li, T. Kwok, J. Woo


1. Department of Medicine and Therapeutics, The Chinese University of Hong Kong, Rm 124021, 10/F Lui Che Woo Clinical Sciences Building, Prince of Wales Hospital, Shatin Hong Kong SAR

Corresponding Author: Ruth Chan, Department of Medicine and Therapeutics, The Chinese University of Hong Kong, Rm 124021, 10/F Lui Che Woo Clinical Sciences Building, Prince of Wales Hospital, Shatin Hong Kong SAR, ruthchansm@cuhk.edu.hk; Tel.: + 852-3505-2190; Fax: +852-2637-9215

J Aging Res Clin Practice 2018;7:75-81
Published online May 17, 2018, http://dx.doi.org/10.14283/jarcp.2018.14


Abstract

Background: Protein intake is a major risk factor of sarcopenia. To combat sarcopenia, strategies focused on providing sufficient high quality dietary protein are required. Objectives: We aimed to identify the pattern of dietary protein intake and its association with muscle and physical functions among community-dwelling sarcopenic Chinese older adults in Hong Kong. Design: Baseline data of a randomized controlled trial in sarcopenia were analyzed. Setting: Participants who were ambulant and could travel to the assessment centre at a regional hospital in Hong Kong were recruited in nearby community elderly centers, nursing homes and other institutional settings. Participants: A total of 113 Chinese older adults aged 65 or above who had sarcopenia defined using The Asia Working Group Criteria for Sarcopenia were recruited. Measurements: Dietary data and muscle function tests were measured. Results: Although the energy intake (mean + standard deviation: 1491.7±338.6 kcal/d in female, 1738.1±392.9 kcal/d in male) was lower than the recommended daily energy requirement, protein intake averaged 1.6±0.5 g/kg body weight/day, which was high compared to the current Recommended Daily Allowance (RDA, 0.8 g/kg body weight/day for older people). Animal and plant sources contributed to 62% and 38% respectively of the total protein intake. Dietary protein intake was not evenly distributed throughout the day. Physical Activity Scale for the Elderly (PASE) score was more predictive of muscle mass and functions compared to protein intake and sources. Conclusions: Our findings showed that PASE was more predictive of muscle mass and functions compared to protein intake and sources, and there was a minimal association between protein intake and muscle performance measures in our community-dwelling sacropenic older adults. The protein replete state of our study population may explain these findings. The observations that an uneven distribution of protein intake throughout a day may suggest the need to increase protein intake at breakfast among Chinese sarcopenic older adults.

Key words: Sarcopenia, protein, muscle, Chinese.


Introduction

Sarcopenia, which is represented by progressive loss of muscle mass and physical function, is a common consequence of aging associated with multiple comorbidities and poor health outcomes. Using the criteria of the Asian working group to define sarcopenia, about 9% older men and 5% older women in the community had sarcopenia in Hong Kong. A healthy lifestyle with appropriate diet and physical activity level is important for the prevention of sarcopenia (1).
Epidemiological evidence indicates that having dietary protein intake level higher than the current recommended dietary allowance (RDA, 0.8 g/kg body weight/day) is beneficial for older adults especially for those at risk of muscle loss (2). To maintain and regain lean muscle mass, a total protein intake of 1 to 1.2 g/kg body weight per day by older adults has been proposed according to the recent PROT-AGE study group (3). For protein quality, whey protein is preferred as it has a relatively high leucine content which is essential for muscle protein synthesis. Although animal protein is preferred over plant protein in providing leucine, plant protein has also been proven to be beneficial for muscle protein anabolism (4, 5). Yet limited studies have directly compared the ability of animal-derived protein with that of the plant protein regarding their distinct chronic influence on muscle mass and muscle function among elderly (6). Uneven distribution of protein intake over a 24-h period other than adequate quantity may also affect muscle mass and functions (7) since the ability to store excess protein for later anabolic use is limited in older adults (8). Thus there may be no benefit for muscle anabolism in elderly if a single large serving of protein is consumed. Instead, an even distribution of a moderate consumption of high quality protein of 25-30 g per meal throughout the day has been proposed (9).
Older adults are prone to be at risk of energy and protein malnutrition due to several causes. For example, chewing problems and loss of appetite are common among elderly and both are linked with decreased food intake in older adults. In addition, taste perception decreases with age. Changes in taste and smell occurring with ageing may influence the food choices and limit the type and the amount of food consumed by the older adults and possibly increase the risk of malnutrition (10). Studies have shown that deficiencies in energy, protein, calcium, vitamin D and iron are common among older adults, and deficiencies in these nutrients, in particular protein were strongly associated with loss of muscle strength and low gait speed and these would ultimately accelerate the progression of sarcopenia (11). However, a framework of dietary nutrient intakes for sarcopenic elderly is still lacking. Data on the pattern of dietary protein intake of sarcopenic elderly are also limited. Furthermore, findings regarding dietary protein intake in terms of sources and their associations with muscle functions and physical performance among sarcopenic elderly have not been well documented yet. As nutrition is one of the key factors to modulate the onset and progression of sarcopenia, more studies of dietary protein intake pattern among sarcopenic elderly would yield valuable information to develop effective strategy to further optimize the muscle protein synthesis and reverse the status of muscle loss. In view of limited data on the dietary protein intake pattern of sarcopenia subjects in the literature, we aimed to examine such pattern and identify its relationship with muscle and physical function measures in a sample of community-dwelling Chinese older adults with sarcopenia in Hong Kong.


Methods

Study Population

A total of 113 sarcopenic Chinese older adults living in the Hong Kong community (female n=87) from a clinical trial (ClinicalTrials.gov Identifier: NCT02374268) assessing the role of exercise and nutrition in sarcopenia were recruited. People aged 65 years and over who were ambulant and could travel to the assessment centre at a regional hospital in Hong Kong were recruited in the regional hospital, nearby community elderly centres, nursing homes and other institutional settings. A brief screening of sarcopenia including handgrip strength and gait speed measurements, as well as cognitive status based on the Chinese version of Mini Mental Status Examination (MMSE, eligible score ≥18) (17) was conducted to identify potentially eligible subjects. Potential subjects were further undertaken detailed body composition assessment by dual X-ray absorptiometry (DXA, Hologic QDR-4500W densitometer, Waltham, Mass, USA) to check for their eligibility. Sarcopenia status was defined by the criteria of Asian Working Group. Sarcopenia was described as low muscle mass (7.0 kg/m2 for men and 5.4 kg/m2 for women by using DXA) plus low muscle strength (grip strength <26 kg for men and <18 kg for women) and/or low physical performance (usual gait speed<0.8 m/s) (1). Subjects with MMSE score below 18, self-reported allergy to the ingredients of the nutrition supplement, cancer conditions undergoing treatment, poorly controlled or unstable diabetes, hypertension, chronic obstructive pulmonary disease, cardiovascular disease and unhealed bone fracture were excluded. All participants gave written informed consent. The study was approved by the Clinical Research Ethics Committee of The Chinese University of Hong Kong. Baseline dietary data and data on muscle and physical function measures were used and presented in this paper.

Dietary assessment

Dietary data were collected by trained research staff using a three-day diet record which included record on two non-consecutive weekdays and one weekend day. Subjects received a brief guideline on how to estimate the food amounts, portion and utensil sizes. The food items and reference portion size (i.e. Chinese bowl) in our dietary records were similar to our previous studies (12). Three-day diet record was completed by subjects before the study visit and checked by trained research staff on the visit day. Cooked dishes and non-commercial processed foods with multiple ingredients were disaggregated into individual food items. Daily energy and protein intakes and consumption of food groups were calculated using the nutrition analysis software Food Processor Nutrition Analysis and Fitness software version 8.0 (ESHA Research, Salem, USA), in which details of the nutrient content of various local foods based on the food composition tables from China and Hong Kong (13) were added.
Protein intake data included amount, food sources and distribution among three main meals and snack. Dietary energy intake and protein intake were compared with those of the sex- and age-specific Chinese dietary reference intakes (version 2013) (14).

Appendicular skeletal muscle mass

Body composition was measured using DXA (Hologic Discovery A, equipped with software Apex 3.3, Bedford, MA, USA). Calibration with a Hologic body composition spine phantom was performed daily.

Physical activity pattern, as well as muscle and physical function measurements

The muscle power of the upper body was tested by seated medicine ball throw test in which subjects were asked to sit in the chair and hold the ball in both hands. They were then instructed to push the ball away from the center of their chest as far as possible. Three practice trials were provided and the average of the test results was recorded (15). Subjects were asked to perform three attempts of their dominant leg extension strength on a fixed chair. The maximum and average of the data were recorded (16). Data on physical activity pattern were assessed using the Physical Activity Scale for the Elderly (PASE). It was a 12-item scale measuring the average time spent in leisure, household and occupational activities for elderly subjects over the previous seven days before the study visit. Higher score indicates higher physical activity level. Gait speed was measured using the best time in seconds to complete a walk along a 6-meter usual straight path.5-chair stands was used to measure the muscle strength of the lower body. 6-minute walk test evaluated the maximum distance that could be covered along an 18-m long corridor during a 6-minute period. Participants were instructed to walk along the walkway as far as they could and to stop when needed. Leg extension was measured by Takei Physical Fitness Test Back Strength dynamometer (T.K.K. 5002 BACK-A). The quality of life was detected by SF-12 including the physical component summary (PCS) and mental component summary (MCS) scores (17).

Statistical analysis

Data analysis was performed using the statistical package SPSS version 21.0 (SPSS Inc., Illinois, US). Data was checked for normality by descriptive analysis. Mean and standard deviation (SD) or frequency and percentage of subjects’ age, body mass index (BMI), energy intake, total protein intake, animal protein intake, plant protein intake, protein intake relative to body weight, the distribution of dietary protein intake throughout the day, as well as the top five protein sources at various meals throughout the day were derived. Pearson’s correlation coefficient was used to examine the correlation between protein intake and energy intake. Multivariate linear regression analyses were conducted to examine the association of dietary protein intake and sources with muscle and physical function outcomes with adjustment for age, sex and PASE. All statistical tests were set at 2-sided and P values less than 0.05 were considered statistically significant.

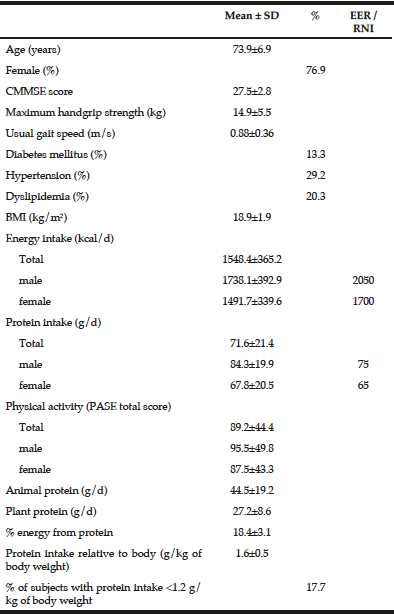
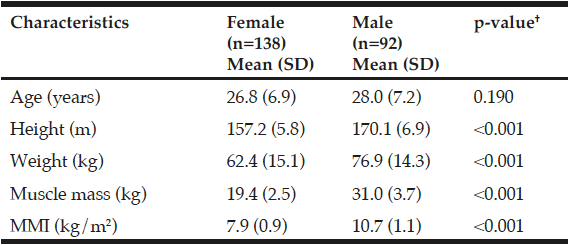
Table 1 Baseline characteristics of the subjects (n=113)

Table 1
Baseline characteristics of the subjects (n=113)

Estimated Energy Requirement (EER) and Reference Nutrient Intake (RNI) for older adults aged over 65 years old with physical activity level I=1.45 by Chinese dietary reference intakes version 2013; Chinese version of the Mini-Mental State Examination (CMMSE)


Results

Descriptive characteristics and dietary energy and protein intake data are presented in Table 1. The mean (SD) age of the studied population was 73.9±6.9 years old with a range from 65 to 89 years old and there were 76.9% female subjects. The mean (SD) BMI of the subjects was 18.9±1.9 kg/m2 (range from 12.9 to 23.8 kg/m2). Low energy intake was observed in comparison to the Chinese average daily energy requirements for elderly above 70 years old. The PASE score was similar to that of our previously Hong Kong Mr & Ms Os follow-up study (total=91.3 ± 43.0) (17). Protein intake was in general adequate. Only 20 subjects failed to meet the requirement of 1.2 g/kg body weight per day. Animal and plant sources contributed to 62% and 38% respectively of the total protein intake.

Table 2 Distribution of dietary protein intake of the subjects throughout the day (n=113)

Table 2
Distribution of dietary protein intake of the subjects throughout the day (n=113)

*Data are not normally distributed. However, the mean and SD values instead of the median and interquartile range are presented for easier interpretation.


In Table 2, dietary protein intake presented an uneven pattern throughout the day and skewed to dinner. Significant low protein intake in breakfast was observed. Animal protein was the dominant protein source in three main meals. The dominant protein sources were red and processed meats, refined grains and sea water fishes for lunch and dinner while milk and grains for breakfast (Table 3). There was no association between plant protein intake and muscle related outcome measures. Only total protein intake and animal protein intake showed positive associations with seated medicine ball throw (muscle power of upper limb). Regression analyses showed PASE as a more significant factor to muscle outcome measures compared to protein intake and sources (Table 4).

Table 3 Top five protein sources at various meals of the subjects throughout the day (n=113)

Table 3
Top five protein sources at various meals of the subjects throughout the day (n=113)


Table 4 Multivariate linear regression linking relative protein intake and selected outcomes (n=113)

Table 4
Multivariate linear regression linking relative protein intake and selected outcomes (n=113)

Appendicular skeletal muscle mass (ASM) and the 12-Item Short Form Health Survey (SF-12); *Model 1: Relative total protein intake (g/kg body weight), PASE, age and sex were entered simultaneously in the model; *Model 2: Relative animal protein intake (g/kg body weight), PASE, age and sex were entered simultaneously in the model; *Model 3: Relative plant protein intake (g/kg body weight), PASE, age and sex were entered simultaneously in the model.


Discussion

The amount of dietary protein intake, food sources and their distribution throughout the day are all important to maximize the response of postprandial muscle protein synthesis (9). In this study, dietary protein intake averaged 67.8±20.5 g/d in women and 84.3±19.9 g/d in men, which met the recommended protein requirement for 70 years old Chinese elderly (75 g/d for men over 70 years old and 65 g/d for women). The reported values were similar to those reported in a study conducted by Tieland’s team in Netherlands (71.6±18.8 g/d in women and 81.9±25.2 g/d in men among 75-79 years old community-dwelling subjects) (18). Multiple consensus statements have argued that a relative protein intake beyond the current RDA (0.8 g/kg body weight/day) or even up to 1.0-1.5 g/kg body weight/day is needed for elderly, in particular for those under disease status (19). Though approximately one-third of population over 50 years old failed to meet the RDA requirement for protein, we observed a sufficient protein intake of an average of 1.6±0.5 g/kg body weight/day in our sarcopenic sample. Moreover, a relatively high animal leucine-rich protein intake pattern was observed in our sarcopenic subjects. The 2010 Dietary Guidelines of Americans proposed that although animal based protein provides better quality of protein, plant based protein consumer can also meet the requirement of essential amino acids, such as leucine, for muscle synthesis (20). Similar to the Korean Nutrition Survey (21), data from our Hong Kong Mr Os and Ms Os study also supported the importance of plant protein in preventing sarcopenia. A purely high animal source of dietary protein may be deleterious for muscle health, possibly in promoting an endogenous acid environment (22). It may be that optimal protein intake should be derived from both animal and plant sources. A diet rich in vegetables, fruits as well as snacks-drinks-milk products was also found to be associated with a lower likelihood of sarcopenia (23).
Although we observed the relative protein intake averaged up to 1.6±0.5 g/kg body weight/day and only 20 subjects failed to meet the requirement of 1.2 g/kg body weight per day, we found a lower caloric intake in sarcopenic subjects when compared to the intake value of non-sarcopenic elderly reported in our previous study (23). Such caloric restriction may affect the improvements that the protein intake may have on muscle functions in our sarcopenic elderly. Therefore, all these observations possibly suggest that a balanced diet with adequate caloric and protein intake, and rich in alkaline-forming foods, such as vegetables and fruits may be considered as one of the potential nutritional strategies for sarcopenia prevention. However, future questions to be explored include the impact of cultural dietary differences, as well as the optimal ratio of animal protein to plant protein in the preservation of muscle mass and functions.
Our study showed that the three main meals contributed to more than 85% of daily total protein intake and the protein intake showed an uneven distribution throughout the day. Consistent with the US older population data (24), our sarcopenic older adults showed a skewed protein intake pattern towards the evening meal. Likewise, Mamerow et al. recently completed a 7-d feeding study to measure the changes of 24-h response of muscle protein synthesis between an even and uneven diet. Over the 24 hours, muscle protein synthesis was 25% higher in the group with an even protein distribution across the three main meals (7). Our findings of a skewed protein intake suggest that there is room for improvement in a more evenly distributed protein meal pattern in our studied population in order to optimize muscle protein synthesis. It has also been shown that ingestion of smaller amounts of dietary protein per meal would attenuate the protein synthetic response in old age, in contrast to young people (8). There would be no advantage of consuming overly large serving of protein in a single meal in older people to preserve muscle mass as the human body has limited ability to store excess protein or amino acid for later use (5). Several studies showed that 25-30 g of dietary protein in each meal is sufficient to maximize protein synthesis among the elderly (9). In our study, we observed an average protein intake of less than 12 g in breakfast and this intake value was far below the recommended protein intake for a single meal. Therefore, increasing the amount of protein intake in breakfast to at least 25 g might be a potential dietary strategy to prevent or treat sarcopenia among community-dwelling Chinese older adults in Hong Kong.
It has been proven that combination of exercise and protein ingestion is the most effective way to postpone sarcopenia. Regression analyses showed that PASE was more predictive of muscle mass and functions compared with the amount and source of dietary protein in this population. This may be explained by the protein replete state of our community-dwelling older population, suggesting that protein supplementation would only provide additional benefit to exercise where habitual protein intake is low (24).
Our study has several strengths. First, we used well-recognized Asia working group definition of sarcopenia to define sarcopenia in the present study and this could allow easier cross-study comparisons in the future. Second, we performed the dietary data analysis using per meal basis instead of daily basis in contrast to previous studies. Our analysis examined detailed dietary patterns and preferences of our sarcopenic elderly. Several limitations should be noted. We used convenience sampling to recruit our sarcopenic subjects from the community and those who joined the study were likely to be more health conscious and have relatively better baseline threshold in terms of health status and nutrient intakes. The sample was also predominately female. Moreover, the aim of the overall trial was to recruit older people to participate in either the intervention arms or the control arm for a 6-month period. Therefore, we intended to recruit relatively healthy older adults because we preferred to have those who could commit to finish the 6-month trial period so as to minimize the dropout rate of the trial. Therefore, our findings may not be generalized to those who are sarcopenic from the hospital settings or the old age homes. Moreover, the present study only captured the recent dietary data using the 3-day diet record. Long-term usual dietary data, such as those assessed using a food frequency questionnaire are not available in the present study. In addition, data on amino acids from diet were not available at the present stage, thus the association of dietary amino acids with sarcopenia remains to be investigated.
In conclusion, there was a minimal association between protein intake and muscle performance measures in our community-dwelling sacropenic older adults. The protein replete state of our study population may explain these findings. The observations that an uneven distribution of protein intake throughout a day may suggest the need to increase protein intake at breakfast among Chinese sarcopenic older adults.


Acknowledgments: This study is supported by grants from the Institute of Ageing, and the Centre for Nutritional Studies of The Chinese University of Hong Kong. The research protocol was approved by ethics committees and that written consent was obtained from all participants.ClinicalTrials.gov Identifier: NCT02374268.

Conflicts of Interest: The authors declare no conflict of interest.

Ethical standard: The study was conducted according to the German law and to good clinical practice and ethical principles of the Declaration of Helsinki. The Ethics Committee of the Charité – University of Medicine, Berlin, Germany, approved the study.


References

1.    Chen LK, Liu LK, Woo J, et al. (2014) Sarcopenia in Asia: consensus report of the Asian Working Group for Sarcopenia. Journal of the American Medical Directors Association 15:95-101
2.    Volpi E, Campbell WW, Dwyer JT, Johnson MA, Jensen GL, Morley JE, Wolfe RR (2013) Is the Optimal Level of Protein Intake for Older Adults Greater Than the Recommended Dietary Allowance? J Gerontol a-Biol 68:677-681
3.    Bauer J, Biolo G, Cederholm T, et al. (2013) Evidence-based recommendations for optimal dietary protein intake in older people: a position paper from the PROT-AGE Study Group. Journal of the American Medical Directors Association 14:542-559
4.    Luiking YC, Deutz NE, Memelink RG, Verlaan S, Wolfe RR (2014) Postprandial muscle protein synthesis is higher after a high whey protein, leucine-enriched supplement than after a dairy-like product in healthy older people: a randomized controlled trial. Nutrition journal 13:9
5.    Arentson-Lantz E, Clairmont S, Paddon-Jones D, Tremblay A, Elango R (2015) Protein: A nutrient in focus. Appl Physiol Nutr Me 40:755-761
6.    Haub MD, Wells AM, Tarnopolsky MA, Campbell WW (2002) Effect of protein source on resistive-training-induced changes in body composition and muscle size in older men. The American journal of clinical nutrition 76:511-517
7.    Mamerow MM, Mettler JA, English KL, Casperson SL, Arentson-Lantz E, Sheffield-Moore M, Layman DK, Paddon-Jones D (2014) Dietary protein distribution positively influences 24-h muscle protein synthesis in healthy adults. The Journal of nutrition 144:876-880
8.    Katsanos CS, Kobayashi H, Sheffield-Moore M, Aarsland A, Wolfe RR (2005) Aging is associated with diminished accretion of muscle proteins after the ingestion of a small bolus of essential amino acids. American Journal of Clinical Nutrition 82:1065-1073
9.    Paddon-Jones D, Campbell WW, Jacques PF, Kritchevsky SB, Moore LL, Rodriguez NR, van Loon LJ (2015) Protein and healthy aging. The American journal of clinical nutrition
10.    Tieland M, Borgonjen-Van den Berg KJ, Van Loon LJ, de Groot LC (2015) Dietary Protein Intake in Dutch Elderly People: A Focus on Protein Sources. Nutrients 7:9697-9706
11.    Kido Y (2015) The Issue of Nutrition in an Aging Society. Journal of nutritional science and vitaminology 61 Suppl:S176-177
12.    Chan R, Woo J, Leung J (2011) Effects of food groups and dietary nutrients on bone loss in elderly Chinese population. The journal of nutrition, health & aging 15:287-294
13.    Food Nutrient Finder. Centre for food safety. The Government of the Hong Kong Special administrative region. Web.2017. http://www.cfs.gov.hk/english/nutrient.
14.    Society CN. Chinese Dietary Reference intakes. 2013. Science Press, Beijing.
15.    Harris C, Wattles AP, DeBeliso M, Sevene-Adams PG, Berning JM, Adams KJ (2011) The Seated Medicine Ball Throw as a Test of Upper Body Power in Older Adults. J Strength Cond Res 25:2344-2348
16.    Fragala MS, Alley DE, Shardell MD, et al. (2016) Comparison of Handgrip and Leg Extension Strength in Predicting Slow Gait Speed in Older Adults. Journal of the American Geriatrics Society 64:144-150
17.    Yu R (2014) Incidence, reversibility, risk factors and the protective effect of high body mass index against sarcopenia in community-dwelling older Chinese adults (vol 14, pg 15, 2014). Geriatrics & gerontology international 14:730-730
18.    Tieland M, Borgonjen-Van den Berg KJ, van Loon LJ, de Groot LC (2012) Dietary protein intake in community-dwelling, frail, and institutionalized elderly people: scope for improvement. European journal of nutrition 51:173-179
19.    Fielding RA, Vellas B, Evans WJ, et al. (2011) Sarcopenia: an undiagnosed condition in older adults. Current consensus definition: prevalence, etiology, and consequences. International working group on sarcopenia. Journal of the American Medical Directors Association 12:249-256
20.    United States. Department of Health and Human Services., United States. Department of Agriculture., United States. Dietary Guidelines Advisory Committee. (2010) Dietary guidelines for Americans, 2010. G.P.O., Washington, D.C.
21.    Kim J, Lee Y, Kye S, Chung YS, Kim KM (2015) Association of vegetables and fruits consumption with sarcopenia in older adults: the Fourth Korea National Health and Nutrition Examination Survey. Age and ageing 44:96-102
22.    Chan R, Leung J, Woo J (2015) Association Between Estimated Net Endogenous Acid Production and Subsequent Decline in Muscle Mass Over Four Years in Ambulatory Older Chinese People in Hong Kong: A Prospective Cohort Study. J Gerontol a-Biol 70:905-911
23.    Chan R, Leung J, Woo J (2016) A Prospective Cohort Study to Examine the Association Between Dietary Patterns and Sarcopenia in Chinese Community-Dwelling Older People in Hong Kong. Journal of the American Medical Directors Association 17:336-342
24.    Breen L, Phillips SM (2013) Interactions between exercise and nutrition to prevent muscle waste during ageing. Brit J Clin Pharmaco 75:708-715

SARCOPENIA VERSUS DYNAPENIA: FUNCTIONAL PERFORMANCE AND PHYSICAL DISABILITY IN CROSS SECTIONAL STUDY


T. Neves1,3, M. Bomfim Martin Lopes2, M.G. Crespilho Souza3, E. Ferriolli4, C.A. Fett3, W.C. Rezende Fett3


1. Department of Physical Education, University of the State of Mato Grosso, Diamantino, MT, Brazil; 2. Department of Physical Education, Physical Education College, IPE Faculty of Technology, Cuiabá, MT, Brazil; 3Department of Physical Education, Nucleus of Studies in Physical Fitness, Computers, Metabolism, and Sports and Health, Federal University of Mato Grosso, Cuiabá, MT, Brazil; 4. Department of Internal Medicine, Faculty of Medicine of Ribeirão Preto, University of São Paulo, Ribeirão Preto, SP, Brazil.

Corresponding Author: Thiago Neves, Department of Physical Education, University of the State of Mato Grosso, 166, Rui Barbosa Street, Eldorado Garden, ZIP Code 78.400-000, Diamantino, MT, Brazil, E-mail address: thiago.alimt@gmail.com. Telephone: +5565-99957-9709. Fax: +55653336-1446.

J Aging Res Clin Practice 2018;7:60-68
Published online April 5, 2018, http://dx.doi.org/10.14283/jarcp.2018.12


Abstract

Background: The magnitude of “Sarcopenia” and “Dynapenia” as a public health problem is not well established, nor is the relationship of declines strength and muscle mass to physical disability and/or loss of mobility. Objectives: Test the hypothesis that the elderly with sarcopenia are more likely to physical disability than are those with dynapenia. Design: Cross-sectional study. Setting/Participants: A total of 387 older adults (≥65 years old) from the FIBRA Study in Cuiabá, Mato Grosso, Brazil. Measurements: Sarcopenia was diagnosed according to the European Working Group on Sarcopenia in Older People (EWGSOP), which includes the presence of low muscle mass, plus low muscle strength or low physical performance. Dynapenia was defined as handgrip strength <30kgf (men) and <20kgf (women). Data relating to socio-demographic, behavioral, health conditions, physical disability, the level of physical activity, body composition, hand grip strength and the Short Physical Performance Battery were collected. Results: Regarding the loss of mobility, sarcopenia was associated with age ≥75 years, female, sedentary lifestyle, stroke, arthritis, and falls (OR = 2.95, 95% CI: 1.07 – 8.09); with no association for physical disability in BADL and IADL. Dynapenia had no association with loss of mobility; however, for disability in BADL and IADL, it was associated with the elderly aged ≥80 years old and arthritis (OR = 2.35, 95% CI: 1.42 – 3.88). Conclusion: Dynapenia is more sensitive to the prevention of future self-reported physical disability, in comparison to sarcopenia which can be used in clinical practice as a screening tool for the early decline in mobility..

Key words: Physical disability, mobility, activities of daily living, sarcopenia, dynapenia.


Introduction

Physical disability usually occurs in older adults, and it is estimated that 20% to 30% of individuals over 70 years old have difficulties in performing basic and instrumental activities of daily living that require mobility and locomotion. Sarcopenia, which is defined as the loss of muscle mass associated with the presence of low muscle function (strength or physical performance), is one of the main causes of mobility loss and disability related to aging (1–4).
Sarcopenia is a syndrome characterized by the progressive and widespread loss of skeletal muscle mass and strength related to the age, leading to the risk of adverse outcomes, such as physical disability, poor quality of life and death (1). Complementary to the definition of sarcopenia, the recent discussion is that the decline in muscle strength can be given to a combination of muscular and neural factors and not only to reduced muscle mass, so recent questions about the inclusion of muscle mass and strength in the same concept (1, 5, 6).
Recently, results from some studies that analyzed muscle strength and muscle mass and their effect in physical disability, finding that muscle strength is a better predictor of disability (5). Dynapenia is the age-associated loss of muscle strength (5) and premature death (7,8). Thus, the term “dynapenia” was created to describe the functional impairment of the entire neuromuscular apparatus, and it was also claimed that sarcopenia has its original definition limited to the decline in age-related skeletal muscle mass (9). There is no evidence that the definition of sarcopenia has clinical importance (6), but this term attempts to achieve its widespread use. The proposal of the term dynapenia focuses on the aspect of performance seeking to overcome this dichotomy. However, some authors do not agree with the distinction between the terms “dynapenia” and “sarcopenia”, due to the risk of confusion between the nomenclatures (1).
The Fragility in Brazilian Elderly Research Network (FIBRA Network) was designed and developed to investigate and survey data on the prevalence, characteristics, and risk profiles for the biological fragility syndrome, among other syndromes in Brazilian elderly population. This study was performed with urban residents in localities with different levels of human development, in different geographic regions, considering socio-demographic, anthropometric, physical health, physical and mental functionality, and psychological variables (10).
Therefore, this study aimed to test the hypothesis that the elderly with sarcopenia (loss of physical performance and muscle mass) are more likely to physical disability and comorbidities than those with dynapenia (loss of physical performance).


Materials and methods

Participants

This research is a subproject of the Fragility in Brazilian Elderly Research Network (FIBRA Network) and consists of an exploratory cross-sectional multidisciplinary and multicentric population-based study, conducted in the period between 2009 and 2010 in 17 Brazilian regions selected by the criterion of quota sampling, with different indices of human development.
Regarding the present study, 513 elderly residents in the urban area of Cuiabá (Mato Grosso State, Brazil) were interviewed through registration forms from the census database of the IBGE, which registered 17,329 older adults. Participants aged under 65 years, or with severe mental retardation, severe or unstable Parkinson’s disease, terminal stage; amputations, and severe orthopedic limitations were not considered in this study.
Thus, only 387 older adults met all the inclusion criteria and completed all the evaluation stages of this study. All participants were previously informed about the study proposal and procedures they would be submitted to. Then they were asked to sign a consent form, approved by the Research Ethics Committee (protocol No. 196/96 CNS, approval number 632/09) of the Hospital Universitário Júlio Müller of the Federal University of Mato Grosso (HUJM-UFMT).

Anthropometric measurements

The body mass of the volunteers was determined using an electronic platform scale (ID 1500, Filizola®, Brazil) with a capacity of 200 kg and a precision of 0.1 kg. The elderly stood up in the middle of the platform scale, with their feet joined and arms along the body. Their height was measured with their body in an upright position, in bare feet, joined and close to the scale, using a portable stadiometer (Sanny®, Profissional model, Brazil) with a precision of 0.1 cm.
The body mass index was calculated by dividing the weight (in kilograms) by the squared height (in meters) (kg/m2). The reference values adopted for the body mass index were those suggested and suitable for the elderly, who are categorized in: <22.0 kg/m² = low weight, from 22.0 kg/m² to 27.0 kg/m² = eutrophic, and >27.0 kg/m² = excess weight (11). The circumferences of the abdomen (AC), waist (WC), calf (CC) and hip (HC) were measured using a flexible and inextensible plastic metric tape (Sanny®, Brazil) with a precision of 0.1 cm. The reference values for AC were ≥94.0 cm for men and ≥80.0 cm for women (12). The CC was used to verify the nutritional status, considering well-nourished those elderly who presented values ≥31 cm, for both genders (13).

Diagnosis and Classification of Sarcopenia

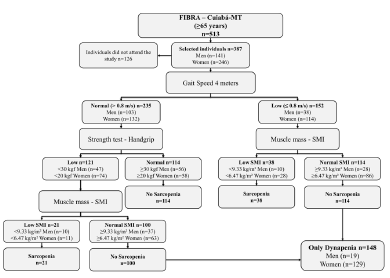
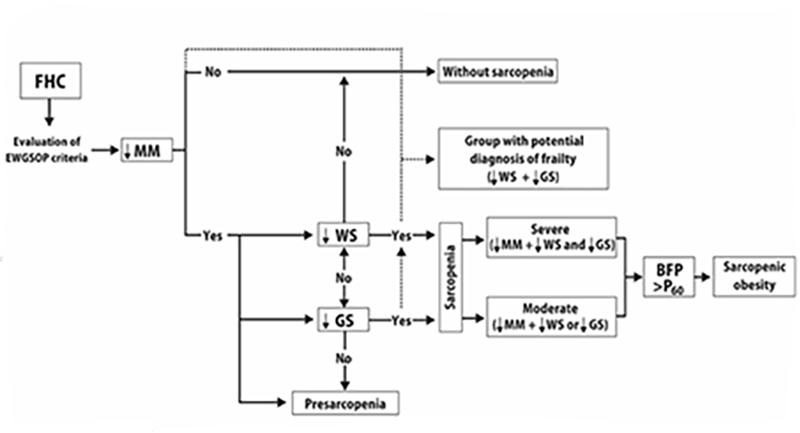
Sarcopenia was diagnosed according to consensus of the European Working Group on Sarcopenia in Older People (EWGSOP), which recommends the use of low muscle mass accompanied by low muscle function (strength or physical performance) for the diagnosis of sarcopenia (1). Thus, the diagnosis of sarcopenia in the present study sample required the confirmation of low muscle mass, in addition to the reduced muscle strength or poor physical performance (Figure 1).


Profile of the study using the consensus of the European Working Group on Sarcopenia in Older People (EWGSOP), suggested in case you find sarcopenia in older individuals. SMI = skeletal muscle mass index obtained by the absolute mass of the skeletal muscles divided by squared height in meters (kg/m²)

Profile of the study using the consensus of the European Working Group on Sarcopenia in Older People (EWGSOP), suggested in case you find sarcopenia in older individuals. SMI = skeletal muscle mass index obtained by the absolute mass of the skeletal muscles divided by squared height in meters (kg/m²)


Skeletal Muscle Mass Measurement

Muscle mass was estimated by skeletal muscle mass (SMM), using the mathematical equation of Lee (14).

SMM (kg) = 0.244 x body mass + 7.8 x height + 6.6 x gender – 0.098 x age + ethnicity – 3.3
The body mass was determined in kilograms and the height measured in meters. The age (years), gender (1 for men and 0 for women), race (-1.2 for Asians, 1.4 for Afro-descendants, and 0 for Caucasians) were also considered.
This equation was validated in the Brazilian population using the dual energy X-ray (DXA) method, and there was a high correlation between the methods (r = 0.86 for men and r = 0.90 for women, p<0.05). Moreover, there was a strong correlation between DXA and the predictive equation to determine the prevalence of sarcopenia (k = 0.74, p<0.001), with a high specificity (89%) and sensitivity (86%) (15).
The absolute skeletal muscle mass was converted to a skeletal muscle mass index (SMI), divided by squared height (kg/m2). The SMI was used to adjust the height and mass of non-skeletal muscle tissues, being used in several epidemiological studies (16, 17). The low muscle mass was defined by the SMI, with the cut-off point based on 20% of the lowest percentile of the population distribution, representing an SMI of ≤6.47 kg/m2 for women and ≤9.33 kg/m2 for men (16).

Muscle Strength Measurement

Muscle strength was evaluated by the hand grip strength, using a manual hydraulic dynamometer (Saehan Corporation®, Model SH5001, 973, Yangdeok-Dong, Masan 630-728, Korea). For this measurement, the elderly sat on an armless chair, and were positioned with the elbow flexed at 90°; shoulder adducted, forearm in a neutral position, and the wrist between 0° and 30° of extension. Three successive measurements were performed (at about 15 seconds between each one), and the best score of three trials was recorded for analysis. Cut-off values with a hand grip strength less than 30 kgf in men and 20 kgf in women  were considered to represent low muscle strength (1, 4).

Four-Meter Walking Test

The gait speed (meters/second) was determined by assessing the low physical performance of the lower limbs by the 4-meter walking test (4mWT) of the Short Physical Performance Battery (SPPB) (18). The average walking speed of the elderly was calculated by dividing the walking distance by the time spent in the test. The cut-off point of ≤0.8 m/s was used to identify low physical performance (1,4).

Loss of mobility

Loss of mobility was evaluated through the Short Physical Performance Battery (SPPB) (18), which is an instrument composed of three tests that evaluate, in sequence, the standing static balance, gait speed in usual step (measured in two times in a certain round-trip route of 4 meters) and the muscle strength of the lower limbs by the movement of standing up from and sitting down on a chair five consecutive times. The SPPB test is scored on a 0–12 scale, with higher scores indicating a higher functional level. The elderly who scored ≤7 points were considered at risk for mobility loss, because of their clinical relevance was associated with the triage of the elderly at risk of developing future disabilities, in addition to being objective, standardized and multidimensional. The variable of risk for loss of final mobility was dichotomous. A score of 0 indicates a higher functional level (>7 points in the SPPB) and 1 indicates a risk for mobility loss (≤7 points in the SPPB) (19).

Diagnosis and Classification of Dynapenia

Measures of upper extremity muscle strength were isometric shoulder adduction and handgrip. We selected the handgrip for the present analysis because the assessment of handgrip is easy, reliable, and inexpensive. Using the cut-off points indicated the Dynapenia was defined using the criteria with a hand grip strength less than 30 kgf in men and 20 kgf in women, considering with dynapenia those who exclusively lost only muscular strength (1, 4). Included in the classification individuals who had only loss of muscle strength (Figure 1).

Functional capacity

The functional capacity of the elderly for the basic activities of daily living (BADL) and instrumental activities of daily living (IADL) was evaluated by the Katz scale (20) and Lawton & Brody scale (21), respectively. Interviewees were asked if they had difficulties in performing the BADL (transfer, go to the bathroom, take a bath, urinary continence, get dressed, and eat) and the IADL (use a telephone, use mean of transportation, do/go shopping, cook, do light housework, do heavy housework, take medicines, and manage their money). The respondents who indicated difficulty or deficiency in performing one or more of the tasks were classified as having physical disability both in BADL and IADL. The final physical disability variable was dichotomous. A score of 0 indicates no limitation in BADL and IADL, whereas 1 indicates any limitation in BADL and/or IADL.

Physical Activity Level

The assessment of physical activity level was defined using self-report on weekly frequency and the daily duration of physical exercises, active sports, and domestic activities carried out in the week prior to the evaluation, based on items from the Minnesota Leisure Time Activity Questionnaire (22), validated for Brazil (23). For this research, the content, statements, and sequence of the questionnaire items were adapted to the study conducted by the FIBRA Network. Items describing common activities among the Brazilian elderly were kept, and questions on frequency and duration were included, intending to enrich the information on the regularity of the activity practices (if they had been practiced in the last 14 days).
The questionnaire was composed of 42 closed yes or no questions. Each dichotomous answer was followed by other questions about the continuity of activities during the evaluated period (if the elderly had performed each activity in the last two weeks), weekly frequency (how many days in a week) and duration (how many minutes a day).
The elderly who performed at least 150 minutes of weekly moderate-intensity physical activity, or 120 minutes of vigorous-intensity physical activities, following the recommendations of the American College of Sports Medicine (ACSM) and American Heart Association (AHA) (24), were considered active.

Geriatric Depression Scale (GDS)

The depressive symptoms were evaluated using the short version (15 items) of the Geriatric Depression Scale (GDS) (25). These items, together, showed a good diagnostic accuracy, with adequate sensitivity, specificity, and reliability, and can be an alternative for triage mood disorders in the elderly population. Participants with a score of ≥6 in the GDS were considered as having depressive symptoms.

Statistical analysis

The data were analyzed by using the Statistical Package for Social Sciences (SPSS for Windows, version 20.0). The Kolmogorov-Smirnov test was used to verify the normality of the independent variables. The descriptive statistics were presented as mean, standard deviation, median, and minimum – maximum; sample distribution was described, and the prevalence of sarcopenia and dynapenia of the population sample was calculated. For the independent samples, the T-student test was used if the data were parametric and the Mann-Whitney test if the data were non-parametric, and the chi-square test was used to examine the differences in the basic characteristics between the two groups. Values of p≤0.05 were considered significant.
Multiple logistic regression analysis was used to evaluate the effect of sarcopenia and dynapenia on physical disability and loss of mobility. For the degree of mobility, the dummy variables were created and coded, as follows: normal mobility = 0, loss of mobility = 1, whereas for physical disability, the dummy variables were created and coded, as follows: without physical disability = 0, with physical disability = 1, and Odds Ratio (OR) were subsequently computed for these factors. Associations with p≤0.20 in the univariate analysis were selected for logistic regression, for which the step-by-step advance method was used. Model 1 includes sarcopenia as an independent variable and model 2 includes dynapenia.


Results

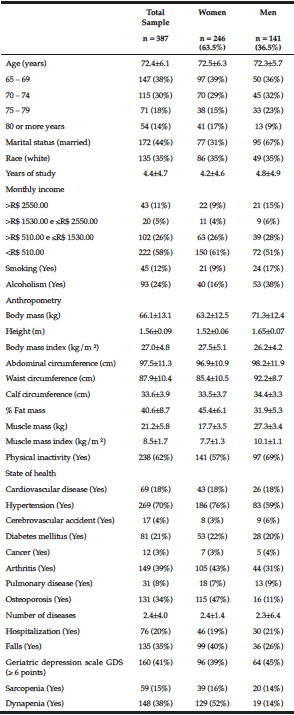
The general characteristics of the sample of elderly are summarized in Table 1. The participants’ mean age was 72 years, most of them weren’t married, white, but had on mean 4 years of schooling, and received less than R$510,00 monthly. Regarding the occurrence of health problems, there was a prevalence of hypertension, diabetes, arthritis/rheumatism, and osteoporosis, with a high cardiovascular risk since the waist circumference was higher than the reference value: 94.0 cm for women and 105.0 cm for men. Sarcopenia and dynapenia were in 15% and 38% of the elderly, respectively, and were higher in women than in men (Table 1).

Table 1 The general characteristics of the sample of elderly by genders, Cuiabá, Mato Grosso, Brazil (2010)

Table 1
The general characteristics of the sample of elderly by genders, Cuiabá, Mato Grosso, Brazil (2010)


The majority were women; among them, there was a higher percentage of older people, with an income lower than R$ 510.00 monthly, excess weight, and a higher percentage of fat, arterial hypertension, arthritis, osteoporosis, and occurrence of falls, compared to men (Table 1).
The elderly with sarcopenia and dynapenia had functional and physical performance significantly lower in comparison to those classified as normal, and were slower and reported more dependencies in ADL (Table 2).

Table 2 Functional performance and physical dependence on 387 seniors living in Cuiabá, Mato Grosso, Brazil (2010)

Table 2
Functional performance and physical dependence on 387 seniors living in Cuiabá, Mato Grosso, Brazil (2010)

Different letters show significant statistical difference between the groups (p ≤ 0.05). Mann-Whitney test with data expressed as median (minimum-maximum). SPPB – Short Physical Performance Battery. BADL – basic activities of daily living. IADL – instrumental activities of daily living.


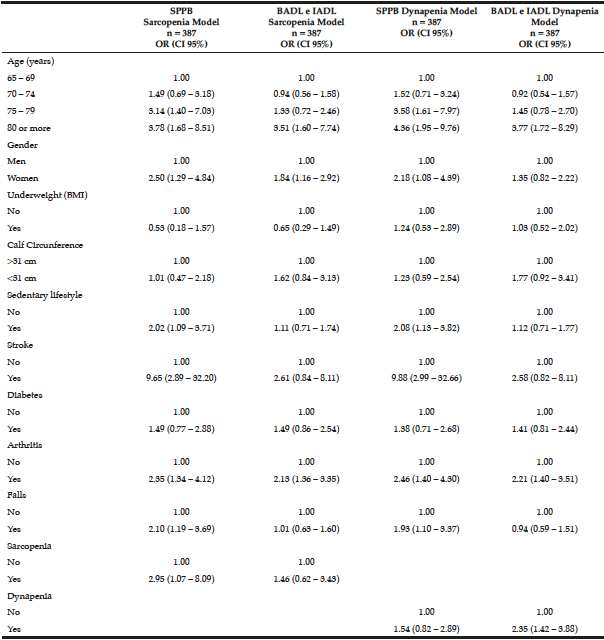
The logistic regression analysis for loss of mobility and disability in BADL and IADL is shown in Table 3. In model 1, the odds ratio (OR) and 95% CI for the factors statistically associated with loss of mobility were: being 75 years old or older, woman, sedentary, have had a stroke, arthritis, falls, and sarcopenia. The factors associated with disability in BADL and IADL were: being 80 years old or older, have had arthritis, and being a woman.

The logistic regression analysis for loss of mobility and disability in BADL and IADL is shown in Table 3. In model 1, the odds ratio (OR) and 95% CI for the factors statistically associated with loss of mobility were: being 75 years old or older, woman, sedentary, have had a stroke, arthritis, falls, and sarcopenia. The factors associated with disability in BADL and IADL were: being 80 years old or older, have had arthritis, and being a woman. In model 2, the OR and 95% CI for factors statistically associated with loss of mobility were the same as those found in model 1, but dynapenia was not associated with loss of mobility. The factors associated with disability in BADL and IADL were being 80 years old or older, have had arthritis and dynapenia.

Table 3 Multiple logistic regression models to test the association of physical dependence or loss of mobility with sarcopenia and dynapenia in the study in 387 seniors living in Cuiabá, Mato Grosso, Brazil (2010)

Table 3
Multiple logistic regression models to test the association of physical dependence or loss of mobility with sarcopenia and dynapenia in the study in 387 seniors living in Cuiabá, Mato Grosso, Brazil (2010)

OR – Odds ratio. CI – Confidence interval. SPPB – Short Physical Performance Battery. BADL – basic activities of daily living. IADL – instrumental activities of daily living.


Discussion

Perhaps the most relevant aspect of the present study is the observation that both classifications (sarcopenia and dynapenia) were significantly associated with physical disability and comorbidities, with a prevalence of 15% and 38%, respectively. Therefore, a division of these classifications is necessary because only the classification as sarcopenia, as proposed by some authors (1), would underestimate an important percentage of individuals with high risk for health and physical disability. Few studies involving elderly individuals have carried out these associations separately. Loss of mobility was only associated with sarcopenia; however, there was an association of self-reported physical disability in BADL and IADL only with dynapenia. Our results suggest that the association between sarcopenia and loss of mobility could be explained by the present comorbidities, the sedentary lifestyle, and the occurrence of falls.
The prevalence of sarcopenia varies among different populations, due to differences relating to age, gender, diagnostic method, and evaluation instruments (26–29). Different instruments used to define sarcopenia, as well as the age group and incompatible living habits of the study population may cause different diagnoses of its prevalence. Because of this variability, it is necessary to emphasize the importance of adopting a standardized and operational definition of sarcopenia for multidimensional geriatric assessment, similarly to the one adopted in the present study.
It is believed that the evaluation of muscle strength by the isolated hand grip strength is useful only in the triage phase of dynapenia, because it explains about 40% of the variation in the strength of the lower limbs, suggesting, for the diagnosis, the evaluation of the muscular strength by the extension of the Knee due to its association with gait speed and physical function (5). Other researchers observed that hand grip strength was a strong predictor of gait speed reduction and self-reported physical disability (in BADL and IADL) (30). These researchers found, in the elderly with low hand grip strength, a higher incidence of physical disability in IADL, and this correlation was higher in women (2.28, 95% CI = 1.59 – 3.27) than in men (1.90, 95% CI = 1.13 – 3.17) (31).
However, in this study, the hand grip strength was used as a method to define the dynapenia, since it is a good indicator of the strength of the whole body, given that a low hand grip strength is strongly associated with a high probability of mortality, the risk of complications and development of physical disability (8,32). Moreover this method makes easier the strength measurement, and it is significantly less expensive and accessible to developing countries, such as Brazil.
Sarcopenia was associated with an increase in loss of mobility, with advancing age, especially in sedentary women, with arthritis or stroke, and with a history of falls. These results together suggest that reductions in skeletal muscle mass accompanied by a decline in strength or physical performance with the aging, as suggested in the EWGSOP document, cause loss of mobility, and if these declines reach a critical point, the physical function can be compromised (33,34).
Data used from the longitudinal Health Aging and Body Composition Study, which observed 3,075 elderly Americans, showed that the lowest quintile of muscle mass was associated with a poor performance of the lower limbs in both genders (35), and they also showed an association with loss of mobility, similar to the results found in our study (34).
The Health, Welfare and Aging (SABE in Portuguese) study, conducted in Brazil with 478 elderly individuals aged 60 years or over, compared the association of sarcopenia and dynapenia with the incidence of deficiency in mobility or IADL, and with disability in basic and instrumental activities of daily living. The authors observed that sarcopenia was associated with a deficiency in mobility or IADL (2.38, 95% CI 1.10 – 5.17), whereas dynapenia was neither associated with physical disability nor with the loss of mobility (33), corroborating, in part, our findings since the dynapenia was associated with self-reported physical disability. Melton et al. (36) reported an association of sarcopenia with walking difficulty in older men and women.
Several studies have shown a relationship between sarcopenia and self-reported physical disability, using scales of basic and instrumental activities of daily living (16,17,37,38), evidencing that women and men with sarcopenia were 3.6 and 4.1 times, respectively, more likely to physical disability in comparison to individuals without sarcopenia (16). On the other hand, some authors reported that only severe sarcopenia was independently associated with an increase in the probability of functional damage and physical disability in the elderly, after adjustments for potential variables of confusion, such as age, race, health behaviors, and comorbidities (37), in addition, they showed that the effect of sarcopenia on physical disability was considerably lower (38,39). However, in our study, the self-reported physical disability was not associated with sarcopenia.
Another study carried out in Australia with 1,705 elderly men, aimed to determine the association among loss of strength, mass and muscle quality, functional limitation, and physical disability, concluded that the muscle strength measurement is the best one to measure age-related muscle change and that it is associated with the deficiency in instrumental activities of daily living and functional limitation (3), corroborating our results. In a sample of 1,030 elderly Italians, some researchers concluded that isometric hand grip strength is strongly related to muscle power of the lower extremities, knee extensor torque, and calf cross-sectional muscle area, and that the decrease in hand grip strength is a clinical marker of mobility loss (walking speed <0.8m/s) better than the decline in muscle mass (4). In other words, conversely to our findings, these researchers evidenced that low values of muscle strength can predict, regardless of other risk factors, the incidence of physical disability (31).
However, in our study, we did not find this association with sarcopenia, perhaps because the elderly participants did not have a high degree of disability in ADL, which could lead to a poor functional performance, explaining this dissociation, besides the fact that these activities are related to works that do not require strength, muscular endurance, and walking speed (40). The differences may be related to diversities in outcome measurements and characteristics of the studied populations, in addition to the fact that physical disability is self-reported, which can hide the true relationship between sarcopenia and physical disability in these elderly. In this sense, a battery of physical tests may be adequately sensitive to support the diagnosis of present and future dependencies and comorbidities (41).
Also, our study indicated that dynapenia was associated with disability in ADL, agreeing with some studies that reported the relationship between dynapenia (measured through hand grip strength) and ADL (31,32). Furthermore, these studies indicated that strength and body mass index (BMI) were positively and negatively associated with the disability in ADL, respectively (39). In this study, the occurrence of falls and sedentary lifestyle were other factors associated with loss of mobility. As found in other studies, older men and women, who are less physically active, have less skeletal muscle mass, which can increase the prevalence of physical disability (42). Thus, the effects of physical exercise, including a simple walk, can protect against the loss of mobility in older adults. Falls and their related injuries are a major health problem in the elderly population and are associated with an increase in morbidity and physical disability (16).
From the results presented here, the following limitation can be considered: 1) The fact this is a cross-sectional study, so the cause-and-effect relationships could not be established. 2) The use of regression equations to estimate muscle mass can underestimate or overestimate the prevalence of sarcopenia. However, few studies have used the DEXA to estimate muscle mass in elderly populations and epidemiological studies because of the high cost. Therefore, simple and feasible options that have the same function without causing population risk are indicated. Furthermore, the equation used in the present study was validated in American and Brazilian populations, presenting a high correlation with magnetic resonance and DXA (14,15). 3) The use of the sarcopenia equation (equation that assists in the diagnosis of sarcopenia by estimating skeletal muscle mass) does not include BMI, it only includes the weight and height in its logistic regression analysis. However, it is known that 50% of the variance of muscle mass is explained by BMI, preventing the identification of other factors related to muscle mass. 4) The FIBRA Study aimed to evaluate the population of elderly residents in the community and did not include the elderly from asylums and hospitals. Thus, the relationship between sarcopenia and physical disability and between dynapenia and physical disability cannot be considered for all elderly population.
Finally, regarding the dynapenia, few population studies were found, as it is a recent issue (32,43). However, the prevalence of dynapenia, as reported for sarcopenia, shows differences among the previous studies (32,43). Probably, the discrepancies among the results can be related to the lack of sufficient evidence in the literature to identify specific cut-off points, complete assessment of risk factors, and the lack of consensus relating to methods and instruments used to define the final diagnostic algorithm. Nevertheless, it is observed in the present study that, among the used methods, the one used to classify dynapenia was more sensitive to associate a higher percentage of the studied population with the factors related to self-reported physical disability.


Conclusions

In summary, this study is relevant because it focused on a large sample of elderly residents in the community, which represents the elderly population in a large Latin American city, in addition to comparing dynapenia with sarcopenia, using the EWGSOP criteria as factors of risk for the loss of mobility and physical disability in ADL.
It also evidenced that individuals who lost strength in addition to muscle mass were more likely to the loss of mobility than those who only lost muscle strength. However, the elderly with dynapenia showed a high disability in self-reported ADL. These associations were measured by the presence of comorbidities, sedentary lifestyle, and occurrence of falls.
The classification of dynapenia differs from the classification of sarcopenia (according to the EWGSOP) in qualitative and quantitative aspects, and we found a higher percentage of individuals classified as having dynapenia. This fact demonstrates that, at least in this population, the classification as dynapenia is more sensitive to prevent future physical dependencies in comparison to the classification as sarcopenia, and can be used in clinical practice as a screening tool for the early decline of mobility. Thus, we emphasize the need for an active lifestyle and the inclusion of physical exercise programs to protect old people against the loss of mobility.


Author affiliations: Center for Physical Fitness, Informatics, Metabolism, Sports and Health, Faculty of Physical Education, Federal University of Mato Grosso, Cuiabá, Mato Grosso State, Brazil (Thiago Neves, Marcela Bomfim Martin Lopes, Milene Giovana Crespilho Souza, Carlos Alexandre Fett, Waléria Christiane Rezende Fett). We thank the members of the Fragility in Brazilian Elderly Research Network (FIBRA Network) who assisted with the scientific and data collection team, in particular the general coordinator of this study, Eduardo Ferriolli, professor at the University of São Paulo, Medical School of Ribeirão Preto , Department of Clinical Medicine, Division of General Medical Clinic and Geriatrics. This research was supported by the National Council of Scientific and Technological Development – CNPq (nº 17/2006) and by the Foundation for Research Support of the State of Mato Grosso – FAPEMAT (002.017/2007). The funding body had no role in the design, data collection, data analysis and interpretation of the study, article writing, or in the decision to submit the manuscript.

Role of the Funding Source: This research was supported by the National Council of Scientific and Technological Development – CNPq (nº 17/2006) and by the Foundation for Research Support of the State of Mato Grosso – FAPEMAT (002.017/2007).

Conflict of interest: None declared.

Ethical standard: The experiments described in this manuscript comply with the current of laws of Brazil.


References

1.    Cruz-Jentoft AJ, Baeyens JP, Bauer JM, Boirie Y, Cederholm T, Landi F, et al. Sarcopenia: European consensus on definition and diagnosis: Report of the European Working Group on Sarcopenia in Older People. Age Ageing. Madrid: Br Geriatrics Soc; 2010 Jul;39(4):412–23.
2.     Ling CHY, Taekema D, de Craen AJM, Gussekloo J, Westendorp RGJ, Maier AB. Handgrip strength and mortality in the oldest old population: the Leiden 85-plus study. CMAJ. 2010 Mar 23;182(5):429–35.
3.     Hairi NN, Cumming RG, Naganathan V, Handelsman DJ, Le Couteur DG, Creasey H, et al. Loss of muscle strength, mass (sarcopenia), and quality (specific force) and its relationship with functional limitation and physical disability: the Concord Health and Ageing in Men Project. J Am Geriatr Soc. 2010 Nov;58(11):2055–62.
4.     Lauretani F, Russo CR, Bandinelli S, Bartali B, Cavazzini C, Di Iorio A, et al. Age-associated changes in skeletal muscles and their effect on mobility: an operational diagnosis of sarcopenia. J Appl Physiol. 2003 Nov;95(5):1851–60.
5.     Manini TM, Clark BC. Dynapenia and aging: an update. J Gerontol A Biol Sci Med Sci. 2012 Jan;67(1):28–40.
6.     Clark BC, Manini TM. Functional consequences of sarcopenia and dynapenia in the elderly. Curr Opin Clin Nutr Metab Care. NIH Public Access; 2010 May;13(3):271–6.
7.     Newman AB, Kupelian V, Visser M, Simonsick EM, Goodpaster BH, Kritchevsky SB, et al. Strength, but not muscle mass, is associated with mortality in the health, aging and body composition study cohort. J Gerontol A Biol Sci Med Sci. 2006 Jan;61(1):72–7.
8.     Bohannon RW. Hand-grip dynamometry predicts future outcomes in aging adults. J Geriatr Phys Ther. 2008 Jan;31(1):3–10.
9.     Clark BC, Manini TM. Sarcopenia ≠ dynapenia. J Gerontol A Biol Sci Med Sci. 2008 Aug;63(8):829–34.
10.     Neves T. Comparação entre sarcopenia e dinapenia quanto ao desempenho funcional, aptidão cardiorrespiratória e dependência física. Universidade Federal de Mato Grosso; 2014.
11.     Lipschitz DA. Screening for nutritional status in the elderly. Prim Care. 1994;21(1):55.
12.     Simão A, Precoma D, Andrade J, Correa Filho H, Saraiva J, Oliveira G, et al. I Diretriz Brasileira de Prevenção Cardiovascular. Arq Bras Cardiol. 2013;101(6):1–63.
13.     Vellas B, Guigoz Y, Garry PJ, Nourhashemi F, Bennahum D, Lauque S, et al. The Mini Nutritional Assessment (MNA) and its use in grading the nutritional state of elderly patients. Nutrition. Elsevier; 1999;15(2):116–22.
14.     Lee RC, Wang Z, Heo M, Ross R, Janssen I, Heymsfield SB. Total-body skeletal muscle mass: development and cross-validation of anthropometric prediction models. Am J Clin Nutr. Am Soc Nutrition; 2000;72(3):796–803.
15.     Rech CR, Dellagrana RA, Marucci M de FN, Petroski EL. Validade de equações antropométricas para estimar a massa muscular em idosos. Rev Bras Cineantropometria e Desempenho Hum. 2012 Jan 2;14(1):23–31.
16.     Baumgartner RN, Koehler KM, Gallagher D, Romero L, Heymsfield SB, Ross RR, et al. Epidemiology of sarcopenia among the elderly in New Mexico. Am J Epidemiol. 1998 Apr 15;147(8):755–63.
17.     Janssen I, Heymsfield SB, Ross R. Low relative skeletal muscle mass (sarcopenia) in older persons is associated with functional impairment and physical disability. J Am Geriatr Soc. Wiley Online Library; 2002;50(5):889–96.
18.     Guralnik JM, Simonsick EM, Ferrucci L, Glynn RJ, Berkman LF, Blazer DG, et al. A Short Physical Performance Battery Assessing Lower Extremity Function: Association With Self-Reported Disability and Prediction of Mortality and Nursing Home Admission. J Gerontol. Oxford University Press; 1994 Mar 1;49(2):M85–94.
19.     Guralnik JM, Ferrucci L, Pieper CF, Leveille SG, Markides KS, Ostir G V, et al. Lower Extremity Function and Subsequent Disability: Consistency Across Studies, Predictive Models, and Value of Gait Speed Alone Compared With the Short Physical Performance Battery. Journals Gerontol Ser A Biol Sci Med Sci. Oxford University Press; 2000 Apr 1;55(4):M221–31.
20.     Katz S. Studies of Illness in the Aged. JAMA. 1963 Sep 21;185(12):914.
21.     Lawton MP, Brody EM. Assessment of older people: self-maintaining and instrumental activities of daily living. Gerontologist. 1969;9(3):179–86.
22.     Taylor HL, Jacobs DR, Schucker B, Knudsen J, Leon AS, Debacker G. A questionnaire for the assessment of leisure time physical activities. J Chronic Dis. 1978 Jan;31(12):741–55.
23.     Lustosa LP, Pereira DS, Dias RC, Britto R, Parentoni A, Pereira L. Tradução e adaptação transcultural do Minnesota Leisure Time Activities Questionnaire em idosos. Geriatr Gerontol. 2011;5(2):57–65.
24.     Nelson ME, Rejeski WJ, Blair SN, Duncan PW, Judge JO, King AC, et al. Physical activity and public health in older adults: recommendation from the American College of Sports Medicine and the American Heart Association. Circulation. 2007 Aug 28;116(9):1094–105.
25.     Yesavage JA, Sheikh JI. 9/Geriatric Depression Scale (GDS). Clin Gerontol. Taylor & Francis; 1986 Nov 18;5(1–2):165–73.
26.     Tanimoto Y, Watanabe M, Sun W, Tanimoto K, Shishikura K, Sugiura Y, et al. Association of sarcopenia with functional decline in community-dwelling elderly subjects in Japan. Geriatr Gerontol Int. 2013 Oct;13(4):958–63.
27.     Patel HP, Syddall HE, Jameson K, Robinson S, Denison H, Roberts HC, et al. Prevalence of sarcopenia in community-dwelling older people in the UK using the European Working Group on Sarcopenia in Older People (EWGSOP) definition: findings from the Hertfordshire Cohort Study (HCS). Age Ageing. 2013 May;42(3):378–84.
28.     Patil R, Uusi-Rasi K, Pasanen M, Kannus P, Karinkanta S, Sievänen H. Sarcopenia and osteopenia among 70-80-year-old home-dwelling Finnish women: prevalence and association with functional performance. Osteoporos Int. 2013 Mar;24(3):787–96.
29.     Volpato S, Bianchi L, Cherubini A, Landi F, Maggio M, Savino E, et al. Prevalence and clinical correlates of sarcopenia in community-dwelling older people: application of the EWGSOP definition and diagnostic algorithm. J Gerontol A Biol Sci Med Sci. 2014 Apr;69(4):438–46.
30.     Rantanen T, Guralnik JM, Foley D, Masaki K, Leveille S, Curb JD, et al. Midlife hand grip strength as a predictor of old age disability. JAMA J Am Med Assoc. Am Med Assoc; 1999;281(6):558–60.
31.     Al Snih S, Markides KS, Ottenbacher KJ, Raji MA. Hand grip strength and incident ADL disability in elderly Mexican Americans over a seven-year period. Aging Clin Exp Res. Springer; 2004 Oct 10;16(6):481–6.
32.     Yang M, Ding X, Luo L, Hao Q, Dong B. Disability associated with obesity, dynapenia and dynapenic-obesity in Chinese older adults. J Am Med Dir Assoc. Elsevier; 2014 Feb;15(2):150.e11-6.
33.     da Silva Alexandre T, de Oliveira Duarte YA, Ferreira Santos JL, Wong R, Lebrão ML. Sarcopenia According to the European Working Group on Sarcopenia in Older People (EWGSOP) Versus Dynapenia as a Risk Factor for Disability in the Elderly. J Nutr Health Aging. 2014 Jan 14;18(5):547–53.
34.     Delmonico MJ, Harris TB, Lee J-S, Visser M, Nevitt M, Kritchevsky SB, et al. Alternative definitions of sarcopenia, lower extremity performance, and functional impairment with aging in older men and women. J Am Geriatr Soc. 2007 May;55(5):769–74.
35.     Newman AB, Kupelian V, Visser M, Simonsick E, Goodpaster B, Nevitt M, et al. Sarcopenia: alternative definitions and associations with lower extremity function. J Am Geriatr Soc. Wiley Online Library; 2003;51(11):1602–9.
36.     Melton 3rd LJ, Khosla S, Crowson CS, O’Connor MK, O’Fallon WM, Riggs BL. Epidemiology of sarcopenia. J Am Geriatr Soc. 2000;48(6):625.
37.     Janssen I. Skeletal Muscle Cutpoints Associated with Elevated Physical Disability Risk in Older Men and Women. Am J Epidemiol. 2004 Feb 15;159(4):413–21.
38.     Janssen I. Influence of sarcopenia on the development of physical disability: the Cardiovascular Health Study. J Am Geriatr Soc. Wiley Online Library; 2006;54(1):56–62.
39.     Iwamura M, Kanauchi M. A cross-sectional study of the association between dynapenia and higher-level functional capacity in daily living in community-dwelling older adults in Japan. BMC Geriatr [Internet]. BMC Geriatrics; 2017;17(1):1–6. Available from: http://dx.doi.org/10.1186/s12877-016-0400-5
40.     Rolland Y, Lauwers-Cances V, Cournot M, Nourhashémi F, Reynish W, Rivière D, et al. Sarcopenia, calf circumference, and physical function of elderly women: a cross-sectional study. J Am Geriatr Soc. 2003 Aug;51(8):1120–4.
41.     Pahor M, Blair SN, Espeland M, Fielding R, Gill TM, Guralnik JM, et al. Effects of a physical activity intervention on measures of physical performance: Results of the lifestyle interventions and independence for Elders Pilot (LIFE-P) study. J Gerontol A Biol Sci Med Sci. 2006 Nov;61(11):1157–65.
42.     Vandervoort AA. Aging of the human neuromuscular system. Muscle Nerve. Wiley Online Library; 2002;25(1):17–25.
43.     Alexandre T da S, Duarte YA de O, Santos JLF, Wong R, Lebrão ML. Prevalence and associated factors of sarcopenia among elderly in Brazil: findings from the SABE study. J Nutr Health Aging. Springer; 2014 Mar 13;18(3):284–90.

DEFINING SARCOPENIA USING MUSCLE QUALITY INDEX


C.-D. Lee, E. Dierickx


School of Nutrition and Health Promotion, Arizona State University, Phoenix, AZ;

Corresponding Author: Dr. Chong Lee, Arizona State University, School of Nutrition and Health Promotion, 500 North 3rd street, Phoenix, AZ 85004, Phone: 602-827-2282, Fax: 602-496-1873, Email: chong.lee@asu.edu

J Aging Res Clin Practice 2018;7:45-59
Published online March 29, 2018, http://dx.doi.org/10.14283/jarcp.2018.11


Abstract

Objectives: Although low muscle quality is a strong predictor of sarcopenia, defining sarcopenia using muscle quality remains unknown.  This study investigated the cut-points to define sarcopenia using muscle quality index (MQI) in the young reference population. Methods: Fifty healthy young (20 to 29 years) and forty elderly adults (60 to 79 years) were recruited in this study.  Dual-energy X-ray absorptiometry was used to assess appendicular skeletal muscle mass.  Hand grip and leg dynamometers were used to measure muscle strengths in the arm and leg.  Muscle quality in the arm (MQIArm, kg/kg) and leg (MQILeg, Nm/kg) were computed as muscle strength per lean mass in the arm and leg, respectively.  Total muscle quality (MQITotal) was computed as the combination of MQIArm and MQILeg, while standardized muscle quality (MQIStd) was computed as the combination of z-scores in MQIArm and MQILeg.  Sarcopenia was defined as ≤2 SD below from the mean values in the young reference group.  Results: The cut-points for defining sarcopenia using MQIArm, MQILeg, MQITotal, and MQIStd in men were ≤8.37, ≤12.07, 22.06, and <-3.35, and in women were ≤10.09, ≤13.97, 28.22, and <-2.25, respectively.  In the elderly adults, the frequencies of sarcopenia using MQIArm, MQILeg, MQITotal, and MQIStd were 15%, 27.5%, 32.5%, and 35%, respectively. Conclusion: This study establishes new values for defining sarcopenia using MQIs.  The proposed new MQI cut-points may be a role in detecting sarcopenia across individual and population level.

Key words: sarcopenia, muscle quality index, muscle mass, muscle strength.


Introduction

Age-related skeletal muscle loss (sarcopenia) is a significant risk factor for falls (1), disability (2), and mortality (3) in the elderly men and women. With increasing life expectancy, sarcopenia is a major public health concern in the geriatric societies (4).  Approximately 7 to 27.8% of the United States (US) men and 10 to 19.3% of US women, aged ≥ 60 years, suffer from sarcopenia (5-6), with increasing prevalence of sarcopenia in persons over 80 years of age (50%) (7) and in some cancer patients (68.9%) (8).  Estimated medical costs associated with sarcopenia in the US is about 18 billion a year (5).  Since effective clinical treatments for sarcopenia in the elderly populations are limited, preserving muscle mass and muscle strength at younger and middle ages is imperative to avoid the burden of this disease.
Skeletal muscle mass decreases about 40% between the ages of 20 and 80 years (9) with an annual decreasing rate of 1 to 2% after 50 years of age (10).  Notably, persons with skeletal muscle loss and excess fat are at greater risk of physical disability and mortality (11).  Although the primary causes of sarcopenia still remain unknown, early detection and subsequent treatment of sarcopenia is a key to prevent sarcopenia-related disability and mortality.
To address sarcopenia prevention strategies, establishing an accurate definition of sarcopenia should be in the first place.  Baumgartner et al. first proposed cut-points to define sarcopenia using low muscle mass (12).  Several investigators have shown that low muscle mass is associated with disability (2,12) and mortality (13).  Other investigators have also shown that low muscle strength, not low muscle mass, is associated with disability (14) and mortality (15).  Currently, sarcopenia has been defined as the combination of low muscle mass and weakness or slowness (16-20).  However, the definition of sarcopenia still remains in dispute worldwide. The European Working Group on Sarcopenia in Older People (EWGSOP) (16) and the Asian Working Group for Sarcopenia (AWGS) consensus panels have defined sarcopenia using the combination of low muscle mass and low muscle function (17).  The International Working Group on Sarcopenia (IWGS) (18) and the Society of Sarcopenia, Cachexia and Wasting Disorders (SCWD) (19) have defined sarcopenia using the combination of low muscle mass and low physical performance. The Foundation for the National Institutes of Health (FNIH) (20) defined sarcopenia using the combination of low muscle mass and low muscle strength. These inconsistent guidelines may lead to confusion to the public and clinical settings as a screening tool to determine sarcopenia patients.
From the methodological perspectives, the definition of sarcopenia should represent muscle quality, muscle strength per unit of muscle mass, rather than muscle mass or muscle strength. Some investigators have shown that intermuscular fat increases by 35.5-74.6% in men and 16.8-50% in women with aging (21), and an increase in fat mass is positively associated with muscle mass and muscle strength (22).  Thus, the greater muscle strength or muscle mass associated with increment in fat may lack muscle quality.  Although few studies have shown that muscle quality is a better indicator of functional capacity as compared with muscle mass or muscle strength (23), there is no standardized method to define sarcopenia using muscle quality.  To fill this gap, we investigated the cut-points to define sarcopenia using the muscle quality indexes (MQIs) in the young reference adults.


Methods

Study Participants

Fifty young male and female adults (ages 20-29 years; m = 30, f = 20) and forty elderly male and female adults (ages 60 to 79 years; m = 16; f = 24) were recruited for the present study.  The study was advertised by fliers, online posts, and University announcements within the Downtown Phoenix area.  For the healthy young reference group, inclusion criteria were aged 20 to 29 years, body mass index (BMI) <30 kg/m2 (weight in kilograms divided by height in meters squared), ability to perform physical activity assessed by online physical activity readiness questionnaire (PAR-Q), no pregnant, no personal history of chronic diseases, and not taking any hypoglycemic and hypertensive medications. For the elderly persons, inclusion criteria were aged 60 or more, ability to perform physical activity assessed by online PAR-Q, with no personal history of heart disease, stroke, or cancer.  Written informed consent was obtained from all subjects prior to study participation. The study was approved by the Institutional Review Board at Arizona State University.  All participants were given a detailed description of the protocol prior to their participation.

Measurement Procedure

Body height and weight were measured using a standardized physician’s scale. Dual-energy X-ray absorptiometry (DXA) was used to assess body composition, and arm and leg skeletal muscle mass by a licensed technician (Lunar iDXA, GE Healthcare, Madison, WI). Appendicular skeletal muscle mass (SMS) was computed by combining lean tissues in both arms and legs, and relative muscle mass was computed as SMS divided by height in meters squared (AMS) or SMS divided by body mass index (AMSBMI).
The grip strength was measured using Takei Physical Fitness Test dynamometer (kg).  The dominant hand was used with the subject standing and their arm at a position parallel to the floor. Grip strength was measured twice, and the average of two test scores was used for analysis. The leg strength was measured by isometric knee extension test (1 set of 3 repetitions) at an angle of 60 degrees using the CSMI Humac Norm Dynamometer test (Nm). An average of the highest two performance scores was used for analysis.
Muscle quality in the arm (MQIArm, kg/kg) was calculated as the grip strength (STRArm, kg), right arm, divided by the lean mass in the right arm (LMArm, kg).  Muscle quality in the leg (MQILeg, Nm/kg) was calculated as the isometric leg strength (STRLeg, Nm), right leg, divided by lean mass in the right leg (LMLeg, kg). Total muscle quality (MQITotal) was computed as the combination of MQIArm and MQILeg. Standardized MQI (MQIStd) was computed as the combination of z-scores in both MQIArm and MQILeg.  In the elderly persons, MQIStd was computed by the combination of z-scores in both MQIArm and MQILeg, using the sex-specific means and SDs from the healthy young reference group.

Statistical Analysis

General linear models were used to investigate mean differences for anthropometric, clinical measures, relative muscle mass and muscle quality indexes between men and women after adjustment for age and race. The normality assumptions for all outcome measures were justified by Shapiro-Wilk test or Kolmogorov-Smirnov test.  Sex-specific cut-points for ASM, ASMBMI, MQIArm, MQILeg, MQITotal, and MQIStd were computed as >1 SD, 1 SD≥ to >2 SD, and ≤2 SD below from the mean values in the young reference group. Sarcopenia was defined as ≤2 SD below from the mean values in the young reference group. We also examined the sex- and race-adjusted partial Pearson correlations among of muscle mass, muscle strength, and muscle quality in both young and elderly adults, respectively.  All statistical procedures were performed by Statistical Analysis Systems (SAS 9.4) software (SAS Institute, Cary, NC).


Results

In the young reference group, as shown in Table 1, men had greater BMI, SBP, grip strength, STRLeg, LMArm, and LMLeg than did women after adjustment for age and race (all p<0.001). There were no statistical gender differences in DBP, MQILeg, MQITotal, and MQIStd (all p>0.10), while women had greater MQIArm than did men (p<0.001). In the elderly persons, men had greater grip strength, LMArm, STRLeg, LMLeg, MQIStd than did women (all p<0.02). There were no statistical gender differences in BMI, SBP, DBP, MQIArm, MQILeg, and MQITotal (all p>0.35).

Table 1 Characteristics of the study participants in young and elderly adults

Table 1
Characteristics of the study participants in young and elderly adults

*Values are means. †Adjusted for age and race. LMArm, a lean mass in the arm; LMLeg, a lean mass in the leg; STRLeg, leg strength; MQIArm, muscle quality in the arm; MQILeg, muscle quality in the leg; MQITotal, a combination of MQIArm and MQILeg; MQIStd, a standardized MQI.


The sex-specific relative muscle mass (ASM and ASMBMI) and MQI (MQIArm, MQILeg, MQITotal, and MQIStd) cut-points are shown in Table 2.  The ASM, ASMBMI, and MQI cut-points were classified as normal, low, and poor categories, corresponding to >1 SD, 1 SD≥ to >2 SD and ≤2 SD below from the sex-specific mean values in the young reference group.  “Poor” categories were classified as sarcopenia.  The cut-points for sarcopenia using ASM and ASMBMI in men were ≤7.75 kg/m2 and ≤0.96, and in women were ≤5.69 kg/m2 and ≤0.71, respectively.  The cut-points for sarcopenia using MQIArm, MQILeg, MQITotal, and MQIStd in men were ≤8.37, ≤12.07, 22.06, and <-3.35, and in women were ≤10.09, ≤13.97, 28.22, and <-2.25, respectively.

Table 2 Cut-points to define sarcopenia using relative muscle mass and muscle quality indexes in young men and women

Table 2
Cut-points to define sarcopenia using relative muscle mass and muscle quality indexes in young men and women

*Normal, low, and poor indicates >1 SD, 1 SD≥ to >2 SD, and ≤2 SD below from the sex-specific mean values in the reference group. ASM, appendicular skeletal muscle mass; ASMBMI, ASM divided by height in meters squared; MQIArm, muscle quality in the arm; MQILeg, muscle quality in the leg; MQITotal, total muscle quality; MQIStd, standardized muscle quality


In the elderly adults, the frequencies of sarcopenia using MQIArm, MQILeg, MQITotal, and MQIStd were 15% (n = 6), 27.5% (n = 11), 32.5% (n = 13), and 35% (n = 14), respectively.  The sex- and race-adjusted partial Pearson correlations among muscle mass, muscle strength, and muscle quality are shown in Table 3.  There was no association between muscle mass and muscle strength in both young (r = 0.19, p = 0.20) and elderly adults (r = 0.05, p = 0.75), but muscle mass was inversely associated with muscle quality in young (r = -0.48, p<0.001) and elderly adults (r = -0.73, p<0.001).  There was a moderate association between muscle strength and muscle quality in young (r = 0.62, p<0.001) and elderly persons (r = 0.46, p<0.001).

Table 3 Sex- and race-adjusted Pearson partial correlations among muscle mass, muscle strength, and muscle quality in young and elderly adults

Table 3
Sex- and race-adjusted Pearson partial correlations among muscle mass, muscle strength, and muscle quality in young and elderly adults

Muscle mass, a combined relative muscle mass in both arm and leg; Muscle strength, a combined z-scores of muscle strength in both arm and leg; Muscle quality, a combined z-scores of muscle quality in both arm and leg. *p<0.001


Discussion

Although the rising trend in the prevalence of sarcopenia and disabilities is a major public health concern in the US (5-6), the accurate definition of sarcopenia still remains in controversial.  To our knowledge, we first define sarcopenia using MQI cut-points (MQIArm, MQILeg, MQITotal, and MQIStd) based on young reference group.  Several investigators have proposed muscle quality index or muscle power index using the ratio of muscle strength to muscle mass or the ratio of muscle power to muscle mass (24-25).  Barbat-Artigas et al. (24) proposed MQI cut-points using the ratio of grip strength to total skeletal muscle mass (kg/SMkg) based on young reference population.  Using this ratio, they classified “poor” MQI cut-points in men and women as ≤1.36 and ≤1.35 kg/SMkg.  The Concord Health and Ageing in Men Project (CHAMP) proposed lower and upper extremity muscle quality scores based on the lowest 20% of the distribution in men aged 70 to 90 years (25).  Other investigators have also proposed muscle power index using the ratio of muscle power (W) to total skeletal muscle mass (SMkg) (24) or the ratio of muscle power to time (26).  However, the feasibility of these indices in clinical settings as a screening tool to detect sarcopenia has not been well documented.
Muscle mass, muscle strength, and muscle quality are associated with physical function and disability, all of these are important factors to define sarcopenia (12, 14, 23, 24-25).  The muscle quality represents muscle’s ability to function, which is the best marker of functional capacity when compared with muscle mass or muscle strength (23).  The CHAMP study also showed that muscle quality or muscle strength, not muscle mass, was a strong predictor of physical function and disability (25).  Several International Working Groups have defined sarcopenia using the combination of low muscle mass and weakness or slowness (16-20).  Defining sarcopenia using muscle mass and muscle weakness may have some limitations without considering myosteatosis (intermuscular and intramuscular adipose tissue).  For instance, muscle mass or muscle strength with myosteatosis is not a good indicator of functional capacity because aging is positively associated with an increase in fatty infiltration of muscle tissue (27-28).  Some investigators have also shown that elderly men had about 59-127% more fat in quadriceps and hamstrings than did young men (27), with an annual increase of intramuscular fat by 18% (28).  Interestingly, an increase in fat mass is positively associated with muscle mass and muscle strength but is negatively associated with muscle quality (22).  In fact, a greater muscle mass or muscle strength with excess fat may lack muscle quality, which may misclassify sarcopenic patients to nonsarcopenic patients. Increasing muscle strength per unit of muscle mass, not by accumulating fat mass, is associated with muscle quality. Our findings also show that muscle mass is inversely associated with muscle quality in young and elderly persons, which is consistent with the findings from the US general population and the French women study (29-30).  The muscle quality is a strong surrogate marker for sarcopenia because it quantifies the function of muscle mass and muscle strength as a single unit.  Further studies are needed to determine whether muscle quality is a better marker for physical disability and mortality as compared with the combination of low muscle mass and low muscle function, which defined sarcopenia by International Working Groups (16-20).  Also, more studies are needed to justify the optimal cut-points for MQIs, muscle strength, and muscle mass in relation to disability and mortality.
A strength of this study is that the MQIs are based on young healthy reference group.  Our cut-points to define sarcopenia using ASM in men were slightly higher (0.5 kg/m2) than those cut-points by Baumgartner et al. (12), but our women’s cut-points were similar with the EWGSOP (16).  In the ASMBMI cut-points, we observed that our ASMBMI cut-points were greater than the FNIH cut-points in both men and women, which may be due to methodological differences defining sarcopenia.  For instance, the FNIH cut-points to define sarcopenia for ASMBMI were based on the elderly people (aged 70-90 years) using the mean values of the lowest 20% distribution, whereas our cut-points to define sarcopenia were based on young reference group (aged 20-29 years) using <2 SD from the mean values.  Another strength of our study is that we used DXA, a criterion method, to estimate lean mass in both arms and legs. A limitation of our study is that our findings may limit generalizability due to small sample size.  Further studies are needed to define MQI cut-points with a large sample size across different race and gender groups.
In summary, muscle quality is a significant risk factor for disability and mortality.  Based on healthy young reference men and women, we establish a new definition of sarcopenia using muscle quality indexes.  At the very least, our muscle quality indices may still be a role as a screening tool in detecting sarcopenia across individual and population level.


Acknowledgements: This study was supported by Mayo-Arizona State University Obesity Solution Grant.  The authors thank the graduate students from the ASU and study participants for their important contributions.

Conflict of Interest: None

Ethical standard: This study was performed in accordance with the ethical standards by the Arizona State University review board and with the 1964 Helsinki declaration and its later amendments or comparable ethical standards.


References

1.    Landi F, Liperoti R, Russo A, et al. Sarcopenia as a risk factor for falls in elderly individuals: results from the ilSIRENTE study.  Clin Nutr 2012;5:652-8.
2.    Visser M, Goodpaster BH, Kritchevsky SB, et al. Muscle mass, muscle strength, and muscle fat infiltration as predictors of incident mobility limitations in well-functioning older persons.  J Gerontol A Biol Sci Med Sci 2005;60:324-33.
3.    Hirani V, Blyth F, Naganathan V, et al. Sarcopenia is associated with incident disability, institutionalization, and mortality in community-dwelling older men: The Concord Health and Ageing in Men Project.  J Am Med Dir Assoc 2015;16:607-613.
4.    Shafiee G, Keshtkar A, Soltani A, Ahadi Z, Larijani B, Heshmat R. Prevalence of sarcopenia in the world: a systematic review and meta-analysis of general population studies. J Diabetes Metab Disord 2017;16:21
5.    Janssen I, Heymsfield SB, Ross R. Low relative skeletal muscle mass (sarcopenia) in older persons is associated with functional impairment and physical disability. J Am Geriatr Soc 2002;50:889-96.
6.    Batsis JA, Mackenzie TA, Lopez-Jimenez F, Bartels SJ. Sarcopenia, sarcopenic obesity, and functional impairments in older adults: National Health and Nutrition Examination Surveys 1999-2004. Nutr Res 2015;35:1031-9.
7.    Morley JE, Anker SD, von Haehling S. Prevalence, incidence, and clinical impact of sarcopenia: facts, numbers, and epidemiology-update 2014. J Cachexia Sarcopenia Muscle 2014;5:253-9.
8.    Psutka SP, Carrasco A, Schmit GD, et al. Sarcopenia in patients with bladder cancer undergoing radical cystectomy: impact on cancer-specific and all-cause mortality. Cancer 2014;120:2910-8.
9.    Lexell J, Taylor CC, Sjöström M. What is the cause of the ageing atrophy? Total number, size and proportion of different fiber types studied in whole vastus lateralis muscle from 15- to 83-year-old men. J Neurol Sci 1988;84:275-94.
10.    Doherty TJ. The influence of aging and sex on skeletal muscle mass and strength. Curr Opin Clin Nutr Metab Care 2001;4:503-8.
11.    Batsis JA, Mackenzie TA, Barre LK, Lopez-Jimenez F, Bartels SJ. Sarcopenia, sarcopenic obesity and mortality in older adults: results from the National Health and Nutrition Examination Survey III. Eur J Clin Nutr 2014;68:1001-7.
12.    Baumgartner RN, Koehler KM, Gallagher D, et al: Epidemiology of sarcopenia among the elderly in New Mexico. Am J Epidemiol 1998;147:755-63
13.    Srikanthan P, Karlamangla AS. Muscle mass index as a predictor of longevity in older adults. Am J Med 2014;127:547-53.
14.    Visser M, Newman AB, Nevitt MC, Kritchevsky SB, Stamm EB, Goodpaster BH, Harris TB. Reexamining the sarcopenia hypothesis. Muscle mass versus muscle strength. Health, Aging, and Body Composition Study Research Group. Ann N Y Acad Sci 2000;904:456-61.
15.    Newman AB, Kupelian V, Visser M, et al. Strength, but not muscle mass, is associated with mortality in the health, aging and body composition study cohort. J Gerontol A Biol Sci Med Sci 2006;61:72-7.
16.    Cruz-Jentoft AJ, Baeyens JP, Bauer JM, et al. Sarcopenia: European consensus on definition and diagnosis: Report of the European Working Group on Sarcopenia in Older People.  Age Ageing. 2010 Jul;39(4):412-23.
17.    Chen LK, Liu LK, Woo J, et al. Sarcopenia in Asia: consensus report of the Asian Working Group for Sarcopenia.  J Am Med Dir Assoc 2014;15:95-101.
18.    Fielding RA, Vellas B, Evans WJ, et al. Sarcopenia: an undiagnosed condition in older adults. Current consensus definition: prevalence, etiology, and consequences. International working group on sarcopenia.  J Am Med Dir Assoc 2011;12:249-56.
19.    Morley JE, Abbatecola AM, Argiles JM, et al. Sarcopenia with limited mobility: an international consensus.  J Am Med Dir Assoc 2011;12:403-9.
20.    Studenski SA, Peters KW, Alley DE, et al. The FNIH sarcopenia project: rationale, study description, conference recommendations, and final estimates.  J Gerontol A Biol Sci Med Sci 2014;69:547-58.
21.    Miljkovic I, Zmuda JM. Epidemiology of myosteatosis.  Curr Opin Clin Nutr Metab Care 2010;13:260-4.
22.    Koster A, Ding J, Stenholm S, et al. Does the amount of fat mass predict age-related loss of lean mass, muscle strength, and muscle quality in older adults? J Gerontol A Biol Sci Med Sci 2011;66:888-95.
23.    Misic MM, Rosengren KS, Woods JA, Evans EM. Muscle quality, aerobic fitness and fat mass predict lower-extremity physical function in community-dwelling older adults. Gerontology 2007;53:260-6.
24.    Barbat-Artigas S, Rolland Y, Zamboni M, Aubertin-Leheudre M. How to assess functional status: a new muscle quality index. J Nutr Health Aging 2012;16:67-77.
25.    Hairi NN, Cumming RG, Naganathan V, et al. Loss of muscle strength, mass (sarcopenia), and quality (specific force) and its relationship with functional limitation and physical disability: the Concord Health and Ageing in Men Project. J Am Geriatr Soc 2010;58:2055-62.
26.    Takai Y, Ohta M, Akagi R, Kanehisa H, Kawakami Y, Fukunaga T. Sit-to-stand test to evaluate knee extensor muscle size and strength in the elderly: a novel approach.  J Physiol Anthropol 2009;28:123-8.
27.    Overend TJ, Cunningham DA, Paterson DH, Lefcoe MS. Thigh composition in young and elderly men determined by computed tomography. Clin Physiol 1992;12:629-40.
28.    Goodpaster BH, Chomentowski P, Ward BK, et al. Effects of physical activity on strength and skeletal muscle fat infiltration in older adults: a randomized controlled trial. J Appl Physiol 2008;105:1498-503.
29.    Bouchard DR, Héroux M, Janssen I. Association between muscle mass, leg strength, and fat mass with physical function in older adults: influence of age and sex. J Aging Health 2011;23:313-28.
30.    Barbat-Artigas S, Rolland Y, Vellas B, Aubertin-Leheudre M. Muscle quantity is not synonymous with muscle quality. J Am Med Dir Assoc 2013;14:852.e1-7.

GHRELIN ACTIVATION BY INGESTION OF MEDIUM-CHAIN TRIGLYCERIDES IN HEALTHY ADULTS: A PILOT TRIAL


Y. Yoshimura1, S. Shimazu2, A. Shiraishi3, F. Nagano4, S. Tominaga5, T. Hamada4, M. Kudo2, Y. Yamasaki4, S. Noda6, T. Bise4


1. Department of Rehabilitation Medicine, Kumamoto Rehabilitation Hospital, Kumamoto, Japan; 2. Department of Nutritional Management, Kumamoto Rehabilitation Hospital, Kumamoto, Japan; 3. Department of Dental Office, Kumamoto Rehabilitation Hospital, Kumamoto, Japan; 4. Department of Rehabilitation, Kumamoto Rehabilitation Hospital, Kumamoto, Japan; 5. Department of Clinical Laboratory, Kumamoto Rehabilitation Hospital, Kumamoto, Japan; 6. Department of Nursing, Kumamoto Rehabilitation Hospital, Kumamoto, Japan

Corresponding Author: Yoshihiro Yoshimura, Department of Rehabilitation Medicine, Kumamoto Rehabilitation Hospital, 760 Magate, Kikuyo-Town, Kikuchi-County, Kumamoto, 869-1106, Japan; E-mail: hanley.belfus@gmail.com; Tel: +81-96-232-3111; Fax: +81-96-232-3119

J Aging Res Clin Practice 2018;7:42-46
Published online March 22, 2018, http://dx.doi.org/10.14283/jarcp.2018.9


Abstract

Objective: To investigate the efficacy of dietary supplementation of medium-chain triglycerides (MCTs) and its effects on ghrelin activation in healthy adults. Methods: The present study examined two protocols with six healthy volunteers: 1) 12-hour profiles of the plasma levels of acylated and desacyl ghrelin without MCT ingestion, and 2) changes in serum ghrelin levels after oral ingestion of 45 g/day of MCTs for 1 week. Results: At baseline, serum acylated and desacyl ghrelin levels were 18.2±10.3 and 77.1±23.4 fmol/mL, respectively. The ratio of acylated/desacyl ghrelin was 19%. There were no significant differences in the 12-hour profiles of acylated and desacyl ghrelin. Significant increases were observed in all sampling times of serum acylated ghrelin after 1-week MCTs ingestion. The ratio of acylated/desacyl ghrelin increased to 37.7%. Conclusions: Oral ingestion of MCTs increased serum acylated ghrelin levels in healthy adults, suggesting that MCTs administration stimulates food intake.

Key words: Ghrelin, acylation, medium-chain triglycerides (MCT), sarcopenia, cachexia.


Introduction

“Anorexia of aging” is defined as loss of appetite and reduced food intake in old age, and may be associated with decline in skeletal muscle mass, energy expenditure, and physical activity that occur in later years (1, 2). Decreased skeletal muscle mass is related to malnutrition, length of hospital stay, morbidity, and mortality (3, 4); malnutrition is frequent in populations with high morbidity and burden of care. Appetite loss is the major cause of malnutrition in older adults and sometimes difficult to control under established nutritional management settings, especially in clinical settings.
Ghrelin is a novel growth hormone (GH)-releasing peptide widely distributed throughout the gastric mucosa and is made up of 28 amino acids; it was first described in 1999 (5). Ghrelin exhibits orexigenic effects and complex metabolic activities through the GH-independent mechanism, leading to the augmentation of skeletal muscle mass and suppression of energy expenditure and inflammation (6, 7). Therefore, there is growing interest regarding the identification of ghrelin as a potentially valid and well-tolerated anabolic and anti-catabolic treatment for sarcopenia, cachexia, and other wasting disorders.
Ghrelin mainly exist in two forms: active (acylated ghrelin) and inactive (desacyl ghrelin). The third amino acid residue of ghrelin, serine, is modified by octanoic acids, C8:0 medium-chain triglycerides (MCTs); acylation is essential for the biological activity of ghrelin. While desacyl ghrelin is suggested to have limited effects on GH-receptor under physiological conditions (8, 9), acylated ghrelin corresponds to approximately 20% of the total circulating ghrelin, and is responsible for the biological effects of ghrelin (10), indicating that acylation is a vital step for the biological activity of ghrelin.
Therefore, it is hypothesized that ghrelin is acylated via ingestion of MCTs, and this could be a promising treatment option for malnutrition in older adults; however, evidence regarding its efficacy is very limited. In the current study, we investigate the efficacy of dietary supplementation of MCTs and its effects on ghrelin activation in healthy adults.


Materials and Methods

Participants

The current study was approved by the Institutional Research Ethics Committee of Kumamoto Rehabilitation Hospital (Kumamoto, Japan), and was performed in accordance with the ethical standards established in the 1964 Declaration of Helsinki and later amendments. All participants provided written informed consent in advance. We recruited six healthy volunteers who were working at the hospital in 2017, comprising 3 women and 3 men with mean age of 38 ± 8 years and mean body mass index (BMI) of 22.0±1.3 kg/m2. At enrollment, the following criteria were applied: 1) normal body weight with BMI of 20–25 kg/m2. The following exclusion criteria were adopted: 1) presence of diseases requiring treatment physically or psychologically, including dyslipidemia and diabetes mellitus; 2) taking any supplements or drugs; and 3) presence of appetite alteration. The participants’ body composition were analyzed using bioelectrical impedance analysis (InBody S10; InBody, Tokyo, Japan).

Study protocol

The present study examined two protocols. First, 12-hour profiles of the serum levels of acylated and desacyl ghrelin without MCT ingestion were investigated. Second, changes in serum ghrelin levels after oral ingestion of 45 g/day of MCTs for 1 week were measured. Therefore, the study period of the current trial was designed to be 2 weeks [Fig. 1]. At baseline, the participants were evaluated and advised strictly on their daily lifestyle, including food intake, physical activity, and sleeping time, all of which were reported to potentially alter plasma ghrelin levels (11, 12). Each participant received a standardized meal protocol to control energy intake, set as daily energy intake of 30–35 kcal/kg (body weight), supervised by a registered dietitian throughout the study period. Physical activity level (working during daytime) and sleeping time (6–7 hours at night) were standardized and supervised by a medical doctor throughout the study period.
To examine whether ingestion of MCTs affects serum ghrelin activation, serum ghrelin levels were measured after participants orally ingested 45 g/day of MCTs for 1 week. Participants were instructed to take one tablespoon (15 ml) of MCT oil added to each meal (breakfast, lunch, and dinner) every day, which accounts for 45 g (45 ml) of MCT ingestion a day. The MCTs used in this study were 100% pure MCT oil (Nissin MCT Oil HC, The Nisshin OilliO Group, Ltd., Tokyo, Japan), and per 10 ml of the oil consisted of 8.9 kcal energy, 0 g protein, 10 g lipid, 0 g carbohydrate, and 10 g MCT.

Blood sampling and assay

Blood samples for the measurement of serum ghrelin were taken from the antecubital vein after 30 minutes of resting, and were drawn at 07:00, 10:00, 14:00, 17:00, and 19:00 hours to identify 12-hour profiles of serum ghrelin levels. Blood sampling was performed at baseline and after 1 week of MCT ingestion to measure the changes in serum ghrelin levels, complete blood counts and laboratory data. Serum acylated and desacyl ghrelin levels were measured by enzyme-linked immunosorbent assay (SRL, Inc., Tokyo, Japan).

Statistical analysis

All analyses were performed using SPSS version 21 for Windows. Results are presented as mean ± standard deviation (SD). Comparisons were performed using a paired t-test before and after 1 week of daily oral ingestion of MCTs and one-way repeated measures ANOVA for changes in ghrelin 12-hour profiles, after which a post-hoc analysis was performed for before and after comparisons of the effects of MCT ingestion. P values of <0.05 were considered statistically significant.


Figure 1 Study protocol. The present study examined two protocols. First, 24-hour profiles of the plasma levels of acylated and desacyl ghrelin without MCT ingestion were investigated. Second, changes in plasma ghrelin levels after oral ingestion of 45 g/day of MCTs for 1 week were measured. The study period of the current trial was designed to be 2 weeks. MCT: medium-chain triglyceride

Figure 1
Study protocol. The present study examined two protocols. First, 24-hour profiles of the plasma levels of acylated and desacyl ghrelin without MCT ingestion were investigated. Second, changes in plasma ghrelin levels after oral ingestion of 45 g/day of MCTs for 1 week were measured. The study period of the current trial was designed to be 2 weeks. MCT: medium-chain triglyceride


Results

Clinical characteristics

Table 1 presented the clinical characteristics of all the participants, showing that the study participants were neither lean nor obese, and that they were a homogenous group of healthy adults.

Table 1 Clinical characteristics of study participants and changes in parameters before and after 1-week MCT ingestion

Table 1
Clinical characteristics of study participants and changes in parameters before and after 1-week MCT ingestion

CRP, C-reactive protein; MCT, medium-chain triglycerides; WBC, white blood cell; *Description and analysis of ghrelin data were adopted each blood sample of 07:00 o’clock


Baseline plasma ghrelin level

At baseline, in the morning, serum acylated and desacyl ghrelin levels were 18.2±10.3 fmol/mL and 77.1±23.4 fmol/mL, respectively. The ratio of acylated ghrelin to desacyl ghrelin was 19%. There were no significant differences in the 12-hour profiles of acylated and desacyl ghrelin, although acylated ghrelin tended to increase before meals and decreased after meals, without statistical significance [Fig. 2].

Figure 2 12-hour profiles and changes of acylated ghrelin and desacyl ghrelin before and after 1-week ingestion of MCTs. MCT: medium-chain triglyceride. *, p<0.05; **, p<0.001 for ghrelin level before vs. after MCTs administration

Figure 2
12-hour profiles and changes of acylated ghrelin and desacyl ghrelin before and after 1-week ingestion of MCTs. MCT: medium-chain triglyceride. *, p<0.05; **, p


Effect of MCT ingestion on plasma ghrelin and serum data

Significant increases were observed in all sampling times of the 12-hour profiles of serum acylated ghrelin after 1-week oral administration of 45 g/day of MCTs [Fig. 2], while significant decreases were observed in 4 out of 5 sampling times for serum desacyl ghrelin. The ratio of acylated ghrelin to desacyl ghrelin increased to 37.7% in the morning after completion of 1 week of MCT ingestion. The increase in serum acylated ghrelin peaked early in the morning but not after meals. We observed that 1 week of MCT administration did not alter total cholesterol, triglyceride, or fasting glucose levels.

Adverse effects

There were no adverse effects reported throughout the study, including digestive symptoms, serum lipid profiles, and fasting glucose levels.


Discussion

Here we report the results of our study examining the effect of oral MCT ingestion on the acylation of serum ghrelin levels in healthy adults. We demonstrate that ghrelin was acylated after MCT ingestion and that the ratio of acylated/desacyl ghrelin level increased. This finding suggests that MCT consumption may trigger acylation (activation) of ghrelin, leading to increased appetite, positive energy balance, and improved nutritional status in malnourished older adults or those at the risk of malnutrition.
Some studies demonstrated that MCT was a good substrate for the conversion of ghrelin to active ghrelin under normal physiological conditions, without affecting total ghrelin concentrations (13-16); however, the samples examined in those studies were animals (e.g., mice, rats, lactating dairy cows, and chickens). For example, Lemarié et al. conducted a study using rats and reported no significant increase in acylated ghrelin levels, despite MCT administration; however, a significant increase was observed in the acylated/total ghrelin ratio (16).

Human studies regarding this subject are limited. There are only two studies available in the literature targeting patients with disease-related nutritional disorders, on the associations of MCT administration and serum acylated ghrelin levels. Ashitani et al. (17)reported that MCTs supplemented via a combination of oral and nasogastric tube administration increased serum acylated ghrelin levels among inpatients diagnosed with anorexia nervosa (AN). In addition, they observed a dose-dependent relationship between MCT administration and serum acylated ghrelin levels in AN patients. Kawai et al. (18) reported the positive effects of orally ingested MCTs on serum acylated ghrelin levels in patients with chronic respiratory diseases. We believe that the above patient groups may have decreased appetites due to such diseases, with increased reactivity of serum ghrelin levels due to MCT administration.
Exogenous ghrelin administration is an effective appetite stimulant, confirmed by several studies published since 2000. Infusion and bolus of acylated ghrelin have consistently been shown to increase appetite and/or food intake in healthy adults (19, 20), obese adults (21), patients with chronic pulmonary diseases (22), cancer (23, 24), heart failure (25), gastric dysfunction (26), and chronic renal failure receiving maintenance dialysis (27). Although there is strong evidence regarding the effects of exogenous ghrelin administration on appetite, circulating GH, adrenocorticotropic hormone, cortisol, glucose, and prolactin in diverse patient cohorts, there is limited evidence demonstrating the positive effects of ghrelin on body composition, pulmonary function, cardiac function, and bone metabolism. Furthermore, some adverse effects due to ghrelin administration were reported in 20% of the study participants, including flushing, gastric rumbles, thirst, somnolence, vertigo, fatigue, and change in mood (28, 29). Therefore, activation of ghrelin via dietary supplementation of MCTs instead of exogenous ghrelin administration may be an effective and safe treatment option for diverse populations with appetite alteration.
To the best of our knowledge, this is the first study to demonstrate that ghrelin is activated via orally ingested MCTs in healthy adults. This finding suggests that acylation (activation) of ghrelin via oral ingestion of MCTs stimulates food intake; induces positive energy balance; and aids in the treatment of older patients with malnutrition, cachexia, and sarcopenia, where little evidence is currently available (30).
Our study had some limitations. First, this study included small samples, 3 women and 3 men, without discussing the sex difference. This might limit the generalizability of the results. Second, another control group, such as the long-chain triglycerides (LCTs) administered group, was lacking. Thus, the single effect of MCTs could not be clarified in the current study design. Therefore, further large-scale and high-quality studies are needed to address these limitations.
In conclusion, oral ingestion of MCTs increased serum acylated ghrelin levels in healthy adults. The present result suggests that treatment with MCTs may be a promising treatment option for patients with malnutrition, as well as sarcopenia and cachexia, while further large-scale and high-quality studies are needed.


Funding sources: This study was supported by Nisshin OilliO Group, Ltd., Japan. Nisshin OilliO Group, Ltd. had no control over the interpretation, writing, or publication of the research.

Conflict of interest: No conflict of interest.

Author contributions: YY: supervising, concept, data collecting, interpretation, manuscript drafting. SS, AS: concept, interpretation, manuscript drafting. FN, ST, TH, MK, YY, SN, TB: concept, interpretation, data collecting, manuscript drafting.

Ethical standards: We conducted the study in accordance with the Declaration of Helsinki, and the study was approved by the ethics committee of Kumamoto Rehabilitation Hospital. We obtained written informed consent from all participants.


References

1.    Wilson MMG, Morley JE. Invited Review: Aging and energy balance. J Appl Physiol 2003;95:1728-1736.
2.    O’Shea E, Trawley S, Manning E, et al. Malnutrition in Hospitalised Older Adults: A Multicentre Observational Study of Prevalence, Associations and Outcomes. J Nutr Health Aging 2017;21:830-836.
3.    Cruz-Jentoft AJ, Baeyens JP, Bauer JM, et al. Sarcopenia: European consensus on definition and diagnosis: Report of the European Working Group on Sarcopenia in Older People. Age Ageing 2010;39:412-423
4.    Yoshimura Y, Wakabayashi H, Bise T, Tanoue M. Prevalence of sarcopenia and its association with activities of daily living and dysphagia in convalescent rehabilitation ward inpatients. Clin Nutr. 2017;doi: 10.1016/j.clnu.2017.09.009. [Epub ahead of print]
5.    Kojima M, Hosoda H, Date Y, et al. Ghrelin is a growth-hormone-releasing acylated peptide from stomach. Nature 1999;402:656-660.
6.    Barazzoni R, Bosutti A, Stebel M, et al. Ghrelin regulates mitochondrial-lipid metabolism gene expression and tissue fat distribution in liver and skeletal muscle. Am J Physiol Endocrinol Metab 2005;288:E228–E235.
7.    Anker SD, Coats AJ, Morley JE. Evidence for partial pharmaceutical reversal of the cancer anorexia-cachexia syndrome: the case of anamorelin. J Cachexia Sarcopenia Muscle 2015;6:275–277.
8.    Stengel A., Tache Y. Ghrelin – a pleiotropic hormone secreted from endocrine x/a-like cells of the stomach. Frontiers in Neuroscience 2012;6:24.
9.    Mirzaie Bavil F., Mohaddes G., Ebrahimi H., et al. Ghrelin increases lymphocytes in chronic normobaric hypoxia. Advanced Pharmaceutical Bulletin 2014;4:339–343.
10.    Castaneda T. R., Tong J., Datta R., et al. Ghrelin in the regulation of body weight and metabolism. Frontiers in Neuroendocrinology 2010;31:44–60.
11.    Garin MC, Burns CM, Kaul S, Cappola AR. Clinical review: The human experience with ghrelin administration. J Clin Endocrinol Metab 2013;98:1826-1837.
12.    Pradhan G, Samson SL, Sun Y. Ghrelin: much more than a hunger hormone. Curr Opin Clin Nutr Metab Care 20113;16:619-624.
13.    Nishi Y, Hiejima H, Hosoda H, et al. Ingested medium-chain fatty acids are directly utilized for the acyl modification of ghrelin. Endocrinology 2005;146:2255-2264.
14.    Fukumori R, Sugino T, Shingu H, et al. Ingestion of medium chain fatty acids by lactating dairy cows increases concentrations of plasma ghrelin. Domest Anim Endocrinol 2013;45:216-223
15.    Yamato M, Sakata I, Wada R, et al. Exogenous administration of octanoic acid accelerates octanoylated ghrelin production in the proventriculus of neonatal chicks. Biochem Biophys Res Commun 2005;333:583-589.
16.    Lemarié F, Beauchamp E, Dayot S, et al. Dietary Caprylic Acid (C8:0) Does Not Increase Plasma Acylated Ghrelin but Decreases Plasma Unacylated Ghrelin in the Rat. PLoS One 2015;10:e0133600.
17.    Ashitani J, Matsumoto N, Nakazato M. Effect of octanoic acid-rich formula on plasma ghrelin levels in cachectic patients with chronic respiratory disease. Nutr J 2009;8:25. doi: 10.1186/1475-2891-8-25.
18.    Kawai K, Nakashima M, Kojima M, et al. Ghrelin activation and neuropeptide Y elevation in response to medium chain triglyceride administration in anorexia nervosa patients. Clin Nutr ESPEN 2017;17:100-104.
19.    Druce MR, Neary NM, Small CJ, et al. Subcutaneous administration of ghrelin stimulates energy intake in healthy lean human volunteers. Int J Obes (Lond) 2006;30(2):293-296.
20.    Schmid DA, Held K, Ising M, et al. Ghrelin stimulates appetite, imagination of food, GH, ACTH, and cortisol, but does not affect leptin in normal controls. Neuropsychopharmacology 2005;30:1187-1192.
21.    Huda MS, Dovey T, Wong SP, et al.  Ghrelin restores ‘lean-type’ hunger and energy expenditure profiles in morbidly obese subjects but has no effect on postgastrectomy subjects. Int J Obes (Lond) 2009;33:317-325.
22.    Kodama T, Ashitani J, Matsumoto N, et al. Ghrelin treatment suppresses neutrophil-dominant inflammation in airways of patients with chronic respiratory infection. Pulm Pharmacol Ther 2008;21:774-779.
23.    Yamamoto K, Takiguchi S, Miyata H, et al. Randomized phase II study of clinical effects of ghrelin after esophagectomy with gastric tube reconstruction. Surgery 2010;148:31-38.
24.    Lundholm K, Gunnebo L, Körner U, et al. Effects by daily long term provision of ghrelin to unselected weight-losing cancer patients: a randomized double-blind study. Cancer 2010;116:2044-2052.
25.    Nagaya N, Moriya J, Yasumura Y, et al. Effects of ghrelin administration on left ventricular function, exercise capacity, and muscle wasting in patients with chronic heart failure. Circulation 2004;110:3674-2679.
26.    Akamizu T, Iwakura H, Ariyasu H, et al. Clinical Study Team. Repeated administration of ghrelin to patients with functional dyspepsia: its effects on food intake and appetite. Eur J Endocrinol 2008;158:491-498.
27.    Ashby DR, Ford HE, Wynne KJ, et al. Sustained appetite improvement in malnourished dialysis patients by daily ghrelin treatment. Kidney Int 2009;76:199-206.
28.    Pradhan G, Samson SL, Sun Y. Ghrelin: much more than a hunger hormone. Curr Opin Clin Nutr Metab Care 2013;16:619-624.
29.    Garin MC, Burns CM, Kaul S, Cappola AR. Clinical review: The human experience with ghrelin administration. J Clin Endocrinol Metab 2013;98:1826-1837.
30.    Yoshimura Y, Wakabayashi H, Yamada M, et al. Interventions for Treating Sarcopenia: A Systematic Review and Meta-Analysis of Randomized Controlled Studies. J Am Med Dir Assoc 2017;18:553.e1-553.e16.

THE RELATIONSHIP BETWEEN ARTHRITIS AND MUSCULAR STRENGTH IN OLDER WOMEN WITH SYMPTOMS OF SARCOPENIA


E.N. Renna1, S.G. Slezak1, K.B. Mahoney1, I.E.Lofgren2, D.L. Hatfield1, M.J. Delmonico1, F. Xu1


1. Department of Kinesiology, University of Rhode Island; 2. Department of Nutrition and Food Sciences, University of Rhode Island

Corresponding Author: Furong Xu, Department of Kinesiology, University of Rhode Island, Independence Square II, 25 West Independence Way, Kingston, RI 02881. Email: fxu2007@uri.edu. Fax: 401-874-4215, Telephone: 401-874-2412

J Aging Res Clin Practice 2017;6:217-222
Published online October 26, 2017, http://dx.doi.org/10.14283/jarcp.2017.29


Abstract

Background: Sarcopenia classification is important for prevention or intervention of sarcopenia in the elderly.  However, measures used for the current sarcopenia criteria, including muscular strength, could be impacted by forms of arthritis.  Thus, it is crucial to understand the impact arthritis has on sarcopenia status. Objectives: The aim was to investigate if arthritis relates to sarcopenia classification via grip strength or single chair stand in older women. A secondary aim was to assess the relationship between grip strength and upper and lower body strength in those with arthritis. Design: A cross-sectional analysis. Setting and participants: Sixty-one community-dwelling older women (71.9±4.6 years) from Rhode Island. Measurements: Sarcopenia status was classified using established working definitions. Grip strength was measured using a hand grip dynamometer, chair stands were measured via a single chair stand test, and gait speed was assessed using a four-meter walk test.  A segmental multi-frequency bioelectrical impedance analysis assessed body composition and arthritis status was based on self-report. Upper and lower body muscular strength were measured using a chest press and leg press one repetition maximum. Results: No associations were observed between arthritis and sarcopenia status (p=0.36) nor arthritis and upper or lower body muscular strength and grip strength. Conclusions: The results of this study may indicate that arthritis is not associated with sarcopenia status but may affect other measures of muscular strength.

Keywords: Sarcopenia, Arthritis, Muscular Strength, Older Women.


Introduction

Sarcopenia is defined as the loss of muscular strength, functionality, and lean mass with aging (1, 2) that is related to functional limitations (3). This is especially a concern among older women since women have a greater life expectancy and are at higher risk for functional disability due to more rapid declines in muscular strength when compared to men (4).  As a result of that, sarcopenia also has a great impact on health care with estimated costs for women around $25.5 billion in the U.S. and continues to increase as the older population increases (4, 5). Therefore, it is imperative to screen women for sarcopenia so proper intervention and prevention can be implemented.  While a universal sarcopenia classification system is lacking, several national and international organizations have established working classification systems for sarcopenia that include measures of muscular strength, gait speed and lean mass (1, 6-8).
While organizations have various criteria for sarcopenia, muscular strength is often assessed using a grip strength test because it is considered a valid measure to predict overall muscular strength.  It is also easier to administer to large populations due to its compact size and portability (1, 9-12). Some working definitions use alternative measures to assess muscular strength such as chair stands.  The International Working Group uses this measure in their working definition because the ability to rise from a chair is considered an activity of daily living that requires adequate muscular strength (7, 13).  However, functional limitations such as arthritis could negatively affect muscular strength measurements based on the current sarcopenia working definitions.
Arthritis is a chronic disease characterized by joint stiffness, inflammation, joint deformity, and pain (14).  In the U.S., arthritis is the most common cause of disability (15).  Between 2013 and 2015, approximately 54.4 million adults were diagnosed with arthritis (15).  The symptoms of arthritis (i.e. joint pain, inflammation) could affect one’s ability to perform muscular strength tests.  Since muscular strength is a key component of all sarcopenia working definitions, it is important to address the potential misclassification of sarcopenia due to the limitations in physical function arthritis may cause (14).  Therefore, the purpose of this study was to determine if arthritis is related to sarcopenia classification via grip strength or failure to complete a chair stand in older women.  A secondary aim was to assess if grip strength was related to upper and lower body muscular strength in a group of older women with symptoms of sarcopenia by arthritis status.


Materials and methods

Study Design

The study utilized a cross-sectional analysis to assess the potential effects of arthritis on sarcopenia status in elderly women who were recruited for Resistance Exercise Study to Reclaim Lean Muscle and Strength (URI RESTORE ME). It was approved by the University of Rhode Island’s Institutional Review Board.

Participants

Participants were recruited from Rhode Island via flyers, community talks and word of mouth, and Figure 1 depicts the flow of participant recruitment.  One hundred sixty women were initially phone screened for study eligibility based on the inclusion and exclusion criteria for the study (Table 1).  Participants who initially qualified provided written informed consent and were tested for sarcopenia using the European Working Group on Sarcopenia in Older People (EWGSOP) (1), the International Working Group (IWG) (7), and the Foundation for the National Institutes of Health Sarcopenia Project (FNIHSP) criteria (6,8).

Table 1 Inclusion and exclusion criteria used for study recruitment

Table 1
Inclusion and exclusion criteria used for study recruitment


Outcome Measures

Anthropometrics

Participants had their height, weight, and waist and hip circumferences measured twice.  Participants wore surgical scrubs for the waist and hip circumference measurements assessed using standard tape measure with a tensiometer (Gulick Tape Measure, Japan).  Weight was measured using a Seca balance beam scale to the nearest 0.1 kg and height was measured using a Seca wall mounted stadiometer (Seca, Chino, CA) to the nearest 0.1 cm. Both measurements were done without shoes and were performed two times.  The average of the two scores was used to calculate each participant’s BMI and waist-to-hip ratio.
Body composition was also assessed using an InBody 570 SMF-BIA (Biospace Co, Ltd, Korea) device according to the manufacturer’s instructions.  The SMF-BIA is an accepted valid device used to estimate lean mass and is safe to use in older populations (16).  This device has been found to be agreeable to dual energy x-ray absorptiometry (DXA) measurements of appendicular lean mass in this population (17).  Measurements were taken at the right and left arms, the right and left legs, as well as for the trunk using 8 electrodes specifically placed and 6 different frequencies (1 kHz, 5 kHz, 50 kHz, 250 kHz, 500 kHz, 1000 kHz) which gave a total of 30 impedance measurements for each participant. To standardize the assessment, all participants were asked to be hydrated and fasted for at least four hours and their bladder voided prior to testing.

Sarcopenia Status

The EWGSOP (1), IWG (7), and FNIHSP (6,8) working definitions were used to determine participants’ sarcopenia status based on their performance in a hand grip strength test, a single chair stand, gait speed, and their appendicular lean mass (ALM) as measured using a segmental multi-frequency bioelectrical impedance analysis (SMF-BIA, InBody 570 SMF-BIA, Biospace Co, Ltd, Korea) device.  Based on those three working definitions, our criteria for study inclusion were: <20 kg for grip strength or inability to complete a single chair stand, a gait speed <0.8m/s, and an ALM < 5.67 kg/m2 or ALM/body mass index (BMI) <0.512. Women were then classified as having low muscular strength, low lean mass, low physical functioning (gait speed), all three aspects, or none if no criteria were met.  Participants were also considered either grip dependent or non-grip dependent depending on their grip strength score.  Participants were considered grip dependent if they only met the muscular strength criteria (<20kg or inability to do a single chair stand) and were considered non-grip dependent if they exceeded the muscular strength criteria or met the other criteria or met no criteria.

Determining Arthritis Presence

Arthritis was based on self-report noted in participants’ phone screening interviews and medical history questionnaires administered during testing sessions.  The medical history questionnaire used a “yes/no” question to identify if the participant had arthritis.

Physical Function

A four-meter gait speed test was used to measure lower extremity functionality (1).  Participants walked at a normal walking pace over the four meters for two trials. Participants were hand timed for both trials, and the fastest time was used. Lower extremity function was also assessed using a single chair stand (7,13).  Participants were asked to complete a single chair stand unassisted with arms crossed over their chest for one trial.  Participants who were unable to stand successfully unassisted were considered to have low muscular strength.

Muscle Function and Strength

Hand grip strength is used to measure muscular strength (18).  It is a key factor in the current working definitions for sarcopenia (1,8), and is a reliable and valid measure for the older adult population (18).  Grip strength was assessed using a hand grip dynamometer (Jamar Hydraulic Dynamometer, J.A. Preston Corp., Jackson, MS).  Participants were seated with the elbow flexed at 90 degrees.  The hand grip dynamometer was adjusted for each participant by ensuring all four fingers had the second knuckle placed flat on the handle. Two trials were completed on each hand with the highest score being recorded in kilograms.  Grip strength was measured during testing sessions and at the baseline assessment.
A chest press machine (Cybex International, Inc., Medway, MA) was used to assess maximum upper body strength via a one repetition maximum test (1RM) for each participant employing methods previously published (19).  From a seated position, participants had their head, shoulders, and back against a seat back and held onto handles positioned at chest height.  Participants then extended their elbows fully and then returned to the starting position to assess their chest press 1 RM (CP1RM).  A 1RM for lower body muscular strength (LP1RM) for each participant was determined using a seated leg press machine (Cybex International, Inc., Medway, MA) using methods previously published (20).  Briefly, participants were seated and then extended their knees from the starting position (~90 degrees) by pushing against a platform with their feet until their knees were close to full extension but not locked.  For both CP1RM and LP1RM, after a standard warm up, participants completed 3-5 sets of one repetition with a gradual increase in weight and a three-minute rest period between sets until their 1RM was determined.

Other measures

The Yale Physical Activity Survey (YPAS) questionnaire was administered to evaluate participants’ baseline physical activity levels and has been shown to be a valid assessment for determining physical activity levels among older adults (21).  This questionnaire was used for describing participants’ baseline physical activity levels (21).
The Dietary Screening Tool (DST) was administered to participants at baseline testing to assess their dietary patterns and to determine their level of nutritional risk.  There are three levels of nutritional risk that are used to identify if older adults are at risk including: at risk (<60), at possible risk (60-75), and not at risk (>75) (22).  This questionnaire was used to describe the baseline characteristics for the participants who partook in baseline testing for the randomized controlled trial.

Statistical Analysis

Estimated sample size for this study was determined based on anticipated between-group changes in lean mass rather than change in sarcopenia status by arthritis prevalence.  This analysis was part of a larger pilot study to determine the potential for periodized resistance training to impact sarcopenia.  The demographic and clinical characteristics for participants are expressed as mean ± standard deviation for continuous variables and frequencies for categorical variables.  A Shapiro-Wilk test was completed to test for normal distribution. Independent samples t-tests were used to compare those with arthritis to those without arthritis.  A Fisher’s exact test was used to assess arthritis status and its association to sarcopenia status via multiple sarcopenia definitions for women who were screened (n=61).  A Pearson correlation was used to assess the correlation between grip strength, CP1RM, and LP1RM in those with arthritis and those without arthritis from participants who partook in the baseline assessments (n=25).  An alpha of p≤0.05 was used for all statistical analyses and all analyses were performed using SPSS software (IBM SPSS, Version 22, Armonk, NY, 2013).


Results

Of the 160 women initially interested, 61 women (mean age 71.9±4.60 years) qualified for further testing after preliminary phone screening.  Of those 61 women, 35 women had arthritis and 26 of those women did not have arthritis.  Additionally, 25 women (mean age 72.2±4.6 years) out of the 61 women, who qualified for the URI RESTORE ME study, exhibited at least one symptom or sign of sarcopenia defined by various working group definitions and completed all baseline measurements for the URI RESTORE ME study.  Of the 25 women, 15 women had arthritis and 10 women did not have arthritis.  Tables 2 and 3 describe the sample characteristics by sarcopenia criteria, age, 1RM measures, physical activity scores, and DST scores. There were no significant differences in characteristics between those with arthritis to those without arthritis.
When evaluating the association between arthritis and sarcopenia status via grip strength or a single chair stand, arthritis was not significantly related to sarcopenia status via multiple definitions (n=61, p=0.36). Additionally, when assessing maximal muscular strength measures for the women (n=25) who partook in the baseline testing for the URI RESTORE ME study with arthritis, there were no significant correlations between grip strength and CP1RM (r=-0.226, p=0.438), grip strength and LP1RM (r=-0.118, p=0.688), and CP1RM and LP1RM (r=0.389, p=0.152).  However, for those without arthritis, there was a significant correlation between grip strength and CP1RM (r=0.683, p=0.029), CP1RM and LP1RM (r=0.881, p=0.001), but not between grip strength and LP1RM (r=0.554, p=0.097).


Table 2 Characteristics of those with arthritis and without arthritis in participants who completed the testing measurements for the randomized controlled trial (n=61)

Table 2
Characteristics of those with arthritis and without arthritis in participants who completed the testing measurements for the randomized controlled trial (n=61)

*BMI, Body Mass Index; †% Body Fat measured using InBody 570 SMF-BIA, Biospace Co, Ltd, Korea; ‡Number of people who passed, n(%); P-values were obtained using independent samples t-tests; §p value was obtained using a Fisher’s Exact Test.


Table 3 Characteristics of those with arthritis and without arthritis for participants who completed baseline measurements for the randomized controlled trial (n=25)

Table 3
Characteristics of those with arthritis and without arthritis for participants who completed baseline measurements for the randomized controlled trial (n=25)

*BMI, Body Mass Index; DST, Dietary Screening Tool; †% Body Fat measured using InBody 570 SMF-BIA, Biospace Co, Ltd, Korea;  ‡Physical Activity (PA) from the Yale Physical Activity Survey (YPAS); YPAS and PA Index mean±SD reflect n=24 due to incomplete/missing surveys; §Dietary Screening Tool: At Risk (<60), Possible risk (60-75), Not at risk (>75), mean±SD reflect n=23 due to incomplete/missing surveys; || Number of people who passed, n(%); p-values were obtained using independent samples t-tests; { p-value was obtained using a Fisher’s Exact Test.


Figure 1 Study Flow Chart

Figure 1
Study Flow Chart


Discussion


The results of the present study indicate that arthritis was not associated with sarcopenia status in this population of older women based on multiple sarcopenia working definitions.  Additionally, our results showed that there was no correlation between grip strength and both upper and lower body muscular strength for those with arthritis.
Contradictory to our findings, a study by Kemmler et al (2016) used a cross-sectional analysis to compare osteoarthritis in the hip and lower limb to sarcopenia status in older women and found that those with osteoarthritis were more likely to be sarcopenic than their non-arthritic counterparts (23).  However, that study focused only on osteoarthritis in the lower half of the body while we assessed general arthritis to all components of the working definitions (23).  Additionally, unlike our present study, that study did not take into consideration other working definitions of sarcopenia and only used the EWGSOP definition.  Our study on the other hand, used the EWGSOP, IWG, and FNIHSP working definitions and utilized the single chair stand component of the IWG definition as well as grip strength for measures of muscular strength.  The IWG uses this measure because it is an important activity of daily living and requires adequate muscular strength.  In our study, we only had one participant who could not perform a chair stand but displayed no other symptoms of sarcopenia despite reporting arthritis.  Although we do not know of the kind of arthritis or what joints were affected, it is possible that arthritis could have impaired her ability to perform the chair stand.  Poor muscular strength in the lower limbs is known to promote cartilage damage which could progress any current osteoarthritis (24). Future studies need to address both arthritis and sarcopenia together and the potential affects each has on the other. The lack of studies in this area could be due to having high internal validity and therefore not accurately capturing the older adult population.
This study also looked at the relationship between grip strength and upper and lower body muscular strength for those with and without arthritis.  This relationship is important because grip strength is often used to assess overall muscular strength as it is more convenient in a clinical setting and easier to administer compared to other muscular strength tests such as 1 RM testing (11).  However, the present study found correlations between grip strength and upper and lower body muscular strength for non-arthritis participants but not those with arthritis.  This is not consistent with other findings in the literature.  Other studies have reported that grip strength and lower body strength as well as grip strength and upper body strength are related, and that using grip strength as a measure for overall muscular strength is an adequate alternative (11,25,26).   Yet, those studies only used healthy volunteers while our study evaluated both participants with and without arthritis.  Therefore, given the results of our study, it is possible that arthritis played a role in the lack of relationship, and arthritis may have attenuated participants’ ability to perform the strength tests (11).  This could be due to characteristics of arthritis such as pain, inflammation, and functional limitations (27,28).
This study has limitations and strengths.  First, the sample size of our study was small and therefore, the results may not adequately reflect this association.  Additionally, we did not focus on one specific type of arthritis but rather included all forms of arthritis. Despite these study limitations, this study also has strengths worth noting.  First, to our knowledge this is the first study to assess general arthritis and its relationship to sarcopenia status via grip strength and single chair stands in older women with or without symptoms of sarcopenia based on multiple sarcopenia guidelines.  While other studies have evaluated specific types of arthritis or used only one working definition in their research.  Secondly, this study included a homogenous sample cohort of community-dwelling older women.  Finally, this study used measures of muscular strength that have been standardized and validated for older populations (19, 20).


Conclusions

This is the first study to evaluate the impact arthritis has on grip strength or failure to complete a single chair stand in a population of older women for the classification of sarcopenia using multiple sarcopenia guidelines.  The present study found that arthritis was not significantly associated with sarcopenia status via grip strength or single chair stand and that there is no significant correlation between grip strength and both upper and lower body muscular strength in older women with arthritis.  Although this pilot study adds to the literature, additional studies with a larger sample size and clearly defined arthritis status (i.e. joints affected and type) are needed to determine if these variables are linked and to further explore the lack of the relationship between muscular strength measures.


Funding: This study was funded by a grant from the College of Health Sciences at the University of Rhode Island.

Acknowledgments: : The authors would like to extend their gratitude to all study participants and University student volunteers for their support.

Conflict of interest: The authors declare that there no conflict of interest.

Ethical standard: All procedures performed in this study were in accordance with the ethical standards of the institutional and/ or national research committee and with the 1964 Helsinki declaration and its later amendments or comparable ethical standards.


References

1.    Cruz-Jentoft A, Baeyens J, Bauer J, Boirie Y, Cederholm T, Landi F, et al. Sarcopenia: European consensus on definition and diagnosis: Report of the European Working Group on Sarcopenia in Older People. Age Ageing 2010; 39: 412.
2.    Manini TM, Clark BC. Dynapenia and aging: an update. J Gerontol A Biol Sci Med Sci 2012; 67: 28.
3.    Beaudart C, Rizzoli R, Bruyère O, Reginster J, Biver E. Sarcopenia: burden and challenges for public health. Arch Public Health 2014; 72.
4.    Borst SE. Interventions for sarcopenia and muscle weakness in older people. Age Ageing 2004; 33: 548.
5.    Janssen I, Shepard DS, Katzmarzyk PT, Roubenoff R. The Healthcare Costs of Sarcopenia in the United States. J Am Geriatr Soc 2004; 52: 80.
6.    Studenski SA, Peters KW, Alley DE, Cawthon PM, McLean RR, Harris TB, et al. The FNIH Sarcopenia Project: Rationale, Study Description, Conference Recommendations, and Final Estimates. J Gerontol A Biol Sci Med Sci 2014; 69: 547.
7.    Fielding RA, Vellas B, Evans WJ, Bhasin S, Morley JE, Newman AB, et al. Sarcopenia: an undiagnosed condition in older adults. Current consensus definition: prevalence, etiology, and consequences. International working group on sarcopenia. J Am Med Dir Assoc 2011; 12: 249.
8.    McLean RR, Shardell MD, Alley DE, Cawthon PM, Fragala MS, Harris TB, et al. Criteria for clinically relevant weakness and low lean mass and their longitudinal association with incident mobility impairment and mortality: the foundation for the National Institutes of Health (FNIH) sarcopenia project. J Gerontol A Biol Sci Med Sci 2014; 69: 576.
9.    Bohannon RW. Hand-grip dynamometry predicts future outcomes in aging adults. J Geriatr Phys Ther 2008; 31: 3.
10.    Cooper C, Fielding R, Visser M, vanLoon L, Rolland Y, Orwoll E, et al. Tools in the assessment of sarcopenia. Calcif Tissue Int 2013; 93: 201.
11.    Stark T, Walker B, Phillips JK, Fejer R, Beck R. Hand-held dynamometry correlation with the gold standard isokinetic dynamometry: a systematic review. PM R 2011; 3: 472.
12.    Syddall H, Cooper C, Martin F, Briggs R, Aihie Sayer A. Is grip strength a useful single marker of frailty? Age Ageing 2003; 32: 650.
13.    Rolland Y, Czerwinski S, Abellan Van Kan G, Morley JE, Cesari M, Onder G, et al. Sarcopenia: its assessment, etiology, pathogenesis, consequences and future perspectives. J Nutr Health Aging 2008; 12: 433.
14.    Hootman JM, Helmick CG, Brady TJ. A Public Health Approach to Addressing Arthritis in Older Adults: The Most Common Cause of Disability. Am J Public Health 2012; 102: 426.
15.    Barbour KE, Helmick CG, Boring M, Brady TJ. Vital Signs: Prevalence of Doctor-Diangosed Arthritis and Arthritis-Attributable Activity Limitation – United States, 2013-2015. 2017; 66: 246-53.
16.    Kim M, Kim H. Accuracy of segmental multi-frequency bioelectrical impedance analysis for assessing whole-body and appendicular fat mass and lean soft tissue mass in frail women aged 75 years and older. Eur J Clin Nutr 2013; 67: 395.
17.    Mahoney K. Validation of Bioelectrical Impedance Analysis for the Measurement of Appendicular Lean Mass in Older Women. 2016.
18.    Roberts HC, Denison HJ, Martin HJ, Patel HP, Syddall H, Cooper C, et al. A review of the measurement of grip strength in clinical and epidemiological studies: towards a standardised approach. Age Ageing 2011; 40: 423.
19.    LeBrasseur NK, Bhasin S, Miciek R, Storer TW. Tests of muscle strength and physical function: reliability and discrimination of performance in younger and older men and older men with mobility limitations. J Am Geriatr Soc 2008; 56: 2118.
20.    Delmonico MJ, Ferrell RE, Meerasahib A, Martel GF, Roth SM, Kostek MC, et al. Blood pressure response to strength training may be influenced by angiotensinogen A-20C and angiotensin II type I receptor A1166C genotypes in older men and women. J Am Geriatr Soc 2005; 53: 204.
21.    Dipietro L, Caspersen CJ, Ostfeld AM, Nadel ER. A survey for assessing physical activity among older adults. Med Sci Sports Exerc 1993; 25: 628.
22.    Bailey RL, Miller PE, Mitchell DC, Hartman TJ, Lawrence FR, Sempos CT, et al. Dietary screening tool identifies nutritional risk in older adults. Am J Clin Nutr 2009; 90: 177.
23.    Kemmler W, Teschler M, Goisser S, Bebenek M, Stengel SV, Bollheimer LC, et al. Prevalence of sarcopenia in Germany and the corresponding effect of osteoarthritis in females 70 years and older living in the community: results of the FORMoSA study. Clin Interv Aging 2015; 10: 1565.
24.    De Ceuninck F, Fradin A, Pastoureau P. Bearing arms against osteoarthritis and sarcopenia: when cartilage and skeletal muscle find common interest in talking together. Drug Discov Today 2014; 19: 305.
25.    Visser M, Deeg DJ, Lips P, Harris TB, Bouter LM. Skeletal muscle mass and muscle strength in relation to lower-extremity performance in older men and women. J Am Geriatr Soc 2000; 48: 381.
26.    Desrosiers J, Hebert R, Bravo G, Dutil E. Comparison of the Jamar dynamometer and the Martin vigorimeter for grip strength measurements in a healthy elderly population. Scand J Rehabil Med 1995; 27: 137.
27.    Dedeoğlu M, Gafuroğlu Ü, Yilmaz Ö, Bodur H. The Relationship Between Hand Grip and Pinch Strengths and Disease Activity, Articular Damage, Pain, and Disability in Patients with Rheumatoid Arthritis. Turk J Rheumatol 2013; 28: 69.
28.    Scott D, Blizzard L, Fell J, Jones G. Prospective study of self-reported pain, radiographic osteoarthritis, sarcopenia progression, and falls risk in community-dwelling older adults. Arthritis Care Res (Hoboken) 2012; 64: 30.

THE RELATIONSHIP BETWEEN MARKERS OF MALNUTRITION AND MUSCLE WASTING WITH FRAILTY AND PHYSICAL FUNCTION IN OLDER CARE HOME RESIDENTS


A. Slee1, T. Ahmed2, L. Storey2, L. Wilkinson2, G. Wilson2, G. Garden3


1. Institute for Liver and Digestive Health, UCL Medical School, Royal Free Campus, Rowland Hill Street, Hampstead, London, NW3 2PF; 2. United Lincolnshire Hospitals NHS Trust, Lincoln County Hospital, Greetwell Road Lincoln, LN2 5QY; 3. St Barnabas Hospice, 36 Nettleham Road, Lincoln, LN2 1RE

Corresponding Author: Dr Adrian Slee, Institute for Liver and Digestive Health, UCL Medical School, Royal Free Campus, Rowland Hill Street, Hampstead, London, NW3 2PF, United Kingdom, email: adrianslee@hotmail.co.uk.


J Aging Res Clin Practice 2017;6:176-181
Published online September 14, 2017, http://dx.doi.org/10.14283/jarcp.2017.23


Abstract

Background: Older care homes residents may suffer from malnutrition and muscle wasting within a background of varying degrees of frailty, comorbidity and disability. Hence, malnutrition is complicated by co-presence of sarcopenia, cachexia and inactivity-induced muscle atrophy. Objectives: (1) to assess the prevalence of malnutrition in care home residents using different methodologies. (2) To examine the relationship between measurements of nutritional status and muscle mass with frailty and physical function; Design: initial pilot study. Setting: care homes for older people. Participants: 73 participants, 46 female and 27 male; Intervention: observational study. Measurements: height (m), weight (kg), body mass index (BMI) (kg), bioelectrical impedance assessment (BIA) of fat free mass index (FFMI) (kg/m2), mid upper arm muscle circumference (MUAMC) (cm), Edmonton Frailty Scale (EFS) and Barthel Index (BI). Results: There was a relatively high prevalence of malnutrition depending on measure used. MNA-SF 0-7 score was 30% for females and 28% males. Low MUAMC was found in 41% females and 53% males; low BIA FFMI in 37% females and 52% males. Good correlation (P<0.001) was found for most measures including against EFS and BI for MNA-SF and MUAMC. Conclusions: Malnutrition prevalence was relatively high. MNA-SF and MUAMC correlated well with functional status and frailty EFS measures. FFMI by BIA correlated well with MNA-SF and MUAMC. This range of practical techniques should be explored further for determining malnutrition risk and muscle wasting in relation to functionality and frailty in care home residents

Key words: Malnutrition, sarcopenia, cachexia, frailty, muscle wasting.


Introduction

Older people in care homes have varying degrees of comorbidity, frailty and impaired functional ability which may be associated with clinical outcomes (1). Malnutrition, a serious concern for this population group, is a component of the frailty cycle, and may be linked to worse outcomes (2, 3), therefore screening for malnutrition with simple tools has high clinical value (4, 5). There is debate however, regarding which methods to use and specific cut-off points (e.g. body mass index, BMI) (6). Furthermore, differentiating the different states of cachexia, sarcopenia and disuse atrophy is complex (7-10). Older people with varying degrees of frailty, comorbidity (and associated inflammation etc.) and poor physical function may suffer from a combination of states and be difficult to assess. Regardless of origin, these states lead to skeletal muscle mass (SMM) loss and a reduction in nutritional status making an older person more susceptible to malnutrition and risk of morbidity and mortality. Recently, the term ‘muscle wasting disease’ has been suggested as an umbrella term to encompass all forms of muscle loss (11).
Regarding techniques of assessment for malnutrition risk, the mini nutritional assessment (MNA) and abbreviated short-form (MNA-SF) have been validated and suggested for use in older people (4) and uses BMI with significant weight loss and other specific questions. Previous studies in older people have also utilised bioelectrical impedance assessment (BIA) to estimate nutritional status, measuring fat free mass (FFM) and FFM index (FFMI in kg/m2) (5, 12-14). Recently, an ESPEN consensus statement, produced for the assessment of malnutrition discussed specific cut-off points for BMI, weight loss and use of FFMI.  Muscle wasting can be estimated by FFMI as an indicator of SMM. It can also be measured practically by the mid upper arm muscle circumference (MUAMC). The MUAMC was used in a large Italian study (n = 357) by Landi et al (IlSIRENTE Study) which investigated the relationship between MUAMC in community-dwelling older people with physical performance and mortality (15).
One area of research has been the development of tools and measures for frailty status and the relationship with health and specific aspects such as muscle loss in ageing, sarcopenia. The Edmonton Frailty Scale (EFS) was developed as a brief, valid and reliable tool which can be used to identify multi-domain frailty by clinical staff without training in geriatric medicine (16). The usefulness of the EFS in care homes and relationship with markers of nutritional status, malnutrition and muscle wasting has yet to be ascertained. Furthermore, the relationship between these different markers with measurements of the Activities of Daily Living (ADLs) is also of high interest. The Barthel Index (BI) is commonly used by geriatricians to indicate functional ability/disability (17).
This study aimed to (1) investigate malnutrition prevalence in care home residents using different methods and (2) investigate the relationship between markers of nutritional status, frailty and physical function.


Methods

Participants and study design

This study was undertaken between October 2015 and May 2016 and is part of an ongoing care home service evaluation, the Frailty and Nutrition Study in Lincoln (FANS). Study was cleared through NHS research ethics committee in September 2015. Care home residents underwent Comprehensive Geriatric Assessment (CGA) in four care homes in Lincoln, United Kingdom. Patients were diagnosed with different levels of frailty and with a range of comorbidities including; cardiovascular disease, chronic heart failure, chronic kidney disease, chronic obstructive pulmonary disorder, cancer, diabetes, arthritis, and dementia. Most residents were being treated with multiple drugs. The aim was to recruit 100 to 150 patients in line with other similar studies; however the designated study time restraints dictated the current number. Measurements were collected by members of a multidisciplinary care team.

Anthropometric measurements

Height (in m) was estimated using ulnar length and conversion tables (BAPEN, UK). Weight (in kg) was measured and body mass index (BMI in kg/m2) calculated. Mid upper arm circumference (MUAC) was measured using a tape measure around the mid-point of the upper arm. Measurements were taken on the right side of the participant’s body unless affected by disability or disease.

Bioelectrical impedance assessment measurements

BIA measurements were taken using a single-frequency (50 kHz) Maltron 916 S, bioelectrical impedance analyser (Maltron International Ltd., Rayleigh, Essex, UK). Measurements were taken using a standard hand-to-foot tetra-polar technique with participants in the supine position, in accordance with the manufacturer’s guidelines. Raw impedance measurements of resistance (R) and reactance (Xc) in ohms and PA were recorded.
The BIA estimation of FFM was completed using the following BIA equation (Kyle equation (18)):
FFM = -4.104 1 (0.518 x height2 /R) + (0.231 x weight) + (0.130 x Xc) + (4.229 x sex: men = 1, women = 0). Height is in cm and weight in kg.

Nutritional assessment: MNA-SF screening

MNA-SF screening was undertaken by clinical staff according to instructions and scores recorded. Scores were converted into categories for nutritional status using MNA scoring criteria either low risk/normal (12–14), medium risk/at risk (8–11) and high risk/malnourished (0–7).

Mid-upper arm muscle circumference calculation

The MUAMC was calculated using the formula:
MUAMC = mid-upper arm circumference – (3.14 X triceps skinfold thickness)
Measurement of triceps skinfold thickness (to the nearest 0.2 mm) was made using Harpenden skinfold calliper (range: 0.00– 50.00 mm; minimum graduation: 0.20 mm).
Using reference data from Landi et al, the lowest tertiles for males (< 21.1 cm) and for females (< 19.2 cm) were used as cut-off points to indicate low muscle mass.

Malnutrition prevalence

Prevalence of malnutrition was assessed by BMI, MNA-SF score and FFMI. A BMI of < 20 kg/m2 was used as the population is older and high presence of comorbid chronic conditions. E.g. in the cachexia definition by Evans et al. a BMI < 20 kg/m2 is used as a cut-off point when there is presence of a chronic disease (7).

Edmonton frailty scale

The EFS was undertaken by clinical staff as part of routine CGA in participants. The EFS 10 domain test as described by Rolfson et al with maximum score of 17 was undertaken (16). Higher scoring indicates increasing frailty.
Barthel index

The BI was undertaken by clinical staff as part of routine CGA in participants.  A standard 10 question BI with a maximum of 20 point scoring was undertaken (17). Lower scoring indicates increasing disability.

Statistical analysis

Data was analysed as a group and individually for males and females. Cut-off points were assigned for malnutrition risk and low MUAMC. Number of residents and percentage (%) was calculated for prevalence. Correlations were performed on all variables using Pearson test and Spearman for nonparametric data.  All statistical tests were performed using IBM SPSS Statistics Version 21.


Results

There were 73 resident participants recruited over 4 separate care homes. The characteristics of the older care home residents can be seen in Table 1. MNA-SF and BIA was completed in all residents, MUAMC in 58, EFS in 49 and BI in 52.


Table 1 Participant characteristics and variables. Mean +/- standard deviation, median [ ], minimum and maximum ( )

Table 1
Participant characteristics and variables. Mean +/- standard deviation, median [ ], minimum and maximum ( )

All residents had gait speed and grip strength below the cut-off points for the European Working Group on Sarcopenia in Older Persons (EWGSOP) definition for sarcopenia (9).
Prevalence of malnutrition was assessed by BMI and MNA-SF score (see Table 2). Prevalence of low MUAMC indicative of muscle wasting can be found in Table 2 along with low FFMI.


Table 2 Prevalence of malnutrition, low MUAMC and low FFMI

Table 2
Prevalence of malnutrition, low MUAMC and low FFMI

*Low MUAMC: <19.2 cm for females and <21.1 cm for males. †Low FFMI: <15 kg/m2 for females and <17 kg/m2 males.

Correlations

There was good correlation between most measures (Table 3). However, there was no significant correlation between FFMI with Edmonton EFS or Barthel Index BI. Figures 1-3 depicts key correlations for (1) MNA-SF score, (2) MUAMC and (3) FFMI.


Table 3 Correlations between variables with correlation coefficient, r and significance, P values shown

Table 3
Correlations between variables with correlation coefficient, r and significance, P values shown


Figure 1 Graphs to show the relationship between MNA-SF score and (a) BMI, (b) EFS and (c) BI. Closed circles indicates female residents and triangles, males. Correlation results can be found within Table 3

Figure 1
Graphs to show the relationship between MNA-SF score and (a) BMI, (b) EFS and (c) BI. Closed circles indicates female residents and triangles, males. Correlation results can be found within Table 3

Figure 2 Graphs to show the relationship between MUAMC and (a) BMI, (b) MNA-SF score and (c) EFS and (d) BI. Closed circles indicates female residents and triangles, males. Correlation results can be found within Table 3

Figure 2
Graphs to show the relationship between MUAMC and (a) BMI, (b) MNA-SF score and (c) EFS and (d) BI. Closed circles indicates female residents and triangles, males. Correlation results can be found within Table 3

Figure 3 Graphs to show the relationship between FFMI and (a) BMI, (b) MUAMC and (c) MNA-SF score. Closed circles indicates female residents and triangles, males. Correlation results can be found within Table 3

Figure 3
Graphs to show the relationship between FFMI and (a) BMI, (b) MUAMC and (c) MNA-SF score. Closed circles indicates female residents and triangles, males. Correlation results can be found within Table 3

Discussion

In this study, 73 care home residents were screened for malnutrition using BMI, the MNA-SF and BIA estimation of FFMI (Table 2). Malnutrition by BMI was 24% in females and 22% in males. A BMI cut-off point of 20 kg/m2 was used to indicate malnutrition rather than 18.5 kg/m2. This was due to the age of the participants (86 +/- 6.5 years) with similar studies using a higher cut-off point for older people, as does the MNA-SF tool. Furthermore, the cachexia definition by Evans et al, utilises a cut-off point of 20 kg/m2 in the presence of a chronic condition, e.g. heart failure or cancer etc. (7). The population group that were assessed in this study had a high prevalence of comorbidity and chronic disease conditions. An ESPEN consensus paper recently suggested using 18.5 kg/m2 OR significant unintentional weight loss (> 10% indefinite of time, or >5% over the last 3 months) combined with either BMI (<20 kg/m2 if <70 years of age, or <22 kg/m2 if ≥70 years of age) or FFMI (<15 kg/m2 and 17 kg/m2 in women and men, respectively) (6). In this participant group, weight loss was difficult to assess accurately as it was highly dependent on robust records being kept within the care home itself (e.g. previous carers etc.). Weight loss is a component of frailty, a strong predictor of outcomes and in particular, the presence of cachexia wasting. As described above, due to high comorbidity and chronic disease prevalence it is likely that cachexia prevalence was relatively high despite not having the weight loss data to confirm this.
Identifying malnutrition by MNA-SF found that 30% females and 28% males were classified as malnourished (0-7 score) and 35% females and 48% males as ‘at risk’ (score 8-11). This was a higher prevalence than using BMI.  Based upon the nature of the MNA-SF and the questions it contains, it may be suggested that a person who has greater frailty, comorbidity and physical disability will score worse with a greater risk of malnutrition. Interestingly, the correlation results tend to confirm this relationship with BMI (r = 0.68, P < 0.001), EFS (r = -0.75, P< 0.001) and BI (r = 0.58, P < 0.001) (Figure 1).

BIA estimation of FFMI identified that 37% females and 52% males had a low FFMI. Cut-off points of <15 kg/m2 for females and <17 kg/m2 males were utilised as suggested from the ESPEN consensus paper to indicate a low FFMI (6).  BIA estimations of FFMI prove to be useful in this study similar to previous work (5). In the previous study, BIA estimation of FFMI was used alongside MNA-SF to better categorise malnutrition risk compared to using the standard UK Malnutrition Universal Screening Tool (MUST). With regards to accuracy of BIA, dual energy x-ray absorptiometry is the gold standard technique for measuring FFMI, but is difficult to use in the older population group in long term care and is also expensive. BIA is inexpensive and portable and can be used at the bed side (e.g. bed-bound residents). Drawbacks to its use however, include errors due to hydration abnormalities leading to false FFM estimations. In this study, 2 residents were omitted from FFMI estimation due to hydration abnormalities. Also, the presence of an electronic cardiac pacemaker is contraindicated for BIA use, and which is more likely to be prevalent in this population. Within the ESPEN consensus paper it was suggested that FFMI should be used as a possible measure of nutritional status, alongside weight loss (6). It may also be suggested however that FFMI alone may be useful in situations when it is impossible to gather accurate weight loss information.
In terms of skeletal muscle mass (SMM) the FFMI is a useful predictor of both nutritional status and an indicator of overall SMM. FFM consists of all mass other than fat mass and obviously the large body compartment of SMM makes up a high proportion of FFM. Therefore, we may assume under normal circumstances that a low FFM and FFMI may be indicative of a poor nutritional status and also low SMM. The FFMI was positively correlated with BMI (r = 0.72, P < 0.001), MNA-SF (r = 0.43, P < 0.001) and MUAMC (r = 0.51, P < 0.001) in residents. MUAMC was measured as a practical means of estimating SMM and muscle wasting. Using the lower tertiles in a study by Landi et al as cut-off points, the relative muscle mass and number of people with a lower MUAMC was determined. The number of participants with a low MUAMC was 41% females and 53% males.  In particular, interestingly the prevalence rates were quite similar to the low FFMI levels (37% females and 52% males). Hence, this data may support the concept of FFMI as an estimation of SMM. Landi et al found in community-dwelling older people that those with a higher MUAMC tertile had better physical performance (measured using a 4 m walk speed test, Short Physical Performance Battery score and hand grip strength) and a lower risk of death (adj. hazard ratio 0.45; 95% confidence interval 0.23-0.87). In our study, residents either had a low walking speed and hand grip strength below EWGSOP sarcopenia cut-off points (data not shown here), or presence of disability. Interestingly, there was a significant correlation between MUAMC with EFS (r = -0.61, P<0.001) and BI (r = 0.43, P = 0.01).
The reduced muscle mass may be the result of a combination of age-related sarcopenia, chronic disease, e.g. cachexia, and physical inactivity/disability (7-11). Practically however, this is difficult to untangle and the overarching term of muscle wasting disease which has recently been suggested by Von Haehling et al may be important here (11). Dupuy et al, found in a large cohort of older women (n=3025) that sarcopenia prevalence can vary greatly depending on the method used (19). Hence, there needs to be a standardisation in the terminologies and methods used in measuring sarcopenia and overall muscle loss.
The EFS was measured in participants to assess frailty. The EFS is a simple tool which can be used by non-geriatrician staff to assess multi-domain frailty which includes sections on cognition, mood, medications and functional status. The mean score of the participants was 11.2 +/- 2.8, which indicates a moderate level of frailty. As stated earlier, significant correlations were found between EFS and MNA-SF and with MUAMC. Furthermore, a significant negative correlation was found between BMI and EFS (r = -0.53, P < 0.001) (Table 3). This data fits well with the concept of the frailty cycle. Fried et al, describe this relationship in detail in (3). Nutritional status and malnutrition risk are key components of frailty due to the impact of a variety of factors including, the dysregulation of energy balance with ageing (anorexia of ageing) and illness (inflammation driven changes in appetite and metabolism). Furthermore, sarcopenia is also a major component. Interestingly, in this study there was no correlation with FFMI which was perhaps unexpected. This may be due to low study participant numbers. The EFS was evaluated in a recent study by Perna et al with 366 hospitalised older patients (20). EFS scores were associated with cognition, functional independence, medications, nutritional status by MNA, functional performance by BI and hand grip strength. They also found a significant difference in female patients with sarcopenia (SMM Index by DEXA). They concluded that the EFS may be a helpful tool for stratifying the state of fragility in this population group.
Frailty and sarcopenia increases the risk of disability (1,3). In this study the BI was taken as a method of measuring ADLs and hence physical functional status. The mean score of the participants was 10.3 +/- 6.6 which may indicate a moderately impaired level of functional ability, but there was also a high level of variance between participants. EFS score highly correlated (negatively) with BI (r = -0.71, P < 0.001) (Table 3), such that increasing frailty was associated with worsening of physical function. As stated earlier, significant correlations were found between BI and MNA-SF and with MUAMC. Furthermore, a significant positive correlation was found between BMI and BI (r = 0.27, P < 0.063) (Table 3). This data would suggest that functional decline relates to poor nutritional status and muscle mass. Villafane et al found that BI was positively associated with MNA-SF score in 344 older rehabilitation centre patients (i.e. higher scoring indicating better functional status and nutritional status etc.) (21). In addition, similar results were found in a large Spanish study with 895 institutionalised older residents across 34 nursing homes, whereby MNA was positively associated with BI (22). Zuliani et al, performed a 2 year longitudinal nursing home study in Italy with 98 participants (23). They found that malnutrition predicted further worsening of functional status and that the decline in body cell mass (measured by BIA) was proportional to the loss in ADLs. Furthermore, Cereda et al specifically investigated the relationship between the MNA score and nutritional status with functional status by BI in 123 older people in long term care (24). MNA significantly correlated with BI (r = 0.55, P < 0.0001) and a poorer functional status was associated with low BMI, low MUAMC and reduced oral intake. Hence, this data corroborates findings from our study.
This study suggests that multi-domain screening for nutritional status, muscle mass, frailty and functionality is important in this population group. Regular screening may improve diagnosis and guide treatment opportunities, e.g. nutritional and protein supplementation. Further studies are required to confirm this and to evaluate specific methods e.g. determination of malnutrition prevalence.


Conclusion

This pilot study found that prevalence of malnutrition was dependent on the method used to determine. There was a high prevalence of malnutrition by MNA-SF and FFMI and high levels of muscle wasting by MUAMC and FFMI. Those residents with poor nutritional status (by BMI, MNA-SF and FFMI) had lower muscle mass, greater frailty (by EFS) and worse physical function (by BI). Future studies should be performed to confirm or refute these relationships and their meaning.


Funding: The Bromhead Medical Charity, Lincoln, part-funded this study. The sponsors had no role in the design and conduct of the study; in the collection, analysis, and interpretation of data; in the preparation of the manuscript; or in the review or approval of the manuscript.

Conflict of interest: The authors declare that they have no conflicts of interest.

Statement of Authorship: AS is the lead author and designated study Chief Investigator. GG and TA played key roles in the design and development of the study and in writing of the paper. LS, LW and GW were co-investigators primarily involved in data acquisition.

Acknowledgements: We wish to thank all of the care home staff and residents and the Bromhead Medical Charity, Lincoln.

Ethical standards: Full UK NHS research ethics guidelines were followed in this study.


References

1.    Fried LP, Ferrucci L, Darer J, Williamson JD, Anderson G. Untangling the concepts of disability, Frailty, and Comorbidity: Implications for improved targeting and care. The Journals of Gerontology Series A: Biological Sciences and Medical Sciences. 2004;59(3):M255–M263.
2.    Norman K, Pichard C, Lochs H, Pirlich M. Prognostic impact of disease-related malnutrition. Clinical Nutrition. 2008;27(1):5–15. doi:10.1016/j.clnu.2007.10.007.
3.    Fried LP, Tangen CM, Walston J, Newman AB, Hirsch C, Gottdiener J, et al. Frailty in older adults: evidence for a phenotype. J Gerontol A Biol Sci Med Sci 2001;56:M146-56.
4.    Rubenstein LZ, Harker JO, Salva A, Guigoz Y, Vellas B. Screening for undernutrition in geriatric practice: developing the short-form mini nutritional assessment (MNA-SF). J Geront 2001;56 A:M366–77.
5.    Slee A, Birch D, Stokoe D. A comparison of the malnutrition screening tools, MUST, MNA and bioelectrical impedance assessment in frail older hospital patients. Clin Nutr. 2015; 34(2):296-301. doi: 10.1016/j.clnu.2014.04.013.
6.    Cederholm T, Bosaeus I, Barazzoni R, Bauer J, Van Gossum A, Klek S et al. Diagnostic criteria for malnutrition – An ESPEN consensus statement. Clin Nutr 2015; 34:441-47.
7.    Evans WJ, Morley JE, Argiles J, et al. Cachexia: A new definition. Clin Nutr. 2008; 27: 793-799.
8.    Muscaritoli M, Anker SD,  Argilés J, Aversa Z, Bauer JM, Biolo G et al. Consensus definition of sarcopenia, cachexia and pre-cachexia: joint document elaborated by Special Interest Groups (SIG) “cachexia-anorexia in chronic wasting diseases” and “nutrition in geriatrics”. Clin Nutr. 2010; 29(2): 154-9.
9.    Cruz-Jentoft AJ, Baeyens JP, Bauer JM, Boirie Y, Cederholm T, Landi F et al. Sarcopenia: European consensus on definition and diagnosis: Report of the European Working Group on Sarcopenia in Older People. Age Ageing 2010; 39(4): 412-423.
10.    Evans WJ. Skeletal muscle loss: Cachexia, sarcopenia, and inactivity. American Journal of Clinical Nutrition. 2010;91(4):1123S–1127S.
11.    Von Haehling S, Morley JE, Coats AJS, Anker SD, Rosano G, Bernabei R, K. Kalantar-Zadeh K.  Muscle wasting disease: a proposal for a new disease classification. J Cachexia Sarcopenia Muscle 2014; 5:1–3.
12.    Slee A. Estimating nutritional status in a small cohort of elderly care home residents using MUST, MNA and bioelectrical impedance phase angle and vector analysis. J Aging Res Clin Practice 2013;2(1):65-70.
13.    Slee A. Screening for sarcopenia in a small cohort of elderly care home residents using handgrip strength dynamometry; and bioelectrical impedance assessment of skeletal muscle mass and fat free mass. J Aging Res Clin Practice 2012;1(3):219-224.
14.    Slee, A, Birch D, Stokoe D. The relationship between malnutrition risk and clinical outcomes in a cohort of frail older hospital patients. Clin Nutr ESPEN. 2016; 15: 57 – 62.
15.    Landi F, Russo A, Liperoti R, Pahor M, Tosato M, Capoluongo E et al. Midarm muscle circumference, physical performance and mortality: results from the aging and longevity study in the Sirente geographic area (ilSIRENTE study). Clin Nutr 2010;29(4):441-7.
16.    Rolfson DB, Majumdar SR, Tsuyuki RT, Tahir A and Rockwood K. Validity and reliability of the Edmonton Frail Scale. Age Ageing 2006; 35(5): 526-9.
17.    Collin C, Wade DT, Davies S, Horne V. The Barthel ADL Index: a reliability study. Int Disabil Stud. 1988;10(2):61-63.
18.    Kyle UG, Genton L, Karsegard L, Slosman DO, Pichard C. Single prediction equation for bioelectrical impedance analysis in adults aged 20-94. Nutrition 2001;17:248-53.
19.    Dupuy C, Lauwers-Cances V, Guyonnet S, et al. Searching for a relevant definition of sarcopenia: Results from the cross-sectional EPIDOS study. Journal of Cachexia, Sarcopenia and Muscle. 2015;6(2):144–154. doi:10.1002/jcsm.12021.
20.    Perna S, Francis MD, Bologna C, et al. Performance of Edmonton frail scale on frailty assessment: Its association with multi-dimensional geriatric conditions assessed with specific screening tools. BMC Geriatrics. 2017;17(1).
21.    Villafañe JH, Pirali C, Dughi S, et al. Association between malnutrition and Barthel index in a cohort of hospitalized older adults article information. Journal of Physical Therapy Science. 2016;28(2):607–612.
22.    Serrano-Urrea R, García-Meseguer MJ: Relationships between nutritional screening and functional impairment in institutionalized Spanish older people. Maturitas, 2014, 78: 323–328.
23.    Zuliani G, Romagnoni F, Volpato S, et al. Nutritional parameters, body composition, and progression of disability in older disabled residents living in nursing homes. The Journals of Gerontology Series A: Biological Sciences and Medical Sciences. 2001;56(4):M212–M216.
24.    Cereda E, Valzolgher L, Pedrolli C. Mini nutritional assessment is a good predictor of functional status in institutionalised elderly at risk of malnutrition. Clinical Nutrition. 2008;27(5):700–705.

COMPARISON OF CURRENT SARCOPENIA CLASSIFICATION CRITERIA IN OLDER NEW ENGLAND WOMEN


S.G. Slezak1, K.B Mahoney1, E.N.Renna1, I.E. Lofgren2, F. Xu1, D.L. Hatfield1, M.J. Delmonico1


1. Department of Kinesiology, University of Rhode Island, Kingston, Rhode Island, USA, 02881; 2. Department of Nutrition and Food Sciences, University of Rhode Island, Kingston, Rhode Island, USA, 02881

Corresponding Author: Matthew Delmonico, 25 West Independence Way, Kingston, RI 02881,USA, delmonico@uri.edu, Phone: 401-874-5440
J Aging Res Clin Practice 2017;6:163-167
Published online August 31, 2017, http://dx.doi.org/10.14283/jarcp.2017.21


Abstract

Objectives: To evaluate the prevalence of sarcopenia in a sample of older, sedentary women using criteria from the European Working Group on Sarcopenia in Older People (EWGSOP), the International Working Group (IWG), and the Foundation for the National Institutes of Health Sarcopenia Project (FNIHSP). Design: Cross-sectional analysis. Setting and Participants: Community-dwelling women (n = 61) aged 71.9 ± 4.6 years (mean±SD) with a BMI 27.3 ± 6.0 kg/m2 who by self-report were healthy and did not exercise were recruited and evaluated for sarcopenia. Measurements: Height, weight, grip strength, gait speed, and appendicular lean mass (via segmental multi-frequency bioelectrical impedance analysis: SMF-BIA) were measured. Prevalence was reported using descriptive statistics and a Fisher’s exact test was used to analyze the distribution frequency of sarcopenia classification by different criteria. Results: In this sample 14.8% met EWGSOP criteria, 6.6% met FNIHSP criteria, and 3.3% met IWG criteria. There was a borderline significant difference in distribution frequency between EWGSOP and IWG classification criteria (p=0.053). Conclusion: The variation in sarcopenia prevalence depending on the diagnostic criteria used is consistent with previous research and there are borderline significant differences between classification criteria in this population. These data suggest the need for additional examination to determine current cut points for ALM measured by SMF-BIA, as well as which established definition of sarcopenia is appropriate for this population.

Key words: Sarcopenia, older, women, bioelectrical impedance analysis, appendicular lean mass.


Introduction

Sarcopenia is the progressive, naturally occurring loss of lean muscle mass that accompanies the aging process (1). Decreases in lean muscle mass have been associated with reduced physical function, osteoporosis, and loss of independence (2-4). The estimated sarcopenia related health care costs in 2000 were $18.5 billion, with $7.7 billion attributed to women, and costs continue to rise (5-8). Furthermore, US census population estimates project that by 2050 the amount of US adults over the age of 65 will double (9). The increasing healthcare costs and growing population present a serious public health problem and especially for older women as there are more women over the age of 65 (9, 10). Therefore, early detection and intervention methods are critical to alleviate the chronic effects of this condition in older women.
The prevalence of sarcopenia has previously been reported using different diagnostic criteria, and has ranged from 1-30% in samples of older community-dwelling women (11-13). However, lack of agreement among criteria presents challenges for clinicians and researchers attempting to identify sarcopenic individuals. Recently, three sets of diagnostic criteria for sarcopenia have been developed by the European Working Group on Sarcopenia in Older People (EWGSOP), the International Working Group (IWG), and the Foundation for the National Institutes of Health Sarcopenia Project (FNIHSP) (14-17). These criteria include measures of lean mass, physical function, and/or muscular strength. However, these criteria do not use consistent variables and cut points for quantifying lean mass and physical functioning, and lack overall agreement.
Few studies have reported the prevalence of sarcopenia in older community dwelling women using these three sets of diagnostic criteria. However, in 2014 Dam et al. conducted a comparison of EWGSOP, IWG, and FNIHSP sarcopenia classification criteria among the FNIHSP cohort and found large variations in prevalence depending on the classification criteria used (18). While that was a thorough investigation, participants were not recruited based on their physical activity levels and it is unclear if prevalence estimates will vary in a sedentary cohort. Therefore, the purpose of this study was to report and compare the prevalence of sarcopenia using EWGSOP, IWG, and FNIHSP criteria in a sample of older, sedentary, community-dwelling Rhode Island women.


Methods

Study Design and Participants

To evaluate sarcopenia prevalence, a cross-sectional analysis was performed among a sample of older, community-dwelling Rhode Island women who were recruited for an intervention trial through talks and posters at local community and senior centers, and through word of mouth. Initial screening was conducted via telephone interview to include women who were postmenopausal, aged 65-84 years, and by self-report were not involved in a regular exercise program or participation in physical activities outside of activities of daily living. Reasons for study exclusion included failure to provide informed consent, inability to speak and read English, diagnosed cognitive impairment, and the inability to safely engage in mild to moderate intensity exercise. Participants with recent major joint, vascular, abdominal or thoracic surgery were excluded. Participants who self-reported clinically diagnosed cardiovascular disease, pulmonary disease, or with an implanted pacemaker or defibrillator were excluded. Also, participants with uncontrolled diabetes, hypertension, or anemia were excluded. Any participants who reported medication changes within 3 weeks or changes to lipid lowering medication within 6 months were excluded. Trained study staff members performed all components of data collection.
Eligible participants read and signed informed consent and also completed a teach-back process, which required participants to explain learned information on the consent form back to a study staff member to ensure informed consent. Anthropometric data were then collected followed by tests to evaluate participants’ body composition, muscular strength, and gait speed. All aspects of this study took place in the Kinesiology Department on the campus of the University of Rhode Island, Kingston, Rhode Island, USA. This study was approved by the Institutional Review Board of the University of Rhode Island.

Anthropometrics

Height was measured without shoes to the nearest 0.1 cm using a Seca wall mounted stadiometer and body weight was measured without shoes to the nearest 0.1 kg using a Seca balance beam scale (Seca, Chino, CA). Height and weight were measured in duplicate and averages were used to calculate body mass index (BMI).

Body Composition

Whole and regional body composition was measured via segmental multi-frequency bioelectrical impedance analysis (SMF-BIA) using an Inbody 570 Biospace device (Biospace Co, Ltd, Korea) according to the manufacturer’s guidelines. Participants were asked to be fully hydrated, fasted for > 4 hours, and to void their bladder prior to the test. Appendicular lean mass (ALM) was calculated as the sum of lean mass in both arms and legs and expressed in kg. In accordance with EWGSOP and IWG criteria, ALM was adjusted for height expressed as meters squared, while according to FNIHSP criteria ALM was adjusted for BMI.

Muscular Strength

Isometric handgrip strength has been documented as a safe and effective method of predicting total body strength and future disability (19, 20). Muscular strength was measured via grip strength from a seated position using a Jamar Hydraulic Hand Dynamometer (J.A. Preston, Corp., Jackson, MS). Participants completed two trials per hand and the highest overall score from either hand (kg) was used for sarcopenia classification.

Gait Speed

Gait speed is an easily assessed measure that has been shown to be predictive of future disability (21). To evaluate gait speed, participants were instructed to walk a 4-meter distance at their normal walking pace (22). Two trials were completed and the fastest time (meters/sec) was used for sarcopenia classification.

Sarcopenia Classification

Sarcopenia was classified using EWGSOP, IWG, and FNIHSP criteria published previously (14-16, 18). These criteria are the most prominent among the literature; incorporate symptoms associated with sarcopenia, and have been shown to identify clinically relevant, sarcopenia-induced deficiencies in strength and physical function. The EWGSOP criteria utilize established stages of sarcopenia classification (presarcopenia, sarcopenia, severe sarcopenia), with low ALM/ht2 (< 5.67 kg/m2) and the presence of low gait speed (≤ 0.8 m/s) or low grip strength (< 20 kg) required to be considered sarcopenic. A severe sarcopenia classification requires low ALM/ht2, gait speed, and grip strength (14). Presarcopenia was defined as having low ALM/ht2 only. The IWG criteria utilizes a “yes/no” classification method, requiring individuals to be below established cut points of both gait speed (< 1.0 m/s) and ALM/ht2 (< 5.67 kg/m2) to be considered sarcopenic (15). The FNIHSP also uses established stages of sarcopenia classification: “weak with low lean mass and weak and slow with low lean mass.” In contrast to EWGSOP and IWG criteria, the FNIHSP uses ALM/BMI (< 0.512) to quantify lean mass, while also using differing cut points of gait speed (< 0.8 m/s) and grip strength (< 16 kg) (16). A “weak with low lean mass” classification required participants to be below cut points of ALM/BMI and grip strength, while a “weak and slow with low lean mass” classification required participants to be below cut points of ALM/BMI, grip strength, and gait speed. Participant data were collected and applied to these individual sets of criteria to determine the prevalence of sarcopenia within this sample.
Statistical Analysis
Descriptive statistics were used to report the baseline characteristics (means ± standard deviation) of the cohort and sarcopenia prevalence. A Fisher’s exact test was used to determine the distribution frequency of sarcopenia classification among the different sets of classification criteria. Significance was set at p ≤ 0.05. Statistical analyses were performed using SAS statistical software, version 9.3 (SAS Institute Inc., Cary, NC).


Results

A total of 61 Caucasian women aged 71.9 ± 4.6 years were included in the analyses. Baseline characteristics of the population are presented in Table 1. Thirteen participants were considered sarcopenic. As shown in Table 1, nine (14.8%) participants were considered sarcopenic by EWGSOP criteria, four (6.6%) were considered weak with low ALM/BMI by FNIHSP criteria, and two (3.3%) participants were considered sarcopenic by IWG criteria. Sarcopenia prevalence for all criteria combined was 21.3% with no participant counted more than once. The two participants considered sarcopenic by IWG criteria were also considered sarcopenic by EWGSOP criteria. No other participants were considered sarcopenic by two or more sets of criteria. Additionally, no participants were considered pre-sarcopenic or severely sarcopenic by EWGSOP criteria or weak and slow with low lean mass by FNIHSP criteria. A Fisher’s exact test showed borderline significant differences in distribution frequency between EWGSOP and IWG classification criteria (p=0.053). No significant differences were found between other sets of classification criteria.

Table 1 Baseline characteristics of the population (n=61)

Table 1
Baseline characteristics of the population (n=61)

Data are presented as means ± standard deviations; Abbreviations: BMI = body mass index, ALM = sum of lean mass in both arms and both legs, m/s = meters per second, EWGSOP: European Working Group on Sarcopenia in Older People, IWG: International Working Group, FNIHSP: Foundation for the National Institutes of Health Sarcopenia Projet; Participants meeting EWGSOP criteria were sarcopenic (no pre-sarcopenia or severe sarcopenia); Participants meeting FNIHSP criteria had low lean mass and weakness (no low lean mass, weakness, and low physical function); Participants meeting IWG criteria (n=2) also met EWGSOP criteria and are included in that sample (n=9)


Discussion

These data indicate the large variation in sarcopenia prevalence depending on the classification criteria used. Within this sample, sarcopenia prevalence ranged from 3.3% to 14.8% with borderline significant differences in distribution frequency between EWGSOP and IWG criteria. This wide variation in prevalence is consistent with the findings of Cruz-Jentoft et al. (2014), who through systematic review found sarcopenia prevalence in community-dwelling women ranged from 1-30% when estimated using EWGSOP criteria (13). However, the authors expressed difficulty in comparing results of many studies due to inconsistent methodologies used in studies included in their review. In comparison, Patel et al. (2015) applied EWGSOP criteria to data from the Hertfordshire Cohort Study, which included 1,022 older women (23). While the baseline characteristics of that cohort closely resemble those of our sample, that study reported a 7.9% sarcopenia prevalence compared to our result of 14.8% using EWGSOP criteria. While those differences may be attributed to sample size, it may also be due to differences in grip strength. That study reported a mean grip strength of 26.3 kg while our results show a mean grip strength of only 17.6 kg, which is below the EWGSOP cut point for weakness in older women. This is consistent with the findings of Beaudart et al. (2014) who found grip strength criteria to largely influence sarcopenia prevalence (24). While there are considerably more data regarding sarcopenia prevalence using EWGSOP criteria, few studies have utilized IWG and/or FNIHSP criteria. However, Dam et al. in 2014 applied FNIHSP, IWG, and EWGSOP criteria to data collected from 2,950 older women through 9 different studies. That analysis found 2.3% of women to be weak and slow by FNIHSP criteria, 11.8% were sarcopenic by IWG criteria, and 13.3% were sarcopenic by EWGSOP criteria (18). Those researchers also noted that participants that had low lean mass by the ALM/BMI method were heavier with larger BMIs compared to those with low ALM/ht2. Our findings agree with those results, as every participant in our study who fell below the ALM/BMI cut-point had a BMI > 30 kg/m2. These results suggest that the FNIHSP criteria may be more effective at identifying sarcopenia in obese populations, while EWGSOP and IWG criteria may be more appropriate in non-obese populations. While our prevalence results vary with the findings of Dam et al. (18), possibly due to differences in sample size, it is evident that EWGSOP criteria consistently classify greater percentages of older women as sarcopenic when compared to FNIHSP and IWG criteria, and ALM adjusted for BMI may be the more effective method of identifying sarcopenia in obese, older women.
Reasons for variations in prevalence have recently been investigated by Masanés et al. (2016), who found that modification of EWGSOP lean mass cut points greatly varied sarcopenia prevalence, while modifying grip strength and gait speed cut points elicited little change in prevalence (25). However, those findings suggest that a large percentage of this population may have already been below the cut points for grip strength, as a combination of low ALM and weakness is required for a sarcopenia diagnosis by EWGSOP criteria.
Consequently our data show that the majority of participants considered sarcopenic by EWGSOP criteria had low ALM and weakness (n = 9), while no participants had low ALM accompanied with low gait speed. This also explains our low prevalence reported when using IWG criteria, which omits grip strength, and has a more liberal gait speed cut point. This suggests that inclusion of grip strength in sarcopenia diagnostic criteria may result in relatively higher prevalence estimates, and further screening for hand ailments (i.e. arthritis) may be necessary for accurate sarcopenia classification.
While the EWGSOP criteria are most prevalent within the literature, it does not take fat or body mass into consideration and may fail to classify those with sarcopenic obesity, as shown in our results (2). Moreover, the FNIHSP criteria may be ideal for the older female population as following menopause women typically experience increases in fat mass, which could prevent diagnosis by EWGSOP or IWG criteria (26). Our results underscore the discrepancies between different sets of sarcopenia classification criteria and therefore, inclusion of multiple sets of criteria may simplify the comparison of results and aid in determining population appropriate diagnostic criteria.
A small sample size, and a low number of participants who met classification criteria limited this study. A further limitation was the use of SMF-BIA to assess ALM rather than dual-energy x-ray absorptiometry (DXA). However, SMF-BIA has been found to be agreeable with DXA for measuring ALM in women, and BIA specific ALM/ht2 cut points presented by the EWGSOP were developed using prediction equations not applicable to the InBody 570 device (27, 28). Despite limitations, this study is novel in that EWGSOP, IWG, and FNIHSP criteria were all applied to the same sample of older, sedentary women from the same community. This allowed for the comparison of criteria without the need to adjust for sex, ethnicity, or activity levels. This study demonstrates the variability and limitations of current sarcopenia classification criteria, especially in obese individuals, and indicates the need for future research to develop current, criteria-appropriate cut-points for the measurement of ALM by SMF-BIA in this population to complement these findings.


Funding: This study was funded by the University of Rhode Island College of Human Sciences and Services.

Conflict of Interest: Matthew Delmonico has received research grants from the University of Rhode Island. All other authors report no conflicts of interest.

Ethical Approval: All procedures performed in studies involving human participants were in accordance with the ethical standards of the institutional and/or national research committee and with the 1964 Helsinki declaration and its later amendments or comparable ethical standards.

Informed consent: Informed consent was obtained from all individual participants included in the study.


References

1. Morley JE, Baumgartner RN, Roubenoff R, Mayer J, Nair KS. Sarcopenia. J Lab Clin Med 2001;137:231-243.
2. Newman AB, Kupelian V, Visser M, Simonsick E, Goodpaster B, Nevitt M, Kritchevsky SB, Tylavsky FA, Rubin SM, Harris TB et al. Sarcopenia: alternative definitions and associations with lower extremity function. J Am Geriatr Soc 2003;51:1602-1609.
3. Batsis JA, Mackenzie TA, Barre LK, Lopez-Jimenez F, Bartels SJ. Sarcopenia, sarcopenic obesity and mortality in older adults: results from the National Health and Nutrition Examination Survey III. Eur J Clin Nutr 2014;68:1001-1007.
4. Delmonico MJ, Beck DT. The Current Understanding of Sarcopenia: Emerging Tools and Interventional Possibilities. American Journal of Lifestyle Medicine, 2015.
5. Janssen I, Shepard DS, Katzmarzyk PT, Roubenoff R. The healthcare costs of sarcopenia in the United States. J Am Geriatr Soc 2004;52:80-85.
6. Antunes AC, Araújo DA, Veríssimo MT, Amaral TF. Sarcopenia and hospitalisation costs in older adults: a cross-sectional study. Nutrition & Dietetics, 2016.
7. Mijnarends D, Schols J, Halfens R, Meijers J, Luiking Y, Verlaan S, Evers S. Burden-of-illness of Dutch community-dwelling older adults with sarcopenia: Health related outcomes and costs. European Geriatric Medicine 2016;7:276-284.
8. Sousa A, Guerra R, Fonseca I, Pichel F, Ferreira S, Amaral T. Financial impact of sarcopenia on hospitalization costs. Eur J Clin Nutr 2016;70:1046-1051.
9. Administration on Aging, 2014. Projected Future Growth of the Older Population. U.S. Administration for Community Living. http://www.aoa.acl.gov/aging_statistics/future_growth/future_growth.aspx#age. Accessed 11/202016.
10. Borst SE. Interventions for sarcopenia and muscle weakness in older people. Age Ageing 2004;33:548-555.
11. Wen X, An P, Chen WC, Lv Y, Fu Q. Comparisons of sarcopenia prevalence based on different diagnostic criteria in Chinese older adults. J Nutr Health Aging 2015;19:342-347.
12. Tichet J, Vol S, Goxe D, Salle A, Berrut G, Ritz P. Prevalence of sarcopenia in the French senior population. J Nutr Health Aging 2008;12:202-206.
13. Cruz-Jentoft AJ, Landi F, Schneider SM, Zuniga C, Arai H, Boirie Y, Chen LK, Fielding RA, Martin FC, Michel JP et al. Prevalence of and interventions for sarcopenia in ageing adults: a systematic review. Report of the International Sarcopenia Initiative (EWGSOP and IWGS). Age Ageing 2014;43:748-759.
14. Cruz-Jentoft AJ, Baeyens JP, Bauer JM, Boirie Y, Cederholm T, Landi F, Martin FC, Michel JP, Rolland Y, Schneider SM et al. Sarcopenia: European consensus on definition and diagnosis: Report of the European Working Group on Sarcopenia in Older People. Age Ageing 2010;39:412-423.
15. Fielding RA, Vellas B, Evans WJ, Bhasin S, Morley JE, Newman AB, Abellan van Kan G, Andrieu S, Bauer J, Breuille D et al. Sarcopenia: an undiagnosed condition in older adults. Current consensus definition: prevalence, etiology, and consequences. International working group on sarcopenia. J Am Med Dir Assoc 2011;12:249-256.
16. Studenski SA, Peters KW, Alley DE, Cawthon PM, McLean RR, Harris TB, Ferrucci L, Guralnik JM, Fragala MS, Kenny AM et al. The FNIH sarcopenia project: rationale, study description, conference recommendations, and final estimates. J Gerontol A Biol Sci Med Sci 2014;69:547-558.
17. McLean RR, Shardell MD, Alley DE, Cawthon PM, Fragala MS, Harris TB, Kenny AM, Peters KW, Ferrucci L, Guralnik JM et al. Criteria for clinically relevant weakness and low lean mass and their longitudinal association with incident mobility impairment and mortality: the foundation for the National Institutes of Health (FNIH) sarcopenia project. J Gerontol A Biol Sci Med Sci 2014;69:576-583.
18. Dam TT, Peters KW, Fragala M, Cawthon PM, Harris TB, McLean R, Shardell M, Alley DE, Kenny A, Ferrucci L et al. An evidence-based comparison of operational criteria for the presence of sarcopenia. J Gerontol A Biol Sci Med Sci 2014;69:584-590.
19. Laukkanen P, Heikkinen E, Kauppinen M. Muscle strength and mobility as predictors of survival in 75-84-year-old people. Age Ageing 1995;24:468-473.
20. Rantanen T, Guralnik JM, Foley D, Masaki K, Leveille S, Curb JD, White L. Midlife hand grip strength as a predictor of old age disability. JAMA 1999;281:558-560.
21. Guralnik JM, Ferrucci L, Pieper CF, Leveille SG, Markides KS, Ostir GV, Studenski S, Berkman LF, Wallace RB. Lower extremity function and subsequent disability: consistency across studies, predictive models, and value of gait speed alone compared with the short physical performance battery. J Gerontol A Biol Sci Med Sci 2000;55:M221-31.
22. Guralnik JM, Simonsick EM, Ferrucci L, Glynn RJ, Berkman LF, Blazer DG, Scherr PA, Wallace RB. A short physical performance battery assessing lower extremity function: association with self-reported disability and prediction of mortality and nursing home admission. J Gerontol 1994;49:M85-94.
23. Patel HP, White MC, Westbury L, Syddall HE, Stephens PJ, Clough GF, Cooper C, Sayer AA. Skeletal muscle morphology in sarcopenia defined using the EWGSOP criteria: findings from the Hertfordshire Sarcopenia Study (HSS). BMC Geriatr 2015;15:171-015-0171-4.
24. Beaudart C, Reginster JY, Slomian J, Buckinx F, Locquet M, Bruyere O. Prevalence of sarcopenia: the impact of different diagnostic cut-off limits. J Musculoskelet Neuronal Interact 2014;14:425-431.
25. Masanés F, Rojano iL, Salvà A, Serra-Rexach J, Artaza I, Formiga F, Cuesta F, López Soto A, Ruiz D, Cruz-Jentoft A. Cut-off points for muscle mass — not grip strength or gait speed — determine variations in sarcopenia prevalence. J Nutr Health Aging: 2016;1-5.
26. Ley CJ, Lees B, Stevenson JC. Sex- and menopause-associated changes in body-fat distribution. Am J Clin Nutr 1992;55:950-954.
27. Anderson LJ, Erceg DN, Schroeder ET. Utility of multifrequency bioelectrical impedance compared with dual-energy x-ray absorptiometry for assessment of total and regional body composition varies between men and women. Nutr Res 2012;32:479-485.
28. Mahoney K, 2016. Validation of bioelectrical impedance analysis for the measurement of appendicular lean mass in older women. Open Access Master’s Theses. Paper 845:http://digitalcommons.uri.edu/theses/845.

SARCOPENIA AND SARCOPENIC OBESITY IN OLDER COMMUNITY-DWELLING ADULTS WITH FAVORABLE HEALTH CONDITIONS


E. Ramírez-García1, K. Moreno-Tamayo1, S.C. Briseño-Fabian2, S. Sánchez-García1


1. Unidad de Investigación en Epidemiología y Servicios de Salud, Área Envejecimiento, Centro Médico Nacional Siglo XXI, Instituto Mexicano del Seguro Social (IMSS), Ciudad de México, México; 2. Unidad de Medicina Familiar No.14, Instituto Mexicano del Seguro Social (IMSS), Col. Moctezuma D.F, México.

Corresponding Author: S. Sánchez-García, Unidad de Investigación en Epidemiología y Servicios de Salud, Avenida Cuauhtémoc No. 330, Edificio CORCE. Tercer piso. Col. Doctores, Delegación Cuauhtémoc, Ciudad de México. Código Postal 06725. México, sergio.sanchezga@imss.gob.mx; ssanchezga71@gmail.com.

J Aging Res Clin Practice 2017;6:143-148
Published online August 10, 2017, http://dx.doi.org/10.14283/jarcp.2017.17


Abstract

Objective: Determine the prevalence of sarcopenia and sarcopenic obesity in community-dwelling older adults with favorable health conditions using the diagnostic criteria from the European Working Group on Sarcopenia in Older People (EWGSOP). Design: Cross-sectional study. Setting/Participants: Including 197 older adults representing a population-based sample (n = 1,252) from baseline (year 2014) of the Cohort of Obesity, Sarcopenia and Frailty of Older Mexican Adults (COSFOMA). Measurements: Anthropometric and body composition measurements were performed using bioelectric impedance analysis (BIA). Walking speed was determined with walking time of 4.5 m (<0.8 m/s), grip strength with dynamometer (women <20 kg and men <30 kg) and muscle mass using BIA (muscle mass index: women <6.1 kg/m2 and men <8.5 kg/m2). The cutoff point for low muscle mass was set at 2 SD below average for a group of young adults. For obesity, body fat percentage >60th percentile was considered (38.4% female and 26.7% male). A p value <0.050 was considered statistically significant. Results: Mean age of the 197 older adults (44.2% female and 55.8% male) was 66.4 years (5.6): women 66.6 years (5.6) and men 66.4 years (5.8). The prevalence of sarcopenia was 7.1% (women 6.9% and men 7.2%). The presence of sarcopenic obesity was 2.5% (women 1.1% and men 3.6%). Conclusion: The magnitude of sarcopenia in older adults is important despite the absence of adverse health effects. This finding provides a reference point for future studies.

Key words: Sarcopenia, sarcopenic obesity, low muscle mass, favorable health conditions.


Introduction

The aging process is linked to a physiological decrease in organ function (1). The progressive and involuntary loss of muscle mass and strength known as sarcopenia (2) has become relevant because the condition increases the probability of presenting adverse health outcomes such as falls, physical disability, loss of autonomy, lower quality of life and increased mortality (3, 4). This phenomenon can develop in parallel to obesity, leading to musculoskeletal catabolism and decreased physical performance, which may lead to the development of sarcopenic obesity (SO) (5).
The prevalence of sarcopenia in older adults has presented important variations with values ranging from 0.1%−85.4% attributed to the diagnostic method, cut-off points used, study population and even geographical area, among others (6). Likewise, SO may present variations depending on the frequency with which obesity occurs in the study population (5, 7). In 2010 the European Working Group on Sarcopenia in Older People (EWGSOP) agreed on a practical and diagnostic definition for clinical and research purposes in order to unify measurement methods and to obtain accurate estimates of this disease (2).
A recent systematic review on the prevalence of sarcopenia (8) suggests that ethnicity plays an important role in referring to diagnostic criteria; therefore, it has been recommended to clearly define the profile of the study population.
Because sarcopenia represents multifactorial causality (9), its prevalence can be modified by the epidemiological profile of the study population because of its relationship with other comorbidities. Sarcopenia can occur more frequently in older adults with health challenges than those with favorable health conditions (10). In this sense, it is interesting to study sarcopenia in a population sample of older adults with favorable health conditions because it can serve as a point of comparison for the study of sarcopenia regardless of other unfavorable health conditions. The objective of this study is to determine the prevalence of sarcopenia and SO in older adults with favorable health conditions living in Mexico City using the diagnostic criteria of the EWGSOP.


Methods

Participants

An observational, cross-sectional, population-based study was carried out in adults ≥60 years of age. Subjects were beneficiaries of the Mexican Institute of Social Security (IMSS) and lived in Mexico City. Data represent the baseline (year 2014) of the Cohort of Obesity, Sarcopenia and Frailty of Older Mexican Adults (COSFOMA), which included 1,252 participants with heterogeneous health conditions. Participants were chosen through a simple random selection from a master frame of the 48 Family Medicine Units (FMU) of the IMSS in Mexico City (11).
Sample size for determination of the prevalence of sarcopenia was calculated assuming that 33% of the older adults presented sarcopenia (12), with an accuracy of ±2% and a 95% confidence interval. The minimum sample size was 857 older adults.
A subsample of older adults with favorable health conditions was selected for the study according to the following inclusion criteria: functional capacity, well-conserved cognitive and nutritional status (evaluated from the Barthel Index >90 points, Mini-Folstein Mental State Examination ≥25 or ≥19 in illiterate subjects, Mini-Nutritional Assessment ≥24, respectively) and good self-perceived health. Exclusion criteria were those subjects with comorbidities included in the Elixhauser index, polypharmacy (≥3 medications), hospital admissions in the last year, depressive symptoms and anxiety (≥16 points in the revised version of the Center for Epidemiologic Studies Depression CESD-R; ≥23 points on the Short Anxiety Screening Test in Seniors, SAST, respectively). Also excluded were those subjects who presented a history of fracture(s) in the upper or lower limbs, use of pacemakers, or those who intentionally presented weight loss (≥3 kg in the last year, in addition to having detection and control of overweight or obesity by health personnel). Participants without electrical bioimpedance (BIA) data were eliminated.
The subsample consisted of 197 older subjects with favorable health conditions who had standardized anthropometric measurements (weight and height) and body composition as well as sociodemographic information (age and gender).

Evaluation of sarcopenia and SO

Sarcopenia was evaluated based on the criteria proposed by the EWGSOP, measuring muscle mass (MM) using BIA with RJL Systems BIA 101, walking speed (WS) by 4.5 m walking time (usual pace) and grip strength (GS) with Takei TKK 5001 dynamometer (Takei Scientific Instruments Co. Ltd., Tokyo, Japan).
The presence of low MM defined as muscle mass index (MMI) was <6.1 kg/m2 in women and <8.5 kg/m2 in men. The cutoff point for low MM was set at 2 SD below the gender-specific mean of a group of young Mexican adults (Table 1); low WS <0.8 m/s; low GS <20 kg women and <30 kg in men. In addition, the severity of sarcopenia was classified as severe if it fulfilled three criteria, moderated by at least two criteria (low MM, lower WS or GS) and presarcopenia with only low MM. SO was defined based on the EWGSOP criteria plus high body fat percentage (BFP) ( >60th percentile by gender and assessed by BIA). Figure 1 shows the evaluation process for the mentioned criteria.


Table 1 Characteristics of the sample of young Mexican adults (18-40 years)

Table 1
Characteristics of the sample of young Mexican adults (18-40 years)

SD, standard deviation; MMI, muscle mass index. †Statistical value (Student t test for independent samples).


Figure 1 Diagnostic algorithm of sarcopenia and sarcopenic obesity (SO)

Figure 1
Diagnostic algorithm of sarcopenia and sarcopenic obesity (SO)

FHC, older adults with favorable health conditions; ↓MM, low muscle mass index; ↓WS, low walking speed; ↓GS, low grip strength; BFP >P60, body fat percentage >60th percentile.


BIA was performed with a standard technique using a single frequency of 50 kHz. Four electrodes were placed in a distal position (two electrodes at the hand level and two electrodes at the ipsilateral foot) in supine position and with the lower limbs in abduction at 45° and the upper limbs at 30° abduction. After analysis, the values of resistance and reactance were recorded. MM was calculated using the formula of Jansenn et al. (11).

Statistical analysis

Frequencies were calculated for qualitative variables and mean and SD for quantitative variables. For comparison of proportions, Χ2 test or Fisher test was performed and mean comparison using the Student t test for independent samples. Pearson correlation was calculated to determine the relationship between the quantitative variables of the diagnostic criteria of sarcopenia and SO (MMI, WS, GS and BFP); p value <0.050 was considered statistically significant. Data were analyzed using the IBM-SPSS 23 program (SPSS Inc., Chicago, IL) for Windows.


Results

The group of older adults with favorable health conditions was comprised of 197 subjects of whom 44.2% were women and 55.8% were men. Mean age was 66.4 (5.6) years; women 66.6 (5.6) and men 66.4 (5.8). There was no significant difference in age between men and women (p=0.835). Regarding the sarcopenia criteria, 13.2% presented low MM, 10.3% female and 15.5% male, p=0.293; low WS 12.2%, 11.8% women, 12.5% men, p=0.896, and low GS 51.8%, 56.3% women, 48.1% men, p=0.256. The mean of the BFP estimate for the entire sample was 30.0 (8.1), 35.6 women and 25.6 men, p <0.001. The 60th percentile for BFP was 31.7%, 38.4% female and 26.7% male. In Table 2, the main anthropometric characteristics and physical performance of the study sample are presented. The correlation among the three criteria and the BFP was low to moderate. In all cases it was statistically significant (p <0.050).

Table 2 Anthropometric characteristics and physical performance of community-dwelling older adults with favorable health conditions in Mexico City

Table 2
Anthropometric characteristics and physical performance of community-dwelling older adults with favorable health conditions in Mexico City

SD, standard deviation; MM, muscle mass; MMI, muscle mass index; WS, walking speed; GS, grip strength; BFP, body fat percentage. †Statistical value of Student t test (for independent variables).


The different combinations of the diagnostic criteria for sarcopenia as well as their respective prevalences are shown in Table 3. The overall prevalence of sarcopenia was 7.1%, women 6.9% and men 7.3%; however, no statistically significant differences were found (p=0.919). The combination of criteria with a higher prevalence was low MM + GS (4.6%) followed by low MM + GS + WS (1.5%) and, finally, low MM + WS (1%). The low GS + WS group had a frequency of 12.2%. When comparing the different combinations between men and women of the EWGSOP criteria in low MM + GS + WS (p=0.256); low MM + WS (p=1.000); low MM + GS (p=0.481), no statistically significant differences were observed.

Table 3 Frequency and distribution of criteria patterns for diagnosis of sarcopenia proposed by the EWGSOP in a sample of community-dwelling older adults with favorable health conditions in Mexico City

Table 3
Frequency and distribution of criteria patterns for diagnosis of sarcopenia proposed by the EWGSOP in a sample of community-dwelling older adults with favorable health conditions in Mexico City

†Fisher exact test; *Χ2; MM, muscle mass; WS, walking speed; GS, grip strength; SO, sarcopenic obesity; Y, criteria present; N, criteria absent, respectively; a. Severe sarcopenia; b. Moderate sarcopenia; c. Presarcopenia.


The group most affected by sarcopenia was that with the oldest age (≥80 years) with a prevalence greater than double (16.7%) compared to the group of 60−69 years (6.9%), which was very similar to the intermediate group of 70−79 years (6.5%); however, no statistically significant differences were found between these groups (p >0.050).
Frequency and distribution of the severity of sarcopenia by gender and age groups is shown in Table 4. The severity group where the highest prevalence was found was moderate sarcopenia (5.6%). It should be noted that the presarcopenia group also had an important prevalence (6.1%). When analyzing severity by gender, a pattern was observed in women as follows: severe 0%, moderate 6.9%, presarcopenia 3.4%. However, in men the frequency of severe sarcopenia was 2.7%, moderate 4.5%, and 8.2% presarcopenia, respectively. Comparison by gender was not statistically significant (p >0.050); 2.5% of the entire sample met the criteria of sarcopenic obesity, 1.1% in women and 3.6% in men without significant differences (p=0.270).

Table 4 Frequency and distribution according to sex and age group of the severity of sarcopenia in community-dwelling older adults with favorable health conditions according to the EWGSOP

Table 4
Frequency and distribution according to sex and age group of the severity of sarcopenia in community-dwelling older adults with favorable health conditions according to the EWGSOP

EWGSOP, European Working Group on Sarcopenia in Older People; †Fisher exact test; * Chi-cuadrada.


Discussion

In older adults with favorable health conditions, 7/100 have sarcopenia without a gender predominance, suggesting that sarcopenia similarly affects women and men with favorable health conditions.
In this study the findings were within the range (1%−29%) reported in the literature in older people who were evaluated for sarcopenia from the criteria proposed by the EWGSOP (8). It should be noted that the prevalence of sarcopenia in studied populations may be affected by the health conditions of older adults. To our knowledge, only one study in Latin America adheres to the EWGSOP criteria and, in particular, to the recommendations for the measurement of muscle mass. This study was performed in a population ≥60 years of age living in the Brazilian urban community (14). A general prevalence was reported of 15.4% (16.1% in women and 14.4% in men). In this study, the prevalence by gender did not show statistically significant differences as in the present study. It should be mentioned that, in the Brazilian study, multiple adverse health effects were included in the analyzed sample, which could be attributed to a higher prevalence.

A study carried out in Spain (12) with an adult community-dwelling population 70−80 years of age characterized as “healthy” evaluated the prevalence of sarcopenia based on the criteria proposed by the EWGSOP. This study reported sarcopenia prevalence of 33% for women and 10% for men. Comparing this with the findings of the present study, the prevalence in men is similar; however, that of women is only slightly more than threefold. It should be pointed out that, in both studies, control of adverse health effects was considered to characterize a sample of older adults in the best health conditions; however, they differ in the prevalences found in females. This may be due to the fact that the Spanish population included adults older than those in the present study and, in addition, simple selection was based on less rigorous criteria that could allow inclusion of some health deficits. It is also thought that this difference may be related to the biological characteristics in which the expression of various biological markers associated with the pathophysiology of sarcopenia is implicated (15-18) and will depend on the genetic components present in the individuals of each study population. Together these present a series of interactions with characteristics of the external environment such as the geographic or regional area, culture, habits and lifestyles that can facilitate the series of events that trigger the pathological process of sarcopenia.
The proportion of presarcopenia is striking because this resembles that of general sarcopenia. This group is of special interest for its follow-up because it meets the criterion of low MM and is the most susceptible to change to a diagnosis of sarcopenia. In the future this could represent the increase in the number of cases with the deleterious effects that it entails. When observing the prevalence of presarcopenia by gender, no difference was found between women and men. There are probably data indicating that gender plays an important role, at least in this group of presarcopenic individuals. Therefore, gender-specific biological characteristics may be present during the development of sarcopenia.
For SO, a prevalence of 2.5% was found in the general population, being more than threefold as high in men as in women (3.6% and 1.1%, respectively). Worldwide prevalence of SO ranges from 3.6−94.0% (19-21). Currently, several methodologies are used for its measurement without agreement (19). This has allowed wide variations in its measurement, considering the different characteristics of the study population.
In the present study the prevalence of SO was low and no difference was found according to gender. This idea reinforces the principle that if the sample was expanded it would possibly show significant statistical differences and may point to a greater affection in males in the analyzed population. The group with severe sarcopenia had a similar behavior where males were the most affected. According to these findings, the most complex forms of sarcopenia occur in males. In addition to this, the prevalence found is low compared to that reported in other studies and may be due to the fact that the analyzed study sample had favorable health conditions. This fact conditioned the selection of those with the least exposure to factors that could influence the appearance of this disease.
Another group of interest was the group who presented low GS + WS because it had a prevalence of 12.2%. This group presents two of the criteria for the diagnosis of sarcopenia without the condition of low MM. It is not classified as sarcopenia, but it is striking because these criteria are also considered for the diagnosis of frailty according to the Fried model (22). Therefore, a potential diagnosis of frailty for this group could be suspected. This group appears to represent the limit between the diagnoses of sarcopenia and frailty. Based on this, its identification would suggest a priority follow-up group for the diagnosis of frailty or sarcopenia because it demonstrates high potential for outcome for either pathological entity. However, these findings are only suggestive and would require longitudinal studies to explore these aspects.
It was considered important to control the sample for the exclusion of multimorbidity and acute disease processes because this allowed greater certainty of the measurement of sarcopenia and the avoidance of the approach of other diseases related to similar pathological processes as in the case of cachexia. Although the selection process of the sample based on the criteria allows sarcopenia to be analyzed under favorable health conditions, it was also a limitation because it conditioned the reduction in the number of participants in the age groups, mainly in those persons >70 years old. However, the extent of sarcopenia in this age group was observed despite its small size. There was no age trend in sarcopenia, which is consistent with that reported in other studies (12,23-26). However, in the future a more in-depth longitudinal analysis is considered necessary.
Because sarcopenia is an entity that may manifest as one of the outcomes of the interaction of other health states (10,27), analysis of this condition isolated from a large number of factors influencing the occurrence of sarcopenia allows a point of comparison for other investigations. It is worth mentioning that one of the most recommended methods of muscle mass measurement in research (and suggested worldwide) was used because it is one of the most usual, objective and reliable methods and allows us to compare to what has been reported in other regions.
Estimates of sarcopenia and SO were performed from a sample representing >50% of community-dwelling older adults residing in Mexico City and the metropolitan area (28). This population is of great importance because it is one of the geographic areas with the greatest number of elderly inhabitants (29).


Conclusions

The magnitude of sarcopenia in older adults is important despite the absence of adverse health effects. This finding provides a reference point for future studies.


Acknowledgments: We thank the authorities and staff of the South and North Delegations of the Mexican Institute of Social Security (IMSS) of Mexico City for support for this study.

Funding: This work was supported by the Sector Fund Health Research and Social Security SS/IMSS/ISSSTE/CONACYT (México) SALUD-2013-01-201112 and the Fund for the Promotion of Health Research, IMSS, FIS/IMSS/PROT/PRIO/13/024. The funders had no role in the design, execution, analysis and interpretation of data, or writing of the study.

Author Contributions: The following authors contributed to the theme of the study (E.R.-G., S.S.-G), planning analysis (E.R.-G., S.S.-G, K.M.-T) and interpretation of the results (E.R.-G., S.S.-G, K.M.-T, S.C.B.-F.) as well as in the reading and criticism of the writing (E.R.-G., S.S.-G, K.M.-T, S.C.B.-F.). We express that we have read and approved the manuscript and we are in agreement with the final version and the order of the authors (E.R.-G., K.M.-T, S.C.B.-F., S.S.-G).

Conflicts of Interest: The authors declare no conflict of interest in relation to this study.

Ethical standards: The present study adheres to the ethical principles for research in humans according to the original Helsinki Protocol Declaration. The COSFOMA protocol was approved by the National Commission of Scientific Research and Ethics Commission for Health Research (Registration numbers COFEPRIS 13 CI 09 015 213 for the Research Committee and COMBIOETICA 09 CEI 00920160601 for the Research Ethics Committee) of the IMSS. Prior to data collection, written informed consent was requested from each participant.


References

1.    Boss G, Seegmiller J. Age-related physiological changes and their clinical significance. West J Med 1981;135:434-440.
2.     Cruz-Jentoft AJ, Baeyens JP, Bauer JM, Boirie Y, Cederholm T, Landi F, Martin FC, Michel J-P, Rolland Y, Schneider SM, Topinkova E, Vandewoude M, Zamboni M. Sarcopenia: European consensus on definition and diagnosis: Report of the European Working Group on Sarcopenia in Older People. Age Ageing 2010;39:412-423. doi:10.1093/ageing/afq034.
3.     Janssen I, Heymsfield SB, Ross R. Low relative skeletal muscle mass (sarcopenia) in older persons is associated with functional impairment and physical disability. J Am Geriatr Soc 2002;50:889–896.
4.     Janssen I. Skeletal Muscle Cutpoints Associated with Elevated Physical Disability Risk in Older Men and Women. Am J Epidemiol 2004;159:413-421. doi:10.1093/aje/kwh058.
5.     Vincent HK, Raiser SN, Vincent KR. The aging musculoskeletal system and obesity-related considerations with exercise. Ageing Res Rev 2012;11:361-373. doi:10.1016/j.arr.2012.03.002.
6.     Pagotto V, Aparecida-Silveira E. Methods, Diagnostic Criteria, Cutoff Points, and Prevalence of Sarcopenia among Older People. Sci World J 2014:1-11. doi:10.1155/2014/231312.
7.     Bales CW, Ritchie CS. Sarcopenia, Weight Loss, and Nutritional Frailty in the Elderly. Annu Rev Nutr 2002;22:309-323. doi:10.1146/annurev.nutr.22.010402.102715.
8.     Cruz-Jentoft AJ, Landi F, Schneider SM, Zuniga C, Arai H, Boirie Y, Chen L-K, Fielding RA, Martin FC, Michel J-P, Sieber C, Stout JR, Studenski SA, Vellas B, Woo J, Zamboni M, Cederholm T. Prevalence of and interventions for sarcopenia in ageing adults: a systematic review. Report of the International Sarcopenia Initiative (EWGSOP and IWGS). Age Ageing 2014;43:748-759. doi:10.1093/ageing/afu115.
9.     Fielding RA, Vellas B, Evans WJ, Bhasin S, Morley JE, Newman AB, Abellan van Kan G, Andrieu S, Bauer J, Breuille D, Cederholm T, Chandler J, De Meynard C, Donini L, Harris T, Kannt A, Keime Guibert F, Onder G, Papanicolaou D, Rolland Y, Rooks D, Sieber C, Souhami E, Verlaan S, Zamboni M. Sarcopenia: An Undiagnosed Condition in Older Adults. Current Consensus Definition: Prevalence, Etiology, and Consequences. International Working Group on Sarcopenia. J Am Med Dir Assoc 2011;12:249-256. doi:10.1016/j.jamda.2011.01.003.
10.     Beaudart C, Rizzoli R, Bruyère O, Reginster J-Y, Biver E. Sarcopenia: burden and challenges for public health. Arch Public Health 2014;72. doi:10.1186/2049-3258-72-45.
11.     Doubova S, Sánchez-García S, Infante-Castañeda C, Pérez-Cuevas R. Factors associated with regular physical exercise and consumption of fruits and vegetables among Mexican older adults. BMC Public Health 2016;9:952. doi:10.1186/s12889-016-3628-2.
12.     Masanes F, Culla A, Navarro-Gonzalez M, Navarro-Lopez M, Sacanella E, Torres B, Lopez-Soto A. Prevalence of sarcopenia in healthy community-dwelling elderly in an urban area of Barcelona (Spain). J Nutr Health Aging 2012;16:184-187.
13.     Janssen I, Heymsfield SB, Baumgartner RN, Ross R. Estimation of skeletal muscle mass by bioelectrical impedance analysis. J Appl Physiol 2000;89:465–471.
14.     Alexandre T da S, Duarte YA de O, Santos JLF, Wong R, Lebrão ML. Prevalence and associated factors of sarcopenia among elderly in Brazil: findings from the SABE study. J Nutr Health Aging 2014;18:284-290. doi:10.1007/s12603-013-0413-0.
15.     Cesari M, Fielding RA, Pahor M, Goodpaster B, Hellerstein M, Van Kan GA, Anker SD, Rutkove S, Vrijbloed JW, Isaac M, Rolland Y, M’Rini C, Aubertin-Leheudre M, Cedarbaum JM, Zamboni M, Sieber CC, Laurent D, Evans WJ, Roubenoff R, Morley JE, Vellas B. Biomarkers of sarcopenia in clinical trials-recommendations from the International Working Group on Sarcopenia. J Cachexia Sarcopenia Muscle 2012;3:181-190. doi:10.1007/s13539-012-0078-2.
16.     Kalinkovich A, Livshits G. Sarcopenia – The search for emerging biomarkers. Ageing Res Rev 2015;22:58-71. doi:10.1016/j.arr.2015.05.001.
17.     Calvani R, Marini F, Cesari M, Tosato M, Anker SD, von Haehling S, Miller RR, Bernabei R, Landi F, Marzetti E, the SPRINTT consortium. Biomarkers for physical frailty and sarcopenia: state of the science and future developments: Biomarkers for physical frailty and sarcopenia. J Cachexia Sarcopenia Muscle 2015;6:278-286. doi:10.1002/jcsm.12051.
18.     Scharf G, Heineke J. Finding good biomarkers for sarcopenia. J Cachexia Sarcopenia Muscle 2012;3:145-148. doi:10.1007/s13539-012-0081-7.
19.     Batsis JA, Barre LK, Mackenzie TA, Pratt SI, Lopez-Jimenez F, Bartels SJ. Variation in the Prevalence of Sarcopenia and Sarcopenic Obesity in Older Adults Associated with Different Research Definitions: Dual-Energy X-Ray Absorptiometry Data from the National Health and Nutrition Examination Survey 1999–2004. J Am Geriatr Soc 2013;61:974-980. doi:10.1111/jgs.12260.
20.     Lim S, Kim JH, Yoon JW, Kang SM, Choi SH, Park YJ, Kim KW, Lim JY, Park KS, Jang HC. Sarcopenic Obesity: Prevalence and Association With Metabolic Syndrome in the Korean Longitudinal Study on Health and Aging (KLoSHA). Diabetes Care 2010;33:1652-1654. doi:10.2337/dc10-0107.
21.     Batsis JA, Mackenzie TA, Barre LK, Lopez-Jimenez F, Bartels SJ. Sarcopenia, sarcopenic obesity and mortality in older adults: results from the National Health and Nutrition Examination Survey III. Eur J Clin Nutr 2014;68:1001-1007. doi:10.1038/ejcn.2014.117.
22.     Fried LP, Tangen CM, Walston J, Newman AB, Hirsch C, Gottdiener J, Seeman T, Tracy R, Kop WJ, Burke G, others. Frailty in older adults evidence for a phenotype. J Gerontol A Biol Sci Med Sci 2001;56:M146–M157.
23.     Baumgartner RN, Koehler KM, Gallagher D, Romero L, Heymsfield SB, Ross RR, Garry PJ, Lindeman RD. Epidemiology of sarcopenia among the elderly in New Mexico. Am J Epidemiol 1998;147:755–763.
24.     Chien M-Y, Huang T-Y, Wu Y-T. Prevalence of Sarcopenia Estimated Using a Bioelectrical Impedance Analysis Prediction Equation in Community-Dwelling Elderly People in Taiwan: PREVALENCE OF SARCOPENIA IN TAIWAN. J Am Geriatr Soc 2008;56:1710-1715. doi:10.1111/j.1532-5415.2008.01854.x.
25.     Tichet J, Vol S, Goxe D, Salle A, Berrut G, Ritz P. Prevalence of sarcopenia in the French senior population. J Nutr Health Aging 2008;12:202-206.
26.     Cuesta F, Formiga F, Lopez-soto A, Masanes F, Ruiz D, Artaza I, Salvà A, Serra-Rexach JA, Rojano I Luque X, Cruz-Jentoft AJ. Prevalence of sarcopenia in patients attending outpatient geriatric clinics: the ELLI study. Age Ageing 2015;44:807-809. doi:10.1093/ageing/afv088.
27.     Kalyani RR, Corriere M, Ferrucci L. Age-related and disease-related muscle loss: the effect of diabetes, obesity, and other diseases. Lancet Diabetes Endocrinol 2014;2:819-829. doi:10.1016/S2213-8587(14)70034-8.
28.     Instituto Nacional de Salud Pública, 2013. Encuesta Nacional de Salud y Nutrición 2012. Resultados por entidad federativa. Inst Nac Public Healt Mx. Publishing Physics Web. https://www.insp.mx/produccion-editorial/novedades-editoriales/3057-ensanut2012-resultados-entidad-federativa.html. Accessed 26 June 2016
29.     Consejo Nacional de Población C, 2010. México en Cifras. Proyecciones de la Población 2010-2050. Publishing Physics Web. http://www.conapo.gob.mx/es/CONAPO/Proyecciones. Accessed 4 June 2016.

EFFECT OF INCREASED DAILY INTAKE OF PROTEIN, COMBINED WITH A PROGRAM OF RESISTANCE EXERCISES, ON THE MUSCLE MASS AND PHYSICAL FUNCTION OF COMMUNITY-DWELLING ELDERLY WOMEN


H. Mori1, Y. Tokuda2


1. Diabetes Therapeutics and Research Center, University of Tokushima, , Tokushima, Tokushima, Japan; 2. Faculty of Health Science Department, Hyogo University, Hiraoka, Kakogawa, Hyogo, Japan

Corresponding Author: Dr. Hiroyasu Mori, Diabetes Therapeutics and Research Center, University of Tokushima, 3-18-15 Kuramoto, Tokushima, Tokushima 770-8503, Japan, Phone number: +81 886337587, Fax Number: +81 886337589, Email: hiroyam31@gmail.com


J Aging Res Clin Practice 2016;inpress
Published online December 1, 2016, http://dx.doi.org/10.14283/jarcp.2016.124


Abstract

Abstract: Background: In elderly women, significant loss of muscle mass due to declining levels of estrogen secretion is a health concern. Increasing the recommended dietary allowance of protein intake has been included as a general health guideline to prevent age-related sarcopenia. Objectives: To investigate effects of light-to-moderate resistance training combined with increased protein intake on the muscle mass, strength, and physical function of community-dwelling elderly women. Design: The 12-week training program combined weight-bearing and resistance band exercises, performed 3 times per week. Setting: Hyogo Prefecture, in either City K or Town H. Practical Intervention: Women were randomly allocated to three groups: exercise with protein intake adjusted to the recommended daily allowance (RDA) of 1.0–1.1 g/kg body weight/day (MP+EX group); exercise with protein intake adjusted above the RDA level at 1.2–1.3 g/kg body weight/day (HP+EX group); and a control group receiving classroom-based session on nutrition management, with protein intake adjusted to the RDA level (MP group). Measurements: Body weight and physical composition were measured by multi-frequency bioelectrical impedance analysis. Results: Exercise prevented decreases in muscle mass and strength and in performance of physical function tasks (p<0.05). Increasing dietary intake of protein above RDA level increased muscle mass (p<0.01), walking speed (p<0.01) and knee extensor strength (p<0.05). Conclusion: Adjusting protein intake to 1.2–1.3 g/kg body weight/day, in combination with light-to-moderate resistance training, can improve body composition and physical function in elderly women. The result of this study could be effective in lowering the incidence of age-related sarcopenia.

Key words: Community-dwelling elderly, exercise, muscle mass, protein intake, sarcopenia.


Introduction

Aging is associated with a decrease in skeletal muscle mass and strength which leads to limitations in physical activities, increased risk for falls and overall lowering of the quality of life of elderly people (1–7). A specific health concern is the significant loss of muscle mass in elderly women due to declining levels of estrogen secretion (8). The resulting loss of strength is one of the primary factors of the higher incidence of falls in older women, compared to older men. Increasing the recommended dietary allowance of protein intake has been included as a general health guideline to prevent age-related sarcopenia (9-11).
The Japanese recommendations for dietary reference intakes (DRIs) indicate a daily protein intake of 1.0–1.1 g/kg body weight/day for people aged >65 years (12). These DRIs do not include protein intake levels necessary for elderly individuals performing resistance exercises for the purpose of increasing skeletal muscle mass and physical function, knowledge required to optimize outcomes of exercise (13).
According to the Long-Term Care Prevention Service, which aims to increase musculoskeletal system function in the elderly, few elderly individuals practice high-intensity resistance exercises using large-scale training equipment. Moderate-intensity resistance exercises performed using body weight and resistance bands provide an easy way for elderly people to exercise for the purposes of increasing skeletal muscle mass and physical function to prevent sarcopenia. Accordingly, the aim of our study was to evaluate the effectiveness of adjusting total protein intake to levels of 1.2–1.3 g/kg body weight/day, a level exceeding the DRIs, on skeletal muscle mass and physical function in elderly women performing moderate intensity resistance exercises that used their own body weight and resistance bands, thereby preventing sarcopenia.


Methods

Participants

Participants were 151 Japanese women, ≥65 years old, living in Hyogo Prefecture, in either City K or Town H.
With the aim of using the DRI level of protein intake (1.0–1.1 g/kg/day12) as a baseline reference, a dietary survey was used to screen the daily protein intake of prospective participants. Based on this dietary survey, 26 participants were excluded as their total daily protein intake was <1.0 g/kg/day, and 74 participants for a daily protein intake >1.1 g/kg/day. Remaining participants were randomly allocated to three groups of 17 participants: an exercise intervention group with protein intake adjusted to the DRI of 1.0–1.1 g/kg/day (MP+EX group); an exercise intervention group with protein intake adjusted above the DRI at 1.2–1.3 g/kg/day (HP+EX group); and a control group who participated in classroom-based session on nutrition management, with their protein intake adjusted to the DRI of 1.0–1.1 g/kg/day (MP group). A stratified randomization strategy was used to achieve a comparable age distribution across groups. Over the study period, 4 participants withdrew due to family circumstances or poor physical conditioning, 2 participants from the HP+EX group and 2 participants from the MP+EX group. The information from these 4 participants was excluded from analysis, with the final study group formed of 15 participants in the HP+EX group, 15 participants in the MP+EX group, and 17 participants in the MP group (Figure 1).


Figure 1 Flow chart of study participation

Figure 1
Flow chart of study participation

Using participants with a pre-intervention protein intake of 1.0-1.1g/kg body weight/day, we randomly divided the participants into a high protein intake group of 1.2-1.3g/kg body weight/day (HP+EX group) and a moderate protein intake group of the usual 1.0-1.1g/kg body weight/day (MP+EX group) during an intervention of light-to-moderate intensity resistance exercise. We also established a moderate protein intake group of the usual 1.0-1.1 g/kg body weight.

Intervention design

A 12-week program was implemented. Groups HP+EX and MP+EX completed a standardized program of resistance exercise and a nutrition management, with MP group completed a classroom-based program on nutrition.

Measurement of body weight and physical composition

Body weight and physical composition were measured by multi-frequency bioelectrical impedance analysis (In Body 430, Bio Space, Seoul, Korea). The following parameters of body composition were obtained: body mass index (BMI), body fat percentage, lean body mass (LBM), and total limb muscle mass, which was calculated separately for the upper and lower limbs, and for the trunk.

Measurement of physical functions

The following measures of physical function were evaluated: grip strength, knee extension strength, 5-m maximum walking speed, and timed up-and-go (TUG). Grip and knee extension strength were measured by hand held dynamometry (T.K.K5401; Takei Instruments, Tokyo, Japan. μ-tus F-100; ANIMA., Tokyo, Japan). Measures were taken twice, and the maximum value recorded for analysis.

Nutritional survey

A nutritional survey was conducted to document: total energy intake (TEI), total and adjusted protein intake (g/kg/day), total fat intake, and total carbohydrate intake. The survey was complemented by food weighing methods (Excel Eiyou version 5.0; Kenpakusha, Tokyo, Japan). The nutrition questionnaire and weighing were completed for 5 consecutive days before the start of the program, and daily during the 12-week intervention.

Daily activity survey

Participants recorded their daily activity for three consecutive days before the start of the program, with the information used to calculate each participant’s regular physical activity level (PAL). Again, individual interviews were used to complete missing information. The estimated energy requirement (EER) to meet each individual’s PAL was calculated as follows: EER = basal metabolic rate × body weight (kg) × PAL (12).

Exercise intervention

The exercise intervention consisted of a series of body weight resisted and resistance band exercises, performed 3 times per week for 12 weeks. Twice per week, exercises were performed under supervision of an exercise specialist, with participants completing the third session at home.

Resistance exercises

Body weight resisted exercises consisted of the following: abdominal crunches, rising and sitting from a chair; leg extensions; standing heel kicks, and calf raises. Five exercises were also performed with elastic bands (REP BAND; Magister Corporation, Chattanooga, TN): arm curls, pull-ups, leg extensions, squats, and sit-ups. Elastic bands of five difference resistance were used, with the level of resistance individually adjusted using 1 maximum repetition (1RM) testing for the upper and lower limbs prior to the intervention. The resistance load was modified in standardized fashion over the 12-week program as follows: for weeks 1-4, participants performed 2 sets of 10 repetitions each of the body weight resisted exercises and 2 sets of 20 repetitions of the resistance band exercises, at a resistance load of 50% 1RM; for weeks 5-8, participants performed 2 sets of 15 repetitions each of the body weight resisted exercises and 2 sets of 15 repetitions each of the resistance band exercises at 60% 1RM; and for weeks 9-12, participants performed 3 sets of 15 repetitions each of the body weight resisted exercises and 3 sets of 12 repetitions each of the resistance band exercises at 70% 1RM.

Nutritional intervention

Total protein intake in the HP+EX group was adjusted to a daily level of 1.2–1.3 g/kg/day. Participants’ were advised to increase their protein intake in their standard meals (breakfast, lunch, and dinner). The total protein intake for participants in the MP+EX and MP groups was adjusted to 1.0–1.1 g/kg/day.

Nutritional management

Nutritional management was provided by a nutritionist, based on the DRIs (14) and results of the nutrition survey conducted before the intervention. Nutritional management was provided according to the following schedule: once to all participants prior to the onset of the study; as part of the group nutrition guidance sessions in intervention weeks 1-2; and on an individual basis, twice per week, for intervention weeks 3-12. At these individual sessions, protein intake was verified to ensure compliance with group-specific levels. Daily activity surveys were also reviewed to ensure sufficient TEI for all participants.

Statistical analysis

Individual changes in EER and TEI, pre- and post-intervention, were evaluated using paired t-test analysis. Between-group differences in outcome variables, measured pre- and post-intervention, were evaluated using two-way analysis of variance (ANOVA). Changes in measured outcomes of muscle mass, physical function, and nutrient intake were evaluated between groups (HP+EX, MP+EX and MP) and time (pre- and post-intervention) using a repeated measures ANOVA with group as an independent factor and time as the repeated factor. For identified main effects and interactions, multiple comparisons were performed using the Tukey post hoc analysis, with specific change in pre- and post-intervention values compared using an unpaired one-way ANOVA. All statistical analyzes were performed using IBM SPSS statistical software (IBM, Tokyo, Japan), with the level of significance defined as a p value < 0.05.


Results

Baseline measures of body composition and physical function are listed in Table 1. Pre-intervention, measures were comparable between groups. Adherence to the schedule of resistance exercise of three sessions per week for 12 weeks was comparable for the two exercise groups, with a mean (SD) number of sessions completed of 34.3±1.2, out of a possible maximum of 36, for the HP+EX group (95.3%) and 34.0±1.0 for the MP+EX group (94.4%).


Table 1 Physical characteristics of subjects pre-intervention

Table 1
Physical characteristics of subjects pre-intervention

Mean value ± Standard deviation;  The results of a non-paired one-way ANOVA showed no differences in the characteristics of the 3 groups pre-intervention; HP+EX group: Protein intake of 1.2-1.3 g/kg body weight/day during the 12-week period of exercise intervention; MP+EX group: Protein intake of 1.0-1.1 g/kg body weight/day during the 12-week period of exercise intervention; MP group: Protein intake of 1.0-1.1 g/kg body weight/day for the 12-week period; BMI: Body mass index; LBM: Lean body mass


Changes in measures of muscle mass pre- and post-intervention are reported in Table 2. A significant main effect of exercise on limb muscle mass was identified (p<0.05) with the largest change identified for the HP+EX group (p<0.001 compared to both the MP+EX and MP groups). A significant group X limb interaction was identified (p<0.05), with a significantly higher increase in muscle mass for the HP+EX group, compared to the MP group, for the upper limbs (p<0.05), trunk (p<0.001) and lower limbs (p<0.001). Comparing HP+EX and MP+EX groups, the magnitude of change in muscle mass was higher for the HP+EX group only for the lower limbs (p<0.05).

Table 2 Comparison of limb muscle mass and physical functions pre-/post-intervention

Table 2
Comparison of limb muscle mass and physical functions pre-/post-intervention

Mean value ± Standard deviation; Two-way ANOVA by time (Pre- and Post-intervation period) × group (HP+EX, MP+EX, MP group)* p <0.05, ** p <0.01,*** p <0.001; One-way ANOVA and post-hoc by Tukey test, Significant difference with MP group: †p <0.05, ††p <0.01, †††p <0.001, Significant difference with MP+EX group: ‡p <0.05, ‡‡p <0.01


Effects of the intervention physical function are reported in Table 2. The ANOVA identified significant effects of exercise on knee extensor strength and 5-m maximum walking speed, as well as knee extensor strength x TUG interaction. Change in knee extensor strength was higher for the MP+EX group, compared to the MP group (p<0.01), with the highest magnitude of change obtained by the HP+EX group (p<0.001 compared to MP; p<0.05 compared to MP+EX group). Findings were similar for 5-m maximum walking speed, with greater improvement in walking speed in the MP+EX compared to MP groups (p<0.05), and largest increase for the HP+EX group (p<0.001 compared to MP; p<0.01 compared to MP+EX group). The improvement in TUG was greater for the HP+EX compared to the MP group (p<0.01).
Nutritional intake, TEI, EER, and levels of total protein intake, adjusted protein intake/kg body weight, fat, and carbohydrates are listed in Table 3. Significant changes in TEI and protein intake (TEI, p<0.05; protein, p<0.001), as well as an interaction between adjusted protein intake and body weight (p<0.001) were identified. The magnitude of change was higher for the HP+EX group compared to the MP group (TEI, p<0.05; protein intake/kg, p<0.001) and the MP+EX group (TEI, p<0.05; protein intake/kg, p<0.001).

Table 3 Comparison pre-intervention and during intervention

Table 3
Comparison pre-intervention and during intervention

Mean value ± Standard deviation, Two-way ANOVA by time (Pre- and post-intervation period) × group (HP+EX, MP+EX, MP group), * p <0.05, ** p <0.01, ***p <0.001; One-way ANOVA and post-hoc by Tukey test, significant difference with MP group: †p <0.05, †††p <0.001, Significant difference with MP+EX group:  ‡p <0.05, ‡‡‡p <0.001


Discussion

In this study, we evaluated the effectiveness of providing an adjusted protein intake of 1.2-1.3 g/kg/day during a 12-week program of light-to-moderate intensity weight-bearing and resistance band exercises on the skeletal muscle mass and physical function of elderly women. The adjusted protein intake improved selected parameters of body composition and physical function, namely lower limb muscle mass, knee extension strength, and 5-m maximum walking speed. The mean protein intake for the HP+EX group was 11.4 ± 1.8 g/day, and increased by approximately 0.22 ± 0.02 g/kg/day over the 12-week program. Fat and carbohydrate intake were comparable between groups and TEI was never below EER.
Our current results support our a priori hypothesis of the necessity of increasing protein intake to optimize outcomes of exercise on muscle mass and physical function in the elderly. In fact, total limb muscle mass increased by 0.9±0.3 kg when combining increased protein intake and exercise (HP+EX), compared to 0.2±0.4 kg for exercise alone (MP+EX). Our measured effect of exercise alone is comparable to results reported by Kim et al. (15) of a 0.29 kg increase in total limb mass for elderly Japanese women completing a 12-week program. Kim et al. (15) combined resistance exercises with amino acid supplements, reporting an increase of approximately 0.34 kg in total limb muscle mass. Using an adjusted protein intake, our program surpassed these levels with a mean increase in total limb mass of 0.9 kg, with the most significant increase noted for the lower limbs. This lower limb bias may be explained by performance of a higher number of lower limb exercises. An important difference in our study, compared to Kim et al. (15), is that we graduated the workload of our program over the 12-weeks.
An important outcome of our study was the identification of a 0.2±0.7 kg decrease in total limb muscle mass and 0.2±1.0 kg decrease in knee extension strength for participants in the MP group over the study period. This emphasizes the need to adjust protein intake, at least to the minimum DRI of 1.0–1.1 g/kg/day, in combination with a light-to-moderate program of resistance training, to maintain muscle mass, with further adjustment in protein intake yielding more significant results.
According to Chevalier et al. (16), a dietary protein intake of 0.8 g/kg/day is insufficient for increasing the skeletal muscle mass of elderly persons and intake should be increased to levels of at least 1.2 g/kg/day. Several physiological reasons contribute to the increased requirement of protein intake in the elderly. Drummond et al. (17) reported a delay and/or decrease of the signaling responses to amino acids in skeletal muscle cells with age. Volpi et al. (18) further demonstrated that a higher proportion of the amino acids absorbed in the gastrointestinal tract of elderly persons is metabolized in the small intestine and liver. Although specific physiological measurements related to protein metabolism were not included in our study, our outcomes provide evidence of insufficient muscle protein synthesis during resistance exercise with a moderate adjustment of protein intake to levels of 1.0–1.2 g/kg/day and that a higher adjustment to levels of 1.2–1.3 g/kg/day are required to enhance effectiveness of resistance training on muscle mass and strength.
Our light-to-moderate level of resistance was sufficient to maintain muscle mass and strength in the MP+EX group. Levinger et al. (19) reported a 1.1-kg increase in skeletal muscle mass of elderly participants performing a 10-week program of high-intensity resistance exercises. In their review of research evidence for resistance training in elderly individuals, Miyachi et al. (20) indicated that an exercise intensity of 80% 1RM or above is required to increase the skeletal muscle mass with a single intervention of exercise. It is important to note that the participants in our study group had a relatively low PAL of 1.75; as none of our participants engaged in regular resistance training, prescription of a high-intensity program was not possible. Future research is required to more clearly elucidate the effectiveness of supplemented protein intake and different levels of resistance training for enhancing gains in muscle mass and strength. However, we do emphasize that our program of light-to-moderate resistance was effective, with a practice rate of approximately 95%, and can be safely implemented as a home program for elderly individuals who are relatively deconditioned.
The benefits of combining a light-to-moderate resistance training program with nutritional supplementation in lowering the risk for sarcopenia in elderly individuals is supported by previous research. In their review comparing the transient response of muscles to high- and low-intensity resistance training regimes, Mallinson et al. (21) reported an increase in muscle protein synthesis (and increased muscle protein reserves) with high-intensity resistance exercise, performed at 90% 1RM, while low-intensity resistance exercises, performed at 30% 1RM, stimulated muscle protein synthesis. Therefore, light-to-moderate intensity weight-bearing and resistance band resistance exercise can have benefits for elderly women, who can easily perform these exercises.
In our study, we assumed that a training resistance of 50–70% 1RM would have little stimulus on protein synthesis in skeletal muscle. As a result, we did not include a control group of adjusted high protein intake alone, with no participation in the program of exercise. Therefore, we are unable to determine if the increase in muscle mass for the HP+EX group results from the increase in protein intake or from the combination of increased protein intake and exercise. Future research is required to clarify the pathway of muscle mass increase associated to a combination of supplemented protein intake and exercise. Another important limitation of our study is the inclusion only of women to control for known sex-specific differences in age-related muscle atrophy and sarcopenia (22, 23). Future research will need to verify effectiveness of protein supplementation in elderly men. Moreover, we estimated muscle mass from BIA measurements. There are currently no population norms of BIA measurements for elderly women, and research is needed to establish norms compared to DEXA (24). Finally, the present study is that the sample size was too small, and the conclusion was not well supported by this data. For example, SD of total limb muscle mass is 1.9 and the change by intervention was 0.9kg in HP+EX group. Required sample size to make this change as significant is 37, which is more than twice of the actual number of sample.
Our study provides evidence of the benefit of increasing protein intake as one component of a resistance training program to improve muscle mass and strength in elderly women.


Funding: This work was supported by JSPS KAKENHI Grant Number 25750353. The sponsors had no role in the design and conduct of the study; in the collection, analysis, and interpretation of data; in the preparation of the manuscript; or in the review or approval of the manuscript.

Acknowledgements: None.

Conflict of Interest: All of the authors declare that they have no conflicts of interest regarding this paper.

Ethical standards: Ethics Committee of Hyogo University (approved # 12003).


References

1.     Evans WJ. What is sarcopenia? J Gerontol A Biol Sci Med Sci 1989;50A:5–8.
2.     Janssen I, Baumgartner RN, Ross R. Skeletal muscle cutpoints associated with elevated physical disability risk in older men and women. Am J Epidemiol 2004;159:413 – 421.
3.     Roubenoff R, Hughes VA. Sarcopenia: current concepts. J Gerontol A Biol Sci Med Sci 2000;55:716–724.
4.     Robinson S, Cooper C, Aihie SA. Nutrition and sarcopenia: a review of the evidence and implications for preventive strategies. J Aging Res 2012;2012.(ID 510801). http://dx.doi.org/10.1155/2012/510801
5.     Christie J. Progressive resistance strength training for improving physical function in older adults. Int J Older People Nurs 2011;6:244 – 246.
6.     Peterson MD, Rhea MR, Sen A. Resistance exercise for muscular strength in older adults: a meta-analysis. Ageing Res Rev 2010;9:226–237.
7.     Taaffe DR. Sarcopenia: exercise as a treatment strategy. Aust Fam Physician 2006;35:130–134.
8.     Doherty TJ. Invited review: aging and sarcopenia. J Appl Physiol 2003;95:1717–1727.
9.     Beasley JM, Shikany JM, Thomson CA. The role of dietary protein intake in the prevention of sarcopenia of aging. Nutr Clin Pract 2013;28:684–690.
10.     Morley JE, Argiles JM, Evans WJ, et al. Society for Sarcopenia, Cachexia, and Wasting Disease. Nutritional recommendations for the management of sarcopenia. J Am Med Dir Assoc 2010;11:391–396.
11.     Volkert D, Sieber CC. Protein requirements in the elderly. Int J Vitam Nutr Res 2011;81:109–119.
12.     Nakade M, Imai E, Tsubota-Utsugi M. Systematic classification of evidence for dietary reference intakes for Japanese 2010 (DRIs-J 2010) in adults and future prospects of DRIs in Asian countries. Asia Pac J Clin Nutr 2013;22:474–489.
13.     Eckard T, Lopez J, Kaus A, Aden J. Home exercise program compliance of service members in the deployed environment: an observational cohort study. Mil Med 2015;180:186–191.
14.     Mori H, Niwa M. Effect of nutritional care and whey protein supplementation on the body composition and physical function in older adults after combined resistance and aerobic exercise. Jpn J Nutr Diet 2014;72:12–20. [in Japanese]
15.     Kim HK, Suzuki T, Saito K, et al. Effects of exercise and amino acid supplementation on body composition and physical function in community-dwelling elderly Japanese sarcopenic women: a randomized controlled trial. J Am Geriatr Soc 2012;60:16–23.
16.     Chevalier S, Gougeon R, Nayar K, Morais JA. Frailty amplifies the effects of aging on protein metabolism: role of protein intake. Am J Clin Nutr 2003;78:422–429.
17.     Drummond MJ, Dreyer HC, Pennings B, et al. Skeletal muscle protein anabolic response to resistance exercise and essential amino acids is delayed with aging. J Appl Physiol 2008;104:1452–1461.
18.     Volpi E, Mittendorfer B, Wolf SE, Wolfe RR. Oral amino acids stimulate muscle protein anabolism in the elderly despite higher first-pass splanchnic extraction. Am J Physiol 1999;277:513–520.
19. Levinger I, Goodman C, Hare DL, Jerums G, Seling S. The effect of resistance training on functional capacity and quality of life in individuals with high and low numbers of metabolic risk factors. Diabetes Care 2007;30:2205–2210.
20.     Miyachi M, Ando D, Oida Y, et al. Possible treatments for sarcopenia: systematic review on the effect of exercise intervention. Jpn J Geriatr 2011;48:51–54. [in Japanese]
21.     Mallinson JE, Murton AJ. Mechanisms responsible for disuse muscle atrophy: potential role of protein provision and exercise as countermeasures. Nutrition 2012;29:22–28.
22.     Sanada K, Miyachi M, Tanimoto M, et al. A cross-sectional study of sarcopenia in Japanese men and women: reference values and association with cardiovascular risk factors. Eur J Appl Physiol 2010;10:57–65.
23.     Basaria S, Coviello AD, Travison TG. Adverse events associated with testosterone administration. N Engl J Med 2010;8:109–122.
24.     Buckinx F, Reginster JY, Dardenne N, et al. Concordance between muscle mass assessed by bioelectrical impedance analysis and by dual energy X-ray absorptiometry: a cross-sectional study. BMC Musculoskelet Disord 2015;16:60.