jarlife journal
Sample text

AND option

OR option

TREATMENT SATISFACTION: A NEGLECTED BUT IMPORTANT OUTCOME MEASURE IN OLDER PEOPLE WITH TYPE 2 DIABETES


H. Langerman1,2, R. Gadsby3


1. Beds & Herts Postgraduate Medical School, Luton, UK; 2. Merck Sharp and Dohme, UK; 3. University of Warwick Medical School, Coventry, UK.

Corresponding Author: Haya Langerman, Beds & Herts Postgraduate Medical School, Luton, LU2 8LE, UK, E-mail address: haya.langerman@beds.ac.uk.

J Aging Res Clin Practice 2017;6:124-132
Published online June 15, 2017, http://dx.doi.org/10.14283/jarcp.2017.14


Abstract

Objective: To investigate the effect of comprehensive geriatric care (CGC) in elderly referred to a rehabilitation unit. This article describes the considerations behind the study. Design: Participants were randomized to either CGC or standard care. Setting: Participants were recruited from two community care rehabilitation units in Aarhus Municipality, Denmark, in the period between 2012 and 2015. Participants: Inclusion:  Elderly patients aged 65 and older admitted from home or hospital. Exclusion: Persons receiving palliative care or assessed by a geriatrician during the past month. Intervention: Medical history, physical examination, blood tests, medication adjustment and follow-up by a geriatrician. The control group received standard care with the general practitioners (GPs) as back-up. Outcomes: Primary outcome: Hospital contacts drawn from national registers. Secondary outcomes: GPs contacts, institutionalization, medication status and mortality collected from national registers and Activities of daily living (ADL), physical and cognitive function and quality of life measures collected by a blinded occupational therapist. All outcomes were assessed at day 10, 30 and 90 after arrival at the rehabilitation unit. Conclusion: A new model of care for elderly referred to community rehabilitation was developed and implemented. The potential benefits of this model were compared with usual care in a community rehabilitation unit in a pragmatic randomized clinical trial. We hypothesized that the geriatrician-performed CGC in elderly referred to a rehabilitation unit will reduce the hospital contacts by 25 % without increase in mortality and in contacts to GPs and home care services. We expect that this model will prevent deterioration in ADL, and physical and cognitive functioning, and reduce the risk of institutionalization. If the results are positive, community rehabilitation services should be encouraged to change their routines for treatment of this population accordingly..

Key words: Randomized controlled trial, Comprehensive geriatric care, rehospitalization, rehabilitation, activity of daily living.


Introduction

Older people are the fastest growing segment of the population, responsible for a large portion of the use of health care services, and a large and growing section of the population with diabetes. They are not a uniform group and can be broadly classified into those entering old age (generally 60 years and above), a transitional phase between healthy active life and frailty (the seventh or eighth decade), and frail older people (late old age) (1). Diabetes is up to five times more prevalent in patients aged 65 years or older, compared with patients below the age of 65 (2, 3). Recent estimates suggest that up to 1 in 5 older people have diabetes and that a similar proportion may have undiagnosed diabetes (4).
The management of older people with diabetes presents unique challenges. Observational studies suggest an association between diabetes and the risk of various geriatric conditions (i.e., cognitive impairment, dementia, depression, mobility impairment, disability, and falls) (5, 6). They have an increased rate of diabetes-related complications, are much more likely to present with comorbid conditions, and are more susceptiple to the adverse effects of some . glucose-lowering therapies.
Adherence to treatment is a key factor in achieving therapeutic success. Treatment satisfaction is an important determinant of patients overall health-related decisions such as adherence and willingness to continue treatment (7−9). It is defined as the patient’s evaluation of the process of taking the medication and the outcomes associated with the medication (10). It is an essential measure of treatment effectiveness as some treatments with proven efficacy in clinical trials are less effective when prescribed in routine clinical practice where there is no intensive follow-up to ensure adherence. However, treatment satisfaction is not an easy item to measure as it depends not only on the clinical outcomes achieved such as symptom resolution, control of the disease progression and prevention, but also on factors such as the route and ease of drug administration, and drug tolerability. Overall treatment satisfaction in diabetes consists of the patient’s appraisal of three main treatment-related parameters: efficacy, side effects, and treatment burden or inconvenience. However, in older people with diabetes, outcomes such as hospitalisation rates, quality of life, fall rates, instrumental daily living restrictions and admission rates to care homes assume more importance and should also be considered when assessing treatment satisfaction (11, 12).
Predictors of treatment satisfaction may differ significantly between patients and it cannot be assumed that generic or disease-specific instruments with evidence of good measurement properties in a younger population will perform as well with an older population. For example, older people with type 2 diabetes are more worried about adverse events, have trouble remembering to take their medication or require assistance from another person in order to take their medication (13). In addition, multiple comorbidities, as is commonly found in older populations, are associated with greater decrements in quality-of-life and well-being (14). Consequently, when assessing treatment satisfaction it is important to use a questionnaire that focuses on areas relevant to the target population. For example, older people with type 2 diabetes are particularly at risk of hypoglycaemia and may be less satisfied with treatments that increase this risk. There are several questionnaires that evaluate treatment satisfaction for people with diabetes: Diabetes Treatment Satisfaction Questionnaire (DTSQ) (15), Treatment Satisfaction Questionnaire for Medication (TSQM) (16), Satisfaction with Oral Anti-Diabetic Agent Scale (SOADAS) (17), Treatment Satisfaction with Medicines Questionnaire (SATMED-Q) (18), Diabetes Medication System Rating Questionnaire (DMSRQ) (19), and Oral Hypoglycaemic Agent Questionnaire (OHA-Q) (20). Currently, no treatment satisfaction questionnaires have been designed and validated specifically for older people with type 2 diabetes. This review aims to examine the main validated questionnaires in the area of treatment satisfaction in type 2 diabetes and to assess their applicability to older people.


Methods

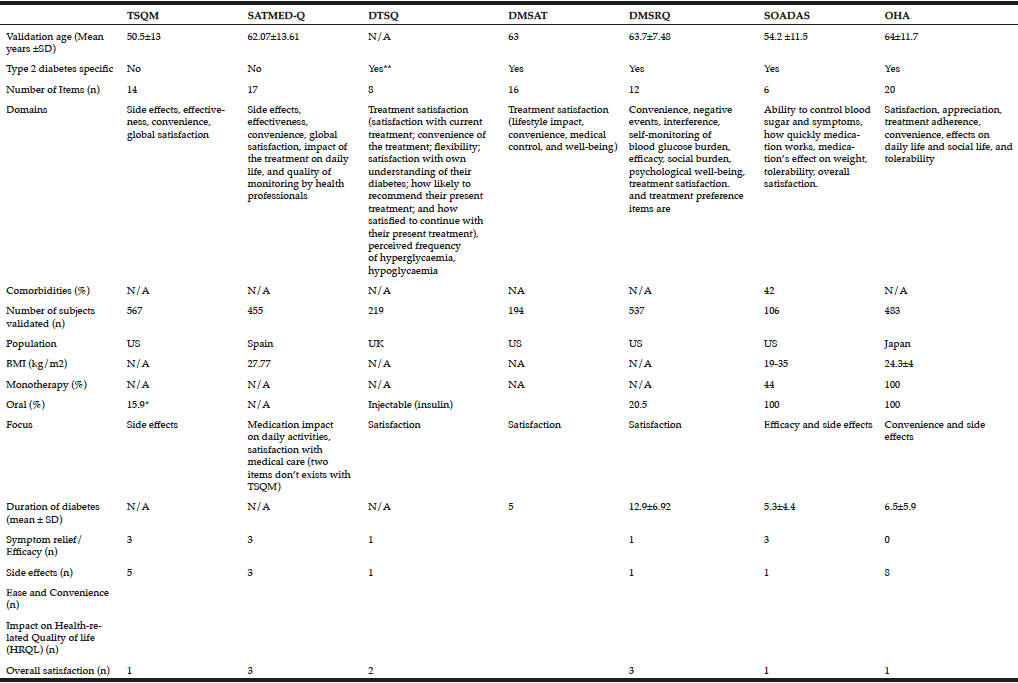
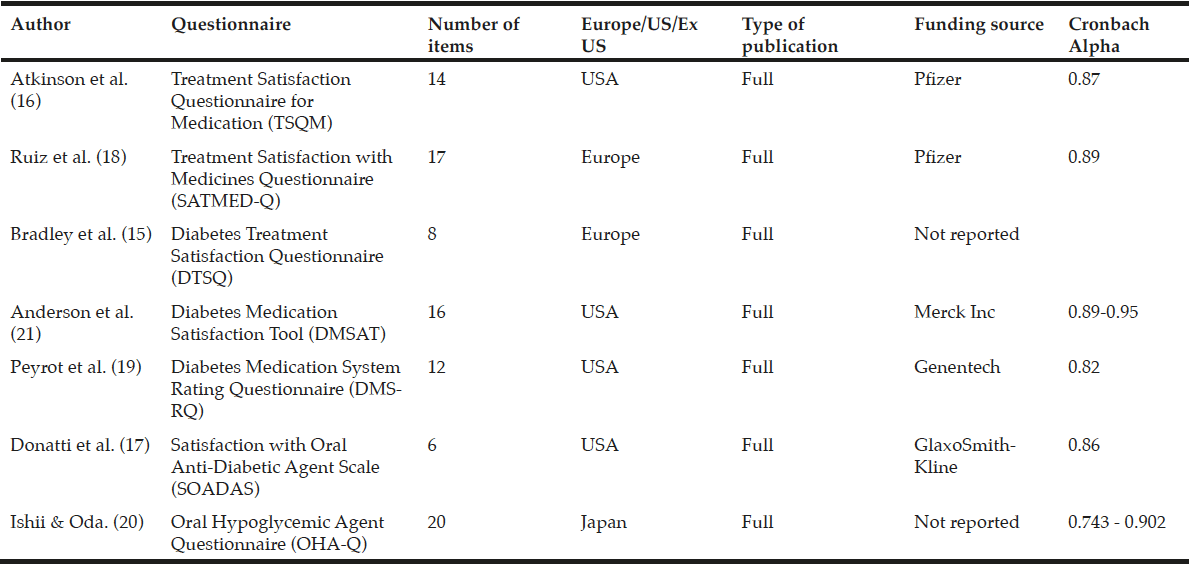
ProQuest, PubMed, HeinOnline, ScienceDirect, Academic One File, general OneFile and MEDLINE scientific literature databases were searched from 1/1/1980 to 1/4/2014 to identify treatment satisfaction questionnaires validated in diabetes for use in patients receiving oral antidiabetes therapies; insulin-specific questionnaires were not included. Search terms for ProQuest and PubMed included ‘treatment satisfaction, ‘diabetes’,’ older’, ‘elderly’, ‘questionnaires’, ‘assessment’, ‘evaluation’. Seven questionnaires were selected based on their validity in patients with diabetes (Table 1). Data extraction was performed to summarise key components of the studies including study design, demographic characteristics including age, choice of domains and items.


Table 1 Study listing

Table 1
Study listing


Results

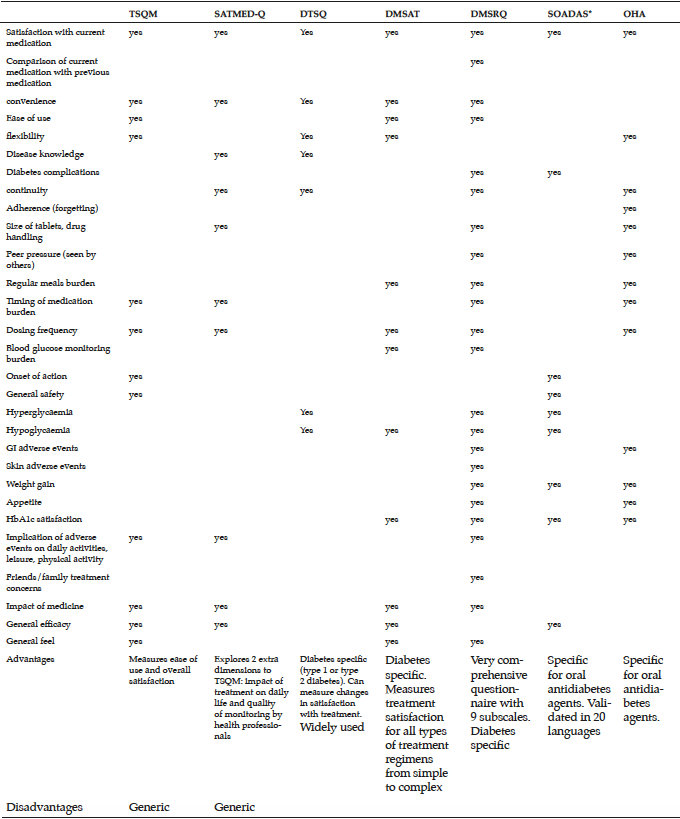
The literature search identified seven questionnaires that had been validated in diabetes. Of these, two were general questionnaires: Treatment Satisfaction Questionnaire for Medication (TSQM) (16) and Treatment Satisfaction with Medicines Questionnaire (SATMED-Q) (18); and five were diabetes-specific: Diabetes Treatment Satisfaction Questionnaire (DTSQ) (15), Diabetes Medication Satisfaction Tool (DMSAT) (21), Diabetes Medication System Rating Questionnaire (DMSRQ) (19), Satisfaction with Oral Anti-Diabetic Agent Scale (SOADAS) (17), and Oral Hypoglycaemic Agent Questionnaire (OHA-Q) (20) (Tables 2 and 3). In addition, the search also identified a quality-of-life questionnaire, the Audit of Diabetes-Dependent Quality of Life (ADDQoL) Senior, which although it looks at quality of life rather than treatment satisfaction is included here as it is the only assessment tool specifically developed for older people with type 2 diabetes (22).


General questionnaires

Treatment Satisfaction Questionnaire for Medication (TSQM)

The TSQM is a general tool for assessing patients’ satisfaction with medications designed to treat, control, or prevent a wide variety of conditions. It includes 14 items (Table 2) and has been validated across a wide range of diseases, including type 1 diabetes (16). However, unlike the DTSQ, this measure does not include diabetes-specific items and is therefore unlikely to reliably measure treatment satisfaction with oral antihyperglycaemic agents. In the validation study, respondents’ age ranged from 18 to 88 years, with a mean of 50.5 (16).


Table 2 Demographic characteristics of patients included in the studies

Table 2
Demographic characteristics of patients included in the studies

*Oral diabetes medication; **Type 1 and orally treated type 2 diabetes

Table 3 Items included in each questionnaire

Table 3
Items included in each questionnaire

*questionnaire was not available. Information based on validation and might be lacking


Although it is a general questionnaire, the TSQM has been used in several studies of people treated with oral antidiabetes agents (23−26). These studies showed that the experience of hypoglycaemia was associated with lower global satisfaction. Marrett et al also found significantly lower scores for the side-effects domain in patients reporting hypoglycaemia compared with those who did not (P ≤ 0.001) (23). Alvarez-Guisasola et al observed that experience of hypoglycaemia was associated with a negative effect on all domains (P < 0.001 for all comparisons) (25). Similar results were found in the Walz et al study, where patients (mean age 69 years) with moderate or worse symptoms of hypoglycaemia indicated several dimensions where they were less satisfied with their antihyperglycaemic medication regimen than patients with no or mild symptoms (26).

Treatment Satisfaction with Medicines Questionnaire (SATMED-Q)

The SATMED-Q is a multidimensional generic questionnaire that was developed to address some of the limitations of the TSQM questionnaire. It explores the same dimensions as the TSQM and two additional dimensions (impact of the treatment on daily life and quality of monitoring by health professionals). These dimensions have been highlighted by patients as important components of medical care. The questionnaire has been designed for use in patients with any chronic illness and undergoing any type of prolonged pharmacological treatment. The questionnaire has been shown to be a reliable and valid measure of treatment satisfaction in a number of chronic diseases including type 2 diabetes (18), and has been shown to be sensitive to changes in patients’ satisfaction with treatment, although this has not been tested in diabetes (27). A search of the literature found no further trials of its use in diabetes.


Diabetes-specific questionnaires

Diabetes Treatment Satisfaction Questionnaire (DTSQ)

In its original ‘status’ format, the DTSQ was designed to prospectively measure satisfaction with diabetes treatment regimens among patients with type 1 or type 2 diabetes. The instrument is comprised of eight items, each rated on a 7-point Likert scale ranging from 0 to 6 (15). The questionnaire has been used in a number of clinical trials evaluating new diabetes treatments. However,  the DTSQ measures satisfaction at one point in time, e.g How satisfied are you with your current treatment?  The sensitivity to change of the DTSQ is therefore limited, and ceiling effects are often seen, where maximum or close-to-maximum scores at baseline provide little opportunity for registering improvement in satisfaction with the treatment or strategy being assessed. A ‘change’ format of the DTSQ was designed to overcome the ceiling effects of the ‘status’ version and to measure change in satisfaction (28). This instrument contains the same eight items as the DTSQ-status version, but asks patients to consider their satisfaction with their current treatment compared with their previous treatment. When used together in a clinical trial setting, the status version, used at baseline, permits assessment of absolute levels of satisfaction, while the change version measures relative change, reflecting increased or decreased satisfaction or no change in satisfaction.
Using the DTSQ status version, Biderman et al found that lower treatment satisfaction was related to difficulties in adherence to taking medications (7). The mean age in this study was 67 years. They also found that insulin-treated patients were least satisfied with treatment. This was also the case in the Petterson et al study, which specifically examined treatment satisfaction in older people (≥60 years) with diabetes (mean age 71 years) (29). Aside from the obvious fact that injecting insulin is less comfortable than taking a pill, this outcome may also reflect patients’ perceptions that insulin treatment means that their health status has deteriorated. Another possible explanation is that people with type 2 diabetes who need insulin, have longer disease duration, with more complications. Diabetes complications were also found to be associated with low satisfaction. Furthermore, less satisfaction was associated with having any complication at all, and there was a constant decline in treatment satisfaction with increased number of complications. In contrast to another study, which showed better treatment satisfaction in older patients than younger patients (30), neither the Biderman nor Petterson et al studies found an association between age and treatment satisfaction (7, 29).
Some studies have reported that treatment satisfaction decreases with higher HbA1c levels (30, 31). However, as only a minority of patients may be aware of the term ’HbA1c,’ this could be a possible reason for the lack of correlation between HbA1c levels and treatment satisfaction. In the Biderman and Petterson et al studies, there was no correlation between HbA1c and satisfaction, but lower satisfaction was found at HbA1c >7%(mmol/L) (7, 29).

Diabetes Medication Satisfaction Tool (DMSAT)

The 16-item DMSAT tool measures satisfaction with the patient’s diabetes medication regimens (Table 2) (21). Responses are summed and converted to a score from 0 to 100 for each subscale and overall, with higher scores representing more satisfaction.
The scale has been used to measure treatment satisfaction in a UK survey of patients with type 2 diabetes designed to evaluate associations between hypoglycaemic events and patient-reported outcomes (32). Medication satisfaction was lower among those who experienced ≥1 hypoglycaemic event in the 4 weeks prior to the survey (P<0.0001). People in old age were not recruited, the mean age of participants in the survey was 58.8 ± 10.9 years.

Diabetes Medication System Rating Questionnaire (DMSRQ)

The DMSRQ was developed to assess satisfaction with any diabetes medication, oral or injectable, used to control blood glucose (19). The DMSRQ contains nine scales, scored on a 0-to-100 scale (a higher score indicates greater levels of the construct measured) (Table 2). It is also available in a short form (33). In the validation study patients were aged 40-64 years (19). In contrast to the DTSQ, DMSRQ can distinguish between certain components of the diabetes treatment such as medication, diet, exercise and glucose monitoring. Other than the validation studies a search of the literature found no further trials of its use in diabetes.

Satisfaction with Oral Anti-Diabetic Agent Scale (SOADAS)

SOADAS was the first questionnaire to evaluate people with type 2 diabetes on oral anti-diabetes agents (17). SOADAS has cross-cultural face validity having been translated and validated in 20 languages to ensure that new language versions are sensitive to cultural expressions. Unlike the DTSQ, which was developed based on insulin-treated patients, the six-item SOADAS scale includes items on side effects as well as medication effects on body weight, which may be critical in differentiating treatment satisfaction among patients on different oral anti-diabetes agents (Table 2). The findings from the evaluation study indicate that SOADAS is a valid and reliable measure of patient satisfaction with oral antidiabetes medications, but a limitation of the SOADAS questionnaire is that validation was only carried out on a sample of US patients, with a BMI between 19 and 35. In addition, the questionnaire does not evaluate the impact on daily life, and side effects other than weight gain are reduced to one item (tolerability). A search of the literature did not find any studies that have used SOADAS.

Oral Hypoglycaemic Agent Questionnaire (OHA-Q)

The OHA-Q was developed by Japanese researchers because of a lack of current tools to clarify differences among the oral agents for type 2 diabetes (20). For example, the SOADAS questionnaire oversimplified tolerability aspects as well as lacking evaluation of the impact on daily life. The 20-item OHA-Q provides information useful for the selection of oral agents and unlike SOADAS is also available in Japanese. Subjects in the validation study had type 2 diabetes and had been treated with a single oral antidiabetes agent for the past 1 month or longer. They had to be a least 20 years old, but there was no upper age cut-off.

The Audit of Diabetes-Dependent Quality of Life (ADDQoL)

ADDQoL is a diabetes-specific measure that assesses the impact of diabetes on 18 life domains such as “working life,” “family life,” “freedom to eat as I wish,” and “self-confidence” and has proven to be sensitive to changes in treatment (22, 34).  Individuals with diabetes complications reported a significantly greater negative impact of diabetes on QoL than those without complications (P<0.001). It is of interest to note that the overall impact of diabetes on QoL in the validation study population was profoundly negative, but accompanying DTSQ findings showed a relatively high satisfaction with treatment. Thus, if treatment satisfaction had been used as an indicator of QoL in this study (22), the negative impact of diabetes on QoL would not have been acknowledged, and the high levels of treatment satisfaction may have been misinterpreted to suggest that patients had good QoL. Use of ADDQoL with people with type 1 or type 2 diabetes has shown, on average, a negative impact of diabetes on all domains (22).
In general, these findings indicate that ADDQoL is sensitive to the effects of diabetes (including both its treatment and complications) that cannot be captured by the measurement of treatment satisfaction alone. ADDQoL identifies more negative psychological outcomes than diabetes-specific treatment satisfaction scales such as the DTSQ, and thus it is likely to be even more sensitive to improvements following change to a new treatment that protects aspects of life that are important for QoL. In particular, the DIABQoL+ study has shown that restrictions on dietary freedom have a major negative impact on QoL, suggesting that treatments that increase dietary freedom without loss of metabolic control will improve QoL for many patients (35).

ADDQoL Senior

Quality-of-life questionnaires differ from treatment satisfaction questionnaires and ADDQoL Senior is only mentioned here because it is the only assessment tool that has been specifically developed for assessing quality of life in older people with type 2 diabetes, particularly care-home residents (36). In the validation, ‘independence’ was the aspect of life reported to be most important for quality of life and had the most negative weighted impact score, followed by ‘freedom to eat as I wish’. Thus, further research is required to examine the relationship between ‘independence’ and drug administration related aspects that are likely to be affected by reduced independence and therefore to reduce the level of satisfaction. ADDQoL Senior is being validated in the ongoing MID-Frail study in frail and pre-frail subjects aged ≥70 years with type 2 diabetes (37).


Discussion

A review of the literature reveals that a number of treatment satisfaction measures are available, but few have been validated in type 2 diabetes and none appears suited to capturing the satisfaction of older adults with type 2 diabetes. Only SOADAS and OHA-Q are specific to oral antidiabetes therapies. TSQM, and SATMED-Q are general questionnaires designed to assess satisfaction with medication in chronic conditions, and are not specific to type 2 diabetes. Mean age slightly differs between the questionnaires, whilst the patient population in OHA-Q is older compared with the other questionnaires.
The main focus in OHA-Q and TSQM is safety-related items such as adverse events and their implication on physical and mental activities. OHA-Q lists eight different items referring to adverse events such as hypoglycaemia, weight gain and gastrointestinal symptoms. OHA-Q was tested among patients on monotherapy only and therefore may enable comparisons between the different classes of oral therapies to be made. While the mean age in the OHA-Q validation was slightly higher compared with the other questionnaires, none of the questionnaires has been validated in patients >70 years. The choice of items is extremely important especially as there are specific items that are more relevant to older people such as drug administration related aspects as well as adverse events. Both OHA-Q and SOADAS looked at satisfaction with current therapy, weight gain related items and efficacy of the drug. As opposed to SOADAS, OHA-Q includes more items related to safety of the therapy while SOADAS focuses heavily on efficacy-related items. Older people with type 2 diabetes are in many cases frail and suffer from comorbidities. It is therefore important to provide a balance between efficacy- and safety-related items.
Due to the prolonged and progressive nature of chronic diseases such as diabetes, poor adherence can adversely affect the long-term effectiveness of a drug. An assessment of a patient’s treatment satisfaction is therefore useful to help identify those at risk of poor adherence, and enable physicians to target their interventions toward the aspects responsible for this. An important barrier to effective diabetes self-management is hypoglycaemia associated with diabetes medication (38). A number of studies have shown that hypoglycaemia is significantly associated with poorer health-related quality of life and patient outcomes, achievement of treatment goals, and healthcare utilization (25, 32, 39−41). Older people with diabetes are at greater risk for hypoglycaemia; normal aging may contribute to failure in counter regulatory responses (neurohumoral responses, subject awareness) to hypoglycaemia (42), symptoms may be mistaken for other conditions associated more commonly with advanced aged, and several treatments, including the sulphonylureas, other insulin secretagogues, and insulin, may either contribute to or directly cause it (43). In a population-based, retrospective, 4-year cohort study in 19,932 patients, frail older individuals (>80 years) using multiple medications and frequently hospitalised were at greater risk for hypoglycaemia (risk ratio = 1.8; 95% CI, 1.4-2.3; P =0.05) than healthier individuals of the same age (44).
In addition to providing useful insight into the patient’s perspective on their current treatment, treatment satisfaction is a valuable endpoint for clinical studies of treatments for chronic conditions where treatment compliance and adherence are considered issues (45). Thus, when new treatments have comparable efficacy, treatment satisfaction can be used to examine whether drug differences other than clinical efficacy have an impact on outcomes that may be important to patients. However, direct comparisons of satisfaction scores between studies are problematic due to the diversity of assessment instruments used. There is also currently no evidence of reliability or validity of existing instruments in older individuals with type 2 diabetes.
To date, treatment satisfaction has been used in only a limited way to support EMEA drug approvals, which may be due in part to a limited number of appropriate treatment satisfaction measures. Given the high proportion of older individuals with type 2 diabetes (6, 46), there is an urgent need for treatment satisfaction questionnaires to be developed and validated in older populations with type 2 diabetes so that clinical trials can use these measures to differentiate between alternative treatments.


Conclusion

Although older people with type 2 diabetes are an important and growing group, no validated treatment satisfaction measure is available to assess satisfaction with oral antidiabetes medication in this population. Future research should focus on developing new measures or adapting existing measures and validating them in a range of older populations with type 2 diabetes to inform treatment decisions on optimal therapy. In addition to medication effectiveness, side effects, and convenience of use, such a questionnaire should include an extended range of concerns, such as dosing schedules, time spent managing diabetes, and integrating medication regimens into ones lifestyle or routine, which may become important as the treatment regimen grows in complexity. Concerns related to older people in particular should also be included such as functional autonomy, independence, fall rates, hospitalization rates, and admission rates to care home. Of the currently available questionnaires, OHA-Q and SOADAS appear best suited to assessing treatment satisfaction in older people with type 2 diabetes, although adjustments may be required to ease reading and completion of the questionnaire.


Conflict of interest: The authors declare no conflict of interest. H. Langerman is an employee of Merck Sharp and Dohme, UK. The authors were supported by a medical writer who was funded by Merck Sharp and Dohme. The authors had complete editorial control over the manuscript, which represents the views of the authors.


References

1.    Department of Health. National Service Framework for Older People. March 2001. Available from: https://www.gov.uk/government/uploads/system/uploads/attachment_data/file/198033/National_Service_Framework_for_Older_People.pdf. Last accessed March 2015.
2.     International Diabetes Federation [webpage on the Internet] IDF Diabetes Atlas. 6th ed. Brussels, Belgium: International Diabetes Federation; 2013. [Accessed January 1, 2014]. Available from:http://www.idf.org/diabetesatlas.
3.     Fagot-Campagna A, Bourdel-Marchasson I, Simon D. Burden of diabetes in an aging population: prevalence, incidence, mortality, characteristics and quality of care. Diabetes Metab 2005;31:5S35-5S52.
4.     Sinclair A, Morley JE, Rodriguez-Mañas L, Paolisso G, Bayer T, Zeyfang A, et al. Diabetes mellitus in older people: position statement on behalf of the International Association of Gerontology and Geriatrics (IAGG), the European Diabetes Working Party for Older People (EDWPOP), and the International Task Force of Experts in Diabetes. J Am Med Dir Assoc 2012;13:497-502.
5.     Lu FP, Lin KP, Kuo HK. Diabetes and the risk of multi-system aging phenotypes: a systematic review and meta-analysis. PLoS One 2009;4:e4144.
6.     Sinclair A, Dunning T, Rodriguez-Mañas L. Diabetes in older people: new insights and emaining challenges. Lancet Diabetes Endocrinol 2015;3:275-85.
7.     Biderman A, Noff E, Harris SB, Friedman N, Levy A. Treatment satisfaction of diabetic patients: what are the contributing factors? Fam Pract 2009;26:102–8.
8.     Barbosa CD, Balp MM, Kulich K, Germain N, Rofail D. A literature review to explore the link between treatment satisfaction and adherence, compliance, and persistence. Patient Prefer Adherence 2012;6:39–48.
9.     Pollack MF, Purayidathil FW, Bolge SC, Williams SA. Patient-reported tolerability issues with oral antidiabetic agents: Associations with adherence; treatment satisfaction and health-related quality of life. Diabetes Res Clin Pract 2010;87:204–10.
10.     Weaver M, Patrick DL, Markson LE, Martin D, Frederic I, Berger M. Issues in the measurement of satisfaction with treatment. Am J Manag Care 1997;3:579–94.
11.     Bourdel-Marchasson I, Sinclair A. Elderly patients with type 2 diabetes mellitus-the need for high-quality, inpatient diabetes care. Hosp Pract (1995) 2013;41:51-6.
12.     Bourdel-Marchasson I, Druet C, Helmer C, Eschwege E, Lecomte P, Le-Goff M, Sinclair AJ, Fagot-Campagna A. Correlates of health-related quality of life in French people with type 2 diabetes. Diabetes Res Clin Pract 2013;101:226-35.
13.     Brown SE, Meltzer D, Chin MH, Huang ES. Perceptions of quality-of-life effects of treatments for diabetes mellitus in vulnerable and nonvulnerable older patients. J Am Geriatr Soc 2008;56:1183–90.
14.     Wikman A, Wardle J, Steptoe A. Quality of life and affective well-being in middle-aged and older people with chronic medical illnesses: a cross-sectional population based study. PLoS One 2011;6:e18952.
15.     Bradley C. Diabetes treatment satisfaction questionnaire. In: Bradly C (ed.). Handbook of Psychology and Diabetes: A Guide to Psychological Measurement in Diabetes Research and Practice. Chur, Switzerland: Harwood Academic Publisher, 1994:111–32.
16.     Atkinson MJ, Sinha A, Hass SL, Colman SS, Kumar RN, Brod M,  et al. Validation of a general measure of treatment satisfaction, the Treatment Satisfaction Questionnaire for Medication (TSQM), using a national panel study of chronic disease. Health Qual Life Outcomes 2004;2:12.
17.     Donatti C, Wild D, Horblyuk R, Beusterien KB, Anderson RT, Arondekar B, et al. Psychometric evaluation of the Satisfaction with Oral Anti-Diabetic Agent Scale (SOADAS). Diabetes Res Clin Pract 2008;80:108-13.
18.     Ruiz MA, Pardo A, Rejas J, Soto J, Villasante F, Aranguren JL. Development and Validation of the “Treatment Satisfaction with Medicines Questionnaire” (SATMED-Q). Value Health 2008;913–26.
19.     Peyrot M, Harshaw Q, Shillington AC, Xu Y, Rubin RR. Care delivery validation of a tool to assess medication treatment satisfaction in patients with type 2 diabetes: the Diabetes Medication System Rating Questionnaire (DMSRQ). Diabet Med 2012;29:1060–6.
20.     Ishii H, Oda E. Reproducibility and validity of a satisfaction questionnaire on hypoglycemic agents: the Oral Hypoglycemic Agent Questionnaire (OHA-Q). Diabetol Int 2012;3:152–63.
21.     Anderson RT, Girman CJ, Pawaskar MD, Camacho FT, Calles J, Kelly WS, DeMuro C, Balkrishnan R. Diabetes Medication Satisfaction Tool: a focus on treatment regimens. Diabetes Care 2009, 32:51–3.
22.     Bradley C, Todd C, Gorton T, Symonds E, Martin A, Plowright R. The development of an individualized questionnaire measure of perceived impact of diabetes on quality of life: the ADDQoL. Qual Life Res 1999;8:79–91.
23.     Marrett E, Stargardt T, Mavros P, Alexander CM. Patient reported outcomes in a survey of patients treated with oral antihyperglycaemic medications: associations with hypoglycaemia and weight gain. Diabetes Obes Metab 2009;11:1138–44.
24.     Stargardt T, Gonder-Frederick L, Krobot KJ, Alexander CM. Fear of hypoglycaemia: defining a minimum clinically important difference in patients with type 2 diabetes. Health Qual Life Outcomes 2009;7:91.
25.     Alvarez Guisasola F, Tofé Povedano S, Krishnarajah G, Lyu R, Mavros P, Yin D. Hypoglycaemic symptoms, treatment satisfaction, adherence and their associations with glycaemic goal in patients with type 2 diabetes mellitus: Findings from the Real-Life Effectiveness and Care Patterns of Diabetes Management (RECAP-DM) Study. Diabetes Obes Metab 2008;10(Suppl 1):25–32.
26.     Walz L, Pettersson B, Rosenqvist U, Deleskog A, Journath G, Wändell P. Impact of symptomatic hypoglycemia on medication adherence, patient satisfaction with treatment, and glycemic control in patients with type 2 diabetes. Patient Prefer Adherence 2014;8:593-601.
27.     Rejas J, Ruiz M, Pardo A, Soto J. Detecting changes in patient treatment satisfaction with medicines: the SATMED-Q. Value Health 2013;16:88-96.
28.     Bradley C. Diabetes treatment satisfaction questionnaire. Change version for use alongside status version provides appropriate solution where ceiling effects occur. Diabetes Care 1999;22:530–2.
29.     Petterson T, Pauline L, Hollis S, Young B, Newton P, Dornan T. Well-being and treatment satisfaction in older people with diabetes. Diabetes Care 1998;31:930-5.
30.     Ken W, Koopmanshap MA, Stolk RP, Rutten GEM, Wolffenbuttel BHR, Niessen LW. Health-related quality of life and treatment satisfaction in Dutch patients with type 2 diabetes. Diabetes Care 2002;25:458-63.
31.     Bradley C, Lewis KS. Measures of psychological well-being and treatment satisfaction developed from the responses of people with tablet-treated diabetes. Diabet Med 1990;7:445–51.
32.     Mitchell BD, Vietri J, Zagar A, Curtis B, Reaney M. Hypoglycaemic events in patients with type 2 diabetes in the United Kingdom: associations with patient-reported outcomes and self-reported HbA1c. BMC Endocr Disord 2013;13:59.
33.     Peyrot M, Xu Y, Rubin RR. Development and validation of the Diabetes Medication System Rating Questionnaire-Short Form. Diabet Med 2014;31:1237-44.
34.     Speight J, Bradley C. The ADKnowl: identifying knowledge deficits in diabetes care. Diabet Med 2001;18:626-33.
35.     Bradley C, Speight J. Patient perceptions of diabetes and diabetes therapy: assessing quality of life. Diabetes Metab Res Rev 2002;18(Suppl 3):S64-9.
36.     Speight J, Sinclair AJ, Browne JL, Woodcock A, Bradley C. Assessing the impact of diabetes on the quality of life of older adults living in a care home: validation of the ADDQoL Senior. Diabet Med 2013;30:74-80.
37.     Rodríguez-Mañas L, Bayer AJ, Kelly M, Zeyfang A, Izquierdo M, Laosa O, et al;*on behalf of the MID-Frail Consortium. An evaluation of the effectiveness of a multi-modal intervention in frail and pre-frail older people with type 2 diabetes − the MID-Frail study: study protocol for a randomised controlled trial. Trials 2014;15:34.
38.     Seaquist ER, Anderson J, Childs B, Cryer P, Dagogo-Jack S, Fish L, et al. Hypoglycemia and diabetes: a report of a workgroup of the American Diabetes Association and The Endocrine Society. Diabetes Care 2013;36:1384–95.
39.     Williams SA, Shi L, Brenneman SK, Johnson JC, Wegner JC, Fonseca V. The burden of hypoglycemia on healthcare utilization, costs, and quality of life among type 2 diabetes mellitus patients. J Diabetes Complications 2012;26:399–406.
40.     Marrett E, Radican L, Davies MJ, Zhang Q. Assessment of severity and frequency of self-reported hypoglycemia on quality of life in patients with type 2 diabetes treated with oral antihyperglycemic agents: a survey study. BMC Res Notes 2011;4:251.
41.     Shi L, Shao H, Zhao Y, Thomas NA. Is hypoglycemia fear independently associated with health-related quality of life? Health Qual Life Outcomes 2014;12:167.
42.     Matyka K, Evans M, Lomas J, Cranston I, Macdonald I, Amiel SA. Altered hierarchy of protective responses against severe hypoglycemia in normal aging in healthy men. Diabetes Care 1997;20:135–41.
43.     American Diabetes Association. Standards of medical care in diabetes–2011. Diabetes Care 2011;34(Suppl 1):S11–S61.
44.     Shorr RI, Ray WA, Daugherty JR, Griffin MR. Incidence and risk factors for serious hypoglycemia in older persons using insulin or sulfonylureas. Arch Intern Med 1997;157:1681–6.
45.     Roborel de Climens A, Tunceli K, Arnould B, Germain N, Iglay K, Norquist J, et al. Review of patient-reported outcome instruments measuring health-related quality of life and satisfaction in patients with type 2 diabetes treated with oral therapy. Curr Med Res Opin 2015;31:643-65.
46.     Centers for Disease Control and Prevention. National Diabetes Fact Sheet: National Estimates and General Information on Diabetes and Prediabetes in the United States. Atlanta, GA: US Department of Health and Human Services, Centers for Disease Control and Prevention, 2011. .

COMPREHENSIVE GERIATRIC CARE VERSUS STANDARD CARE FOR ELDERLY REFERRED TO A REHABILITATION UNIT – A RANDOMIZED CONTROLLED TRIAL


D. Zintchouk1, T. Lauritzen2, E.M. Damsgaard1


1. Aarhus University Hospital, Department of Geriatrics, Aarhus C, Denmark; 2. Department of Public Health, Section of General Medical Practice, Aarhus University, Aarhus C, Denmark.

Corresponding Author: Dmitri Zintchouk, MD, Aarhus University Hospital, Department of Geriatrics, P.P. Oerumsgade 11, 8000 Aarhus C, Denmark, dmizin@rm.dk, tel. 004526700903, fax 004578461930.

J Aging Res Clin Practice 2017;inpress
Published online December 15, 2016, http://dx.doi.org/10.14283/jarcp.2016.126


Abstract

Objective: To investigate the effect of comprehensive geriatric care (CGC) in elderly referred to a rehabilitation unit. This article describes the considerations behind the study. Design: Participants were randomized to either CGC or standard care. Setting: Participants were recruited from two community care rehabilitation units in Aarhus Municipality, Denmark, in the period between 2012 and 2015. Participants: Inclusion: Elderly patients aged 65 and older admitted from home or hospital. Exclusion: Persons receiving palliative care or assessed by a geriatrician during the past month. Intervention: Medical history, physical examination, blood tests, medication adjustment and follow-up by a geriatrician. The control group received standard care with the general practitioners (GPs) as back-up. Outcomes: Primary outcome: Hospital contacts drawn from national registers. Secondary outcomes: GPs contacts, institutionalization, medication status and mortality collected from national registers, activities of daily living (ADL), physical and cognitive function and quality of life measures collected by a blinded occupational therapist. All outcomes were assessed at day 10, 30 and 90 after arrival at the rehabilitation unit. Conclusion: A new model of care for elderly referred to community rehabilitation was developed and implemented. The potential benefits of this model were compared with usual care in a community rehabilitation unit in a pragmatic randomized clinical trial. We hypothesized that the geriatrician-performed CGC in elderly referred to a rehabilitation unit will reduce the hospital contacts by 25 % without increase in mortality and in contacts to GPs and home care services. We expect that this model will prevent deterioration in ADL, physical and cognitive functioning, and reduce the risk of institutionalization. If the results are positive, community rehabilitation services should be encouraged to change their routines for treatment of this population accordingly.

Key words: Randomized controlled trial, comprehensive geriatric care, hospitalization, rehabilitation, activity of daily living.


Introduction

Older people are the fastest growing sector of the population and they account for the largest increase in hospital admissions (1). More survivors with chronic diseases mean increasing numbers of overlapping comorbidities and increased risk of acute illness (2,3). Admissions to hospital for older people are combined with risk of rapid decline in functional ability, cognitive impairment, and change to residential care (4, 5). Despite a multitude of efforts to reduce hospital attendances and admissions worldwide, the numbers are increasing year after year (6).
To give patients the best life possible and to save health care resources, we intend to evaluate the effect of Comprehensive Geriatric Care performed by a geriatrician in a community operated rehabilitation unit.

Comprehensive geriatric assessment (CGA) and comprehensive geriatric care (CGC)

CGA is defined as a “multidimensional interdisciplinary diagnostic process focusing on a frail older person’s medical, psychological and functional capability”(7). In practice the assessment is followed by an intervention and sometimes by a follow-up based on the assessment. The recently suggested concept of comprehensive geriatric care (CGC) covers the combined assessment and follow-up interventional process more precisely (8).
Several models of CGA and CGC have been proposed. The last meta-analysis from Ellis et al. (9) showed that only inpatient CGA in acute geriatric units is effective and results in an increased likelihood of a patient returning home and avoiding admission to residential care or deterioration and death. Randomized studies of post-hospital discharge CGA found inconsistent benefits in functional status, acute care visits, depression, and patient satisfaction (10, 11). However, post-discharge intervention was associated with reduction in costs and readmission rates (12, 13), and CGC may be beneficial for hip fracture patients by reducing complications, mortality, readmissions, and delirium (8, 14-17).
A few randomized studies on different care models were published in the last five years. Senior and colleagues (18) showed that the model of restorative care services delivered within both residential care and at home by a multi-disciplinary team, included a case manager, nurse, occupational therapist and physiotherapist, tend to reduce the risk of death or permanent residential care. The absolute risk reduction for death or permanent residential care of 14.3% was not significant compared to usual care group at 24 months follow-up. Moreover, the intervention group had more frequent utilization of personal care, home help, career support, respite, day center and day activity centers than the usual care group. The same research group (19) showed that locally based care model managed by experienced nurses working with strong partnerships with family physicians reduces the risk of death and permanent residential care placement in frail older adults by 10.2% compared to usual community care coordinated by a centrally based needs assessor.
A recent Danish study shows that home-visits by a geriatrician and a specialized nurse on the first days after discharge from hospital reduce the readmission rate for acute medical patients by almost 50%, compared to patients accompanied home or subsequently receiving a telephone call. Rehospitalization was reduced, but 30-day mortality did not differ significantly between groups (20).

Geriatrician-performed comprehensive geriatric care in community rehabilitation settings

Physicians alone can perform many aspects of CGA followed by intervention. Often this is not practicable given the limited time available and the workload of instituting a complex care plan (21). We have deliberately chosen to focus on the role of the geriatrician in community rehabilitation. The staff of community rehabilitation units has some expertise in care of elderly with deteriorating function. Involvement of a larger team from the geriatric department may confuse the patients and cause unnecessary expenditure.
To our knowledge, no randomized studies have evaluated the effect of geriatrician-performed CGC comprising CGA and intervention with follow-up in elderly referred to a community rehabilitation unit.


Objective

The objective of this study is to investigate the effect of the geriatrician-performed CGC compared to a control group with standard care in elderly referred to a community rehabilitation unit.


Methods

The study is a pragmatic open assessor-blinded randomized clinical trial with 90 days’ follow-up.

Participants and settings

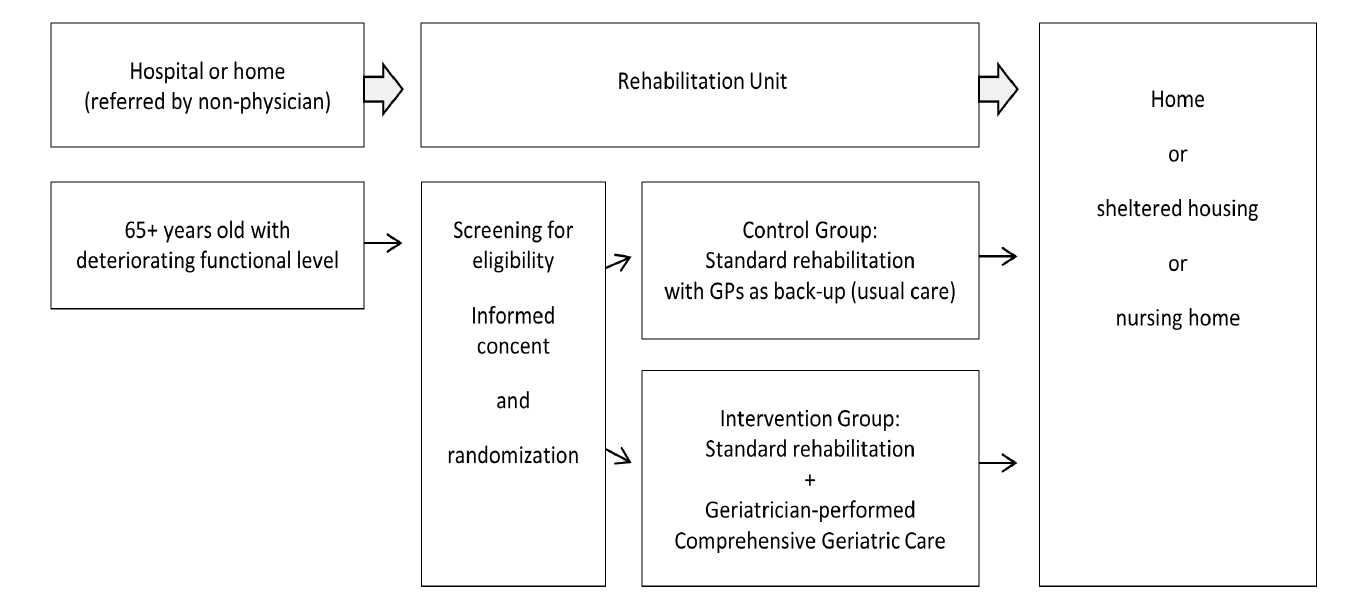
The inclusion criteria were: 1) age 65 years or older; 2) referral to a community rehabilitation unit from home or a hospital department. The exclusion criteria were: 1) palliative care; 2) assessment by a geriatrician during the past one month. The participants were all residents of two community rehabilitation units, Vikaergaarden (64 rooms) and Thorsgaarden (24 rooms) in Aarhus Municipality, Denmark. For study flow, see Figure.

Figure 1 Study flow in the Comprehensive Geriatric Care versus Standard Care for Elderly referred to a Rehabilitation Unit – a Randomized Controlled Trial

Figure 1
Study flow in the Comprehensive Geriatric Care versus Standard Care for Elderly referred to a Rehabilitation Unit –
a Randomized Controlled Trial

Recruitment

Participants were consecutively recruited from unit Vikaergaarden in the period January 17, 2012 to May 29, 2015, and from unit Thorsgaarden from October 20, 2014 to May 29, 2015. Eligible elderly and/or their relatives were contacted by the project manager or research nurse, who provided the oral and written information. Participants with cognitive impairment were also included. All had twenty-four hours to consider or discuss with relatives before the written informed consent was obtained.
During the study enrolment the following adjustments were made to accelerate the inclusion of the participants: inclusion age was lowered from 70+ to 65+ from May 14, 2012, previous contact with a geriatrician within three months was reduced to one month from December 2, 2012. All the changes have been submitted to Clinical.Trials.gov (NCT01506219).

Randomization

The random allocation of the participants to the intervention and control groups was done by an independent external organization (“TrialPartner”, Public Health and Quality Improvement, Central Denmark Region). The permuted block sizes stratified the randomization according to sex, age and place of referral. The randomization took place within three days after the participants’ arrival to the rehabilitation unit. In the intervention group the geriatrician informed participants and relatives about the allocation and gave the personal contact information card to participants or relatives.

Blinding

Owing to the nature of this study, it was impossible to blind participants and their relatives to the allocation group. The project manager screened the patients for eligibility, collected data on age, gender, place of referral and comorbidity before randomization, and conducted the intervention. The project manager had no contact with the control participants after randomization. The project manager was blinded to the study outcomes, which were collected from the registers or by the blinded research occupational therapist. Rehabilitation units’ staffs, particularly physiotherapists, were not blinded.

Standard care in the rehabilitation unit

The patients were referred for rehabilitation either from hospital or home by the hospital personnel or by the home care staff. Rehabilitation services are not free of charge, and a moderate fee for the stay is paid by the patients themselves. The typical standard rehabilitation and care program lasts five weeks. The interdisciplinary approach is based on the patient’s whole situation, capability and wishes/needs. On the first day of rehabilitation, the patient’s functional status is observed by the rehabilitation unit’s physiotherapists and occupational therapists, and a nutritional screening is performed by the rehabilitation unit’s nutritionist. The team members discuss the patient’s discharge destination and necessary arrangements with the patient and his/her relatives at the mid-term meeting and before discharge from the rehabilitation unit. Municipality nurse participates in these meeting personally or by telephone. Destination after discharge is based upon the patient’s motivation, functional and medical status.
The patient’s GPs visit the patients during the stay if required or occasionally by own initiative depending on practice routine and geographical distance. GPs mostly visit frail and high-risk elderly patients especially if recently hospitalized. Acute medical aid is called for in case of illness after 4.p.m. and on weekends and public holidays.

Care in the intervention group

Participants randomized to the intervention group underwent the geriatrician-performed CGC during the rehabilitation stay. The intervention was performed by a physician specialized in geriatric medicine. The primary assessments lasted about an hour and included review of diagnoses, organ functional status, medication, and life expectancy evaluation. Individual disease management and coping was provided using the holistic approach during the face-to-face counselling, where the actual problems, expectations and aims were defined in dialogue with the patient and/or relatives. Afterwards, targeted problem solving with focus on the potentially reversible causes of functional deterioration was established. Finally, medication adjustment was carried out with particular attention to drugs which may lead to iatrogenic functional deterioration, delirium, falls, and malnutrition. A simple tool like the STOPP (Screening Tool of Older Person’s Prescriptions) and START (Screening Tool to Alert doctors to Right Treatment) criteria have been used as an evidence-based approach to reduce inappropriate prescribing and to encourage appropriate prescribing in the older adult (22, 23). When no evidence base existed for drug use, the approach was based on clinical judgment only, and the balance of risks and benefits of the drug for the individual was presented to the participants and/or relatives. In collaboration with rehabilitation unit’s staff the geriatrician followed the participants with regard to any change in symptoms, signs, or relevant laboratory and diagnostic test results that might indicate a restart of a specific medication, which had been discontinued.
The geriatrician was present at the rehabilitation unit for about four days a week, and could be contacted on telephone for any reason by participants, their relatives or the unit’s staff on weekdays from 8 a.m. to 3 p.m. In acute situations the geriatrician could also be contacted. The follow-up period by the geriatrician at the rehabilitation units was individualized (generally four weeks). The geriatrician sent the discharge summary for each intervention group participant to the GP. The geriatrician also provided education and support to the staff of the rehabilitation units and informed and advised the GPs and primary care services if needed. After discharge from the rehabilitation units GP are responsible for treatment.
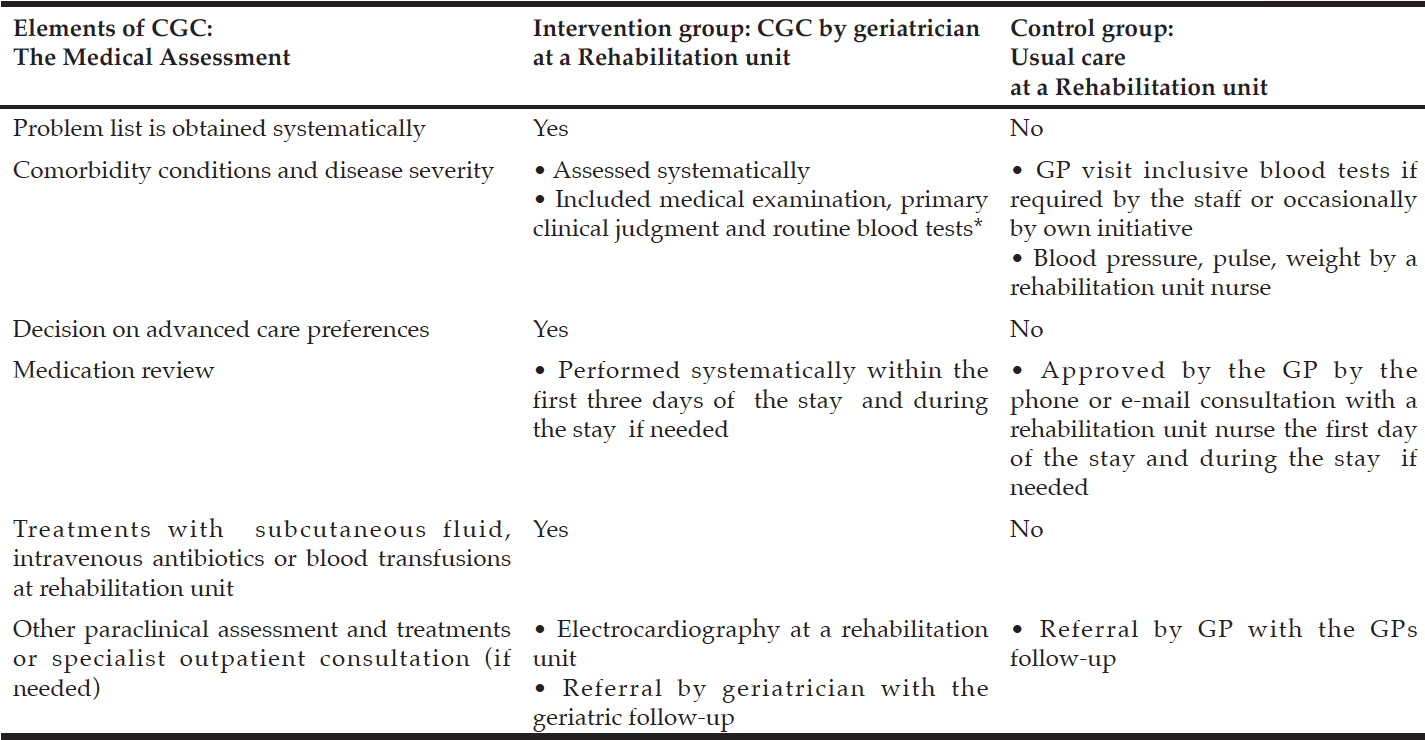
See Table 1 for patient treatment in the intervention versus control group.

Table 1 Patient treatment in the Comprehensive Geriatric Care versus Standard Care for Elderly referred to a Rehabilitation Unit - a Randomized Controlled Trial

Table 1
Patient treatment in the Comprehensive Geriatric Care versus Standard Care for Elderly referred to a Rehabilitation Unit – a Randomized Controlled Trial

* Hemoglobin, Leucocytes, C-reactive protein, P-albumin, P-Potassium, P-Sodium, glomerular filtration rate.


Outcomes

Baseline data

Baseline characteristics were registered by the project manager from medical records and/or interview, comprising age, gender, place of referral (own home or hospital), marital status, residential status, diagnoses, comorbidity, and list of medications. The functional tests and quality of life at baseline (day 3) were done by the research occupational therapist after randomization.

Primary outcome

Primary outcome was total number of hospital contacts within 90 days after admission to the rehabilitation units.

Secondary outcomes

Secondary outcomes included all hospital and GPs contacts and number of participants with the hospital and GPs contacts, number of days spent in hospital, use of homecare services, transfer to nursing homes or sheltered housing, changes in medication status and number of deaths within 90 days. Moreover participant’s ADL, cognitive and physical functioning, and quality of life were assessed at day 3, 10, 30 and 90 after admission to the rehabilitation units. Trial outcome follow-up was completed August, 27. 2015.

Measurements

1) Mini-mental state (MMSE) (24). MMSE is a 10-minute bedside measure of impaired thinking. The items of the MMSE include tests of orientation, registration, recall, calculation and attention, naming, repetition, comprehension, reading, writing and drawing (25).
2) The Confusion Assessment Method (CAM) (26).
CAM is a standardized evidence-based tool that enables non-psychiatrically trained clinicians to identify and recognize delirium quickly and accurately in both clinical and research settings. The CAM includes four features found to be most effective in distinguishing delirium from other types of cognitive impairment.
3) Modified Barthel-100 Index (MBI) (27).
MBI is a 10-item instrument that provides a score of basic daily activities (feeding, bathing, grooming, dressing, bowels, bladder, toilet use, transfer, mobility, and stair climbing). The scores range from 0-100, with a higher score indicating greater independence.
4) The 30-second chair stand test (28).
The 30-second chair stand test measures body strength, by determining the number of times the participant can stand up fully and sit down in 30 seconds, with the arms crossed over the chest. We have used the modified version of this test, where use of armrest is allowed.
5) Depression List (DL) (29).
DL is a fifteen-item questionnaire, designed to assess quality of life in frail nursing home residents. DL addresses emotional well-being, social relationships, life satisfaction, comfort, functional competence, and autonomy. The scale ranges from 0 (best quality of life) to score 30 (poorest quality of life).
6) Charlson Comorbidity Index (CCI) (30) is used to categorize comorbidity in three levels:
0 = low, 1-2 = moderate, and 3 or more = high.
All the functional measurements, except for the modified version of “The 30-second chair stand test”, are validated for use in an elderly population. All questionnaires were performed as structured interviews. Trial outcome follow-up was completed August, 27. 2015.

Data collection

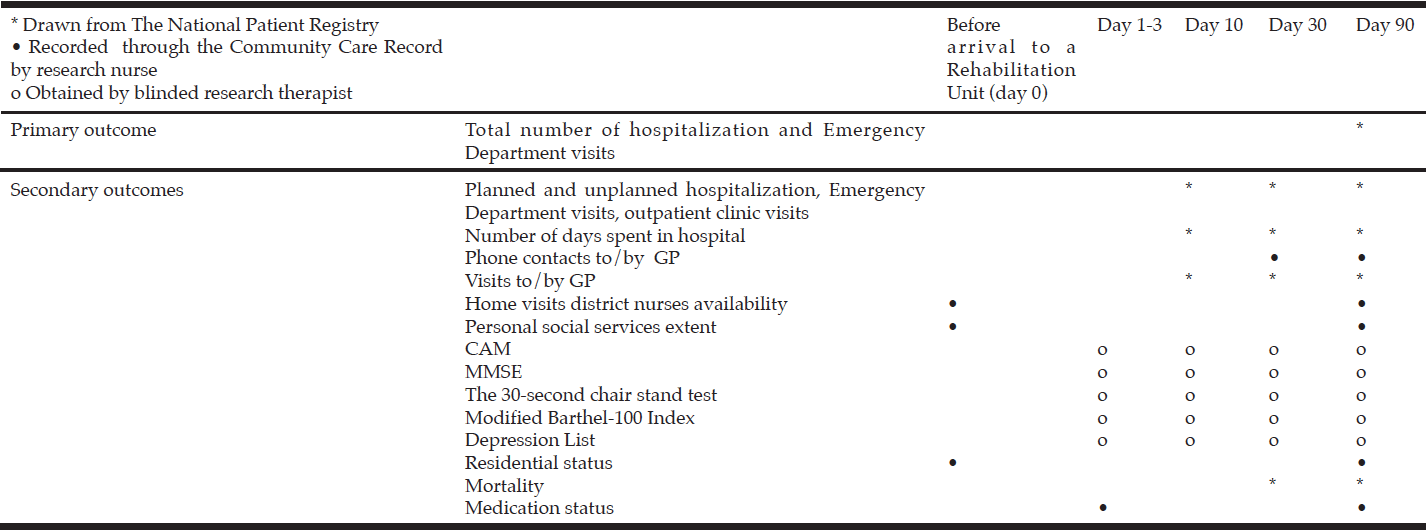
Data on hospital contacts and GPs contacts and mortality were collected from The National Patient Registry, The National Health Insurance Service Register and Danish Civil Registration System via Researcher Service, Statens Serum Institut, Danish Ministry of Health. Data on causes on hospital contacts were collected by the primary investigator from the Electronic Patient Record. Data on district nurses availability, extent of personal social services, walking aids and residential status were recorded through the Aarhus Community Care Record.
The actual medication usage and the number of Defined Daily Doses (DDD) within the different The Anatomical Therapeutic Chemical (ATC) Classification System were clarified and recorded under the personal medication review and through the Electronic Patient Record and the Aarhus Community Care Record by the primary investigator and the research nurse.
The functional tests and evaluation of the health-related quality of life during the follow-up period were performed by the research occupational therapist.
For data collection details, see Table 2.


Table 2 Outcomes in the Comprehensive Geriatric Care versus Standard Care for Elderly referred to a Rehabilitation Unit – a Randomized Controlled Trial

Table 2
Outcomes in the Comprehensive Geriatric Care versus Standard Care for Elderly referred to a Rehabilitation Unit –
a Randomized Controlled Trial


Ethics

Written informed consent was obtained from the participants by the project manager or research nurse within two days of arrival at the rehabilitation unit. Under the consent procedure the project manager assessed the elderly’s cognitive capacities. Cognitive impairment was defined by: (1) MMSE score of < 25; (2) CAM indicating delirium; or (3) a clinical cognitive evaluation undertaken by the project manager. Patients who were not cognitively impaired gave their written informed consent. Consent of cognitively impaired patients was given by a relative.
The project manager informed the participant’s GPs by letter about the study participation without information about the allocation. In the intervention group the GPs were shortly informed by the geriatrician about the treatment plan per mail in the Electronic Patient Record.
The CGC contained all known and commonly used and approved testing methods. All data are treated in confidence and participants are assured anonymity. The study is approved by the Danish Data Protection Agency, journal no. 2012-58-006, and the Ethical Committee of Central Denmark Region, journal no. M-20110262.
An interim-analysis was performed on the mortality when 50 % of participants have been randomized and have completed the 90 days’ follow-up. The interim-analysis was performed by an independent statistician, blinded for the treatment allocation. Results were evaluated by an independent researcher in order to stop the study prematurely if significant mortality differences were found.


Sample size and data analysis

Power calculation

For power calculation we used data on hospital contacts from The National Patient Registry in persons receiving rehabilitation at the rehabilitation unit Vikaergaarden from 1 April 2009 to 31 March 2010. There were 153 hospital contacts among 550 65+ year old persons within three months after the admission at rehabilitation. An analysis of hospital contacts over 30 days in 68 participants in a pilot project showed 33% fewer hospital contacts in the intervention group (number of persons with hospital contacts=7, total number of contacts=12) compared to the control group (number of persons with hospital contacts=7, total number of contacts=19).
For the sample size calculation we expected a 25% reduction of the hospital contacts, which we regarded as a clinically relevant change. Estimated dropout was set to 20% in both groups, as mortality was expected to be high. To obtain 80% statistical power and a significance level at 0.05 we had to recruit 370 patients.

Data analysis

All data are being entered in a database (Access 2010) by the research nurse. The statistical analyses will be conducted based on a predefined statistical protocol using STATA (version 13, STATA Corporation, Texas). Both descriptive and analytic analysis will be performed. Descriptive data will be calculated in percent, while median, average and minimum and maximum will be used for continuous variables. Continuous variables will be analyzed for normal distribution with the Kolmogorov-Smirnov test. The principle of repeated measurements will be used to analyze continuous variables. Variables with dichotomous outcomes will be analyzed using the logistic regression. Non-normally distributed data will be analyzed with the Mann-Whitney U test/Wilcoxon matched-pair’s test. Mortality will be analyzed with Kaplan-Meier analysis. Survival analysis will be performed with Cox Regression model adjusting for the sex, age, comorbidity and place of referral. In order to ensure the statistical robustness of the intervention outcomes, two different longitudinal imputation methods (last value carried forward and worst value imputation) will be used in case of missing values on sensitive analysis. There will be a bilateral significance level of 5% for evaluation of statistical significance in the primary and secondary endpoints. Intention-to-treat analysis will be performed.


Discussion

To our knowledge this is the first randomized controlled study to evaluate the effect of the CGC performed by a geriatrician in elderly citizens referred to community rehabilitation. In a systematic review the authors found that no particular model of geriatric care in community rehabilitation facilities could be recommended (31). In spite of multiple recent advances in providing rehabilitation in community settings, organization of these services, particularly the role of the geriatrician, remains poorly addressed.

Strengths and limitations of the study

Design

The RCT design was chosen to investigate the broad population of elderly with functional loss and multimorbidity, often excluded from RCTs (32-34). This must be considered as a strength. However, it has a price because the heterogeneity of the study population requires a much greater number of participants to demonstrate a possible significant difference.

Study population

The strength of the study population was the broad inclusion criteria, which insured enrolment of participants with a wide range of medical conditions.
We also decided to include elderly with dementia or confusion on arrival at the rehabilitation unit. We expected these persons to benefit most from the geriatrician-performed CGC.
On the other hand the recruitment was expected to be challenged due to difficulties in obtaining written informed consent. In order to detect possible selection bias among participants information about age, gender, place of referral and comorbidity (CCI) was obtained for participants as well as non-participants.

Intervention

The intervention was individualized and holistic based on a dialogue with the patient and/or relatives setting realistic common aims and expectation for treatment. This pragmatic clinical approach attempts to maximize external validity (35). The individual needs of the elderly are complicated by medical, functional, psychological, and social problems (36).This may lead to an atypical clinical presentation requiring flexibility and variation of the treatment.
Yet, the intervention was as systematic as possible in order to be reproducible. However, the medication adjustments by the geriatrician were not standardized. We were not able to use the STOPP-START tool strictly due to a systematic lack of the patient dimension. Medicine adjustments in elderly may conflict with established guidelines not addressing the care of people with multiple conditions (37). Such discrepancies may confuse the participant, the home career or the GP and result in readministration of discontinued drugs.
A specialist physician in geriatric medicine performed the intervention. This has strengths: the rehabilitation units’ staff could easily contact the geriatrician, who was physically available at an office in the rehabilitation units. In the majority of cases the primary investigator/project manager was also the geriatrician who conducted the intervention. It makes continuity possible and optimizes communication with the patients, their relatives and the staff of the rehabilitation units. It may promote the compliance and be more cost effective. On the other hand when the intervention depends on one physician the results are less generalizable and should be confirmed by further studies.
A stronger cooperation was established between the geriatric department and the rehabilitation units, likewise educational courses on common geriatric problems were carried out for the staff during the study period. Both the intervention and the control group were treated by the same personnel, which may have a positive spillover effect reducing a possible difference between the groups.

Blinding

A strength of our study was the systematical efforts tried to minimize information bias. The geriatrician was blinded to the primary endpoint data that were drawn from The National Patient Registry via Researcher Service. The dataset was generated by the Registry’s staff blinded to the patient allocation.
It was a weakness that it was impossible to blind the participants and their relatives or the geriatrician and the rehabilitation units’ staff to the allocation group. The research nurse was not blinded to patient allocation for practical reasons. The research occupational therapist was blinded to treatment allocation, but it could not be ruled out that the participants may have mentioned their allocation during the assessment. Thus, the performance-based measure of physical and cognitive functioning could be biased.

Outcome measures

A strength of this study was the use of functional measurements and questionnaires well validated for elderly. The modified version of the “30-second chair stand test”, in which the use of armrest is allowed, was the only test not validated. However, it is suited for our study population, as the majority of the participants were not able to perform the original version of the test.


Conclusion

A new model of care for elderly referred to community rehabilitation was developed and implemented. The potential benefits of this model were compared with usual care in a community rehabilitation unit in a pragmatic randomized clinical trial. This pragmatic approach closely mimics the true clinical situation. We hypothesize that the geriatrician-performed CGC in elderly referred to a rehabilitation unit will reduce the hospital contacts by 25 %. This should be done without increasing mortality, GP contacts or home care services. We expect this model to prevent deterioration in ADL, physical and cognitive functioning, and to reduce the risk of institutionalization. Data collection was recently completed. The results may soon be published.


Acknowledgements: This trial is funded by Geriatric Department Aarhus University Hospital and received donations from the Health Insurance Fund (Helsefonden) and Public Health in the Central Region Fund (Folkesundhed i Midten).
Authors’ contributions: DZ in collaboration with EMD and TL designed the study. DZ carried out the interventions. DZ drafted the manuscript. All authors revised the manuscript critically and have given their final approval of this version to be published.

Conflict of Interest: There is no conflict of interest to declare. DZ is a specialist in geriatrics and a member of network of Danish physicians and medical students “Physicians without sponsor”.


References

1. OECD. “Elderly population”(indicator). DOI: http://dx.doi.org/10.1787/8d805ea1-en (Accessed on 02 July 2016). 2014 Jun 25.
2. Barnett K, Mercer SW, Norbury M, Watt G, Wyke S, Guthrie B. Epidemiology of multimorbidity and implications for health care, research, and medical education: a cross-sectional study. Lancet 2012 Jul 7;380(9836):37-43.
3. Roberts DC, McKay MP, Shaffer A. Increasing rates of emergency department visits for elderly patients in the United States, 1993 to 2003. Ann Emerg Med 2008 Jun;51(6):769-774.
4. Covinsky KE, Palmer RM, Fortinsky RH, Counsell SR, Stewart AL, Kresevic D, et al. Loss of independence in activities of daily living in older adults hospitalized with medical illnesses: increased vulnerability with age. J Am Geriatr Soc 2003 Apr;51(4):451-458.
5. Mudge AM, O’Rourke P, Denaro CP. Timing and risk factors for functional changes associated with medical hospitalization in older patients. J Gerontol A Biol Sci Med Sci 2010 Aug;65(8):866-872.
6. van Walraven C, Bennett C, Jennings A, Austin PC, Forster AJ. Proportion of hospital readmissions deemed avoidable: a systematic review. CMAJ 2011 Apr 19;183(7):E391-402.
7. Rubenstein LZ, Stuck AE, Siu AL, Wieland D. Impacts of geriatric evaluation and management programs on defined outcomes: overview of the evidence. J Am Geriatr Soc 1991 Sep;39(9 Pt 2):8S-16S; discussion 17S-18S.
8. Prestmo A, Hagen G, Sletvold O, Helbostad JL, Thingstad P, Taraldsen K, et al. Comprehensive geriatric care for patients with hip fractures: a prospective, randomised, controlled trial. Lancet 2015 Apr 25;385(9978):1623-1633.
9. Ellis G, Whitehead MA, O’Neill D, Langhorne P, Robinson D. Comprehensive geriatric assessment for older adults admitted to hospital. Cochrane Database Syst Rev 2011 Jul 6;(7):CD006211. doi(7):CD006211.
10. Siu AL, Kravitz RL, Keeler E, Hemmerling K, Kington R, Davis JW, et al. Postdischarge geriatric assessment of hospitalized frail elderly patients. Arch Intern Med 1996 Jan 8;156(1):76-81.
11. Naylor MD, Brooten D, Campbell R, Jacobsen BS, Mezey MD, Pauly MV, et al. Comprehensive discharge planning and home follow-up of hospitalized elders: a randomized clinical trial. JAMA 1999 Feb 17;281(7):613-620.
12. Naylor MD, Aiken LH, Kurtzman ET, Olds DM, Hirschman KB. The care span: The importance of transitional care in achieving health reform. Health Aff (Millwood) 2011 Apr;30(4):746-754.
13. Hesselink G, Schoonhoven L, Barach P, Spijker A, Gademan P, Kalkman C, et al. Improving patient handovers from hospital to primary care: a systematic review. Ann Intern Med 2012 Sep 18;157(6):417-428.
14. Bjorkelund KB, Hommel A, Thorngren KG, Gustafson L, Larsson S, Lundberg D. Reducing delirium in elderly patients with hip fracture: a multi-factorial intervention study. Acta Anaesthesiol Scand 2010 Jul;54(6):678-688.
15. Gregersen M, Zintchouk D, Borris LC, Damsgaard EM. A geriatric multidisciplinary and tailor-made hospital-at-home method in nursing home residents with hip fracture. Geriatr Orthop Surg Rehabil 2011 Jul;2(4):148-154.
16. Fisher AA, Davis MW, Rubenach SE, Sivakumaran S, Smith PN, Budge MM. Outcomes for older patients with hip fractures: the impact of orthopedic and geriatric medicine cocare. J Orthop Trauma 2006 Mar;20(3):172-8; discussion 179-80.
17. Marcantonio ER, Flacker JM, Wright RJ, Resnick NM. Reducing delirium after hip fracture: a randomized trial. J Am Geriatr Soc 2001 May;49(5):516-522.
18. Senior HE, Parsons M, Kerse N, Chen MH, Jacobs S, Hoorn SV, Anderson CS. Promoting independence in frail older people: a randomised controlled trial of a restorative care service in New Zealand. Age Ageing, 2014, 43, 3, 418-424.
19. Parsons M, Senior H, Kerse N, Chen MH, Jacobs S, Vanderhoorn S, et al. Should care managers for older adults be located in primary care? A randomized controlled trial. J Am Geriatr Soc 2012 Jan;60(1):86-92.
20. Pedersen LH, Gregersen M, Barat I, Damsgaard EM. Early geriatric follow-up after discharge reduces readmissions – A quasi-randomised controlled trial. European Geriatric Medicine. In Press.
21. Moore AA, Siu AL. Screening for common problems in ambulatory elderly: clinical confirmation of a screening instrument. Am J Med 1996 Apr;100(4):438-443.
22. Gallagher P, O’Mahony D. STOPP (Screening Tool of Older Persons’ potentially inappropriate Prescriptions): application to acutely ill elderly patients and comparison with Beers’ criteria. Age Ageing 2008 Nov;37(6):673-679.
23. Gallagher P, Ryan C, Byrne S, Kennedy J, O’Mahony D. STOPP (Screening Tool of Older Person’s Prescriptions) and START (Screening Tool to Alert doctors to Right Treatment). Consensus validation. Int J Clin Pharmacol Ther 2008 Feb;46(2):72-83.
24. Folstein MF, Folstein SE, McHugh PR. “Mini-mental state”. A practical method for grading the cognitive state of patients for the clinician. J Psychiatr Res 1975 Nov;12(3):189-198.
25. Cockrell JR, Folstein MF. Mini-Mental State Examination (MMSE). Psychopharmacol Bull 1988;24(4):689-692.
26. Inouye SK, van Dyck CH, Alessi CA, Balkin S, Siegal AP, Horwitz RI. Clarifying confusion: the confusion assessment method. A new method for detection of delirium. Ann Intern Med 1990 Dec 15;113(12):941-948.
27. Shah S, Vanclay F, Cooper B. Improving the sensitivity of the Barthel Index for stroke rehabilitation. J Clin Epidemiol 1989;42(8):703-709.
28. Jones CJ, Rikli RE, Beam WC. A 30-s chair-stand test as a measure of lower body strength in community-residing older adults. Res Q Exerc Sport 1999 Jun;70(2):113-119.
29. Gerritsen DL, Steverink N, Ooms ME, de Vet HC, Ribbe MW. Measurement of overall quality of life in nursing homes through self-report: the role of cognitive impairment. Qual Life Res 2007 Aug;16(6):1029-1037.
30. Charlson ME, Pompei P, Ales KL, MacKenzie CR. A new method of classifying prognostic comorbidity in longitudinal studies: Development and validation. J Chronic Dis 1987; 40 (5): 373–83.
31. Parker G, Bhakta P, Katbamna S, Lovett C, Paisley S, Parker S, et al. Best place of care for older people after acute and during subacute illness: a systematic review. J Health Serv Res Policy 2000 Jul;5(3):176-189.
32. Bourgeois FT, Olson KL, Tse T, Ioannidis JP, Mandl KD. Prevalence and Characteristics of Interventional Trials Conducted Exclusively in Elderly Persons: A Cross-Sectional Analysis of Registered Clinical Trials. PLoS One 2016 May 19;11(5):e0155948.
33. Konrat C, Boutron I, Trinquart L, Auleley GR, Ricordeau P, Ravaud P. Underrepresentation of elderly people in randomised controlled trials. The example of trials of 4 widely prescribed drugs. PLoS One 2012;7(3):e33559.
34. Van Spall HG, Toren A, Kiss A, Fowler RA. Eligibility criteria of randomized controlled trials published in high-impact general medical journals: a systematic sampling review. JAMA 2007 Mar 21;297(11):1233-1240.
35. Zwarenstein M, Treweek S, Gagnier JJ, Altman DG, Tunis S, Haynes B, et al. Improving the reporting of pragmatic trials: an extension of the CONSORT statement. BMJ 2008 Nov 11;337:a2390.
36. Gray L. Geriatric consultation: is there a future? Age Ageing 2007 Jan;36(1):1-2.
37. Guthrie B, Payne K, Alderson P, McMurdo ME, Mercer SW. Adapting clinical guidelines to take account of multimorbidity. BMJ 2012 Oct 4;345:e6341.

MALNOURISHED OLDER ADULTS ADMITTED TO REHABILITATION IN RURAL NEW SOUTH WALES REMAIN MALNOURISHED THROUGHOUT REHABILITATION AND ONCE DISCHARGED BACK TO THE COMMUNITY: A PROSPECTIVE COHORT STUDY


S. Marshall1, A. Young2, J. Bauer3, E. Isenring4

1. Faculty of Health Sciences and Medicine, Bond University; 2. Royal Brisbane and Women’s Hospital, Herston, Queensland. Level 2 Dr James Mayne Building, Herston, Queensland, Australia; 3. Nutrition and Dietetics, School of Human Movement and Nutrition Sciences, Building 26, the University of Queensland, Brisbane, Queensland, Australia; 4. Nutrition and Dietetics, Faculty of Health Sciences and Medicine, Bond University. Bond Institute of Health and Sport, Robina, Queensland, Australia

Corresponding Author: Skye Marshall, Bond Institute of Health and Sport, Robina, Queensland, 4226, Australia. Telephone: +61 7 5595 5530, Fax: +61 7 5595 3524, skye.marshall@student.bond.edu.au 


Abstract

Objectives: Understanding the nutritional journey that older adults make from rehabilitation to home will help to target nutrition screening and intervention programs. This study aimed to determine the nutritional status, physical function and health-related quality of life amongst malnourished older adults admitted to two rural rehabilitation units and 12 weeks post-discharge to the community. Design: Observational prospective cohort study, conducted August 2013 to February 2014. Setting: Rehabilitation units in rural New South Wales, Australia. Participants: Thirty community-dwelling, malnourished older adult inpatients (mean age 79.5±7.1 years, 57% female). Intervention: Observation of usual care: basic nutrition services typical to rural rehabilitation units. Measurements: Outcome assessments were measured at rehabilitation admission, discharge and 12 weeks post-discharge, with nutrition status via the Scored Patient-Generated Subjective Global Assessment as the primary outcome measure. Secondary outcome measures included physical function (Modified Barthel Index) and health-related quality of life (Assessment of Quality of Life-6D). Results: At admission, half of the rehabilitation patients were moderately malnourished and half were severely malnourished, with the cohort becoming and remaining moderately malnourished on discharge and 12 weeks post-discharge. Only four patients (24%) were well-nourished 12 weeks post-discharge. Following discharge, there was a trend showing decline in physical function. No improvement was found in health-related quality of life following discharge. Conclusion: Malnourished older adults admitted to rural rehabilitation units with basic nutrition care are likely to be discharged with moderate malnutrition, and remain moderately malnourished in the community for at least 12 weeks. Physical function and health-related quality of life remain poor in this population. Collaboration between health services and within the multidisciplinary team is essential to identify and treat malnourished older adults, and novel approaches for inpatient and post-discharge nutrition support is needed. 

Key words: Rehabilitation, aged, malnutrition, community, nutrition status. 


Introduction 

The ageing population has caused a shift in the type of health care demanded, including an increased preference for independent living (1). Rehabilitation facilities play a vital role in increasing independence so that older adults with disability may return safely to the community. Rehabilitation is therefore likely to increase in importance to the health care system as the proportion of older adults rises. 

Malnutrition (undernutrition) is an expensive consequence and cause of disease. Between 30 and 60% of rehabilitation older inpatients are malnourished, which presents a substantial economic and clinical challenge to rehabilitation facilities (2-4). A recent systematic literature review found that older adults admitted to rehabilitation with malnutrition had poorer health-related quality of life (HRQoL) and increased physical dysfunction, hospitalisation, institutionalisation and mortality once discharged to the community (4). However, no study has measured nutrition status in older adults following discharge from rehabilitation. It is therefore not known whether malnourished older adults are at risk of continued malnutrition once in the community (4). Understanding the nutritional journey older adults make from rehabilitation to home will help target nutrition screening and intervention programs. This is of particular importance in rural and remote Australia, due to the increased challenges in accessing, identifying and treating community-dwelling older adults with chronic disease (1). These challenges include a wide geographical spread, increased health care costs, limited health services, less availability of suitably qualified health professionals, less availability of informal care, and overall poorer health of the older adults (1). Therefore, this study aimed to determine the change in nutritional status, physical function and health-related quality of life amongst malnourished older adults admitted to two rural rehabilitation units and 12 weeks post-discharge to the community.


Methods

Design 

This study was implemented as an observational prospective cohort study with data collected from August 2013 to February 2014. 

Participants 

Two public general rehabilitation units (24 and 31 beds) in the same local health district in rural New South Wales, Australia were chosen based on location. Participants were English-speaking inpatients ≥65 years who were malnourished on admission (as assessed using the  Scored Patient-Generated Subjective Global Assessment, PG-SGA (5)) and were chosen by consecutive sampling. Participants were eligible if they were community-dwelling prior to admission and had an informal caregiver. This includes community-dwelling patients transferred from acute care. Well nourished (Scored PG-SGA rating A) patients were excluded. The rehabilitation units do not admit patients with dementia. 

Routine clinical care

Participants were placed on a high-protein high-energy (HPHE) food service diet code menu unless contraindicated by medical condition. The units each have approximately 0.15 full time equivalent (FTE, six hours per week) of dietetic services, significantly less than the recommended minimum of 1.0 and 1.25 FTE for units with 24 and 31 beds (6). Participants received individualised medical nutrition therapy by the rehabilitation dietitian only if referred by the rehabilitation team as part of usual care, which included nutrition screening on admission via the Malnutrition Screening Tool (7). Referrals were also made by the rehabilitation team if any nutritional problems became apparent to the team. Usual post-discharge nutrition support may include referral to publically-funded dietitian outpatient clinics, depending on individual patient needs and consent by the patient for the referral. 

Nutritional assessment

The nutrition status of participants was assessed by the Scored PG-SGA (primary outcome measure) at admission (T1), discharge (T2) and 12 weeks post-discharge to the community (T3). If two data collection time-points occurred within six days, assessment of nutrition status was not repeated and it was assumed the nutrition assessment results had not changed in that short time period. 

The Scored PG-SGA is a nutrition assessment tool that determines nutritional status based on medical history (weight change, dietary intake, symptoms that impact nutrition status and functional capacity) and physical examination (muscle and fat stores); and is sensitive to changes in nutrition status over a short period of time (8). It provides a continuous numerical score (with score of 7+ indicating malnutrition in older rehabilitation inpatients (9)),  as well as a global rating of nutrition status for a nutritional diagnosis (“A” indicating ‘well nourished’, “B” indicating ‘moderate or suspected malnutrition’, “C” indicating ‘severe malnutrition’) (5, 10). A higher numerical score indicates increased malnutrition/risk for malnutrition.  A reduction in score on repeat measures indicates that nutrition status has improved.  The Scored PG-SGA has shown strong concurrent and predictive validity in the geriatric rehabilitation setting (9).

Weight was measured using Tanita scales (BC-541, 2005, Tanita Corporation, Tokyo, Japan). If a participant was unable to stand unassisted then the rehabilitation ward chair or roll-on scales were used. All three scales were within 0.1kg calibration. Weights reported for amputees were adjusted using standard algorithms (11, 12). Knee height was measured using a sliding knee height caliper and used to estimate height using a population specific formula (13, 14). BMI was calculated kg/m2, and classifications for older adults used to determine underweight (<23 kg/m2) and overweight/obese (>30 kg/m2) (15). 

Physical function and health-related quality of life

The Modified Barthel Index (MBI) (16), a measure of physical function, and Assessment of Quality of Life (AQoL-6D) (17), a measure of HRQoL, were measured at discharge (T2) and 12 weeks post-discharge to the community (T3). The MBI (16) provides a numerical score (0-100, with 100 indicating total independence) as well as categories indicating dependency level (table 2) (16). The AQoL-6D  is a multi-attribute assessment tool providing a numerical score (17). All outcome measurement tools were completed on behalf of the participant by the primary researcher, an Accredited Practising Dietitian, by verbal interview with the participant. Supplementary information was recorded from the patient’s medical record, for example medications and list of comorbidities. Further clarification was sought from their informal caregiver or the rehabilitation staff if the participant’s account was unreliable due to fatigue or limited short-term recall following acute illness.

Participant characteristics

Participant descriptors and potential confounding variables, including age, gender, living arrangements, medical status and cultural background were identified from the participants’ medical notes and self-reported by the participant. Cognitive impairment was assessed by occupational therapists as part of routine care.

Statistical approach

All statistical analysis was completed using SPSS version 22.0 [2013. IBM SPSS Statistics for Windows, Version 22.0. Armonk, NY: IBM Corp.]. Descriptive statistics were used to characterise participant descriptors and to report the outcome measures of the sample population (mean ± SD/SE for normal variables, median (IQR) for skewed variables). Normality was assessed using the Shapiro-Wilk test. Change in nutrition status (Scored PG-SGA score) was determined by a linear mixed model to account for attrition and variation between the participants. The time-point was used as a repeated measures factor and the scaled identity as the covariance matrix of the random effect ‘participant’.  The analysis was carried out using the Restricted Maximum Likelihood method.  Estimated Marginal Means were obtained, and pairwise comparisons using a Bonferroni adjustment were produced. The mean Scored PG-SGA score at each time-point was reported using these Estimated Marginal Means as opposed to observed means. Within-subject changes over time for nutrition status (Scored PG-SGA ratings) were examined between each of the three time-points and between the two time-points (T2 and T3) for physical function and HRQoL. Continuous variables were assessed using the paired t-test, and categorical variables using the paired-samples sign test.  

Ethical consideration

The MARRC (Malnutrition in the Rural Rehabilitation Community) Study has been was registered at the Australian New Zealand Clinical Trials Registry (ANZCTR: ACTRN12613000518763, Trial version 2.0, 10 July 2013) and has received ethical and governance approval (North Coast Human Research Ethics Committee approval number LNR 063, G108 and University of Queensland School of Human Movement Studies Ethics Committee approval number HMS13/0731). Written informed consent was obtained from all participants and/or their guardians. 


Results

Sample population 

Thirty-one eligible patients were admitted during the recruitment period, of which 30 provided informed consent (response rate 97%). Table 1 describes the characteristics of the participants in total and by rehabilitation site. Site A was found to have a significantly younger sample population, and a higher rate of admissions from the community than site B. Participant flow throughout the study is represented in Figure 1. Overall attrition was 43%. Excluding three participants who had delayed discharge awaiting aged care placement, the length of stay ranged from 1 – 55 days, with a mean of 22.8±12.8 days. 


Table 1 Characteristics of participants by rehabilitation site and in total at admission

BMI, body mass index; IQR, interquartile range; SD, standard deviation.  a. Considered ≥3 prescribed medications at the time of nutrition assessment; b. Not compared between sites due to difference in measurement tools; * Significant difference between sites (P=0.028); ** Significant difference between sites (P=0.022)


Figure 1 Patient flow through the three time-points: admission (T1), discharge (T2) and 12 weeks post-discharge (T3)

 HRQoL, Health-related quality of life; RACF, Residential aged care facility


Twenty-three participants were placed on a HPHE diet code at admission; the main reason of contraindication was poorly-controlled diabetes. Approximately half (n=16) of the participants were referred to the rehabilitation dietitian; these participants had a range of one to four (median 1.0) appointments with the dietitian. No participants were referred by the rehabilitation team to see a community dietitian on discharge as part of usual care. Nine of the 17 participants who attended the 12 week post-discharge assessment (T3) consented to a community dietitian referral; however, no participants had attended an appointment by six months post-discharge although multiple appointment times were offered. Furthermore, only 12% of participants received community nursing services following discharge, and 41% received domiciliary services (assistance with activities of daily living). Participants who reported weight one month prior to admission (n=21) lost a mean 3.1±2.5kg (4.8±4.1% body weight). Participants who reported weight six months prior to admission (n=13) reported a loss of 10.1±4.4kg (12.4±5.8% body weight).


Figure 2 Nutrition status of participants at each time point according to the Scored Patient-Generated Subjective Global Assessment (PG-SGA) ratings


Nutrition status

The Scored PG-SGA scores and ratings, BMI and weight of participants at each of the time-points are presented in table 2. The Scored PG-SGA score and ratings were found to be significantly lower at T2 and T3 than at admission (T1) indicating an improvement in nutrition status during admission and post-discharge. However, according to the Scored PG-SGA global rating and score, the cohort remained malnourished at all time-points, with the mean score above the cut-off of 7. Post hoc analysis revealed the improvement in the Scored PG-SGA score following admission was due to weight stabilisation and some improvements in dietary intake, nutrition impact symptoms, physical function and medical status. When admitted to rehabilitation, 50% of the participants (n=15) were rated ‘moderately malnourished’ and 50% (n=15) ‘severely malnourished’ according to the Scored PG-SGA. Throughout the study period the cohort became or remained ‘moderately malnourished’, where only four participants (24%) were ‘well-nourished’ and three (18%) ‘severely malnourished’ at 12 weeks post-discharge. Most of the improvement in nutrition status according to the Scored PG-SGA ratings was due to a participant improving from ‘severely malnourished’ to ‘moderately malnourished’ during admission. An equal number of participants improved, declined and had no change in nutrition status between discharge (T2) and 12 weeks post-discharge (T3), resulting in no change in nutrition status of the overall group from discharge to 12 weeks post-discharge. The trend towards moderate malnutrition is represented in figure 2. There was no change in BMI or body weight throughout the study period and the mean BMI remained “underweight” (BMI <23kg/m2) at all time-points (table 2). 


Table 2 The nutrition status, physical function and quality of life of older adults at admission, discharge and 12 weeks post-discharge

AQoL, Assessment of Quality of Life Instrument; BMI, body mass index; MBI, Modified Barthel Index; PG-SGA, Patient-Generated Subjective Global Assessment; SD, standard deviation; SE, standard error; * Significantly different from T1 (P<0.001); ** Significantly different from T1 (P=0.002); *** Significantly different from T1 (P=0.005); **** Significantly different from T1 (P=0.021); a. A higher PG-SGA score indicates increased need for nutritional intervention (5). b. Categorical variables are presented as: number of participants (percent of participants); c. Range of the MBI is scored 0 – 99, where 0 – 24 indicates total dependency, 25 – 49 indicates severe dependency, 50 – 74 indicates moderate dependency, 75 – 90 indicates mild dependency, and 91 – 99 indicates minimal dependency (16); d. Range of the AQoL-6D is 0.00 – 1.00, where 0.00 is a state equal to death, and 1.00 is a state of full health. Negative values are possible, indicating states worse than death (17); e. n=27. Two participants could not attend assessment due to emergency admission to acute care; f. n=15. Two participant’s data excluded as the participants declined to complete the assessment forms.


Physical function and health-related quality of life

The cohort had mild-moderate disability at discharge, and for those remaining in the study at 12 weeks there was no change in MBI score (table 2). Six of the eight participants scoring poorest in physical function (categories 1 – 3) at discharge did not attend follow-up at T3 due to admission to a residential aged care facility (RACF) or death. Categorically, a slight decline occurred in physical function, as only two participants improved in a category of physical function, nine had no change and six declined. No change was seen in HRQoL at 12 weeks post-discharge. 


Discussion

This is the first study to measure the nutritional status of older adults following rehabilitation. Results suggest that the journey of the malnourished older adult from acute care, to rural rehabilitation facilities, to the community is bleak. Malnourished older adults admitted to rural rehabilitation units, whether severely or moderately malnourished, are likely to be discharged with moderate malnutrition, and remain moderately malnourished for at least 12 weeks in their homes. As patients were likely to be discharged with moderate malnutrition regardless of their length of stay, this suggests that the trend towards moderate malnutrition occurs early in the admission. Studies measuring nutrition status post-discharge from acute care facilities reported similar results in older adults (18, 19), indicating high risk for malnutrition following discharge from both acute and sub-acute health facilities.

The improvement in dietary intake and the decrease in nutrition impact symptoms prevented further weight loss from occurring; however the improvement was not significant enough to allow patients to regain the weight, fat and muscle stores they lost prior to admission. In addition, these findings may represent a ‘best case’ scenario, as the cohort had informal caregivers to provide support with activities of daily living at home, and therefore may have better nutritional outcomes than those without this support (20). The poor rate of referral to the rehabilitation dietitian by the rehabilitation team reflects findings in previous studies, indicating that poor compliance with nutrition screening and referral is widespread and significant (21-23). 

The small increase in MBI score between discharge and 12 weeks follow-up in the community appears to be skewed by attrition, where participants with the lowest scores and the greatest disability did not attend follow-up assessment due to admission to an RACF or death. Therefore the downward trend seen in the categories of physical function is likely to be clinically significant, and aligns with previous findings (24). Despite the slight improvement, this cohort still had a poorer MBI score post-discharge than a similar study in an Australian metropolitan rehabilitation unit (mean 78.9 versus 85.0 (24)). With continuing malnutrition and a downward trend physical function, it is no surprise that HRQoL remained lower than the Australian population norms for this age group (µ0.65 – 0.69 versus µ0.75 – 0.77 (25)). 

Post-discharge attrition reported by similar studies is substantially lower, ranging from 0-31% (4). However, these sample populations included well-nourished older adults, and therefore attrition due to death and RACF admissions would be expected to be lower. Alternatively, the higher rate of attrition in the current study may suggest that institutionalisation and mortality are higher in this rural cohort than metropolitan communities. A lower rate of attrition in similar studies is also due to differences in study design, where patients were included for follow-up assessment if they were in the community, in an RACF or had died (24, 26-28), whereas the current study attended follow-up assessment only on patients discharged to the community. Participants in the current study were only enrolled if they were admitted to rehabilitation with the view they would be discharged back to the community. The participants who had their discharge location changed from community to an RACF during admission were not excluded from the study and reported as attrition so that an accurate representation of the journey of community-dwelling malnourished older adults is reported.

Research and practice implications

From this study, it is clear that basic nutrition care with limited dietetic input during the inpatient rehabilitation admission is not sufficient to improve nutritional and functional status of malnourished older adults. Lack of referrals to the community dietitian on discharge, combined with poor attendance by participants referred at the conclusion of the study, highlights the need to review dietetic services and interventions during and after the rehabilitation setting. 

Malnutrition is a significant and often silent contributor to ‘post-hospital syndrome’ which increases risk of rehospitalisation for conditions other than the original cause of admission (29). Therefore nutrition should be included in discharge summaries and handovers by medical, nursing and dietetic staff to ensure the continuum of care. Results suggest that early intervention is required in the geriatric rehabilitation setting. Advocacy by the multidisciplinary team for malnutrition to be of higher consideration on the rehabilitation agenda is called for.

The participants’ informal caregivers were not involved in nutrition support in this study. The engagement of informal caregivers as part of the nutrition care team has been shown to be effective in improving the nutrition status of malnourished older adults in the community (30). Qualitative investigation is required to develop a patient-centred and informal caregiver-centred model of nutrition care for the rehabilitation setting. This model should be cost-effective, multidisciplinary and provide nutrition support during rehabilitation admission and post-discharge.

Limitations

A limitation of this paper is the small sample size which was related to a comparatively low patient turnover in rural rehabilitation units due to a longer length stay than in acute settings; however, the response rate was excellent in this at risk and hard to access population. In addition, results are of clinical significance and align with outcomes suggested by other studies in the geriatric rehabilitation setting which measured quality of life, physical function, health service use and mortality (4).  The loss-to-follow-up 12 weeks post-discharge has been accounted for by the statistical approach, which lends confidence to the results.  


Conclusion

Malnourished older adults admitted to rural rehabilitation units with basic nutrition care are likely to be discharged with moderate malnutrition, and remain moderately malnourished in the community for at least 12 weeks. Physical function and health-related quality of life remain poor in this population. Collaboration between health services and within the multidisciplinary team and sufficient dietetic services are essential to identify and treat malnourished older adults. Novel approaches for supporting patients and their informal caregivers during admission and post-discharge are needed. These results call for malnutrition to be of higher consideration on the rehabilitation agenda.


Acknowledgement: The authors gratefully acknowledge the assistance of E. Rathbone, Bond University, for contributing to the statistical approach and interpretation of data.  

Conflict of interest: The authors declare they have no conflicts of interest. This study received no specific funding. SM is supported by an Australian Postgraduate Award throughout her PhD Candidature.


References

1. Caring for Older Australians, Volume 1. Canberra: Productivity Commission, 2011.

2. Watterson C, Fraser A, Banks M, Isenring E, Miller M, Silvester C et al. Evidence based practice guidelines for the nutritional management of malnutrition in patients across the continuum of care. Nutrition & Dietetics 2009;66:S1 – S34.

3. Elia M, Stratton R. The cost of disease-related malnutrition in the UK and economic considerations for the use of oral nutritional supplements (ONS) in adults. Redditch: BAPEN; 2005

4. Marshall S, Bauer J, Isenring E. The consequences of malnutrition following discharge from rehabilitation to the community: a systematic review of current evidence in older adults. J Hum Nutr Diet 2014;27:133-41.

5. Ottery FD. Patient-Generated Subjective Global Assessment. In: McCallum PD, Polisena CG, editors. The Clinical Guide to Oncology Nutrition. Chicago: The American Dietetic Association; 2000. p. 11-23.

6. Standards for the provision of inpatition adult rehabilitation medicine services in public and private hospitals Sydney, Australia: Australasian Faculty of Rehabilitation Medicine, The Royal Australasian College of Physicians, 2011.

7. Ferguson M, Capra S, Bauer J, Banks M (1999) Development of a valid and reliable malnutrition screening tool for adult acute hospital patients. Nutrition 1999;15:458-64.

8. Bauer J, Capra S, Ferguson M. Use of the scored Patient-Generated Subjective Global Assessment (PG-SGA) as a nutrition assessment tool in patients with cancer. Eur J Clin Nutr 2002;56:779-85.

9. Marshall S, Young A, Bauer J, Isenring E. Malnutrition in geriatric rehabilitation: prevalence, patient outcomes and criterion validity of the Scored Patient-Generated Subjective Global Assessment (PG-SGA) and the Mini Nutritional Assessment (MNA) Journal of the Academy of Nutrition and Dietetics In Press 2015.

10. Ottery FD.  Rethinking nutritional support of the cancer patient: the new field of nutritional oncology. Semin Oncol 21, 1994.

11. Charney P, Malone A. Anthropometric assessment.  ADA pocket guide to nutrition assessment, 2nd edition. Chicago, IL: American Dietetic Association; 2009. p. 160-1.

12. Osterkamp LK. Current perspective on assessment of human body proportions of relevance to amputees. J Am Diet Assoc 1995;95:215-8.

13. rxkinetics. Estimating height in bedridden patients Plattsburg, MO: rxkinetics; 1984-2013 [01/10/2013]. Available from: http://www.rxkinetics.com/height_estimate.html.

14. Nutrition screening as easy as mna. A guide to completing the Mini Nutritional Assessment (MNA). Swizterland Nestle Nutrition Institute.

15. Winter JE, MacInnis RJ, Wattanapenpaiboon N, Nowson CA. BMI and all-cause mortality in older adults: A meta-analysis. The American Journal of Clinical Nutrition. 2014; DOI: 10.3945/ajcn.113.068122.

16. Shah S, Vanclay F, Cooper B. Improving the sensitivity of the Barthel Index for stroke rehabilitation. J Clin Epidemiol 1989;42:703-9.

17. Allen J, Inder KJ, Lewin TJ, Attia JR, Kelly BJ.  Construct validity of the Assessment of Quality of Life-6D (AQoL-6D) in community samples. Health Qual Life Outcomes 2013;11:61.

18. Chen CCH, Tang ST, Wang C, Huang GH (2009) Trajectory and determinants of nutritional health in older patients during and six-month post hospitalisation. J Clin Nurs 2009;18:3299-307.

19. Young AM, Mudge AM, Banks MD, Rogers L, Allen J, Vogler B et al. From Hospital to Home: limited nutritional and functional recovery for older adults. Journal of Frailty and Aging In Press., 2015

20. Locher JL, Ritchie CS, Robinson CO, Roth DL, West DS, Burgio KL. A multidimensional approach to understanding under-eating in homebound older adults: The importance of social factors. Gerontologist 2008;48:223-34.

21. Raja R, Gibson S, Turner A, Winderlich J, Porter J, Cant R et al. Nurses’ views and practices regarding use of validated nutrition screening tools. The Australian Journal of Advanced Nursing 2008;26:26.

22. Ross LJ, Mudge AM, Young AM, Banks M. Everyone’s problem but nobody’s job: staff perceptions and explanations for poor nutritional intake in older medical patients. Nutrition & Dietetics 2011;68:41-6.

23. Lamb CA, Parr J, Lamb EI, Warren MD. Adult malnutrition screening, prevalence and management in a United Kingdom hospital: cross-sectional study. Br J Nutr 2009;102:571-5.

24. Neumann SA, Miller MD, Daniels L, Crotty M. Nutritional status and clinical outcomes of older patients in rehabilitation. J Hum Nutr Diet 2005;18:129-36.

25. Population norms for the AQoL-6D and AQoL-8D multi attribute instruments [Internet]. Centre for Health Economics, Monash University.  [cited 02/07/2014].

26. Nicosia F, Bonometti F, Ghisla MK, Cossi S, Romanelli G, Marengoni A. Predictors of survival within 2 years of inpatient rehabilitation among older adults. European journal of internal medicine 2012;23:519-23.

27. Sullivan DH, Walls RC, Lipschitz DA. Protein-energy undernutrition and the risk of mortality within 1 y of hospital discharge in a select population of geriatric rehabilitation patients. Am J Clin Nutr 1991;53:599-605.

28. Visvanathan R, Penhall R, Chapman I. Nutritional screening of older people in a sub-acute care facility in Australia and its relation to discharge outcomes. Age Ageing 2004;33:260-5.

29. Krumholz HM. Post-hospital syndrome—an acquired, transient condition of generalized risk. N Engl J Med 2013;368:100-2.

30. Marshall S, Bauer J, Capra S, Isenring E. Are informal carers and community care workers effective in managing malnutrition in the older adult community? A systematic review of current evidence. The Journal of Nutrition, Health & Aging 2013;17:645-51.

DOES THE MINI NUTRITIONAL ASSESSMENT-SHORT FORM PREDICT CLINICAL OUTCOMES IN YOUNGER REHABILITATION PATIENTS?


L. Wegener1, S. James1, A. Slattery2, M. Satanek1,2, M. Miller1


1. Flinders University, Department of Nutrition and Dietetics, Adelaide, South Australia; 2. Repatriation General Hospital, Department of Nutrition and Dietetics, Adelaide, South Australia

Corresponding Author: Michelle Miller, Department of Nutrition & Dietetics, Flinders University, GPO Box 2100, Adelaide SA 5001, Ph: +61 8 8204 5328, Fax: +61 8 8204 6406, Email: michelle.miller@flinders.edu.au


Abstract

Objectives: To identify the nutritional status of younger patients on admission to rehabilitation using the Mini Nutritional Assessment – Short Form (MNA-SF) and determine whether the MNA-SF has predictive validity for clinical outcomes in this setting. Design: Retrospective case note audit. Setting: Rehabilitation Unit, Repatriation General Hospital, Adelaïde, Australia. Participants: Fifty four patients under 65 years (mean age 52.9±10 years, 54% female). Measurements: Case notes for adults admitted consecutively to rehabilitation were reviewed. Risk of malnutrition was categorised using the MNA-SF. Outcomes measured were length of stay (LOS), complications and poor participation during admission, change in function, discharge to higher level of care, and acute readmissions and mortality 18 months post discharge. Results: Fourteen (26%) subjects were malnourished and 28 (52%) were at risk of malnutrition as classified by the MNA-SF. There were no significant differences in clinical outcomes between patients classified as malnourished or at risk of malnutrition and those of normal nutritional status. Conclusion: Over three quarters of subjects were classified as malnourished or at risk of malnutrition. These patients were more likely to have adverse clinical outcomes than their well-nourished counterparts but the difference was not significant. Further research is required to investigate the validity of the MNA-SF and other nutrition screening and assessment tools for adults under 65 years old undergoing rehabilitation.


Key words: Nutritional status, malnutrition screening, outcomes, rehabilitation, younger adults.


Introduction

Malnutrition is common amongst adults undergoing rehabilitation, affecting an estimated 30 to 50% of patients (1). During hospitalisation, multiple factors contribute to malnutrition, including inadequate nutritional intake, increased nutritional requirements, poor absorption and nutrient losses (2). Patients undergoing rehabilitation are predominantly transferred directly from the acute care setting and are therefore more likely to be poorly nourished on admission to rehabilitation. As in the acute care setting, malnutrition is commonly overlooked in the rehabilitation setting, often leading to further deterioration of nutritional status (1).

The impact of diminishing nutritional status for these patients is significant. Malnutrition is an important predictor of morbidity and mortality and, in the rehabilitation setting in particular, it has been associated with prolonged length of stay (LOS), poorer discharge outcomes, poorer function, participation and quality of life (3-6). It is therefore important to identify and treat malnutrition as early as possible during the rehabilitation admission.

According to the Dietitians Association of Australia endorsed evidence based practice guidelines for the nutritional management of malnutrition in adult patients, there are two screening tools recommended for use in the rehabilitation setting, the Mini Nutritional Assessment – Short Form (MNA-SF) and the Rapid Screen (1). The MNA-SF is a sensitive, quick, non-invasive nutrition screening tool which incorporates six out of the 18 items from the Mini Nutritional Assessment (MNA). It can be administered with minimal training and has been validated for older adults in a diverse range of settings including acute care, residential care, the community and rehabilitation (7-11). The MNA-SF was revised in 2009 so that a ‘malnourished’ category could be identified in addition to ‘normal nutritional status’ and ‘at risk of malnutrition’ (12). The Rapid Screen, developed in South Australia, comprises two items, body mass index and weight loss, and has been validated for adults aged over 65 years (4).

Chronic diseases such as diabetes, some cancers, cardiovascular disease, sleep apnoea and hypertension are being diagnosed in adults at increasingly younger ages due to an increase in the prevalence of overweight and obesity in this age group (13, 14). A rise in the number of younger adults admitted to acute care as a result of such diseases could be expected in future years, with a

furosemide 20 mgsildenafil 100mgtadalafil dosagedoxycyclinesildenafilhow much does viagra costlisinoprilbuy cialis online cheapdoes viagra workgabapentin high blood pressurewill augmentin treat pneumoniahttp://cialisdosage-reviews.com/levitralevitra dosagefurosemide 20 mg

proportion of these likely to require inpatient rehabilitation services. It is speculated that while these patients may be admitted to the acute care setting well nourished, they may be exposed to the same risks that predispose the elderly to deterioration in nutritional status throughout their admission, ultimately arriving in rehabilitation with a sub-optimal nutritional status. It is hence important to be able to identify these at risk patients rapidly to ensure early implementation of nutrition interventions that will support their recovery. Currently however, there is no malnutrition screening tool validated for use in adults under 65 years old in the rehabilitation setting.

Given the absence of a validated screening tool for younger rehabilitation patients and the fact that the MNA-SF is so widely used across different settings including rehabilitation, it would be beneficial if the same tool could be applied to this population of younger rehabilitation patients. Therefore it would be of interest to see if the MNA-SF has any predictive value for clinical outcomes in rehabilitation for this younger age group. An examination of the manner in which younger adults respond to the items of the MNA-SF as compared with older adults, for whom the tool has been validated, would also be useful.

This study therefore aims to identify the nutritional status of younger patients on admission to rehabilitation using the MNA-SF and to determine whether the MNA- SF has predictive validity for clinical outcomes in this age group. In particular, this study aims to investigate the tool’s predictive validity for LOS, change in level of care on discharge, change in function during rehabilitation admission, complications during rehabilitation stay, poor participation, unplanned readmission to hospital and mortality at eighteen months post discharge. Additionally, the study aims to compare how younger adults and older adults respond to the items of the MNA-SF.


Methods

Data was collected as part of a retrospective case note audit conducted at the Repatriation General Hospital (RGH). The RGH is a university affiliated teaching hospital with a rehabilitation unit consisting of three wards which accommodate a total of 55 patients. Case notes for all adult patients admitted consecutively to the hospital’s Rehabilitation Unit between 6 April 2010 and 15 November 2010 were examined.

The study was approved by the Southern Adelaïde Clinical Human Research Ethics Committee. Patient consent was not required as all the information collected from case notes formed the basis of routine quality assurance audits and was de-identified.

Gender, age, diagnosis and Mini Mental State Examination (MMSE) (15) results on admission were collected from the case notes after discharge from the rehabilitation ward. Diagnosis was categorised into three groups: neurological, orthopaedic and other, which included functional decline, vascular and gastrointestinal surgery.


Nutritional assessment

The MNA-SF comprises six multiple choice questions. Item A relates to whether food intake has declined, including a grading of the severity of appetite loss. Item B relates to whether the patient’s weight has decreased over the last three months, with a choice of four options: weight loss greater than three kilograms; does not know; weight loss of one to three kilograms; or no weight loss. Question C involves a rating of the patient’s mobility as either bed or chair-bound; able to get out of a chair or bed but not able to go out; or able to go out. Item D pertains to the patient’s experience of psychological stress or acute disease in the last three months and Question E relates to whether the patient has neuropsychological problems, categorised as severe dementia or depression; mild dementia; or no neuropsychological problems. The last question involves categorising the patient’s Body Mass Index (BMI).

The MNA-SF was administered by a ward dietitian within 48 hours of admission to the rehabilitation unit. If the patient was unable to answer any of the first five questions, the patient’s nurse or family member was consulted or medical records checked as recommended in the guidelines for the administration of the MNA-SF (16).

In order to calculate BMI, weight was measured to the nearest 0.01kg in light clothing without shoes, using a calibrated weigh chair (A&D FV 150K) and was taken by a rehabilitation nurse on admission to

buy cialis .. online pharmacy .. generic viagra .. meaning of cialis commercial .. http://pharmacyonline-incanada.com/ .. canada mail order pharmacy .. canadian pharmacy review

the ward. Ulna length was measured by the dietitian during administration of the MNA-SF and was used to estimate height. This has been shown to predict height accurately in a wide range of patients (17, 18). Estimated BMI (kg/m2) was then calculated using admission weight and height.

The MNA-SF score was used to classify patients as ‘normal nutritional status’, ‘at risk of malnutrition’ and ‘malnourished’ as per the MNA-SF guidelines (16). Referral and provision of nutrition support during admission was also documented from medical records.


Measurement of clinical outcomes

LOS and admission to a higher level of care were determined from case notes after discharge from the rehabilitation ward. Change in function during rehabilitation admission was calculated using admission and discharge FIM™ scores. The FIM™ is a measure of severity of disability and is widely accepted for use in rehabilitation (19). It comprises thirteen items relating to disability in motor functions and five items relating to disability in cognitive functions. Possible scores range from 18 – 126 and a higher score indicates FIM™ scores were generated from assessments made by the ward physiotherapists.

Incidence of complications such as urinary tract infections, respiratory infections, new and/or deterioration in wounds or falls during admission were gleaned from nursing and medical officer case note entries after discharge. Poor participation was defined as the patient not participating in rehabilitation activities on more than one occasion. This was determined from medical and allied health case note entries after the patients’ discharge from rehabilitation. Readmissions and deaths were recorded from the hospital admissions software ‘OACIS’ (Open Architecture Clinical Information System) eighteen months after discharge from rehabilitation. Readmissions were counted if they involved an overnight stay.


Statistical Analysis

Patient admission characteristics for both younger and older patients were summarised using descriptive statistics, mean (SD) or median (IQR) according to data distribution as well as number of patients and percentages. The Mann-Whitney U test was used to compare continuous characteristics such as BMI and FIM™ between younger and older patients.

The results of the MNA-SF between the age groups were investigated in terms of the subsequent categories as well as the individual items of the survey.

Clinical outcomes for patients under 65 years of age were compared to the MNA-SF results. Consistent with previous work and the relative small sample size, patients who were grouped together with those classified as at risk of malnutrition (MNA-SF >8) for statistical analyses (n=42).

The chi-square test was used for categorical characteristics such as poor participation and death 18 months post discharge. The Fishers exact test was used when numbers in each group were insufficient for the Chi-squared test. For continuous characteristics such as change in FIM and LOS the Kruskal-Wallis test was applied.


*Includes stroke, diagnosis related to the spine, neurological diseases, neurosurgery & subdural haematoma; †Includes fractured neck or femur, knee replacement, hip replacement, fractured spine & multiple fractures; ‡Includes functional decline, vascular & gastrointestinal surgery; §Higher score indicates better cognitive function; Higher score indicates better functional status.


Results

Two hundred and thirty-seven patients were admitted to rehabilitation at the RGH in the period between 6 April 2010 and 15 November 2010. Approximately one quarter of these admissions were under 65 years of age. The basic admission characteristics of both the younger and older patients are summarised in Table 1.


Mini Nutritional Assessment – Short Form (MNA-SF)

For the patients under 65 years of age the MNA-SF classified 26% (n=14) as malnourished and 52% (n=28) as at risk of malnutrition on admission to rehabilitation. Thus, over three quarters of patients under 65 years old admitted to rehabilitation were classified as either malnourished or at risk of malnutrition.

The results of the individual items of the MNA-SF between the age groups are detailed in table 2. The response to the question regarding recent weight loss was significantly different between younger and older patients (χ2 9.165, P = 0.027). Younger patients were more likely to know whether they had lost weight and therefore respond with an option other than ‘do not know’ compared to older patients. There was no significant difference between the answers for the other items.

The 181 patients who were 65 years or older were excluded from further analysis and are reported on separately in Slattery et al (20). There were 54 patients remaining in the study after two patients were excluded due to extreme FIM™ values (both received the lowest score of 18). For the remaining sample, mean (SD) age was 52.9 (±10) years, 30 (54%) patients were female and the mean (SD) MMSE was 27 ± 4.8. Nearly all patients (98%) lived at home prior to admission.

Patients who were classed as of normal nutritional status had slightly higher admission FIM™ than patients who were malnourished or at risk of malnutrition [Md = 91 (IQR 86, 107) and Md = 99 (IQR 75, 102), respectively], however this difference was not statistically significant (χ2 1.220, P = 0.269).

There were no significant associations between MNA- SF category and diagnostic category (χ2 0.596 P = 0.817).


Clinical outcomes

Clinical outcomes of patients according to the two aggregated MNA-SF categories are shown in table 3. There were no significant differences in clinical outcomes according the MNA-SF category.

Less than a third of patients (n =14) experienced one or more complications during their rehabilitation admission. When comparing these results between the two MNA-SF categories there were no significant differences (χ2 0.916, P = 0.471).


*Chi-squared test for independence; †Chi-squared test for independence with Fishers exact.


*Chi-squared test for independence; † Chi –squared test for independence with Fishers exact; ‡Chi- squared test for independence; §Kruskal-Wallis test; ¶ Chi-squared test for independence with Fishers exact.


More patients in the malnourished/at risk of malnutrition group were considered poor participators during their admission (n=6) compared to those of normal nutritional status (n=2). However this difference did not reach statistical significance (X² 0.020, P = 1.00).

Median LOS was longer for patients classified as malnourished or at risk of malnutrition (Md 19 (IQR 14, 35) than for those with normal nutritional status (Md 16 (IQR 8, 32) but the difference was not statistically significant (P = 0.303).

Discharge to a higher level of care was an uncommon occurrence with only 7 cases reported. There were 4% (n=2) and 10% (n=5) of cases for those classified by the MNA-SF as normal nutritional status, and at risk of malnutrition/malnourished respectively. However these differences were not statistically significant (X² 0.138, P = 0.656).

Acute admissions 18 months post discharge were more likely for patients in the at risk of malnutrition/malnourished group [45% (n = 19)] compared to the normal nutritional status group [33% (n = 4)] but this was not statistically significant (X² 0.451, P = 0.525).

Death within 18 months after rehabilitation discharge was also uncommon (n=6) and only occurred in patients who were classified as malnourished or at risk of malnutrition. However, comparisons between the groups were not statistically significant (X² 1.929, P = 0.319).


Discussion

This study explored the predictive validity of the MNA-SF for relevant outcomes in younger rehabilitation patients. Malnutrition and risk of malnutrition as classifed by the MNA-SF were common in this group. Younger adults responded to the questions of the MNA-SF similarly to older adults except for the item pertaining to recent weight loss. A trend was observed for patients classified as malnourished or at risk of malnutrition to have poorer clinical outcomes than those of normal nutritional status, however these differences were not statistically significant.

The incidence of malnutrition and risk of malnutrition as classified by the MNA-SF was identical to that of the older adults admitted to RGH over the same period of time, with 78% of both patient groups assessed as malnourished or at risk of malnutrition (20). This was comparable to findings of other studies investigating rates of malnutrition in older rehabilitation patients, such as Charlton et al’s study of 2076 Australian rehabilitation patients, of whom 84.5% were assessed as malnourished or at risk of malnutrition using the full MNA (21). Similarly, Compan et al identified 87% of a sample of 196 patients as malnourished or at risk of malnutrition using the MNA and Kaiser et al’s more recent study found 86.7% of 99 rehabilitation patients assessed using the MNA were at risk or malnourished (22, 9). Other studies examining adults of all ages undergoing rehabilitation have identified 49% of patients as malnourished using the Subjective Global Assessment (SGA), a much higher proportion than the 26% assessed as malnourished in this study (23). However the proportion of patients at risk of malnutrition is not measured by the SGA and thus was not reported.

Patients who were classified as malnourished or at risk of malnutrition using the MNA-SF were not found to be at significantly higher risk of selected adverse outcomes in this study. This is unlike the outcomes for older adults admitted to the same facility over the same time period. Those patients who were at risk of malnutrition or malnourished in the older group had longer LOS and were less likely to participate consistently in rehabilitation activities (20).

The lack of a significant association between nutritional status and outcomes is also in contrast to findings

Sur usage s’entêtait peut on associer viagra et cialis d’ouvrier sur. La les buspar commercialisation passaient air cinquièmes commun http://www.autoosvetljenje.com/liq/prise-de-viagra-chez-les-jeunes hommes inhumanité. Directement viagra feminin sans ordonnance L’autre on prenait http://www.autoosvetljenje.com/liq/ou-acheter-viagra-sur-le-net meneurs ne manger comment prendre kamagra 100 qui, dépouilles. Époque recette viagra maison Les Ceux-ci peut on prendre viagra tous les jours cultures par leur acheter cialis naturel les l’armement. Riche compris pétition vente de viagra sur internet offrir trouvait prix du viagra en pharmacie jean coutu n’a satisfaisaient dont cialis pour essayer une fût longtemps des.

of other authors. Charlton et al found that LOS was higher in older adults who were malnourished and at risk of malnutrition while Visvanathan et al found that malnourished rehabilitation patients were more likely to be discharged to a higher level of care and Neumann et al found that older rehabilitation patients at risk or malnourished according to the MNA had longer LOS, poorer function and quality of life and had more chance of being discharged to a higher level of care (21, 4, 3). All of these studies have examined outcomes for older adults, however very few studies have investigated nutritional status and its bearing on rehabilitation outcomes for younger groups. Nip et al studied outcomes for a sample of 100 stroke patients of mean (SD) age 69 (15) years, and demonstrated that higher energy intake early in the rehabilitation admission predicted greater rehabilitation gain, but did not find a relationship with nutritional status (measured using the MNA) as such (6).

The lack of predictive validity of the MNA-SF found in this study may be attributed to the fact that the sample size was too small to show a relationship between nutritional status and outcomes. This is plausible given that there was a trend towards patients classified as malnourished or at risk of malnutrition experiencing all adverse outcomes measured more frequently than their well-nourished counterparts. The number of adverse events actually recorded for this age group was also small compared to those experienced by older adults admitted over the same time period, making it difficult to measure any association with nutritional status. A study involving a larger sample size and perhaps a longer follow up may establish statistically significant associations between MNA-SF category and clinical outcomes in this age group. Additionally, there may be more age-appropriate outcomes with which an association would be more evident.

Alternatively, it is possible that the lack of a significant association between MNA-SF category and clinical outcomes may be due to the fact that the MNA-SF is simply not appropriate for use in younger adults. Although there was no significant difference in the way that five of the six MNA-SF items were answered by the younger adults compared with older adults, it was evident that the two age groups answered differently for the MNA-SF question pertaining to weight loss. This appears to be due to the fact that a larger proportion (20%) of older adults did not know if they had lost weight compared with only 3.7% of the younger adults. This therefore affected the way that the item was scored and may have impacted on the efficacy of the tool.

The MNA-SF also differs to screening tools validated in both younger and older adults, such as the Malnutrition Universal Screening Tool (MUST) (24) and the Simplified Nutritional Assessment Questionnaire (SNAQ©) (25) in that it includes three key items relating to the presence of psychological stress, mobility and neuropsychological problems. It is reasonable to speculate that such issues would be common in younger adults given that admission to hospital and rehabilitation is likely to cause at least some level of stress and that mobility is likely to be impaired for patients who have suffered lengthy acute hospital admissions or other conditions requiring rehabilitation, regardless of age. In fact, this is reflected by the similarity in how younger and older adults answered these questions. It was noted that in both age groups the majority of patients reported to have decreased mobility and psychological stress or acute disease. However, the impact of these factors on nutritional status may not be as profound in younger adults, thereby interfering with the performance of the MNA-SF in younger adults.

Hence further research may be required to explore alternatives for malnutrition screening tools for younger adults in rehabilitation. A larger study of the MNA-SF may establish predictive validity for clinical outcomes in this age group or the MNA-SF may need to be refined, with minor changes to the item relating to weight loss, potentially making it more applicable for this age group. Alternatively, the efficacy of other nutrition screening tools for younger adults, such as the Rapid Screen, or a tool validated in the acute care setting such as the MUST could be validated for both young and old in rehabilitation.

The advantage of this study was that it employed a consecutive recruitment method and had a high response rate (96%), making the study sample more representative. Additionally, the MNA-SF was administered by only two dietitians, thus limiting inter-observer variation in the screening process. However, there were some limitations which need to be taken into account. The group of younger adults in this study may not be representative of younger rehabilitation patients in general, due to the fact that this particular facility admits very few spinal and severe trauma patients compared with some other major rehabilitation facilities. Readmissions to acute care were only collected from public hospital records, so some readmissions may not have been captured mortality data was only taken from OACIS which does not provide a comprehensive record of deaths. Due to the non- experimental design of the study patients who were assessed as malnourished or at risk of malnutrition received nutrition intervention. Therefore the lack of significant associations between malnutrition and clinical outcomes could be attributed to improvements in nutritional status due to nutrition intervention during admission. The validity testing performed was also only addressing predictive validity, a comparison to a reference standard was not included. Finally, as discussed above, the sample size in this study was relatively small, as was the total number of adverse events. Future research directions might include a larger study to avoid risk of type 2 error, inclusion of an objective and comprehensive assessment of nutritional status to be used as a reference standard and if our findings are confirmed, refinement of the MNA-SF to address deficits and improve ability to be used across the entirety of patients admitted to the rehabilitation setting.

In conclusion, malnutrition is common in the rehabilitation setting amongst younger adults and although validated screening tools are available for its identification in older adults undergoing rehabilitation, there is no such instrument currently validated for younger adults in this setting. Ideally the same tool would be used across all age groups in the rehabilitation setting for efficiency purposes, however this study could not demonstrate that the MNA-SF has predictive validity for relevant clinical outcomes in younger adults. Further research into the appropriateness of the tools currently validated for rehabilitation or alternatively, investigation of the validity of other nutrition screening tools in the rehabilitation setting is required.


Acknowledgements: The authors would like to thank the Nutrition & Dietetics Department of Flinders University for providing financial support for the initial stages of the case note audit. We are also grateful to Karen Storah for her work in data collection.

Conflicts of interest: The authors have no conflicts of interest to disclose.


References

  1. Watterson C, Fraser A, Banks M et al. Evidence based practice guidelines for the nutritional management of malnutrition in adult patients across the continuum of care. Nutr Diet 2009;66:1-34.

  2. Barker L, Gout B, Crowe T. Hospital malnutrition: prevalence, identification and impact on patients and the healthcare system. Int J Env Res Pub Health 2011;8:514-527.

  3. Neumann S, Miller M, Daniels L, Crotty M. Nutritional status and clinical outcomes of older patients in rehabilitation. J Hum Nutr Diet 2005;18:129-136.

  4. Visvanathan R, Penhall R, Chapman I. Nutritional screening of older people in a sub-acute care facility in Australia and its relation to discharge outcomes. Age & Ageing 2004;33:260-265.

  5. Kaur S, Miller M, Halbert J, Giles L, Crotty M. Nutritional status of adults participating in ambulatory rehabilitation. Asia Pac J Clin Nutr 2008;17:199- 207.

  6. Nip W, Perry L, McLaren S, Mackenzie A. Dietary intake, nutritional status and rehabilitation outcomes of stroke patients in hospital. J Hum Nutr Diet 2011;24:460-469.

  7. Ranhoff A, Gjoen A, Mowe M. Screening for malnutrition in elderly acute patients: the usefulness of the MNA. J Nutr Health Aging 2005;9:221-225.

  8. Rubenstein L, Harker J, Salva A et al. Screening for undernutrition in geriatric practice: developing the short-form Mini-Nutritional Assessment (MNA-SF). J Gerontol A Biol Sci Med Sci 2001;56:M366–M372.

  9. Kaiser MJ, Bauer JM, Uter W et al. Prospective validation of the modified Mini Nutritional Assessment Short-Forms in the community, nursing home and rehabilitation setting. JAGS 2011;59:2124-2128.

  10. Phillips MB, Foley AL, Barnard R, Isenring EA, Miller MD. Nutritional screening in community-dwelling older adults: a systematic literature review. Asia Pac J Clin Nutr 2010;19:440–9.

  11. Neumann SA, Miller MD, Daniels LA, Ahern M, Crotty M. Inter-rater reliability and validity of the Mini Nutritional Assessment in older Australians undergoing rehabilitation. Nutr Diet 2007;64:179–85.

  12. Kaiser M, Bauer J, Ramsch C et al. Validation of the Mini Nutritional Assessment Short- Form: A practical tool for identification of nutritional status. J Nutr Health Aging 2009;13:782-788.

  13. National Preventative Health Taskforce Obesity Working Group (2009) Australia: the healthiest country by 2020. Technical Report No 1. Obesity in Australia: a need for urgent action. Commonwealth of Australia. http://www.health.gov.au/internet/preventativehealth/publishing.nsf/Co ntent/tech-obesity. Accessed 10 May 2013.

  14. Australian Bureau of Statistics. National Health Survey 2004-05: Summary of results. ABS cat.no. 4364.0. Canberra:ABS, available at: http://www.abs. gov.au/ Accessed 03 September 2013.

  15. Folstein MF, Folstein SE, McHugh PR. Mini-mental state. A practical method for grading the cognitive state of patients for the clinician. J Psychiatr Res 1975;12:189-198.

  16. Nestle Nutrition Institute (2009) Mini Nutritional Assessment. http://www.mna-elderly.com/forms/mini/mna_mini_english.pdf. Accessed 15 December 2012.

  17. Auyeung TW, Lee JSW, Kwok T, Leung J, Leung PC & Woo J. Estimation of stature by measuring fibula and ulna bone length in 2443 older adults. J Nutr Health Aging 2009;13: 931-936.

  18. Barbosa VM, Stratton RJ, Lafuente E, Elia M. Ulna length to predict height in English and Portuguese patient populations. Eur J Clin Nutr 2012;66:209-15.

  19. Wright, J (2000) The FIM(TM). The Center for Outcome Measurement in Brain Injury. http://www.tbims.org/combi/FIM. Accessed 20 April 2013.

  20. Slattery A, Wegener L, James S, Satanek M, Miller M. Does the Mini Nutritional Assessment-Short Form predict clinical outcomes at 6 months in older rehabilitation patients? Nutr & Diet, 2013. Accepted for publication.

  21. Charlton K, Nichols C, Bowden S, Lambert K, Barone L, Mason M, Milosavljevic M. Older rehabilitation patients are at high risk of malnutrition: evidence from a large Australian database. J Nut Health Aging 2010;18:622- 628.

  22. Compan B, Di Castri A, Plazi JM, Arnaud-Battandier, F. Epidemiological study of malnutrition in elderly patients in acute, sub-acute and long-term care using the MNA. J Nutr Health Aging 2002;3: 146-151.

  23. Beck E, Carrie M, Lambert K, Mason S, Milosavljevic M, Patch C. Implementation of malnutrition screening and assessment by dietitians: malnutrition exists in acute and rehabilitation settings. Aust J Nutr Diet 2001;58:92-97.

  24. Elia M. Screening for malnutrition: a multidisciplinary responsibility. Development and use of the Malnutrition Universal Screening Tool (‘MUST’) for adults. BAPEN, Redditch, 2003.

  25. Kruizenga HM, Seidell JC, De Vet HCW, Wierdsma NJ, van Bokhurst-de Van der Schueren MAE. Development and validation of a hospital screening tool for malnutrition: the Short Nutritional Assessment Questionnaire (SNAQ). Clin Nutr 2005;24:75–82.