jarlife journal
Sample text

AND option

OR option

INCREASING PROTEIN INTAKE TO HELP OLDER ADULTS INCREASE MUSCLE STRENGTH AND FUNCTION: A PILOT, SINGLE-ARM INVESTIGATION USING COACHING AND A PER-MEAL PROTEIN PRESCRIPTION


S.S. Gropper1, M. Exantus1, K.L. Jackson1, S.M. Spiers2, E.R. Vieira3, D. D’Avolio1, A. Opalinski1, R. Tappen1


1. Christine E Lynn College of Nursing, Florida Atlantic University, Boca Raton, FL, USA; 2. School of Medicine, St. George’s University, Grenada, West Indies; 3. Department of Physical Therapy, Florida International University, Miami, FL, USA.

Corresponding Author: Sareen S. Gropper, Christine E Lynn College of Nursing, Florida Atlantic University, 777 Glades Road, Boca Raton, FL 33432. Phone 561 297 3614; Fax 561 297 2416; Email sgropper@health.fau.edu

J Aging Res & Lifestyle 2020;9:9-13
Published online June 9, 2020, http://dx.doi.org/10.14283/jarlife.2020.4


Abstract

Objective: To evaluate the effects of nutrition education, diet coaching, and a protein prescription (PP) on protein intake, and associations with muscle strength and function. Design: Prospective pretest posttest single-arm study. Setting: Urban area, East coast of South Florida. Participants: 20 white, non-Hispanic adults, aged 73.3 + 10.4 years. Intervention: 10-week telephone-based diet coaching, nutrition education and a per-meal PP. Measurements: Protein and energy intakes, weight, grip strength (GS), and 5-chair-rise (5CR), timed up and go (TUG), 3-meter walk (3mW) tests at baseline and 10 weeks. Results: Pre to 10-week post values significantly improved (p<0.05) for protein intake/kg body weight (0.8 + 0.3 to
1.2 + 0.3g), protein intake/meal (17.2 ± 4.8g to 26.4 ± 6.g), protein intake/100 kcal (3.74 + 1.16 to 5.97 + 0.98g), GS (22.4 to 23.4kg), and times for TUG (10 to 8sec), 3mW (4 to 3sec), and 5CR (13 to 11sec). Conclusions: Given the positive findings of this unique pilot investigation, additional studies, which include a larger more diverse group of participants and provide for control group(s), are needed to better investigate the effectiveness of this approach and its effects on muscle strength and function.

Key words: Protein intake, coaching, strength.


Introduction

The synthesis of body proteins, including muscle, requires the consumption of the appropriate amounts of essential amino acids from protein-containing foods. Many older adults fail to consume enough protein (1, 2). An uneven/skewed protein intake pattern is also common in the United States, with adults typically ingesting the majority of protein at the evening meal, and the least amount at breakfast (1, 2). Inadequate protein intake along with skewed protein distribution among meals has been associated with reduced muscle protein synthesis, muscle mass, strength, and physical/functional performance (3-6). Sarcopenia, characterized by reduced muscle mass, strength and function, is associated with aging and exacerbated by low protein ingestion (7).
A per-meal high-quality protein intake of 20–35 g has been suggested to improve protein synthesis needed for muscle protein repair and maintenance, and to sustain muscle mass, strength and function in older adults (8-10). Studies examining the effects of protein on muscle have typically provided participants with supplements (whey, casein- or soy-based powders or amino acids) versus allowing participants to self-select protein-rich foods (10-14). Coaching has been used successfully to help adults change dietary behaviors, primarily improving food choices to reduce disease risks associated with type 2 diabetes, heart disease, and obesity (15-18). Missing from the literature, and which will be fulfilled from this study, is the use of coaching for the purpose of helping adults to improve their protein intake and the use of protein-rich foods (not supplements) to improve muscle strength and physical function. This pilot study examined the effects of nutrition education, diet coaching and a per-meal protein prescription on dietary protein intake (with participants self-selecting protein-rich foods), and associations with muscle strength and physical function in a group of older adults.


Methods

Participants, design, and setting

This 10-week prospective, single-arm pilot study, using a pretest posttest design approach, recruited participants from a low-income residential-living community, a congregate meal site, and a hospital-affiliated center in an urban area on the east coast of South Florida. Participant inclusion criteria were 55 years or older, self-reported as healthy (without cognitive impairments assessed using the Mini-Cog (19) screening test), English speaking/reading, able to communicate by telephone, and consuming < 0.4 g protein/kg body weight at two or more meals/day (assessed from a 3-day dietary recall taken at baseline). Exclusion criteria included a renal disease diagnosis and vegan diet. The study was approved by the University’s Institutional Review Board for the Protection of Human Subjects in Research. This trial is registered at clinicaltrials.gov as NCT04378556.

Procedures

Sociodemographic information (sex, age, country of birth, and education-level) was collected at baseline. Height was assessed using a height rod at baseline and weight was measured using an electronic scale (Healthometer, Model 349KLX, McCook, IL) at baseline and 10-weeks. Height and weight were used to calculate Body Mass Index (BMI, in kg/m²).
Nutritional status was assessed at baseline using the mini-nutritional assessment (MNA) short form, which is a well-known, validated tool for assessing risk of malnutrition in older community-dwelling adults (20, 21). The MNA includes questions on food intake/recent appetite, unintentional recent weight loss, mobility, the presence of acute disease or psychological stress (illness, bereavement), the presence of neuropsychological problems (dementia, depression), and body mass index. The maximum attainable score is 14, with scores > 12 indicating normal nutritional status, scores of 8 – 11 indicating risk for malnutrition, and scores < 8 indicating malnutrition (20, 21).
Protein, carbohydrate, fat, and energy (kcal) intakes were assessed at baseline, 5 and 10-weeks from three (2 weekdays and 1 weekend day) 24-hour diet recalls at each time point. Dietary recalls were collected using multiple-pass dietary recall methodology and analyzed using diet analysis software (ESHA, Salem, OR). This nutrition analysis software program, widely used for research studies, has an extensive food and nutrient database of more than 100,000 foods (22, 23). The software database includes, for example, data from the United States Department of Agriculture Standard Reference database (which provides the basis for most food composition databases) as well as from food manufacturers and restaurants. Mean protein intake at meals, obtained from the analysis of three 24-hour dietary recalls taken at baseline, was used to determine if participants were consuming < 0.4 g/kg body weight at two meals and met study inclusion criteria. Protein intake (g/kg body weight) was also compared to the Recommended Dietary Allowance (RDA) for protein (0.8 g protein/kg body weight) and protein requirement (0.66 g protein/kg body weight) (24). The macronutrient contents of the diet were also calculated as a percentage of energy at baseline and 10-weeks.
The following well-established strength and functional tests were completed at baseline and 10-weeks: dominant-hand grip strength (GS) (Jamar dynamometer, Performance Health, Cedarburg, WI), timed up and go (TUG) test, and the Short Physical Performance Battery (SPPB) consisting of timed measures of balance, 3-meter walk (3mW)/gait speed, and 5-chair rises (5CR) (7, 25-27). The TUG, 3mW, and grip strength assessments were each completed three times, with the average value used for statistical analyses. GS, 5CR, and gait speed measurements at baseline and 10 weeks were compared with cut-off points used to assess risk for sarcopenia. The cut-off values used for GS were < 27 kg for men and 16 kg for women, for 5CR times > 15 sec., for gait speed < 0.8 meters/seconds, and for TUG times > 20 seconds (7).
The week following baseline data collection, participants met individually with a Registered Dietitian and received a per-meal protein prescription (0.4 g protein/kg body weight/meal) and nutrition education (verbally and written) addressing protein-containing food sources and food portion sizes needed to meet the protein prescription. Diet coaching sessions were provided by telephone once/week over the next 9 weeks and were focused on helping participants improve protein-rich food selections at meals. The coaching process was based on the Health and Wellness Nurse-coaching Model (28). Fundamental elements of the coaching process included structured interactions, a person-centered focus, goal setting, and facilitation of a process of personal dietary behavior change. Goals, set weekly by participants, were specific, measurable, achievable and realistic. Some of the techniques used to facilitate the process of personal dietary behavior change as well as to empower and motivate participants to help them to achieve their goals and overcome barriers/obstacles included motivational interviewing, intentional listening, affirmation, and somatic awareness (29).
To ensure fidelity, coaching sessions were scripted. Coaching sessions lasted about 25-30 minutes during the first 5-weeks; sessions lasted about 15-20 minutes during the remainder of the study period. During weeks 3 and 8, group nutrition education was also provided. Participants were instructed not to change exercise habits or to try to gain or lose weight during the study.

Statistical analyses

Dietary protein and energy intakes, grip strength, TUG, 3mW, 5CRT, and SPPB scores were analyzed using repeated measures analysis of variance (InStat, GraphPad Software, San Diego, CA). Statistically significant findings from repeated measures ANOVA were followed by a Tukey’s test. A p-value of <0.05 indicated statistical significance.


Results

Participants and Study Adherence

Twenty white, non-Hispanic adults (15 females, 5 males), aged 73.3 + 10.4 years, completed the study. Two additional participants began the study but withdrew due to non-study related illness. The participants’ education levels were: 30% graduated high school without further education, 20% some college (less than 4 years), 30% college degree, and 20% post-college education. None of the participants reported taking corticosteroids or other anti-inflammatory medications on a daily basis. Body mass index (BMI), calculated from weight and height values at baseline, averaged 25.2 + 4.2 kg/m2; 12 participants had a BMI between 18.5-24.9 kg/m2, five had a BMI 25-29.9 kg/m2, and three had a BMI >30 kg/m2. Weight at baseline averaged 68.3 + 16.8 kg and did not significantly differ from the end-of-study weight of 68.3 + 16.7 kg. MNA scores averaged 12, with a range of 9-13; based on the MNA scores, four of the 20 participants were classified as “at risk for malnutrition”. Nineteen of the 20 participants engaged in at least 70% of coaching sessions.

Dietary Protein and Energy Intakes

Protein intake per meal, per kg body weight, and per 100 kcal increased significantly from baseline to weeks 5 and 10, with no significant differences between weeks 5 and 10 (Table 1). At baseline 23 + 17% of meals met the per-meal protein prescription versus 51 + 25% at week 10 (p < 0.01). Energy intake did not significantly differ over time (baseline: 1465 + 499 kcal, week 5: 1593 + 524 kcal, and week 10: 1393 + 375 kcal).
The percentages of energy from protein at baseline and at 10 weeks were 17 + 5% and 23 + 4% respectively, from carbohydrate were 45 + 9% and 41 + 7% respectively, and from fat were 37 + 8% and 35 + 7%, respectively. The percentage of energy from protein, but not from carbohydrate and fat, at baseline versus week 10 differed, with a significantly (p=0.0001) higher percentage of energy from protein observed at the end of the study versus baseline.
At baseline, four participants (20%) consumed less than the protein requirement, and six (30%) ingested less than the protein RDA (24). At week 10, no participants consumed less than the protein requirement, and two (10%) participants consumed just below the RDA, averaging 0.76 g and 0.79 g protein/kg body weight/day.

Table 1
Protein intake at baseline and after 5 and 10 weeks of nutrition education and coaching in a group of older adults

a,b Values with different letter superscripts are statistically significantly different


Muscle Strength and Physical Function

Significant improvements were observed for GS, TUG, 3mW, and 5CR between baseline and 10 weeks (Table 2). No significant change in the SPPB score was found.
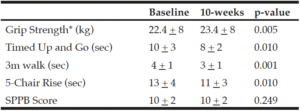
Table 2
Grip strength, timed up and go, 3m walk, 5-chair rise, and Short Physical Performance Battery (SPPB) score at baseline and after 10-weeks of increased dietary protein intake in a group of older adults

*Grip strength data from 18 participants.


At baseline, one male and one female had a GS below the cut-off points for sarcopenia risk (i.e. < 27 kg and 16 kg, respectively) (7); at 10-weeks, GS for these participants were still below the cut-off values. At baseline, six participants had 5CR times > 15 seconds, indicating poor lower body muscle strength and indicative of sarcopenia (7). However, by 10-weeks, only one participant exhibited times in excess of this cutoff value. No participants exhibited a gait speed < 0.8 meters/seconds or TUG times > 20 seconds, characteristic of sarcopenia and frailty (7).


Discussion

This investigation is believed to be the first to provide participants with a per-meal protein prescription, nutrition education, and diet coaching aimed at improving protein intake among participants through participant’s self-selection of protein-rich food sources. This approach not only helped to increase protein intake at each meal and thus daily protein intake, but also provided for a more even distribution of protein throughout the day.
Protein intake by participants at baseline was found to be skewed with the lowest intake observed at breakfast and the highest intake at dinner. This finding was expected and similar to that observed in other studies (1, 2). The per-meal protein prescription and coaching helped participants identify protein-rich foods which could be consumed at breakfast and lunch to improve protein intake. Other studies have also demonstrated significant improvements in protein intake in adult participants; however, these studies have provided the participants with essential amino acid mixtures, protein powders (usually whey- or milk-based), or other protein-containing supplements for ingestion at specified times (10-14). The approach used in this study is thought to more closely reflect real life dietary habits, permit more diversity within the diet, and is likely more sustainable over time (versus when costly supplements are study-provided) (30). Further research, however, is needed to examine whether the increase in dietary protein intake behaviors was maintained post-study.
The increase in protein intake among participants was also consistent with the findings of other studies using coaching. These other studies, however, successfully used coaching to help participants improve food choices to reduce risks of conditions such as diabetes, heart disease, and obesity (15-18). In systematic literature reviews, coaching has been shown to significantly impact behavior change including dietary modifications (15, 17). Consistent with the Health and Wellness Nurse-coaching Model (28), the weekly coaching sessions used in this study assisted participants in establishing goals related to protein intake at meals, empowering and motivating participants to help them to achieve their goals, and helping participants to identify and arrive at solutions to any obstacles/barriers impeding goal achievement (28, 29).
Small but significant increases in GS and significant reductions in times needed to complete 5CR, 3mW (gait speed) and TUG were found. These improvements may have resulted from the increased overall protein intake/kg body weight, which by week 10 averaged 1.2 g protein/kg body weight, and perhaps from the increased per-meal protein intake, which by week 10 averaged 20 g or more/meal. However, further studies that include a control group and a larger and well-powered sample size are required. The higher protein intakes have been shown to overcome anabolic resistance in muscle protein synthesis that has been observed in older adults (8). Other studies have also shown increases in muscle strength and physical performance (similar to this investigation) as well as increases in muscle mass with higher protein intakes in older adults; however, participants in these other studies were provided directly with supplemental protein sources (amino acids or protein powders) for consumption at selected meals or specific times (10-14, 31).
The findings of this investigation are limited by a number of factors. The sample size was small, included primarily (75%) females, and was also not racially or ethnically diverse. The participants also resided in urban areas in South Florida. Diet recalls were not obtained from participants for the 10 weeks prior to the start of the intervention to verify that protein intake was not changed by other factors. Despite these limitations, this unique pilot investigation provides data to inform the development of a well-powered, randomized controlled trial; such a trial may respond to the question of whether the use of nutrition education, diet coaching, and a per-meal protein prescription are effective in helping adults improve intake of protein-containing foods and meet recommendations for protein intake and if protein intake improvement translates into clinical benefits (eg, muscle function) for the individuals.


Conflicts of Interest: The authors declare no conflicts of interest.

Funding source: None.


References

1. Berner LA, Becker G, Wise M, Dot J. Characterization of dietary protein among older adults in the United States: Amount, animal sources, and meal patterns. J Acad Nutr Diet, 2013; 113(6): 809-15.
2. USDA. Agricultural Research Service. Energy intake: percentages of energy from protein, carbohydrate, fat and alcohol by gender and age, what we eat in America, NHANES 2009-2010. 2012. Available from http://www.ars.usda.gov/ba/bhnrc/fsrg
3. Kim B, Schutzler S, Schrader A, Spencer H, Kortebein P, Deutz NEP, Wolfe RR, Ferrando AA. Quantity of dietary protein intake, but not pattern of intake, affects net protein balance primarily through differences in protein synthesis in older adults. Am J Physiol Endocrinol Metab, 2015; 308(1): E21-8.
4. Farsijani S, Morais JA, Payette H, Gaudreau P, Shatenstein B, Gray-Donald K, Chevalier S. Relation between mealtime distribution of protein intake and lean mass loss in free-living older adults of the NuAge study. Am J Clin Nutr, 2016; 104(3): 694-703.
5. Farsijani S, Payette H, Morais JA, Shatenstein B, Gaudreau, Chevalier S. Even mealtime distribution of protein intake is associated with greater muscle strength, but not with 3-y physical function decline, in free-living older adults: the Quebec longitudinal study on Nutrition as a Determinant of Successful Aging (NuAge study). Am J Clin Nutr, 2017; 106(1): 113-24.
6. Loenneke JP, Loprinzi PD, Murphy CH, Phillips SM. Per meal dose and frequency of protein consumption is associated with lean mass and muscle performance. Clin Nutr, 2016; 35(6): 1506-11.
7. Cruz-Jentoft AJ, Bahat G, Bauer J, Boirie Y, Bruyère O, Cederholm T, Cooper C, Landi F, Rolland Y, Sayer AA, Schneider SM, Sieber CC, Topinkova E, Vandewoude M, Visser M, Zamboni M; Writing Group for the European Working Group on Sarcopenia in Older People 2 (EWGSOP2), and the Extended Group for EWGSOP2. Sarcopenia: revised European consensus on definition and diagnosis. Age Ageing, 2019; 48(1): 16-31.
8. Wall BT, Gorissen SH, Pennings B, Koopman R, Groen BL, Verdiik LB, van Loon LJC. Aging is accompanied by a blunted muscle protein synthetic response to protein ingestion. PloS One, 2015; 10(11): e014903-e014903.
9. Murphy CH, Oikawa SY, Phillips SM. Dietary protein to maintain muscle mass in aging: a case for per-meal protein recommendations. J Frailty & Aging, 2016; 5(1): 49-58.
10. Mamerow MM, Mettler JA, English KL, Casperson SL, Arentson-Lantz E, Sheffield-Moore M, Layman DK, Paddon-Jones D. Dietary protein distribution positively influences 24-h muscle protein synthesis in healthy adults. J Nutr, 2014; 144(6): 876-80.
11. Chanet A, Verlaan S, Salles J, Girauder C, Patrac V, Pidou V, Pouyet C, Hafnaoui N, Blot A, Cano N, Farigon N, Bongers A, Jourdan M, Luiking Y, Walrand S, Boirie Y. Supplementing breakfast with a vitamin D and leucine-rich whey protein medical nutrition drink enhances postprandial muscle protein synthesis and muscle mass in healthy older men. J Nutr, 2017; 147(12): 2262-71.
12. Borsheim E, Bui QT, Tissier S, Kobayashi H, Ferrando AA, Wolfe RR. Effect of amino acid supplementation on muscle mass, strength and physical function in elderly. Clin Nutr, 2008; 27(2): 189-195.
13. Dillon EL, Sheffield-Moore M, Paddon-Jones D, Gilkison C, Sanford AP, Casperson SL, Jiang J, Chinkes DL, Urban RT. Amino acid supplementation increases lean body mass, basal muscle protein synthesis, and insulin-like growth factor-1 expression in older women. J Clin Endocrinol Metab, 2009; 94: 1630-1637.
14. Norton C, Toomey C, McCormack WG, Francis P, Saunders J, Kerin E, Jakeman P. Protein supplementation at breakfast and lunch for 24 weeks beyond habitual intakes increases whole-body lean tissue mass in healthy older adults. J Nutr, 2016; 146(1): 65-9.
15. Olsen JM, Nesbitt BJ. Health coaching to improve healthy lifestyle behaviors: an integrative review. Am J Hlth Promotion, 2010; 25(1): e1-e12.
16. Schneider KL, Coons MJ, McFadden HG, Pellegrini CA, DeMott A, Siddique J, Hedeker D, Aylward L, Spring B. Mechanisms of change in diet and activity in the Make Better Choices 1 trial. Health Psychology 2016; Apr 7. doi.org/10.1037/hea0000333.
17. Hill B, Richardson B, Skouteris H. Do we know how to design effective health coaching interventions: A systematic review of the state of the literature. Am J Hlth Promotion, 2015; 29(5) e1: 58–e168.
18. Vincent AE, Sanchez Birkhead AC. Evaluation of the effectiveness of nurse coaching in improving health outcomes in chronic conditions. Holistic Nursing Practice, 2013; 27(3), 148–161.
19. Borson S, Scanlan J, Brush M, Vitaliano P, Dokmak A. The mini-cog: a cognitive ‘vital signs’ measure for dementia screening in multi-lingual elderly. Int J Geriatr Psychiatry, 2000; 15: 1021-1027.
20. Kaiser MJ, Bauer JM, Ramsch C, et al. Validation of the Mini Nutritional Assessment Short-Form (MNA®-SF): A practical tool for identification of nutritional status. J Nutr Health Aging, 2009; 13(9): 782-788.
21. Vellas B, Villars H, Abellan G, et al. Overview of the MNA® – Its History and Challenges. J Nutr Health Aging, 2006;10(6):456-465.
22. Stumbo P. Considerations for selecting a dietary assessment system. J Food Compost Anal, 2008; 21(1): S13-S19.
23. ESHA Research. ESHA Food and nutrition databases. Available at: https://esha.com/nutrition-database/.
24. Food and Nutrition Board. Dietary Reference Intakes for Energy, Carbohydrate, Fiber, Fat, Protein and Amino Acids. Washington, DC: National Academy Press. 2002.
25. Roberts HC, Denison HJ, Martin HJ, Patel HP, Syddall H, Cooper C, Sayer AA. A review of the measurement of grip strength in clinical and epidemiological studies: towards a standardised approach. Age and Ageing, 2011; 40: 423–429.
26. Bohannon RW. Reference values for the Timed Up and Go Test: A descriptive meta-analysis. J Geriatric Physical Therapy, 2006; 29(2): 64.
27. Guralnik JM, Simonsick EM, Ferrucci L, Glynn RJ, Berkman LF, Blazer DG, Scherr PA, Wallace RB. A short physical performance battery assessing lower extremity function: association with self-reported disability and prediction of morality and nursing home admission. J Gerontol, 1994; 49:M85-M94.
28. Dossey BM, Schaub BG, Luck S. International Nurse Coach Association (INCA). Nurse coaching: Integrative approaches for health and wellbeing. North Miami, Florida: International Nurse Coach Association, 2015.
29. Hess DR, Dossey BM, Southard ME, Luck S, Schaub BG, Bark, L. The art and science of nurse coaching: The provider’s guide to coaching scope and competencies. Silver Spring, MD: American Nurses Association, 2013.
30. Lanza E, Schatzkin A, Daston C, Corle D, Freedman L, Ballard-Barbash R, Caan B, Lance P, Marshall J, Iber F, Shike M, Weissfeld J, Slattery M, Paskett E, Mateski D, Albert P, PPT Study Group. Implementation of a 4-y, high-fiber, high-fruit- and-vegetable, low-fat dietary intervention: results of dietary changes in the Polyp Prevention Trial. Am J Clin Nutr, 2001; 74: 387-401.
31. Pennings B, Groen B, de Lange A, Gijsen AP, Zorenc AH, Senden JMG, van Loon LJC. Amino acid absorption and subsequent muscle protein accretion following graded intakes of whey protein elderly men. Am J Physiol Endocrinol Metab, 2012; 302: E992-999.

DOES TAILORED NUTRITIONAL GUIDANCE ENCOURAGE OLDER CAREGIVERS TO INCREASE THEIR PROTEIN INTAKE? THE CARENUTRITION TRIAL (RCT)


S. Kunvik1,2, R. Valve2, M. Salonoja1, M.H. Suominen3


1. The Social Services and Healthcare Centre of Pori, Finland; 2. Department of Food and Nutrition, University of Helsinki, Finland; 3. Unit of Primary Health Care, Helsinki University Central Hospital, Finland.

Corresponding Author: S. Kunvik, The Social Services and Healthcare Centre of Pori, Finland, susanna.kunvik@gmail.com

J Aging Res Clin Practice 2018;7:136-142
Published online October 15, 2018, http://dx.doi.org/10.14283/jarcp.2018.23


Abstract

Background: Older caregivers, males especially, are vulnerable to nutritional problems. Low intake of protein is common and can affect their nutrition and health. Objectives: The aim in this RCT was to investigate the effect of tailored nutritional guidance on protein intake among caregivers aged ≥65 years with protein intake under recommendations (≤1.2 g/kgBW/d). Subgroup analysis were made with male caregivers. Design: Data from the CareNutrition randomized controlled trial (RCT). Setting: Community-dwelling caregivers from the Western part of Finland. Participants: Total of 55 caregivers (n=28 intervention group (IG), n=27 control group (CG)) with protein intake of under 1.2 g/kgBW/d at baseline. 45.5% were male (n=12 male intervention group (MIG), n=13 male control group (MCG)). Intervention: During the six-month intervention tailored nutritional guidance was given to the intervention group during home visit (once) and in group meetings (2-4 times), complemented with written material. Written material was offered to control group. Measurements: Protein intake was assessed with three-day food diary at baseline and final measurements. Main outcome measure was change in protein intake (g/kg bodyweight (BW)/d), analysed among participants with protein intake under 1.2 g/kgBW/d at baseline. Participant characteristics were evaluated with validated methods. Results: Mean protein intake was 0.86 g/kgBW/d in IG and 0.85 g/kgBW/d in CG and among males, 0.89 g/kgBW/d in MIG and 0.79 g/kgBW/d in MCG. There was no significant difference in the change in protein intake between IG and CG. Protein intake increased among MIG by 0.11 g/kgBW/d and decreased in MCG group by -0.07 g/kgBW/d, p=0.007. There was also a significant increase in protein intake within the IG (+0.10 g/kgBW/d, p=0.038). Conclusions: Tailored nutritional guidance resulted in improved protein intake among older male caregivers. Group-based nutritional guidance may boost nutrition among older caregivers, especially males.

Key words: Caregivers, elderly, protein intake, nutritional guidance.


Introduction

Older caregivers are at an increased risk for nutritional problems, such as decreased nutritional status and poor nutrient intake (1-3). Heavy burden, depression, health problems and changes in appetite and food preferences may result in malnutrition (4-8). A low intake of protein is common and can affect caregivers` nutrition and health (1, 2).
Protein is a key nutrient in maintaining muscle health in older people (9). Progressive loss of muscle mass can lead to muscle weakness and physical limitations (10). Given the particularly important role of physical performance in caregiving, carers need sufficient protein in their diets. The consumption of protein-rich foods may decrease with advancing age and reduced food intake (11). Hence, there is a need to find ways of encouraging older people to increase their protein intake in their daily diets (12).
Even though caregivers are prone to nutritional problems, only few interventions have targeted this group of individuals (13), and nutrition education has only occasionally been a component of caregiver education and support programmes (14). Nutritional guidance could be effective in improving well-being and health (14), as well as nutrient intake (15). Male caregivers have been identified as a special group needing guidance. Weak cooking skills and lack of nutritional knowledge have been associated with a poor dietary quality among older males (16, 17). Being male is also known to be associated with poor nutrient intake and increased concern about nutrition among caregivers (18, 19).
The purpose of this article was to assess the effectiveness of tailored nutritional guidance on nutrient intake, especially of proteins, among caregivers aged ≥65 years with protein intake under recommendations (≤1.2 g/kgBW/d). Special attention was given to male caregivers based on subgroup analysis.


Methods

In this article we used the data of CareNutrition randomized controlled intervention trial, which explores the effectiveness of tailored nutritional counselling on protein intake among older caregivers (≥65) with normal cognition. The six-month intervention included tailored nutritional guidance during home visits and in group meetings, complemented with written material. The main outcome measure was the change in protein intake (g/kgBW)/d). Our focus in this article is on participants with a protein intake of under 1.2 g/kgBW/d (nutrition recommendation in Finland and intervention target) at baseline according to three-day food diaries. Special concerns arose among male caregivers based on subgroup analysis.
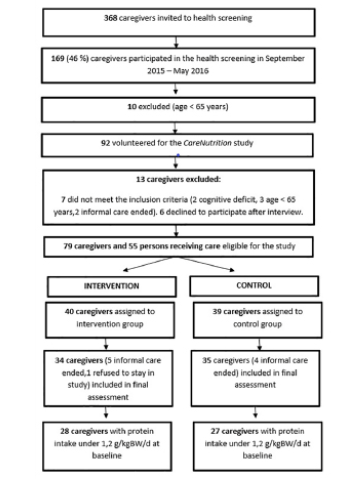
The participants were recruited following the health screening of caregivers. The recruitment procedure and inclusion criteria in CareNutrition trial are described in Figure 1, and in a previous article (2). The inclusion criteria were: age of ≥65, officially confirmed caregiver status, living at home, and normal cognition (MMSE points ≥25 geriatric assessment). The study was approved by the Ethics Committee of the Hospital District of Southwest Finland. Informed consent was obtained from each participant. The trial was described and registered at Australian New Zealand Clinical Trials Registry, Trial Id: ACTRN12615001254583.

Figure 1 Study flow chart

Figure 1
Study flow chart

Measurements

Baseline measurements were taken during two different appointments: the nurse’s health screening and the nutritionist’s home visit. The following measures were used: the MMSE (20) for cognition; the Katz index (21) for activities of daily living (ADL); the Lawton-Brody questionnaire (22) for instrumental activities of daily living (IADL); the 15D instrument (23) for health-related quality of life (HRQol); the Geriatric Depression Scale (GDS-15) (24) for depression; and an open question for information on medication. An experienced geriatrician reviewed the health-screening papers and recommended examinations if needed. Following the appointment with the nurse, a nutritionist made a home visit to screen nutritional status in line with the MNA (25). Nutrient intake was measured via three-day food diaries at baseline and at final measurements. The Finnish National Food Composition Database was used to analyse food intake. Check calls were made to confirm the amounts and types of food being consumed and to assess possible underreporting. Ideal bodyweight was used to calculate protein intake g/kgBW/d: if body mass index (BMI) was 20 – 30 kg/m2 we used the actual BMI, if under 20 kg/m2 we adjusted it to 20, and if above 30 kg/m2 we adjusted it to 30. Post-intervention feedback was gathered from intervention group by means of a structured questionnaire by mail.

Randomization

After baseline measurements and inclusion, the caregivers were randomly allocated one by one to the intervention (IG) or the control group (CG) according to a computer-generated, blocked randomization list. The person who carried out the randomization was unrelated to the investigation and unfamiliar with the procedure. From this sample, subgroup analysis was made with male intervention group (MIG) and male control group (MCG).

Intervention

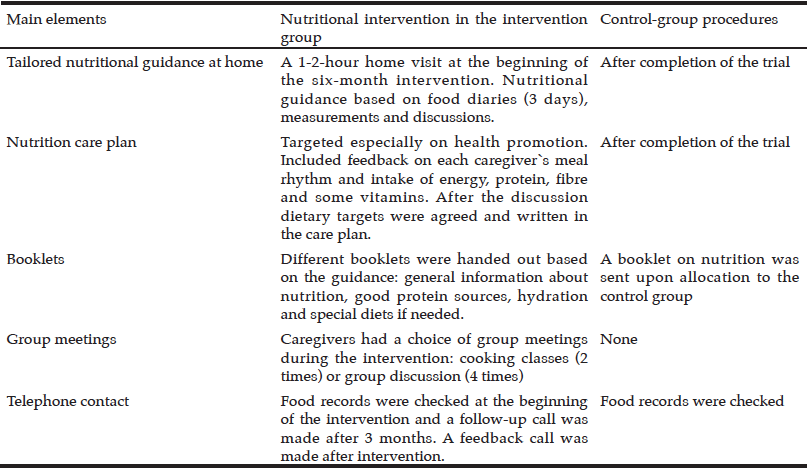
The intervention continued for six months. During this period members of the intervention group were given tailored nutritional guidance in their homes on one occasion (1 – 2 hours), and they had the opportunity to attend between two and four group meetings (Table 1). The key person in the intervention, who gave tailored nutritional guidance at the caregiver’s home and arranged the group meetings, was a trained nutritionist.
The nutritionist visited the caregivers’ homes at the beginning of the intervention. Nutritional guidance was based on the participant’s nutritional status, nutrient intake and background information, and on discussion with the nutritionist. An ideal level of protein intake was then calculated for each participant, who was given a written nutritional care plan and other material.
The nutritional care plan and guidance highlighted the positive factors in the participants’ diets, such as adequate energy intake and the use of good protein sources (e.g. quality, quantity, distribution during the day). The nutritionist and the caregiver discussed appropriate nutritional aims, which were included in the care plan.  The main aims usually related to finding easy and practical ways of increasing protein intake. The participants were given booklets about healthy nutrition.
Each caregiver had the opportunity to attend between group discussions (held 4 times) and cooking courses (held 2 times) during the six-month period. The aim of the discussions was to provide peer support and to reinforce the nutritional message. The nutritionist guided the conversations as the caregivers discussed their situations at home, with a view to focusing on cooking and nutrition. Each discussion lasted for 1.5 – 2 hours. The cooking sessions (2.5 hours) focused on protein-rich and traditional foods.  Each session included a short 15-minute discussion about healthy nutrition. Dishes were prepared and enjoyed together.
Members of the control group received normal community care if necessary and were given a booklet about healthy nutrition. Nutritional guidance in the form of a home visit and a nutrition care plan was offered after the final measurements.

Table 1 Overview of the tailored nutritional intervention and the procedures followed in the control group

Table 1
Overview of the tailored nutritional intervention and the procedures followed in the control group

Statistical analyses

CareNutrition trial sample size was calculated based on the participants` expected change in protein intake. With a standard deviation (SD) of 0.3 (1) and type-1 error of 5% and at a power of 80% per cent and an expected change in protein intake from 1 g/kgBW/d (1) to 1.2 g/kgBW/d in the intervention group, and with no change in the control group, each group would require 51 persons (accounting for drop-out) to show statistical significance. From this sample we analysed participants with protein intake under 1.2 g/kgBW/d at baseline in this article. Subgroup analyses were made with male caregivers.
The results are presented as means with SDs or as percentages, with 95% confidence intervals for the major outcomes. Statistical differences between the groups (IG vs. CG and MIG vs. MCG) were determined by t-tests, Mann Whitney U-test, Chi Square test or Fisher´s exact test. The main outcome measures were subjected to an analysis of covariance (ANCOVA): age, gender, BMI and value at baseline were added to model as covariates. In the case of violation of the assumptions (e.g. non-normality), a bootstrap-type test was used. SPSS version 22.0 (SPSS, Inc., Chicago, IL) and STATA 14.1 were used in statistical analyses.


Results

Baseline characteristics

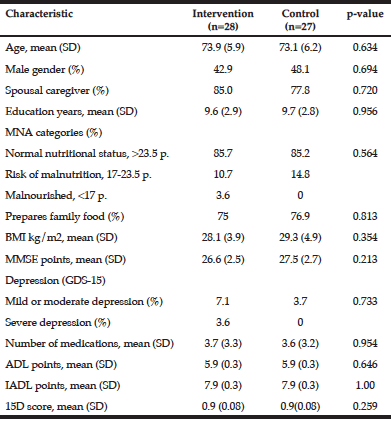
A total of 69 caregivers completed the CareNutrition trial (Figure 1) of whom 55 caregivers (n=28 IG, n=27 CG) had protein intake of under 1.2 g/kgBW/d at baseline (sample in this article). Table 2 gives the baseline characteristics of the IG and CG. The mean age of the participants was 73.5 (SD 6.0) years, and most (81.8%) were spousal caregivers. 45.5% were male (n=12 MIG, n=13 MCG) with a mean age of 74.4 years (SD 6.4).

Table 2 Baseline characteristics of the caregivers in the IG and CG

Table 2
Baseline characteristics of the caregivers in the IG and CG

Most of the caregivers (85.5%) had a good nutritional status (MNA points >23.5), 12.7% were at risk of malnutrition (MNA points 17–23.5) and one person (1.8%) suffered from malnutrition (MNA points <17).   Of all the caregivers, 75.7% prepared their family meals themselves, but only half (50%) of the males did so (difference between females, p=0.001). Levels of cognition were good (mean MMSE score 27.1, SD 2.6), as was physical functioning according to the ADL and IADL scores. The male caregivers had lower IADL scores than female, indicating weaker instrumental activities of daily living (7.8 (0.4) points vs. 8.0 (SD 0.0) points, p=0.003). Most participants were of normal weight (mean BMI 28.7 kg/m2, SD 4.4), the mean number of medications was 3.6 (SD 3.2) and HRQoL was good (15D score 0.9, SD 0.08). According to the GDS-15, 5.5% suffered from mild or moderate depression and one person from severe depression. There were no differences between the groups at baseline (IG vs. CG and MIG vs. MCG).

Protein and energy intake at baseline

Mean protein intake was 0.86 (SD 0.17) g/kgBW/d in IG and 0.85 (SD 0.17) g/kgBW/d in CG, p=0.73. Among males, protein intake was 0.89 (SD 0.18) g/kgBW/d in MIG and 0.79 (SD 0.16) g/kgBW/d in MCG, p=0.18. There were no statistical differences between groups.
The mean energy intake among IG was 1433 (SD 295) kcal/d and among CG 1642 (SD 340) kcal/d, p=0.18 (Table 3). Among males, energy intake at baseline in the MIG was 1558 (SD 256) kcal/d and among MCG 1800 (SD 296) kcal/d. MCG had greater energy intake (p=0.004).

Table 3 Mean levels of energy and protein intake and changes from baseline to six months in the IG and CG

Table 3
Mean levels of energy and protein intake and changes from baseline to six months in the IG and CG

*p-value for statistical test between IG and CG; adjusted for age, gender, BMI and value at baseline

Changes in protein and energy intake after six months

The mean change in protein intake from baseline to six months was +0.10 (SD 0.2) g/kgBW/d in the IG and +0.04 (SD 0.2) g/kgBW/d in the CG. There were no significant differences between the groups (p=0.26), but there was a significant increase within IG from baseline to the final measurements; from 0.86 (SD 0.17) g/kgBW/d to 0.96 (SD 0.25) g/kgBW/d, p=0.038.
There was a significant difference in the change in protein intake between the two groups of male caregivers: it increased in the MIG 0.11 (SD 0.22, CI -0.01 – 0.22) g/kgBW/d and decreased in the MCG -0,07 (SD 0.19, CI -0.19 – 0.04) g/kgBW/d (p=0.007). Total intake in the MIG was thus 1.0 g/kgBW/d at the final measurement, compared with 0.72 g/kgBW/d in the MCG.
The mean change in energy intake from baseline to six months was +102 kcal/d (SD 254) in the IG and +37 (SD 430) kcal/d in the CG, with no statistical difference between groups (p=0.49), (Table 3). Within IG there was a statistical increase in energy intake (p=0.043). Among males, there was a significant difference in the change in energy intake: an increase of 97 (SD 254) kcal/d in the MIG and a decrease of -192 (SD 426) kcal/d in the MCG, (p = 0.05).
Related to energy intake, the BMI in the CG decreased from 29.3 kg/m2 to 28.8 kg/m2 (- 0.5 (SD 1.0) kg/m2, p=0.014). There were no changes in other groups.

Feedback from the intervention

All intervention group caregivers received nutritional guidance at home once during the intervention. According to feedback 70.4% of caregivers in the IG though the nutritionist`s home visit was useful (males 83.3%) as well as nutritional guidance (74.7%, males 83.3%). A total of 75% of the caregivers went to the group meetings and they were considered useful (60%, males 66.7%). We found no statistical differences between males and females in the feedback.


Discussion

We found in this study that tailored nutritional guidance seems to encourage increased protein intake in older (≥65) caregivers, although there were no statistically significant differences between the intervention and the control group. However, the intervention was effective among male caregivers who received tailored nutritional guidance in that their intake of protein and energy increased during the six-month intervention.
We selected change in protein intake as the main outcome measure based on previous studies indicating a protein intake among older caregivers of less than the recommended level (1). The protein intake at baseline among the caregivers we studied was only 0.85 – 0.86 g/kg IBW/d, which is lower than the 1.2–1.4 g/kg/d recommended in Finland (26). The amount of dietary protein tends to decline progressively with advancing age due to reduced energy needs and intake, the loss of appetite and difficulties in acquiring and preparing food, although the caregivers in this study were in quite good physical shape (ADL, IADL). Our intervention target was to increase the protein intake to ≥1.2 g/kg BW/d on the grounds that it may help older caregivers to retain the muscle mass and good physical functioning required for taking care of another person (12,27-29,36,37). We found statistically significantly increased protein intake in the IG, from 0.86 g/kgBW/d to 0.96 g/kgBW/d, after the six-month nutritional intervention, but the difference between IG and CG was not significant.
Nutritional intervention was especially effective among male caregivers, whose protein intake increased in MIG from 0.89 g/kgWB/d to 1.0 g/kgBW/d and decreased in MCG from 0.79 g/kgBW/d to 0.72 g/kg/BW/d. There are several factors that could explain why male benefitted more from the nutritional guidance. Only half of these male caregivers prepared their family meals, and hence may need more guidance. Taking on a caregiver`s role changes the situation at home if the person concerned is not familiar with household activities. Cooking and shopping have traditionally been women`s work in this age group (30), hence older males may have weak cooking skills and inadequate nutritional knowledge (17,30): both factors have been associated with a poor-quality diet (16,17). Male gender is also known to be associated with poor nutrient intake and increased concerns about nutrition in caregivers (18,19). According to the feedback in our study, male caregivers were satisfied with the nutritional intervention. It has been suggested that community-based nutrition and cooking guidance are beneficial educational activities among older male (31). Our results support findings implying that older male caregivers need special support to cope with household activities, and that combining nutritional guidance with practical learning may be an effective way of doing this.
We did not reach the intervention target of 1.2 g/kg BW/d in protein intake. One reason for this may be that the protein intake of the caregivers at baseline was lower than expected. Also, we were not able to recruit enough participants in each group, which weakens the statistical power of the sample: with sample-size calculations of 102 participants, only 69 caregivers completed CareNutrition trial, of whom 55 had protein intake under 1.2 g/kgBW/d at baseline. Therefore, the sample in this article is quite small. In addition, protein intake also increased slightly in CG, even though not statistically significantly. This may have been because at the beginning of the trial CG also received written nutritional material, which highlighted the importance of proper protein intake. Control-group contamination could also explain the increase in protein intake, in that the trial was conducted in a small city and the participants may have known each other from the caregivers’ peer-support groups and events. Adequate protein intake was highlighted in the guidance and this message may have spread. Moreover, the Hawthorne effect, meaning that individuals modify some aspects of their behaviour in response to their awareness of being observed, is typical in intervention studies (32). Nevertheless, there is a notable benefit of an increase in protein intake among the caregivers in this study: a protein intake of 1.0 g/kg BW/d has several positive effects, including protection against weight loss and the maintenance of physical functioning (12,33,38).
The mean increase in protein intake in IG and MIG was 0.1 g/kgBW/d, which is in line with results reported earlier in similar interventions conducted among people with Alzheimer`s disease (13). A systematic review and meta-analysis of individualized dietary counselling for nutritionally at-risk older patients reported a mean increase in total protein intake of 10.13 g/d (34). The mean increase of 0.1 g/kgBW/d in protein intake in our study means about 7.0 – 7.7g total increase among persons weighing 70 kg, which corresponds to two decilitres of milk or yoghurt, one egg or four slices of meat for example. Our results indicate that the total increase in protein intake following nutritional guidance could be compared to one snack. Effective way of increasing protein intake among older persons is to offer familiar protein-rich foods. Interventions targeted at older people should be achievable and acceptable in the long term and should be easily incorporated into their dietary pattern. It is for this reason that food-based strategies rather than supplemental drinks could be recommended as an initial approach to optimising protein intake (12). The caregivers in our study were advised on how to add familiar protein-rich foods to their daily diets. Nutritional aims were discussed with them, which increased their motivation to make dietary changes.
The six-month intervention also led to an increase in energy intake in the IG and the MIG of 102 and 97 kcal, respectively. In addition, the energy intake of those in MCG decreased by almost 200 kcal/d. We observed a decrease in BMI only in the CG, which also indicates sufficient energy intake in the intervention groups. Even though the increase in energy intake is small, it is significant in terms of protein bioavailability: if there is insufficient energy intake, protein is used as an energy source (12). It is also noteworthy that the caregivers in this study did not seem to increase their protein intake at the cost of sufficient energy intake, which could have happened if energy-dense foods had been replaced with protein-rich foods such as dairy products that tend not to contain a lot of energy.
The strength of our study is that it provides important information on protein intake and the effectiveness of tailored nutritional counselling targeted at older caregivers. A few similar studies (13) have been conducted, but to our knowledge this is the first RCT reporting the effects of nutritional guidance on protein intake among older caregivers. Our study was conducted as a randomized controlled trial, which is an efficient method for determining cause-effect relationships. Tailored nutritional guidance facilitated the giving of personal nutritional advice, which is important given the dietary heterogeneity. Nutrient intake was assessed by means of a three-day food diary, which is considered a good way of evaluating nutrition among older people (35).
Nevertheless, our study has some potential limitations. Because of the specificity of our recruitment and the fact that many caregivers did not have the energy or the interest to participate, the number of informants was small, and the study population was selective. This weakens the generalizability of the findings. Selection bias is also possible because the participants were in quite good physical shape and were keen to be involved. This may indicate that they were more health conscious than the average older population and could affect the efficacy of the intervention. Nutrient intake was assessed from three-day food diaries, which could have affected the results through over- or underreporting. Three days may not be long enough to show actual food intake over a longer period. However, we made check calls to confirm the amounts and types of food being consumed and participants had fairly stable food habits, as older people usually do.


Conclusion

Our results show that tailored nutritional guidance was effective in terms of enhancing protein and energy intake among older (≥65 y) male caregivers, and thus may be useful for all older caregivers. These findings highlight the importance of and need for preventive nutritional guidance. Further studies are required to obtain more information about nutrient intake among older caregivers, and there is a need for more targeted interventions, especially for male.


Funding: The CareNutrition study received funding from the National Institute for Health and Welfare (THL) in Finland. The funder had no role in the design and conduct of the study; in the collection, analysis, and interpretation of data; in the preparation of the manuscript; or in the review or approval of the manuscript.The authors are independent researchers and are not associated with the funders.

Conflict of interest: Mrs. Kunvik reports grant from Satakunta Hospital District, Finland, during the conduct of this article. Other authors declare that they have no conflicts of interest directly relevant to this report. However, Dr Suominen reports co-operating professionally with Nutricia Medical and Verman.

Ethical standard: This study was conducted according to the guidelines laid down in the declaration of Helsinki and all procedures were approved by the Ethics Committee of the Hospital District of Southwest Finlan. Informed consent was obtained from each participant.


References

1.    Puranen T, Jyvakorpi S, Pitkala K et al. Nutritional intervention of patients with Alzheimer’s disease living at home with their spouse: a randomized controlled trial: baseline findings and feasibility. J Aging Res Clin Practice. 2013;2:236-241.
2.    Kunvik S, Valve R, Salminen K et al. Baseline findings of CareNutrition intervention (RCT) among older caregivers – risk of malnutrition and insufficient protein intake. Journal of Aging Research & Clinical Practice. 2017;6.
3.    Torres MJ, Dorigny B, Kuhn M et al. Nutritional Status in Community-Dwelling Elderly in France in Urban and Rural Areas. 2014;9:e105137.
4.    Schulz R, Martire LM. Family caregiving of persons with dementia: prevalence, health effects, and support strategies. Am J Geriatr Psychiatry. 2004;12:240-249.
5.    Doran T, Drever F, Whitehead M. Health of young and elderly informal carers. BMJ. 2003;327:1388.
6.    Sörensen, S, Pinquart M, & Duberstein P. How effective are interventions with caregivers? An updated meta-analysis. The gerontologist. 2002;42(3):356-372.
7.    Aggarwal B, Liao M, Christian A, Mosca L. Influence of caregiving on lifestyle and psychosocial risk factors among family members of patients hospitalized with cardiovascular disease. J Gen Intern Med. 2009;24(1):93-8.
8.    Alzheimer’s Disease International. World Alzheimer Report. The global economic impact of dementia.2010. http://www.alz.co.uk/research/files/ WorldAlzheimerReport2010.pdf. (Accessed 6 January 2018).
9.    Baum JI, Kim IY, Wolfe RR. Protein Consumption and the Elderly: What Is the Optimal Level of Intake? Nutrients. 2016;8.6:359.
10.     Forbes SC, Little JP, Candow DG. Exercise and nutritional interventions for improving aging muscle health.Endocrine. 2012;42.1:29-38.
11.    Volpi E, Campbell W, Dwyer JT et al. Is the optimal level of protein intake for older adults greater than the recommended dietary allowance?. Journals of Gerontology Series A: Biomedical Sciences and Medical Sciences. 2012;68(6):677-681.
12.    Nowson C & O’Connell S. Protein requirements and recommendations for older people: a review. Nutrients. 2015;7.8:6874-6899.
13.    Suominen MH., Puranen TM, Jyväkorpi S et al. Nutritional guidance improves nutrient intake and quality of life,and may prevent falls in aged persons with Alzheimer disease living with a spouse (NuAD trial). The journal of nutrition, health & aging. 2015;19.9:901-907.
14.    Silver HJ, & Wellman NS. Nutrition education may reduce burden in family caregivers of older adults. Journal of nutrition education and behavior. 2002;34:S53-S58.
15.    Baldwin C, & Weekes CE. Dietary counselling with or without oral nutritional supplements in the management of malnourished patients: a systematic review and meta-analysis of randomised controlled trials. Journal of Human Nutrition and Dietetics. 2012;25.5:411-426.
16.    Baker AH, Wardle J. Sex differences in fruit and vegetable intake in older adults. Appetite. 2003;40.3:269-275.
17.    Hughes G, Bennett KM & Hetherington MM. “Old and alone: barriers to healthy eating in older men living on their own”. Appetite. 2004;43.3:269-276.
18.    Puranen TM, Pietila SE, Pitkala K et al. Caregivers’ male gender is associated with poor nutrient intake in AD families (NuAD-trial). J.Nutr.Health Aging. 2014;18.7:672-676.
19.    Fjellstrom C, Starkenberg A, Wesslen A et al. To be a good food provider: an exploratory study among spouses of persons with Alzheimer’s disease.American Journal of Alzheimer’s Disease and Other Dementias. 2010;25.6:521-526.
20.    Folstein MF, Folstein SE, McHugh PR.  “Mini-mental state”. A practical method for grading the cognitive state of patients for the clinician. J Psychiatr Res. 1975;12:189-198.
21.    Katz S, Ford AB, Moskowitz RW et al. Studies of Illness in the Aged. the Index of Adl: a Standardized Measure of Biological and Psychosocial Function. JAMA. 1963;185:914-919.
22.    Lawton MP, Brody EM. Assessment of older people: self-maintaining and instrumental activities of daily living. Gerontologist. 1969;9:179-186.
23.    Sintonen H. The 15D instrument of health-related quality of life: properties and applications. Ann Med 2001;33:328-336.
24.    Yesavage JA, Brink TL, Rose TL et a. Development and validation of a geriatric depression screening scale. J Psychiatr Res. 1983;17:37-49.
25.    Vellas B, Guigoz Y, Garry PJ et al. The Mini Nutritional Assessment (MNA) and its use in grading the nutritional state of elderly patients. Nutrition. 1999;15:116-122.
26.    Finnish Nutrition Recommendations.  National Nutrition Council. Health from food – The Finnish Dietary Guidelines.2014.
27.    Pedersen AN, Cederholm T. Health effects of protein intake in healthy elderly populations: a systematic literature review. Food Nutr Res. 2014;58.
28.    Lancha AH,Jr, Zanella R,Jr, Tanabe SG et al.Dietary protein supplementation in the elderly for limiting muscle mass loss. Amino Acids. 2017;49:33-47.
29.    Genaro Pde S, Pinheiro Mde M, Szejnfeld VL, Martini LA. Dietary protein intake in elderly women: association with muscle and bone mass. Nutr Clin Pract. 2015;30.2:283-289.
30.    Roos G, Prattala R & Koski K. Men, masculinity and food: interviews with Finnish carpenters and engineers. Appetite. 2001;37.1:47-56.
31.    Keller HH, Gibbs A, Wong S et al. Men can cook! Development, implementation, and evaluation of a senior men’s cooking group. J Nutr Elder. 2004;24.1:71-87.
32.    Koh ET & Owen WL. Introduction to nutrition and health research. Springer Science & Business Media. 2012.
33.    Gray-Donald K, Arnaud-McKenzie DS, Gaudreau et al. Protein Intake Protects against Weight Loss in Healthy Community-Dwelling Older Adults, 2. The Journal of nutrition. 2013;144.3:321-326.
34.    Munk T, Tolstrup U, Beck AM et al. Individualised dietary counselling for nutritionally at-risk older patients following discharge from acute hospital to home: a systematic review and meta-analysis. Journal of human nutrition and dietetics. 2016;29.2:196-208.
35.    Thompson, FE & Byers T. Dietary assessment resource manual. Journal of Nutrition.1994; 2245S-2317S.
36.    Wolfe RR. The role of dietary protein in optimizing muscle mass, function and health outcomes in older individuals. Br J Nutr. 2012;108::S88-93.
37.    Morley JE, Argiles JM, Evans WJ et al. Nutritional recommendations for the management of sarcopenia. J Am Med Dir Assoc. 2010;11:391-396.
38.    Bauer J, Biolo G, Cederholm T et al. Evidence-based recommendations for optimal dietary protein intake in older people: a position paper from the PROT-AGE Study Group. J Am Med Dir Assoc. 2013;14:542-559.

EFFECT OF INCREASED DAILY INTAKE OF PROTEIN, COMBINED WITH A PROGRAM OF RESISTANCE EXERCISES, ON THE MUSCLE MASS AND PHYSICAL FUNCTION OF COMMUNITY-DWELLING ELDERLY WOMEN


H. Mori1, Y. Tokuda2


1. Diabetes Therapeutics and Research Center, University of Tokushima, , Tokushima, Tokushima, Japan; 2. Faculty of Health Science Department, Hyogo University, Hiraoka, Kakogawa, Hyogo, Japan

Corresponding Author: Dr. Hiroyasu Mori, Diabetes Therapeutics and Research Center, University of Tokushima, 3-18-15 Kuramoto, Tokushima, Tokushima 770-8503, Japan, Phone number: +81 886337587, Fax Number: +81 886337589, Email: hiroyam31@gmail.com


J Aging Res Clin Practice 2016;inpress
Published online December 1, 2016, http://dx.doi.org/10.14283/jarcp.2016.124


Abstract

Abstract: Background: In elderly women, significant loss of muscle mass due to declining levels of estrogen secretion is a health concern. Increasing the recommended dietary allowance of protein intake has been included as a general health guideline to prevent age-related sarcopenia. Objectives: To investigate effects of light-to-moderate resistance training combined with increased protein intake on the muscle mass, strength, and physical function of community-dwelling elderly women. Design: The 12-week training program combined weight-bearing and resistance band exercises, performed 3 times per week. Setting: Hyogo Prefecture, in either City K or Town H. Practical Intervention: Women were randomly allocated to three groups: exercise with protein intake adjusted to the recommended daily allowance (RDA) of 1.0–1.1 g/kg body weight/day (MP+EX group); exercise with protein intake adjusted above the RDA level at 1.2–1.3 g/kg body weight/day (HP+EX group); and a control group receiving classroom-based session on nutrition management, with protein intake adjusted to the RDA level (MP group). Measurements: Body weight and physical composition were measured by multi-frequency bioelectrical impedance analysis. Results: Exercise prevented decreases in muscle mass and strength and in performance of physical function tasks (p<0.05). Increasing dietary intake of protein above RDA level increased muscle mass (p<0.01), walking speed (p<0.01) and knee extensor strength (p<0.05). Conclusion: Adjusting protein intake to 1.2–1.3 g/kg body weight/day, in combination with light-to-moderate resistance training, can improve body composition and physical function in elderly women. The result of this study could be effective in lowering the incidence of age-related sarcopenia.

Key words: Community-dwelling elderly, exercise, muscle mass, protein intake, sarcopenia.


Introduction

Aging is associated with a decrease in skeletal muscle mass and strength which leads to limitations in physical activities, increased risk for falls and overall lowering of the quality of life of elderly people (1–7). A specific health concern is the significant loss of muscle mass in elderly women due to declining levels of estrogen secretion (8). The resulting loss of strength is one of the primary factors of the higher incidence of falls in older women, compared to older men. Increasing the recommended dietary allowance of protein intake has been included as a general health guideline to prevent age-related sarcopenia (9-11).
The Japanese recommendations for dietary reference intakes (DRIs) indicate a daily protein intake of 1.0–1.1 g/kg body weight/day for people aged >65 years (12). These DRIs do not include protein intake levels necessary for elderly individuals performing resistance exercises for the purpose of increasing skeletal muscle mass and physical function, knowledge required to optimize outcomes of exercise (13).
According to the Long-Term Care Prevention Service, which aims to increase musculoskeletal system function in the elderly, few elderly individuals practice high-intensity resistance exercises using large-scale training equipment. Moderate-intensity resistance exercises performed using body weight and resistance bands provide an easy way for elderly people to exercise for the purposes of increasing skeletal muscle mass and physical function to prevent sarcopenia. Accordingly, the aim of our study was to evaluate the effectiveness of adjusting total protein intake to levels of 1.2–1.3 g/kg body weight/day, a level exceeding the DRIs, on skeletal muscle mass and physical function in elderly women performing moderate intensity resistance exercises that used their own body weight and resistance bands, thereby preventing sarcopenia.


Methods

Participants

Participants were 151 Japanese women, ≥65 years old, living in Hyogo Prefecture, in either City K or Town H.
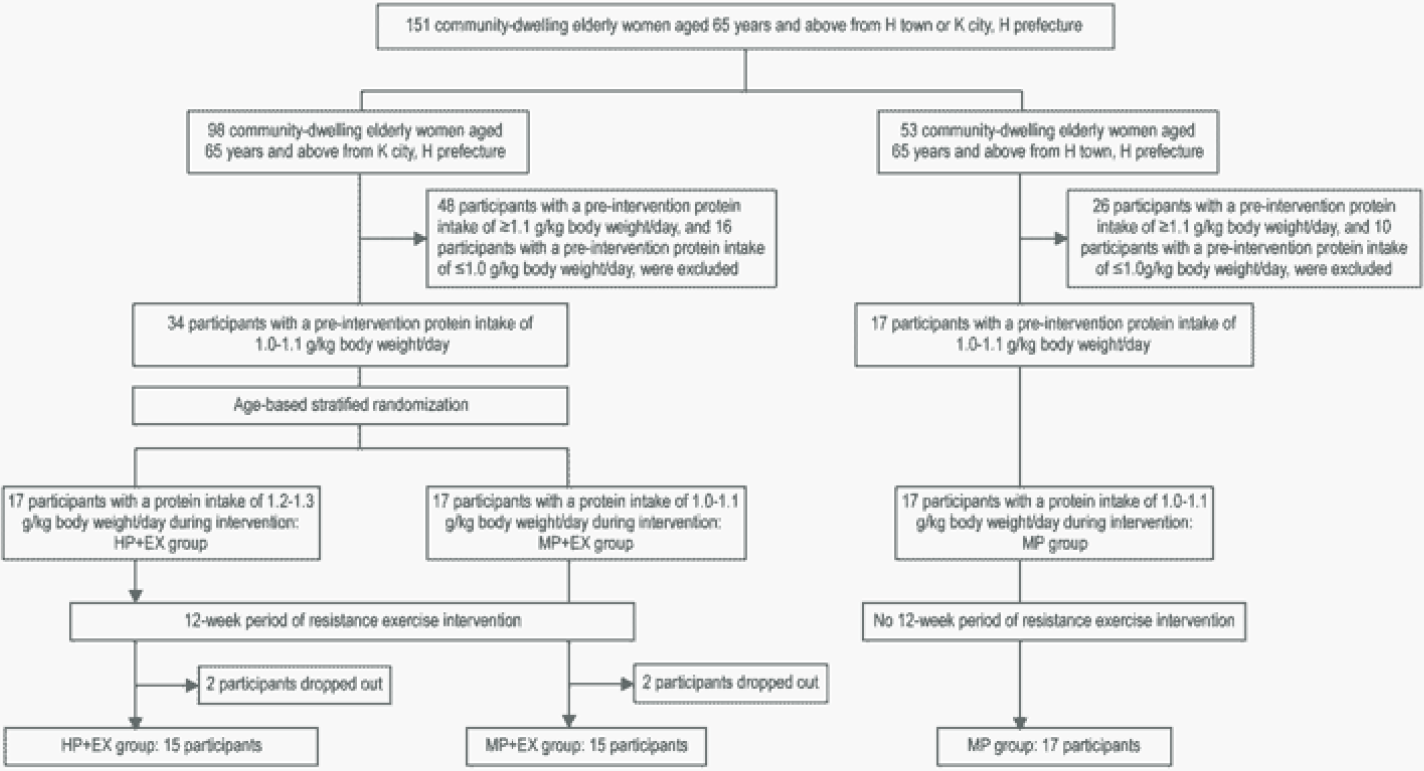
With the aim of using the DRI level of protein intake (1.0–1.1 g/kg/day12) as a baseline reference, a dietary survey was used to screen the daily protein intake of prospective participants. Based on this dietary survey, 26 participants were excluded as their total daily protein intake was <1.0 g/kg/day, and 74 participants for a daily protein intake >1.1 g/kg/day. Remaining participants were randomly allocated to three groups of 17 participants: an exercise intervention group with protein intake adjusted to the DRI of 1.0–1.1 g/kg/day (MP+EX group); an exercise intervention group with protein intake adjusted above the DRI at 1.2–1.3 g/kg/day (HP+EX group); and a control group who participated in classroom-based session on nutrition management, with their protein intake adjusted to the DRI of 1.0–1.1 g/kg/day (MP group). A stratified randomization strategy was used to achieve a comparable age distribution across groups. Over the study period, 4 participants withdrew due to family circumstances or poor physical conditioning, 2 participants from the HP+EX group and 2 participants from the MP+EX group. The information from these 4 participants was excluded from analysis, with the final study group formed of 15 participants in the HP+EX group, 15 participants in the MP+EX group, and 17 participants in the MP group (Figure 1).


Figure 1 Flow chart of study participation

Figure 1
Flow chart of study participation

Using participants with a pre-intervention protein intake of 1.0-1.1g/kg body weight/day, we randomly divided the participants into a high protein intake group of 1.2-1.3g/kg body weight/day (HP+EX group) and a moderate protein intake group of the usual 1.0-1.1g/kg body weight/day (MP+EX group) during an intervention of light-to-moderate intensity resistance exercise. We also established a moderate protein intake group of the usual 1.0-1.1 g/kg body weight.

Intervention design

A 12-week program was implemented. Groups HP+EX and MP+EX completed a standardized program of resistance exercise and a nutrition management, with MP group completed a classroom-based program on nutrition.

Measurement of body weight and physical composition

Body weight and physical composition were measured by multi-frequency bioelectrical impedance analysis (In Body 430, Bio Space, Seoul, Korea). The following parameters of body composition were obtained: body mass index (BMI), body fat percentage, lean body mass (LBM), and total limb muscle mass, which was calculated separately for the upper and lower limbs, and for the trunk.

Measurement of physical functions

The following measures of physical function were evaluated: grip strength, knee extension strength, 5-m maximum walking speed, and timed up-and-go (TUG). Grip and knee extension strength were measured by hand held dynamometry (T.K.K5401; Takei Instruments, Tokyo, Japan. μ-tus F-100; ANIMA., Tokyo, Japan). Measures were taken twice, and the maximum value recorded for analysis.

Nutritional survey

A nutritional survey was conducted to document: total energy intake (TEI), total and adjusted protein intake (g/kg/day), total fat intake, and total carbohydrate intake. The survey was complemented by food weighing methods (Excel Eiyou version 5.0; Kenpakusha, Tokyo, Japan). The nutrition questionnaire and weighing were completed for 5 consecutive days before the start of the program, and daily during the 12-week intervention.

Daily activity survey

Participants recorded their daily activity for three consecutive days before the start of the program, with the information used to calculate each participant’s regular physical activity level (PAL). Again, individual interviews were used to complete missing information. The estimated energy requirement (EER) to meet each individual’s PAL was calculated as follows: EER = basal metabolic rate × body weight (kg) × PAL (12).

Exercise intervention

The exercise intervention consisted of a series of body weight resisted and resistance band exercises, performed 3 times per week for 12 weeks. Twice per week, exercises were performed under supervision of an exercise specialist, with participants completing the third session at home.

Resistance exercises

Body weight resisted exercises consisted of the following: abdominal crunches, rising and sitting from a chair; leg extensions; standing heel kicks, and calf raises. Five exercises were also performed with elastic bands (REP BAND; Magister Corporation, Chattanooga, TN): arm curls, pull-ups, leg extensions, squats, and sit-ups. Elastic bands of five difference resistance were used, with the level of resistance individually adjusted using 1 maximum repetition (1RM) testing for the upper and lower limbs prior to the intervention. The resistance load was modified in standardized fashion over the 12-week program as follows: for weeks 1-4, participants performed 2 sets of 10 repetitions each of the body weight resisted exercises and 2 sets of 20 repetitions of the resistance band exercises, at a resistance load of 50% 1RM; for weeks 5-8, participants performed 2 sets of 15 repetitions each of the body weight resisted exercises and 2 sets of 15 repetitions each of the resistance band exercises at 60% 1RM; and for weeks 9-12, participants performed 3 sets of 15 repetitions each of the body weight resisted exercises and 3 sets of 12 repetitions each of the resistance band exercises at 70% 1RM.

Nutritional intervention

Total protein intake in the HP+EX group was adjusted to a daily level of 1.2–1.3 g/kg/day. Participants’ were advised to increase their protein intake in their standard meals (breakfast, lunch, and dinner). The total protein intake for participants in the MP+EX and MP groups was adjusted to 1.0–1.1 g/kg/day.

Nutritional management

Nutritional management was provided by a nutritionist, based on the DRIs (14) and results of the nutrition survey conducted before the intervention. Nutritional management was provided according to the following schedule: once to all participants prior to the onset of the study; as part of the group nutrition guidance sessions in intervention weeks 1-2; and on an individual basis, twice per week, for intervention weeks 3-12. At these individual sessions, protein intake was verified to ensure compliance with group-specific levels. Daily activity surveys were also reviewed to ensure sufficient TEI for all participants.

Statistical analysis

Individual changes in EER and TEI, pre- and post-intervention, were evaluated using paired t-test analysis. Between-group differences in outcome variables, measured pre- and post-intervention, were evaluated using two-way analysis of variance (ANOVA). Changes in measured outcomes of muscle mass, physical function, and nutrient intake were evaluated between groups (HP+EX, MP+EX and MP) and time (pre- and post-intervention) using a repeated measures ANOVA with group as an independent factor and time as the repeated factor. For identified main effects and interactions, multiple comparisons were performed using the Tukey post hoc analysis, with specific change in pre- and post-intervention values compared using an unpaired one-way ANOVA. All statistical analyzes were performed using IBM SPSS statistical software (IBM, Tokyo, Japan), with the level of significance defined as a p value < 0.05.


Results

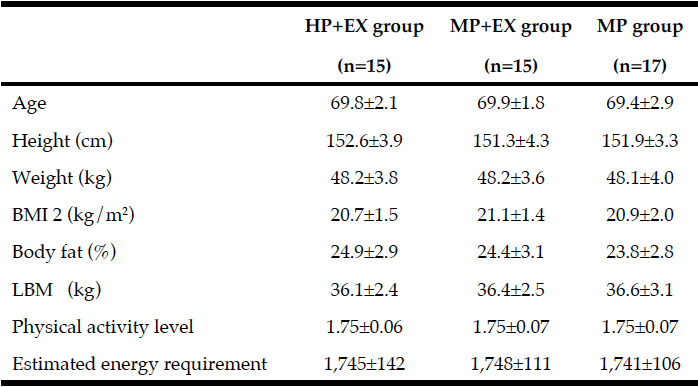
Baseline measures of body composition and physical function are listed in Table 1. Pre-intervention, measures were comparable between groups. Adherence to the schedule of resistance exercise of three sessions per week for 12 weeks was comparable for the two exercise groups, with a mean (SD) number of sessions completed of 34.3±1.2, out of a possible maximum of 36, for the HP+EX group (95.3%) and 34.0±1.0 for the MP+EX group (94.4%).


Table 1 Physical characteristics of subjects pre-intervention

Table 1
Physical characteristics of subjects pre-intervention

Mean value ± Standard deviation;  The results of a non-paired one-way ANOVA showed no differences in the characteristics of the 3 groups pre-intervention; HP+EX group: Protein intake of 1.2-1.3 g/kg body weight/day during the 12-week period of exercise intervention; MP+EX group: Protein intake of 1.0-1.1 g/kg body weight/day during the 12-week period of exercise intervention; MP group: Protein intake of 1.0-1.1 g/kg body weight/day for the 12-week period; BMI: Body mass index; LBM: Lean body mass


Changes in measures of muscle mass pre- and post-intervention are reported in Table 2. A significant main effect of exercise on limb muscle mass was identified (p<0.05) with the largest change identified for the HP+EX group (p<0.001 compared to both the MP+EX and MP groups). A significant group X limb interaction was identified (p<0.05), with a significantly higher increase in muscle mass for the HP+EX group, compared to the MP group, for the upper limbs (p<0.05), trunk (p<0.001) and lower limbs (p<0.001). Comparing HP+EX and MP+EX groups, the magnitude of change in muscle mass was higher for the HP+EX group only for the lower limbs (p<0.05).

Table 2 Comparison of limb muscle mass and physical functions pre-/post-intervention

Table 2
Comparison of limb muscle mass and physical functions pre-/post-intervention

Mean value ± Standard deviation; Two-way ANOVA by time (Pre- and Post-intervation period) × group (HP+EX, MP+EX, MP group)* p <0.05, ** p <0.01,*** p <0.001; One-way ANOVA and post-hoc by Tukey test, Significant difference with MP group: †p <0.05, ††p <0.01, †††p <0.001, Significant difference with MP+EX group: ‡p <0.05, ‡‡p <0.01


Effects of the intervention physical function are reported in Table 2. The ANOVA identified significant effects of exercise on knee extensor strength and 5-m maximum walking speed, as well as knee extensor strength x TUG interaction. Change in knee extensor strength was higher for the MP+EX group, compared to the MP group (p<0.01), with the highest magnitude of change obtained by the HP+EX group (p<0.001 compared to MP; p<0.05 compared to MP+EX group). Findings were similar for 5-m maximum walking speed, with greater improvement in walking speed in the MP+EX compared to MP groups (p<0.05), and largest increase for the HP+EX group (p<0.001 compared to MP; p<0.01 compared to MP+EX group). The improvement in TUG was greater for the HP+EX compared to the MP group (p<0.01).
Nutritional intake, TEI, EER, and levels of total protein intake, adjusted protein intake/kg body weight, fat, and carbohydrates are listed in Table 3. Significant changes in TEI and protein intake (TEI, p<0.05; protein, p<0.001), as well as an interaction between adjusted protein intake and body weight (p<0.001) were identified. The magnitude of change was higher for the HP+EX group compared to the MP group (TEI, p<0.05; protein intake/kg, p<0.001) and the MP+EX group (TEI, p<0.05; protein intake/kg, p<0.001).

Table 3 Comparison pre-intervention and during intervention

Table 3
Comparison pre-intervention and during intervention

Mean value ± Standard deviation, Two-way ANOVA by time (Pre- and post-intervation period) × group (HP+EX, MP+EX, MP group), * p <0.05, ** p <0.01, ***p <0.001; One-way ANOVA and post-hoc by Tukey test, significant difference with MP group: †p <0.05, †††p <0.001, Significant difference with MP+EX group:  ‡p <0.05, ‡‡‡p <0.001


Discussion

In this study, we evaluated the effectiveness of providing an adjusted protein intake of 1.2-1.3 g/kg/day during a 12-week program of light-to-moderate intensity weight-bearing and resistance band exercises on the skeletal muscle mass and physical function of elderly women. The adjusted protein intake improved selected parameters of body composition and physical function, namely lower limb muscle mass, knee extension strength, and 5-m maximum walking speed. The mean protein intake for the HP+EX group was 11.4 ± 1.8 g/day, and increased by approximately 0.22 ± 0.02 g/kg/day over the 12-week program. Fat and carbohydrate intake were comparable between groups and TEI was never below EER.
Our current results support our a priori hypothesis of the necessity of increasing protein intake to optimize outcomes of exercise on muscle mass and physical function in the elderly. In fact, total limb muscle mass increased by 0.9±0.3 kg when combining increased protein intake and exercise (HP+EX), compared to 0.2±0.4 kg for exercise alone (MP+EX). Our measured effect of exercise alone is comparable to results reported by Kim et al. (15) of a 0.29 kg increase in total limb mass for elderly Japanese women completing a 12-week program. Kim et al. (15) combined resistance exercises with amino acid supplements, reporting an increase of approximately 0.34 kg in total limb muscle mass. Using an adjusted protein intake, our program surpassed these levels with a mean increase in total limb mass of 0.9 kg, with the most significant increase noted for the lower limbs. This lower limb bias may be explained by performance of a higher number of lower limb exercises. An important difference in our study, compared to Kim et al. (15), is that we graduated the workload of our program over the 12-weeks.
An important outcome of our study was the identification of a 0.2±0.7 kg decrease in total limb muscle mass and 0.2±1.0 kg decrease in knee extension strength for participants in the MP group over the study period. This emphasizes the need to adjust protein intake, at least to the minimum DRI of 1.0–1.1 g/kg/day, in combination with a light-to-moderate program of resistance training, to maintain muscle mass, with further adjustment in protein intake yielding more significant results.
According to Chevalier et al. (16), a dietary protein intake of 0.8 g/kg/day is insufficient for increasing the skeletal muscle mass of elderly persons and intake should be increased to levels of at least 1.2 g/kg/day. Several physiological reasons contribute to the increased requirement of protein intake in the elderly. Drummond et al. (17) reported a delay and/or decrease of the signaling responses to amino acids in skeletal muscle cells with age. Volpi et al. (18) further demonstrated that a higher proportion of the amino acids absorbed in the gastrointestinal tract of elderly persons is metabolized in the small intestine and liver. Although specific physiological measurements related to protein metabolism were not included in our study, our outcomes provide evidence of insufficient muscle protein synthesis during resistance exercise with a moderate adjustment of protein intake to levels of 1.0–1.2 g/kg/day and that a higher adjustment to levels of 1.2–1.3 g/kg/day are required to enhance effectiveness of resistance training on muscle mass and strength.
Our light-to-moderate level of resistance was sufficient to maintain muscle mass and strength in the MP+EX group. Levinger et al. (19) reported a 1.1-kg increase in skeletal muscle mass of elderly participants performing a 10-week program of high-intensity resistance exercises. In their review of research evidence for resistance training in elderly individuals, Miyachi et al. (20) indicated that an exercise intensity of 80% 1RM or above is required to increase the skeletal muscle mass with a single intervention of exercise. It is important to note that the participants in our study group had a relatively low PAL of 1.75; as none of our participants engaged in regular resistance training, prescription of a high-intensity program was not possible. Future research is required to more clearly elucidate the effectiveness of supplemented protein intake and different levels of resistance training for enhancing gains in muscle mass and strength. However, we do emphasize that our program of light-to-moderate resistance was effective, with a practice rate of approximately 95%, and can be safely implemented as a home program for elderly individuals who are relatively deconditioned.
The benefits of combining a light-to-moderate resistance training program with nutritional supplementation in lowering the risk for sarcopenia in elderly individuals is supported by previous research. In their review comparing the transient response of muscles to high- and low-intensity resistance training regimes, Mallinson et al. (21) reported an increase in muscle protein synthesis (and increased muscle protein reserves) with high-intensity resistance exercise, performed at 90% 1RM, while low-intensity resistance exercises, performed at 30% 1RM, stimulated muscle protein synthesis. Therefore, light-to-moderate intensity weight-bearing and resistance band resistance exercise can have benefits for elderly women, who can easily perform these exercises.
In our study, we assumed that a training resistance of 50–70% 1RM would have little stimulus on protein synthesis in skeletal muscle. As a result, we did not include a control group of adjusted high protein intake alone, with no participation in the program of exercise. Therefore, we are unable to determine if the increase in muscle mass for the HP+EX group results from the increase in protein intake or from the combination of increased protein intake and exercise. Future research is required to clarify the pathway of muscle mass increase associated to a combination of supplemented protein intake and exercise. Another important limitation of our study is the inclusion only of women to control for known sex-specific differences in age-related muscle atrophy and sarcopenia (22, 23). Future research will need to verify effectiveness of protein supplementation in elderly men. Moreover, we estimated muscle mass from BIA measurements. There are currently no population norms of BIA measurements for elderly women, and research is needed to establish norms compared to DEXA (24). Finally, the present study is that the sample size was too small, and the conclusion was not well supported by this data. For example, SD of total limb muscle mass is 1.9 and the change by intervention was 0.9kg in HP+EX group. Required sample size to make this change as significant is 37, which is more than twice of the actual number of sample.
Our study provides evidence of the benefit of increasing protein intake as one component of a resistance training program to improve muscle mass and strength in elderly women.


Funding: This work was supported by JSPS KAKENHI Grant Number 25750353. The sponsors had no role in the design and conduct of the study; in the collection, analysis, and interpretation of data; in the preparation of the manuscript; or in the review or approval of the manuscript.

Acknowledgements: None.

Conflict of Interest: All of the authors declare that they have no conflicts of interest regarding this paper.

Ethical standards: Ethics Committee of Hyogo University (approved # 12003).


References

1.     Evans WJ. What is sarcopenia? J Gerontol A Biol Sci Med Sci 1989;50A:5–8.
2.     Janssen I, Baumgartner RN, Ross R. Skeletal muscle cutpoints associated with elevated physical disability risk in older men and women. Am J Epidemiol 2004;159:413 – 421.
3.     Roubenoff R, Hughes VA. Sarcopenia: current concepts. J Gerontol A Biol Sci Med Sci 2000;55:716–724.
4.     Robinson S, Cooper C, Aihie SA. Nutrition and sarcopenia: a review of the evidence and implications for preventive strategies. J Aging Res 2012;2012.(ID 510801). http://dx.doi.org/10.1155/2012/510801
5.     Christie J. Progressive resistance strength training for improving physical function in older adults. Int J Older People Nurs 2011;6:244 – 246.
6.     Peterson MD, Rhea MR, Sen A. Resistance exercise for muscular strength in older adults: a meta-analysis. Ageing Res Rev 2010;9:226–237.
7.     Taaffe DR. Sarcopenia: exercise as a treatment strategy. Aust Fam Physician 2006;35:130–134.
8.     Doherty TJ. Invited review: aging and sarcopenia. J Appl Physiol 2003;95:1717–1727.
9.     Beasley JM, Shikany JM, Thomson CA. The role of dietary protein intake in the prevention of sarcopenia of aging. Nutr Clin Pract 2013;28:684–690.
10.     Morley JE, Argiles JM, Evans WJ, et al. Society for Sarcopenia, Cachexia, and Wasting Disease. Nutritional recommendations for the management of sarcopenia. J Am Med Dir Assoc 2010;11:391–396.
11.     Volkert D, Sieber CC. Protein requirements in the elderly. Int J Vitam Nutr Res 2011;81:109–119.
12.     Nakade M, Imai E, Tsubota-Utsugi M. Systematic classification of evidence for dietary reference intakes for Japanese 2010 (DRIs-J 2010) in adults and future prospects of DRIs in Asian countries. Asia Pac J Clin Nutr 2013;22:474–489.
13.     Eckard T, Lopez J, Kaus A, Aden J. Home exercise program compliance of service members in the deployed environment: an observational cohort study. Mil Med 2015;180:186–191.
14.     Mori H, Niwa M. Effect of nutritional care and whey protein supplementation on the body composition and physical function in older adults after combined resistance and aerobic exercise. Jpn J Nutr Diet 2014;72:12–20. [in Japanese]
15.     Kim HK, Suzuki T, Saito K, et al. Effects of exercise and amino acid supplementation on body composition and physical function in community-dwelling elderly Japanese sarcopenic women: a randomized controlled trial. J Am Geriatr Soc 2012;60:16–23.
16.     Chevalier S, Gougeon R, Nayar K, Morais JA. Frailty amplifies the effects of aging on protein metabolism: role of protein intake. Am J Clin Nutr 2003;78:422–429.
17.     Drummond MJ, Dreyer HC, Pennings B, et al. Skeletal muscle protein anabolic response to resistance exercise and essential amino acids is delayed with aging. J Appl Physiol 2008;104:1452–1461.
18.     Volpi E, Mittendorfer B, Wolf SE, Wolfe RR. Oral amino acids stimulate muscle protein anabolism in the elderly despite higher first-pass splanchnic extraction. Am J Physiol 1999;277:513–520.
19. Levinger I, Goodman C, Hare DL, Jerums G, Seling S. The effect of resistance training on functional capacity and quality of life in individuals with high and low numbers of metabolic risk factors. Diabetes Care 2007;30:2205–2210.
20.     Miyachi M, Ando D, Oida Y, et al. Possible treatments for sarcopenia: systematic review on the effect of exercise intervention. Jpn J Geriatr 2011;48:51–54. [in Japanese]
21.     Mallinson JE, Murton AJ. Mechanisms responsible for disuse muscle atrophy: potential role of protein provision and exercise as countermeasures. Nutrition 2012;29:22–28.
22.     Sanada K, Miyachi M, Tanimoto M, et al. A cross-sectional study of sarcopenia in Japanese men and women: reference values and association with cardiovascular risk factors. Eur J Appl Physiol 2010;10:57–65.
23.     Basaria S, Coviello AD, Travison TG. Adverse events associated with testosterone administration. N Engl J Med 2010;8:109–122.
24.     Buckinx F, Reginster JY, Dardenne N, et al. Concordance between muscle mass assessed by bioelectrical impedance analysis and by dual energy X-ray absorptiometry: a cross-sectional study. BMC Musculoskelet Disord 2015;16:60.