jarlife journal
Sample text

AND option

OR option

PREVALENCE OF UNDER NUTRITION AND ASSOCIATED FACTORS AMONG PEOPLE OF OLD AGE IN DEBRE MARKOS TOWN, NORTHWEST ETHIOPIA, 2015


Z.K. Adhana1, G.H. Tessema2, G.A. Getie3


1. Missionaries of Charity – Ethiopia, Psychologist and program coordinator, Debremarkos, Ethiopia; 2. Department of Public Health, College of Health Sciences, Debre Markos University, Debre Markos, Ethiopia; 3. Department of Nursing, College of Health Sciences, Debre Markos University, Debre Markos, Ethiopia.

Corresponding Author: Zinabu Kebede Adhana, Missionaries of Charity – Ethiopia, Psychologist and program coordinator, Debremarkos, Ethiopia, alamata2007@yahoo.com
J Aging Res Clin Practice 2019;8:20-26
Published online January 24, 2019, http://dx.doi.org/10.14283/jarcp.2019.4


Abstract

Background: Malnutrition is defined as a disproportion of nutrients caused by either an excess intake of nutrients or a nutritional deficit. One of the most common nutritional problems in older people (aged 60 years and over) is under nutrition. Worldwide studies revealed that the prevalence of under nutrition in people of old age is high. Objective: To assess the prevalence of under nutrition and its associated factors among old people in Debre Markos town, Northwest Ethiopia, 2015. Methods and materials: A cross sectional study design was conducted among 423 study subjects of old age in Debre Markos town from August 4 to August 30, 2015. Primary data was collected using a pre tested Mini Nutritional Assessment Short-Form (MNA-SF) screening tool and structured questionnaires by trained data collectors. The data that was collected was entered and cleaned using EpiData version 3.1 statistical software then exported to the SPSS version 20 statistical package for further data analysis. Descriptive statistics of frequency, tables and graphs were used and summary measures were calculated to determine the prevalence of under nutrition. The data was also used to describe the distribution of the independent variables among study subjects. Bivariate and multivariate logistic regression models were utilized to calculate crude and adjusted odds ratios in order to identify factors associated with under nutrition of study participants at 0.05 level of significance. Result: The prevalence of under nutrition among study participants was found to be 22.7% (95%CI 18.7-26.7). A number of independent variables have a significant association with under nutrition, including gender (females (AOR 7.95 95% CI (2.86, 22.08)), age (Oldest Old and Middle Old, (AOR=3.45 95%CI (1.44, 8.26) and (AOR=5.25, 95%CI (2.48, 11.13) respectively), marital status (widowed elderly individuals (ARO 3.29 95 % CI (1.54, 7.06)), individuals with eating difficulty (AOR 10.73 95 % CI (4.49, 25.63), individuals with vision problems (AOR 5.67 95 % CI (2.80, 11.48) and meal frequency (ARO 6.71 95 % CI (3.31, 13.63). Conclusion and recommendation: Prevalence of under nutrition among study participants was 22.7%. Gender, age, marital status, eating difficulty, visual problems and meal frequency were found to be independent determinant factors of under nutrition among study subjects. The government, family members and other stakeholders should give more attention to older individuals especially older females.

Key words: Under nutrition, old age, prevalence, mini nutritional assessment


Introduction

Malnutrition is a general term that refers to both under-nutrition and over-nutrition. Under-nutrition is due to inadequate food intake, dietary imbalances, and deficiencies of specific nutrients (1). Undernourishment is common in older persons. Nutritional deficiencies in older persons have serious negative consequences which can increase morbidity and mortality, hospitalization, development of ulcer and infections (2). Involuntary weight loss can result in a reduction in the ability to care for oneself, loss of mobility and independence and a poorer quality of life (3).
The elderly population is growing worldwide. There were approximately 810 million persons aged 60 years and over in the world in 2012 and this number is projected to grow to more than 2 billion by 2050 (6). In 2014, the annual growth rate for the population aged 60 years and older will be almost triple the growth rate for the population as a whole (7) one out of every nine persons in the world is aged 60 years or over (6). In 2014, about two thirds of the world’s population aged 60 years and older lived in the less developed regions (7). By 2050, one out of every five persons is projected to be in that age group and one in 16 persons in Africa (6). In general, the number of older person is increasing rapidly and unexpectedly in all parts of the world. Although aging is evolving fast in the more developed regions, the less developed regions will over a much shorter period of time (6).
In Ethiopia, due to serious shortage of data, it is difficult to provide detailed analysis about the socio-economic conditions of older persons (4). Even though it is difficult to provide detailed analysis about the old age population of Ethiopia, the UN report shows that the population aged 60+is growing rapidly (6).
Older adults are at the greatest risk for becoming undernourished. Undernourishment may result in impairment, lowered resistance to infection; poor wound healing, and prolonged hospitalization with increased morbidity and mortality (8). Additionally, medical co-morbidities and a host of other factors, such as economic, geographic, and psychosocial concerns, can also affect diet behaviors and thus nutritional status (9).
Under nutrition among old age is a substantial problem globally. World-wide, the older population is increasing, and with it, the prevalence of under nutrition. The prevalence of under nutrition is undeniably high; worldwide the overall prevalence is 22.6% (15). The prevalence of under nutrition in older African men (9.5–36.1%) and women (13.1–27%) (16). In Ethiopia, the prevalence of under nutrition in old age people is remains high, as a study conducted in Gondar revealed that the prevalence of under nutrition among old age people was 21.9% (17).
More generally, the study of under nutrition in the 60+ age group in Ethiopia has been neglected. Most of the studies conducted on under nutrition in Ethiopia focus on mothers and children; producing more data related to the nutritional status of those within the old age group will fill the existing knowledge gap.

Objectives

* To determine the prevalence of under nutrition among old age people in Debre Markos town.
* To identify associated factors with under nutrition of old age people in Debre Markos town.


Method and material

Study design

A community based cross-sectional study design was conducted.

Study area and period

The study was conducted in Debre Markos Town. Debre Markos is the town of East Gojjam Administrative Zone; which is located in the Northwest of Addis Ababa at a distance of 300 Kms. With regard to the population of the town it is estimated to be 107684 of which 57791 are females and 49893 are males (34). Out of this total population the number of old age population is estimated at 3000 and from this estimated total number 1800 old age individuals (1276 females and 524 males) are officially registered (35). The data was collected from August 4, 2015 to August 30, 2015.

Source population

All old people who are living in Debre Markos town.

Study population

All old individuals who are officially registered in Debre Markos town.

Inclusion criteria

All old individuals greater than or equal to sixty years old, who are already registered in Social and Labor Office and were available during data collection period, were included in this study.

Exclusion criteria

Individuals who are unable to respond due to critical illness during data collection were excluded from this study.

Sample size determination

The sample size was calculated using single population proportion formula considering 50% prevalence of under nutrition, 0.05 level of type one error, 0.05 marginal error at 95% level of confidence and adding 10 % non-response rate. The final sample size was 423.

Sampling procedure

Primarily the total number of households was identified through reviewing records from the social and labor office. All individuals were then framed using their particular code number of the house and their name. From this list, sampled individuals were drawn through systematic random sampling technique from already registered individuals. The total number of registered individuals were (N=1800) and then calculated sampling fraction (Kth). A lottery method was used to get the first sampled individual from 1-4 sampling intervals. With a random start of two every fourth individual was included in to the study.

Variables of the study

Under nutrition of old age individuals is considered to be the dependent variable while socio-demographic variables (age, sex, marital status, ethnicity, family number, educational status, occupation, income), medical condition, smoking, feeding frequency (one times, two times and three times per day), food-cooking style (self, spouse, children, and/or maid) and feeding mode (unable to eat without assistance, self-fed with some difficulty, self-fed without any problem) are independent variables.

Operational definition

Old age people: those individuals aged ≥ 60 years old. Young old: individuals’ age group from 60 – 74 years old. Aged: individuals’ age group from 75 – 84 years old. Oldest old: individuals’ age group from 85+ years old (37). Nutritional status: for this study individuals who had >7 score were considered as having normal nutritional status (by merging normal nutrition and risk of under nutrition) and who had a score <=7 considered as having under nutrition. Dementia status: for this study, according to 6 CIT – King shill Version 2000, Dementia screening tool individuals who had a score of between 0 and 7 was considered as having normal score (no dementia), where as individuals who had a score of between 8 and 10 were considered as having mild dementia and individuals who had a score of between 10 and 28 were considered as having severe dementia.

Data collection instrument and measurement

The data was collected from participants’ by the means of structured questionnaire to address socio-demographic, socioeconomic, health and individual life style old age individuals and Mini Nutritional assessment Short – Form (MNA-SF) was used to assess nutritional status of old age individuals. The MNA-SF screening tool has five questionnaires and one anthropometric measuring tool on food intake, weight loss, mobility, psychological stress or acute disease, presence of dementia or depression and body mass index (BMI). When height and/or weight cannot be assessed, an alternate scoring for BMI is then included in the measurement of calf circumference.

Data processing and analysis

The data was entered into EpiData version3.1 software. It was then exported to SPSS version 20 for further data analysis. Binary logistic regression analysis was the fitted model to distinguish the effect of each independent variable on the dependent variable. Variables had a p-value

Ethical considerations

Ethical clearance was obtained from Debre Markos University health science college ethical review committee; further permission letters were also secured from each formal sector institutions in Debre Markos town. Informed consent was obtained from each study participants. Privacy and confidentiality was maintained.


Result and Discussion

Socio demographic and economic characteristics of respondents:

Of the study participants, three-fourth (77%, n=324) of them were females. The median age of the respondents was 72 years, ranging from 60 to 90 years old. More than half (57%, n=242) of the respondents were married while few (4%, n=19) were either separated or single in their marital status. The most (94%, n=399) were Amhara in their ethnicity. About 47% (n=200) of the respondents responded that they could not read and write while 46% (n=195) could read and write only by their educational status. Regarding to occupation, 62% (n=262) were house wife while few 4%, (n= 15) were merchants. The majority (62%, n=263) of the respondents had a monthly income 567 or less ETB. While 34% (n=142) and 4% (n=18) had 568-1033 and 1034 or greater ETB, respectively (Table 1).
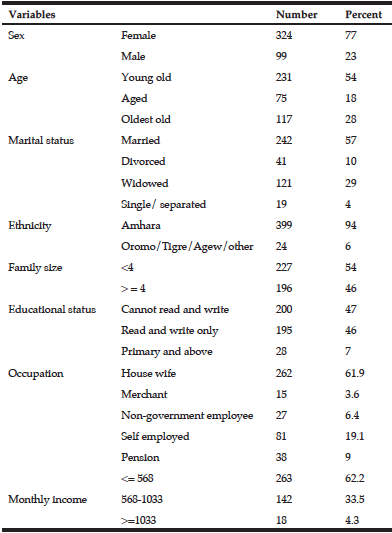
Table 1 Socio-demographic and Socioeconomic characteristics of elderly people in Debre Markos town, Northwest Ethiopia, 2015

Table 1
Socio-demographic and Socioeconomic characteristics of elderly people in Debre Markos town, Northwest Ethiopia, 2015


Medical conditions and life style characteristics of the study participants

Medical conditions

Among total study participants more than half (58%, n=245) responded as they had faced one or more medical illness at least once in their older life time. Of those that faced medical illness, visual problems were the most frequently self-reported illness, as reported by 29% (n=122) of the respondents, meanwhile the least frequently faced illness was diabetes mellitus (4%, n=17) (Fig1).
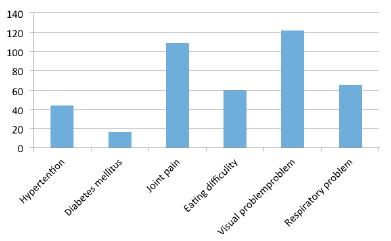
Figure 1 Self-reported medical condition of the study participants in Debre Markos town, Northwest Ethiopia, 2015

Figure 1
Self-reported medical condition of the study participants in Debre Markos town, Northwest Ethiopia, 2015


Life style characteristics of study participants

All of the study participants responded that they did not smoke. The majority (80%, n=338) of the respondents were responded as their children cooking their meals and the least number of respondents (2%, n=10) indicated that they had a maid cooking for them. Regarding mode of feeding, most (96%, n=408) of the study participants, responded as they could self-feed without any problem. In addition nearly three-fourth (74%, n=311) of the respondent replied as they have had a frequency of 3 or more meals per day (Table 2).
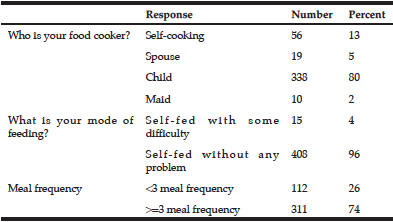
Table 2 Life style characteristics of study participants in Debre Markos town, Northwest Ethiopia, 2015

Table 2
Life style characteristics of study participants in Debre Markos town, Northwest Ethiopia, 2015


Nutritional status of the study participants

The nutritional status of the study participants were determined using the four level (0-3) multiple items (6) score scaling techniques of the MNA-SF screening tool. The tool is statistically reliable with the Cronbach score of α = 0.74. Based on the assessment, the average item score was found to be 1.84± 0.76 standard deviation with the variance of 0.58. Of the respondents, 22.7% (n=96) were found to be under nutrition with a cumulative score of seven or less assessment items. The remaining 77.7% (n=327) were found to be well-nourished with cumulative score of greater than seven nutritional assessment items (see summary based on item score Table 3).


Table 3 A Mini Nutritional Assessment (MNA-SF) item score among study participants in Debre Markos town, Northwest Ethiopia, 2015

Table 3
A Mini Nutritional Assessment (MNA-SF) item score among study participants in Debre Markos town, Northwest Ethiopia, 2015


Factors associated with nutritional status of old age individuals

Gender was found to be a significant variable; females were nearly eight times more likely to suffer from under nutrition as compared to males (AOR 7.95 95% CI (2.86, 22.08). Age was also found to be associated with under nutrition in elderly people. The oldest old and middle old ((AOR=3.45 95%CI (1.44, 8.26), (AOR=5.25, 95%CI (2.48, 11.13) respectively) were more likely to suffer from under nutrition than younger old people.
Regarding marital status, widowed individuals were 3.3 times more likely to suffer from under nutrition (AOR 3.29 95 % CI (1.54, 7.06). Elderly people who had difficulty eating were 10.73 times more likely to suffer from under nutrition (AOR 10.73 95 % CI (4.49, 25.63). Also elderly participants with vision problems were 5.67 times more likely to suffer from under nutrition (AOR 5.67 95 % CI (2.80, 11.48). Finally, elderly individuals who had meal less than three times per a day were 6.71 times more likely to suffer from under nutrition (AOR 6.71 95 % CI (3.31,13.63) (Table 4).
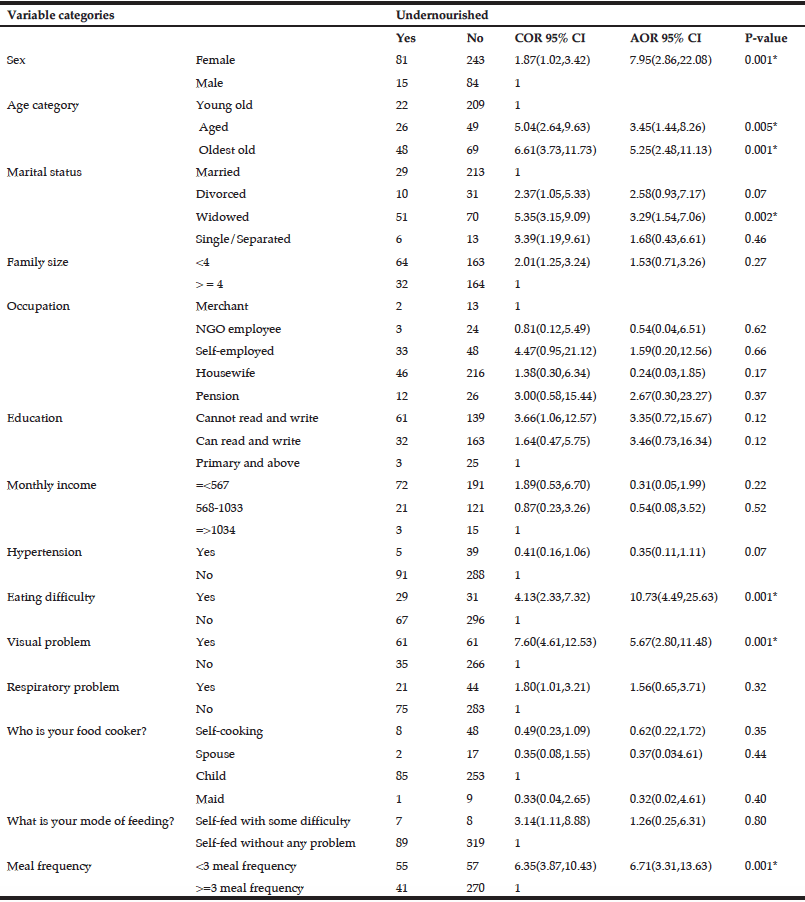
Table 4 Bi-variable and multiple variable logistic regressions for nutritional status among participants in Debre Markos town, Northwest Ethiopia, 2015

Table 4
Bi-variable and multiple variable logistic regressions for nutritional status among participants in Debre Markos town, Northwest Ethiopia, 2015

* Statistically Significant


Discussion

In this study the prevalence of under nutrition among old age individuals was found 22.7 % of those sampled. This finding was similar with studies done in Gondar, Ethiopia (21.9%) and Rural Bangladesh (26%) (17, 20) and lower prevalence compared to those reported in Bogota, Colombia (4.58%) and Sargodha city, Pakistan (5.53%) (22, 27). These differences could be created by the variation of geographic, socioeconomic and inclusion or exclusion criteria of the study participants.
Regarding the association between sex and under nutrition, this study revealed a significant difference between females and males. Females were nearly eight times more likely to be undernourished than males. This was supported by studies done in Gondar, Ethiopia which shows that females were three times more likely to be undernourished than males and in Calcutta, India which reported that females were vulnerable (8.9%) than males (4.9%) to be undernourished (17, 21). The reason female older individuals are more vulnerable for under nutrition could be explained by the fact that the older population is predominantly female and tend to live longer than men (26) and it may also be due to the fact that older females still remain the care takers of their grandchildren and they receive less than the care necessary for themselves. Another possible implication could be due to cultural influence. However, the present study contradicts with a study done in Sargodha city, Pakistan which reported under nutrition was more prominent in older males (3.16%) as compared to the older females (2.37%) (27). This difference could also be created by the variation of geographic and socioeconomic status of the study participants.
Age is found to have a significant association with under nutrition in older people. Under nutrition was most common in the aged (75-84 years) and oldest old (85 years and above) age groups compared with young old age group. This finding was similar to a study done in Gondar, Ethiopia which states that oldest old and middle old were more likely to be undernourished than young old people (38.1 and 14.6) respectively (17). As age increases the risk of under nutrition increases. This might be due to the natural aging process accompanied by physiological changes which can negatively impact nutritional status and cause inadequate nutrition (11, 18).
Marital status was one of the factors that affected the nutritional status of elderly individuals. Individuals who are widowed/ widower were 3.3 more likely to be undernourished compared to those who are married. This finding was supported by study done in Portugal which was assessed the nutritional status of older adult in the community and reported that widowed individuals were 6.73 times more likely to be undernourished than non-widowed older individuals (29). The reason could be that being alone as a result of the death of one of the mates decreases social relations and economic deficiencies (18). These changes may cause inadequate nutrition. The loss of one’s mate may also be associated with loss of motivation to prepare and eat food. In this case, grief is considered a heavy burden that contributes to reduction of food intake which thereby increases risk of undernourishment.
Eating difficulties, there was found to be a significant association with under nutrition. The participants who had reported eating problem were nearly eleven times more likely to be undernourished. Eating difficulties may be a result of oral problems such as decrease in number of teeth, usage of dental facilities, which leads to problems in chewing food. This particular problem relies on the presence of adequate teeth or dentures, and saliva flow (10, 18). This could be a barrier to the intake of different nutritional elements and make the important meal situation problematic in an older individuals and lead to the need for several adaptations with regard to food choice and preparation (33) and which may lead eventually under nutrition.
With regard to visual problem, there was significant association with elderly under nutrition. According to this study old age people with visual problem were nearly six times more likely to be undernourished compared to those elderly without visual problem. This could be due to older individual with visual impairment may not be able to prepare, shop, and cook and/or properly select their food. Moreover, if they live with their children, they may not receive enough attention and/or they may be served food that is either low in quality or in quantity that can affect nutritional status.
Finally, meal frequency was a factor which showed significant association with elderly under nutrition (


Conclusion and Recommendation

This study revealed that the prevalence of under nutrition among study participants is high in Debre Markos town Northwest, Ethiopia. It was also indicated that sex, age, marital status, eating difficulty, visual problems and meal frequency were found to be independent determinant factors of under nutrition among old age individuals, especially among female individuals of old age. It is very important to merge nutritional management with clinical practice for elderly individuals and that consideration is given to individuals who have visual problems and eating difficulties. Researchers should conduct further comprehensive nutritional assessments of the elderly, and in addition, intervention programs supported by the government which target the elderly under nutrition should be strengthened.

Limitation of the Study

The limitation of this study was; it focused only on the urban elderly individuals and might not represent the rural residents.


Acknowledgment: We would like to thank Debre Markos University and GAMBY College of Medical Sciences for giving us the chance to do this study. We would like to acknowledge the data collectors and study participants.

Authors’ contribution: All authors designed the proposal, oversaw the measurement tool, participated in data collection arrangement and supervision, checked the collected data, analyzed and interpreted it. They also checked the final report of the research.

Conflict of interest: All the authors in this study declare neither financial nor non-financial competing interests.

Ethical Standard: This study was approved by Debre Markos University health science college human research ethical committee and complied with current laws governing ethics in research.


References

1. Katherine MURPHY. Malnutrition in the community and hospital setting. The patient association. August 2011, 54
2. Karen E. CHARLTON, Monica FERREIRA, and Jean M FOURIE. Chapter 8, Nutrient Requirements and Factors Affecting Nutritional Status in Older Adults. In: Norman J TEMPLE and Nelia P STEYN. Community Nutrition Textbook for Developing Countries. 2008, 159
3. Anne SCHNEYDER. Malnutrition and Nutritional Supplements. Australian prescriber. August 2014, V. 37: No. 4
4. United Nations Department of Economic and Social Affairs. Population aging and development. 2012, available at: http//www.unpopulation.org
5. United Nation (UN): Department of Economic and Social Affairs Population Division Concise Report on the World Population Situation in 2014: A Concise Report, 2014: 24
6. Ethiopian Ministry of Labor and Social Affairs: General condition of the elderly: 2011, available at http://www.molsa.gov.et/English/SWD/Pages/SituationofElderly.aspx
7. Kathy FLAMMOND. Chapter 14, Dietary and Clinical Data Assessment. In: Yvonne ALEXOPOULOS, Kristin HEBBERD and Heather BAYS. Krause’s Food and Nutrition therapy. USA: International Edition: 2008, 12 editions, 383
8. Connie Watkins BALES and Mary Ann JOHNSON. Chapter 56, Nutrition in Older adults’. In: A. Catharine ROSS, Benjamin CABALLERO, Robert J. COUSINS, Katherine L. TUCKER and Thomas R. Ziegler. Modern Nutrition in Health and Disease. USA: Williams and Wilkins, a Wolters Kluwer business, 2014, Eleventh edition, 745
9. Nestle Nutrition institute MNA®, Mini Nutritional Assessment. The problem malnutrition: available at http//www.mna-elderly.com/the_problem_malnutrition.html
10. Karen E. CHARLTON and Donald ROSE. Nutrition among Older Adults in Africa; the Situation at the Beginning of the Millennium. J. Nutr., 2001, 131, 2424S
11. Tessfamichael D, Gete AA, Wassie MM. High Prevalence of Under nutrition among Elderly People in Northwest Ethiopia: A Cross Sectional Study. J Nutrition Health Food Sci. 2014,2(4):1-5
12. Debre Markos University: Official Website of Debere Markos University, 2013, available at: http// web.dmu.edu.et/test-dmu-site/index.php/category…/debre-markos
13. Debre Markos town woreda administrative women, youth and children office, 2015
14. Nigerian National Population Commission: National Population Census 1991 Analysis. The Elderly. Abuja: 2004, Volume 3.
15. Zarina Nahar KABIR, Tamanna FERDOUS, Tommy CEDERHOLM, Masuma Akter KHANAM, Kim STREATFIED and A°ke WAHLIN. Mini Nutritional Assessment of rural elderly people in Bangladesh: the impact of demographic, socio-economic and health factors. Public Health Nutrition. February 2006, 9(8): 968–974
16. Diego Chavarro-CARVAJAL, Carlos Reyes-ORTIZ, Rafael Samper-TERNENT, Antonio J. ARCINIEGAS, and Carlos Cano GUTIERREZ. Nutritional Assessment and Factors Associated to Malnutrition in Older Adults: A Cross Sectional Study in Bogotá, Colombia. Journal of Aging and Health. 2015, Vol. 27(2): 304–319
17. Mondrita MAJUMDER, IndranilSaha, and Debnath CHAUDHURI. Assessment of Nutritional Risk in Community-Dwelling Older Adults (65 to 75 Years) in Kolkata, India. Journal of Nutrition in Gerontology and Geriatrics. 2014, 33:126–134
18. United Nations. Department of Economic and Social Affairs: Population Division. UN, 2013, available at: http//www.un.org/en/… /desa/population /…/pdf/…/ WorldPopulation Ageing201
19. Abdul GHANI, Sarfraz HUSSAIN, Muhammad ZUBAIR. Assessment of nutritional status of geriatrics population in Sargodha City, Pakistan. Int. J med. Appl. Health. 2013, Vol. 1: 7
20. Width MARY and Reinhard TONIA: Chapter 4, Older Adults. Clinical Dietitian’s Essential Pocket Guide. USA: Lippincott Williams & Wilkins, 2009: 1st Edition, 98
21. Emine AKSOYDAN, Turan BUZGAN, Biriz ÇAKIR and Meltem SOYLU. Old age period and nutrition. Ankara, Turkey: The Republic of Turkey Ministry of Health, November 2006, 2nd Edition (in English)
22. Ana Luísa Moreira dos SANTOS, Teresa Maria de Serpa Pinto Freitas do AMARAL, and Nuno Pedro Garcia Fernandes Bento BORGES. Undernutrition and associated factors in a Portuguese older adult community. Rev. Nutr., Campinas, maio/jun., 2015, 28(3):231-240
23. Ellie WHITNEY and Shoron Rody ROLFES: Chapter 17, Life Cycle Nutrition: Adulthood and the Later Years. Understanding nutrition. USA: Thomson Learning, Inc.,2008: Eleventh edition, 594-601
24. Maria NYBERG, Viktoria OLSSON, Zada PAJALIC, Gerd ÖRTMAN, Håkan S. ANDERSSON, Anna BLÜCHER, Karin WENDIN & Albert WESTERGREN: Eating difficulties, nutrition, meal preferences and experiences among elderly a literature overview from a Scandinavian context: Journal of Food Research; Vol. 4, No. 1; 2015

OSTEOPOROSIS IN THE COMMUNITY: FINDINGS FROM A NOVEL COMPUTERIZED REGISTRY IN A LARGE HEALTH ORGANIZATION IN ISRAEL


I. Goldshtein1,3, J. Chandler2, V. Shalev1,3, S. Ish –Shalom4, A.M. Nguyen2, V. Rouach5, G. Chodick1,3


1. Epidemiology and database research unit, Maccabi Healthcare Services, Tel Aviv, Israel; 2. Department of Epidemiology, Merck and Co, Inc, North Wales, PA; 3. Tel Aviv University, Israel; 4. Rappaport Faculty of Medicine, Technion-Israel Institute of Technology, Haifa, Israel; 5. Institute of Hypertension, Metabolism, and Endocrinology, Tel Aviv Souraski Medical Center, Tel Aviv, Israel

Corresponding Author: Inbal Goldshtein, Maccabi Healthcare Services, 27 Ha’Mered Street Tel Aviv 68125 Israel, Tel: 972 3 7952616   Fax: 972 73 2132831, E-mail: goldst_in@mac.org.il


Abstract

Background: Osteoporosis is a growing public health concern due to its rising prevalence and excess morbidity and mortality. Automated patient registries have gained great importance in health and disease management of major chronic diseases, but are rarely used in osteoporosis. Objectives: To construct an automated, population-based registry of osteoporosis. Setting: The electronic medical records and pharmacy databases of a 2 million member health organization in Israel (Maccabi Healthcare Services). Methods:  Included in the registry were adults who were diagnosed with osteoporosis diagnosis, had major osteoporotic fractures, or purchased relevant medications, between 2000 and 2013. In addition, we included patients with low bone density as extracted from over 140,000 measurements reports, using an automated optical character recognition (OCR) system. Two-thirds of the cases were validated by more than one inclusion criterion. Results:  A total of 118,141 osteoporosis patients were identified.  The point prevalence of osteoporosis among members aged 50 or above in 2013 was 19%. The mean age at registry entry was 62 (SD=12) and 66 (SD=14) years for females and males, respectively. The highest annual risk of developing osteoporosis (27 per 1000) was recorded among females aged 65-75. In 28% of the patients, there was no indication of treatment with osteoporosis therapy. Conclusions: To the best of our knowledge, this is one of the first real-world automated registries of osteoporosis. Similar registries may provide valuable data for real-time monitoring of trends, quality of care, and outcome research in osteoporosis and its complications. 

Key words: Osteoporosis, registry, prevalence.


Introduction 

With a growing elderly population and a prevalence of over 200 million people worldwide (1), the global epidemic of osteoporosis (OP) poses a serious public health concern. The major medical, social, and economic consequences of osteoporosis are due to osteoporotic fractures resulting in disability (2-4) and excess mortality (5). In white populations, the lifetime risk of fragility fracture is approximately 50% in females and 20% in males (6). 

In addition to fractures, other manifestations of osteoporosis such as low bone mineral density (BMD) and vertebral deformities have been strongly associated with increased risk of death from stroke (7), coronary heart diseases (8) and pulmonary diseases (9).

Considerable variations were observed between countries with regards to OP fracture rates (10-12), warranting the need for local estimations. The reason for such variations may lie in genetic factors or environmental factors, as well as differences in measurement and reporting systems, or differences in case-finding approach. Self-report survey studies, insurance claims-data, and hospital-based studies have shown to underestimate fracture risks (13-15). 

Israel has a social public health care system and developed sources of data that allow the population-based analyses on the burden of chronic diseases that can be generalized to other western-like populations (16-19). 

The available data (20-23) on the epidemiology of osteoporosis and mortality among patients with OP  fractures in Israel are partial and outdated and thus may not reflect important changes in recent years such as increased life expectancy and introduction of new anti-osteoporotic treatments.

The objective of the present study was to establish a registry of osteoporosis patients using automated collection of individual-level information on important characteristics[24] such as demography, co-morbid conditions, medication use, laboratory tests, and bone densitometry measurements. Specifically, the registry was analyzed to assess the current age-and-sex specific prevalence of osteoporosis, history of OP fractures, and a retrospective assessment of all-cause mortality among patients with OP fractures. 


Materials and methods

Settings 

This study utilized the longitudinal databases of Maccabi Healthcare Services (MHS), the second largest sick fund in Israel, ensuring 25% of the population with a nationwide and representative distribution. These databases are derived from electronic medical records (EMRs) of a stable population of over 2 million ensured members. Israel’s sick funds provide a uniform legally defined basket of services to which every citizen is entitled as a member of one of four nationwide health funds that are financed by government via age-related capitation payments (90% of total), patient charges and other income (10%).  Citizens are free to choose and move between health funds, which are not exclusive and must accept all applicants for memberships. .

BMD measurements were collected from the datasets of a single chain of medical centers (“Assuta Health Systems”), where approximately 86% of the dual-energy X-ray absorptiometry (DXA) scans in MHS are performed.  All DXA scans in these clinics are conducted using a standardized model of GE- lunar prodigy scanner. 

Study population

Eligible for the study registry were all MHS members aged 18 or above with any of the following inclusion criteria: a physician diagnosis of osteoporosis (according to the International Classification of Diseases version 9 with clinical modifications (ICD-9-CM) codes: 733.0-733.03, 733.09, 733.7) , or osteopenia (ICD-9-CM code: 733.9) validated by any fracture one year before or after date of diagnosis, OP-specific therapy (defined by a dispensed medication prescription of any of the following: Bisphosphonates, Raloxifene, Strontium Ranelate, Teriparatide or Calcitonin), a minimum t-score of -2.5 or less , or a clinical diagnosis of a major osteoporotic fracture (MOF) or hip fracture surgery. MHS database does not include data on trauma type, except for fractures of road accidents, thus we could only partially distinguish between osteoporosis related fractures and high-impact trauma fractures. Thus, to ensure high specificity of the registry we considered only MOF for females aged 50 or above or in males aged 60 or above for independent inclusion criteria. MOF includes fractures commonly associated with osteoporosis: closed fractures of femur, vertebral, colles and proximal humerus, which were not listed in the database as associated with a car accident. Other closed fracture diagnoses may be related to osteoporosis but not considered specific enough and were used only for descriptive analysis. 

Excluded from the registry were patients with Paget’s disease (ICD-9-CM code 731.0, n=587) or multiple myeloma (203.0, n=631) as indicated in the EMR or hospital discharge, patients whose only qualifying registry entry criteria was fracture and either suffered from multiple fractures at the same date (n=640, most likely overwhelming trauma and not OP) or fractures due to metastatic cancer (n=107), and patients whose only qualifying registry entry criteria was pamidronic or zoledronic acid purchase and who were previously diagnosed with cancer (cancer is an alternative indication to these drugs in addition to OP, n=301).

Registry entry date was defined as the first medical event (diagnostic code, associated drug prescription, lab value or procedure) which is consistent with any of inclusion and all exclusion criteria. 

Co-morbid conditions were defined by MHS registries for chronic major diseases such as ischemic heart disease (25), diabetes (26) and hypertension. Renal impairment at follow up was defined by last eGFR measurement <=35 or patient in the MHS dialysis registry. Recent depression was defined as at least 6 purchases of SSRI in the last 2 years.

Socioeconomic status (SES) was defined by the 2008 national census (27) according to the poverty index of the member’s enumeration area, ranging between 1 (lowest) to 20 (highest). 

Study periods 

Follow up date was defined as the earliest of disenrollment from MHS, death, or December 31, 2013. 

Inclusion period: between Jan 1st 2000 and Dec 31st 2013. 

Statistical analysis 

Age and sex specific prevalence rates were determined for December 2013. 95% Confidence intervals for osteoporosis prevalence were calculated using the exact binomial (Pearson-Klopper) method using R statistical software (28). 

Age-and-sex standardized morbidity ratios (SMRs) with 95% confidence intervals were computed to compare between the OP registry and the general population of MHS.

We calculated OP incidence density rates during the study period after excluding members diagnosed with OP less than 3 years prior to first year of follow-up, as well as members with less than 5 years of continuous membership in Maccabi before diagnosis, to ensure selection of newly developed cases. For incident cases of osteoporosis (or MOF), only the time until cohort entry (or MOF diagnosis) contributed to the denominator of patient-years at risk.

We assessed primary incidence of MOF in MHS. Clear distinction between reports on incident events and follow-up of previous events is often difficult. High rates of surgery complications, delayed healing, recurrent complaints on past events[29], and the need for follow-up, may limit the accuracy of previous assessments of incidence. Thus we assessed only primary incidence, which cannot be compared to non-primary annual rates.

The study was approved by the Assuta hospital’s institutional review board.

Results

A total of 118,141 eligible patients were identified for the registry, with approximately 6,000 incident cases annually (table 1). The mean duration of follow-up since first indication of osteoporosis was 7.9 years (SD=4.5). A total of 66% of the registry’s patients met two or more inclusion criteria, validating their OP status (Appendix A).  


Table 1 Demographics and comorbidities of osteoporosis patients with age and sex standardized morbidity ratios (SMR) compared to the general population in Maccabi healthcare services, December 2013

*Chronic obstructive pulmonary disease;  3. Socioeconomic status, ranging between 1 (lowest) to 20 (highest). See text for details;  4. Latest available measurement; 5. Systemic glucocorticoids; 6. Vitamin D deficiency was defined as <20 ng/ml. The calculation was out of non-missing data. 12% of the registry and 30% of the general population in Maccabi had missing vitamin D level.


Table 2 Age and sex specific prevalence rates per 1000 and 95% confidence intervals of osteoporosis in Maccabi healthcare services, Israel, 2013


Prevalence and incidence rates in MHS

The crude prevalence rates of osteoporosis among members aged 50 or above in MHS were 31.4% and 5.9% among females and males, respectively (table 2). Prevalence of MOF history increased exponentially with age reaching 30.1% in females and 11.8% in males at the age of 85 years or above (table 3).


Table 3 Age and sex specific prevalence rates (per 1000) of major osteoporotic fractures in Maccabi healthcare services, Israel, 2013


Figure 1a Age and sex specific incidence density rates and 95% confidence intervals of osteoporosis (per 1000 person years) in Maccabi healthcare services, 2003-20137

7. Error bars indicate 95% confidence intervals.


The highest incidence rate of OP was recorded at the age group of 65-74 and 55-64 among males and females, respectively (figure 1.a). The risk of MOF increases with age (figure 1.b). 

Demographics and comorbidities of OP registry patients

In 2013, the mean age of OP patients in MHS was 69.0 years old (SD=11.6), with females accounting for 85% of the registry (table 1). Compared with the age and sex adjusted general population of MHS, OP patients were more likely to have diagnosed history of COPD, Crohn’s disease, ulcerative colitis, and recent depression, and less likely to be obese, diabetic or have vitamin D insufficiency.


Figure 1b Annual age and sex specific incidence (per 1000 capita) of primary major osteoporotic fractures in Maccabi healthcare services, 2013


History of fractures in OP registry

Among OP patients with an indication of MOF history (29%), the most common fractures were hip among males (36.2%) and colle’s among females (37.3%). 

In addition, in 12% of the registry, we found an indication of non-MOF fractures that are likely to be related with osteoporosis (e.g. metatarsal, ribs, and ankle) which were not inclusion criteria for the registry. 

All-cause Mortality after OP fracture

Figure 1 depicts all-cause mortality rates within 1 year from date of MOF.  The highest mortality rates (23% in females and 32% in males) were observed among elderly patients (85 year or above) with a hip fracture.

Anti-osteoporosis therapy 

A total of 72% of the registry had at least one dispensation of osteoporosis medication ever. Among incident cases, treatment initiation rates were significantly higher (P<0.001) in females (75.3%) compared to males (62.1%). Only 24% of patients with hip fracture who were Anti-osteoporosis therapy naïve, initiated treatment after the fracture occurrence (22% were already treated before fracture event). This proportion is higher after vertebral fractures (38%) and lower after colles or humerus fractures (21%).


Figure 2 Age and sex specific all-cause mortality rates within 1 year from osteoporotic fracture event, Maccabi healthcare services, Israel, 2000-2013


Bone density measurements

Approximately 72% of the OP registry patients had an indication of performing a DXA scan. BMD values were electronically available for 52% of them (37% of the total registry).  Among the patients with t-scores of -2.5 or lower:  55% were <=-2.5 at femoral neck, 40% at spine and 5% total hip. In all but 3% (n=406) the femur neck indicated at least osteopenia. Mean values of DXA measurements at follow-up are given in table 1.


Discussion

The present study described the establishment of an osteoporosis patient registry in a large and representative health organization in Israel, and the first population-based report of the epidemiology of this disease in the country. 

The results of the study reveal the immense burden of osteoporosis in Israel, with prevalence rates of 61% and 19% among females and males aged 75 or above. The observed OP prevalence was comparable to the findings of other large registries in Europe such as “BEST” (30) and “BoneEVA” (31). An Israeli survey (23) reported a lower prevalence (32% vs. 49% among females aged 65), possibly explained by the limitation of self-report data, as well as reduced awareness at that period (1999). The prevalence of diagnosed OP concords with a previous Israeli study (22) (14% vs. 13% among females aged 45-74, results not shown).  

In Israel, the remaining life expectancy of men and women at age 50 is approximately 31 and 35 years, respectively (CBS 2014). Therefore, according to our age-specific prevalence, the respective estimated OP-fracture lifetime risks in Israeli men and women are 6% and 30%,in accordance with previous international assessments (32, 33). Similar to previous large cohort studies (34, 35) our results indicate that while the absolute risk of hip fractures is two-fold higher among females, they account for a greater proportion of MOF among males. Similar to previous studies (36, 37), men were found to have a significantly poorer survival after hip fracture compared to women, although residual confounding by co-morbid conditions should be examined in future studies. 

In agreement with previous analyses among OP patients, we found increased SMRs for known risk markers such as COPD (38) and inflammatory bowel disease (IBD) (39) compared to the general population. Obesity and diabetes were decreased in the OP registry compared to the general population of MHS, with a BMI distribution similar to a recent large US cohort (40). 

This study has several major strengths such as a large and unselected population, a relatively long retrospective follow-up, standardized densitometry measurements, and automated collection of comprehensive data, including medical diagnosis, prescribed therapies, and lab tests. To our knowledge, this is the first registry of its kind in Israel, and one of the largest worldwide. We plan to update it periodically, identify new cases that meet the selection criteria in MHS and monitor outcomes.

Some limitation should be discussed, such as missing data on fracture circumstances, specifically to distinguish between OP related vs. high-impact trauma fractures. Our objective was high specificity of the registry, thus only typical/characteristic OP fractures were used as independent inclusion criteria, and multiple concurrent fractures were excluded (rarely OP-related, previously assessed as 2.5% of OP fractures (21)). In addition, pre-defined age cut-offs were used to identify MOF. The asymmetric age cut-offs between males and females (60+ vs. 50+ respectively) may yield somewhat lower sensitivity to detect males compared to females. Similarly to other retrospective population-based studies relying on clinical diagnoses, our data is likely to underestimate the rates of vertebral compression fractures (6), as these fractures are universally underdiagnosed.

Building a valid and efficient algorithm to detect patients for a central registry requires careful examination and assessment of the variety of different measures and definitions (41). The majority of the registry was validated by meeting at least 2 inclusion criteria. The remainder may be explained by low awareness for documentation and treatment initiation, non-compliance of patients, partial electronic availability of bone density values, or (less frequently) due to contra-indication of therapy. 

We believe this up-to-date registry can serve as a valuable resource for future studies in the field of osteoporosis and improve our understanding of the risks and prevention of osteoporosis. 


Funding: The study was funded by Merck and Co.

Conflict of interest: Sofia Ish-Shalom has received research grants and consulting, advisory board, lecture fees, and any combination of the three from Merck Sharp & Dohme, Eli Lilly, Enterabio, GlaxoSmithKline, and Novartis. Vanessa Rouach has received lecture fees from Eli Lilly, GlaxoSmithKline, and Novartis. Julie Chandler and Allison Martin Nguyen are employees of Merck and Co. Inbal Goldshtein, Varda Shalev and Gabriel Chodick declare that they have no conflict of interest.

Acknowledgments: We would like to thank Mrs. Racheli Katz and Mrs. Esma Herzel of Meaccbi Healthcare Services, for their considerable contribution to data collection. This work was performed in partial fulfillment of the requirements for a Ph.D. degree of Mrs. Inbal Goldshtein, Faculty of Management, Tel Aviv University, Israel.


References

1.  Cooper C, Campion G, Melton LJ, 3rd.Hip fractures in the elderly: a world-wide projection. Osteoporos Int 1992;2:285-289

2.  Cummings SR, Melton LJ. Epidemiology and outcomes of osteoporotic fractures. Lancet 2002;359 (9319):1761-1767. 

3.  Gullberg B, Johnell O, Kanis JA. World-wide projections for hip fracture. Osteoporos Int 1997;7 (5):407-413

4.  Johnell O, Kanis JA. An estimate of the worldwide prevalence, mortality and disability associated with hip fracture. Osteoporos Int 2004;15:897-902. 

5.  Abrahamsen B, van Staa T, Ariely R, Olson M, Cooper C. Excess mortality following hip fracture: a systematic epidemiological review. Osteoporos Int 2009;20:1633-1650. 

6.  Sambrook P, Cooper C. Osteoporosis. Lancet 2006;367:2010-2018. 

7.  Nordstrom A, Eriksson M, Stegmayr B, Gustafson Y, Nordstrom P. Low bone mineral density is an independent risk factor for stroke and death. Cerebrovasc Dis 2010;29:130-136. 

8.  Kado DM, Browner WS, Blackwell T, Gore R, Cummings SR. Rate of bone loss is associated with mortality in older women: a prospective study. J Bone Miner Res 2000;15:1974-1980. 

9.  Hasserius R, Karlsson MK, Nilsson BE, Redlund-Johnell I, Johnell O. Prevalent vertebral deformities predict increased mortality and increased fracture rate in both men and women: a 10-year population-based study of 598 individuals from the Swedish cohort in the European Vertebral Osteoporosis Study. Osteoporos Int 2003;14:61-68.

10.  Dhanwal DK, Cooper C, Dennison EM. Geographic variation in osteoporotic hip fracture incidence: the growing importance of asian influences in coming decades. J Osteoporos 2010:757102.

11.  Elffors I, Allander E, Kanis JA, Gullberg B, Johnell O, Dequeker J, Dilsen G, Gennari C, Lopes Vaz AA, Lyritis G, et al. The variable incidence of hip fracture in southern Europe: the MEDOS Study. Osteoporos Int 1994;4:253-263

12.  Ismail AA, Pye SR, Cockerill WC, Lunt M, Silman AJ, Reeve J, Banzer D, Benevolenskaya LI, Bhalla A, Bruges Armas J, Cannata JB, Cooper C, Delmas PD, Dequeker J, Dilsen G, Falch JA, Felsch B, Felsenberg D, Finn JD, Gennari C, Hoszowski K, Jajic I, Janott J, Johnell O, Kanis JA, Kragl G, Lopez Vaz A, Lorenc R, Lyritis G, Marchand F, Masaryk P, Matthis C, Miazgowski T, Naves-Diaz M, Pols HA, Poor G, Rapado A, Raspe HH, Reid DM, Reisinger W, Scheidt-Nave C, Stepan J, Todd C, Weber K, Woolf AD, O’Neill TW. Incidence of limb fracture across Europe: results from the European Prospective Osteoporosis Study (EPOS). Osteoporos Int 2002;13:565-571. 

13.  Gerdhem P, Akesson K. Rates of fracture in participants and non-participants in the Osteoporosis Prospective Risk Assessment study. J Bone Joint Surg Br 2007;

14.  Smith MR, Lee WC, Brandman J, Wang Q, Botteman M, Pashos CL. Gonadotropin-releasing hormone agonists and fracture risk: a claims-based cohort study of men with nonmetastatic prostate cancer. J Clin Oncol 2005;23:7897-7903. 

15.  Unnanuntana A, Gladnick BP, Donnelly E, Lane JM. The assessment of fracture risk. J Bone Joint Surg Am 2010;92:743-753. 

16.  Bellamy L, Casas JP, Hingorani AD, Williams D. Type 2 diabetes mellitus after gestational diabetes: a systematic review and meta-analysis. Lancet 2009;373:1773-1779

17.  Chodick G, Elchalal U, Sella T, Heymann AD, Porath A, Kokia E, Shalev V The risk of overt diabetes mellitus among women with gestational diabetes: a population-based study. Diabet Med 27:779-785

18.  Chodick G, Shalev V, Gerber Y, Heymann AD, Silber H, Simah V, Kokia E. Long-term persistence with statin treatment in a not-for-profit health maintenance organization: a population-based retrospective cohort study in Israel. Clinical therapeutics 2008;30:2167-2179

19.  Mann DM, Woodward M, Muntner P, Falzon L, Kronish I Predictors of nonadherence to statins: a systematic review and meta-analysis. The Annals of pharmacotherapy 44:1410-1421

20.  Givon U. Consensus conference on the treatment and rehabilitation of hip fractures in the elderly. Isr Med Assoc 1999;J 1:131-136

21.  Liel Y, Castel H. [Incidence of osteoporotic fractures in southern Israel]. Harefuah 2004;143:18-21

22.  Nitzan-Kaluski D, Chinich A, Ifrah A, Merom D, Green M. Correlates of osteoporosis among Jewish and Arab women aged 45-74 in Israel: national women’s health interview survey. The journal of gender-specific medicine 2002;6:17-23

23.  ICDC, Ministry of Health (2004) National Health Survey in Israel – a WHO project, European Sector. EUROHIS 2004  publication no 237.

24.  David C, Confavreux CB, Mehsen N, Paccou J, Leboime A, Legrand E (2010) Severity of osteoporosis: what is the impact of co-morbidities? Joint Bone Spine 2010;77 Suppl 2:S103-106. 

25.  Shalev V, Chodick G, Goren I, Silber H, Kokia E, Heymann AD. The use of an automated patient registry to manage and monitor cardiovascular conditions and related outcomes in a large health organization. Int J Cardiol 2011;152:345-349. 

26.  Chodick G, Heymann AD, Shalev V, Kookia E. The epidemiology of diabetes in a large Israeli HMO. Eur J Epidemiol 2003;18:1143-1146

27. Israel Central Bureau of Statistics  (2013) Characterization of geographical units by the socio-economic level of the population 2008. http://www.cbs.gov.il/webpub/pub/text_page_eng.html?publ=100&CYear=2008&CMonth=1 Accessed 19 October 2014

28.  Friedman DS, Quigley HA, Gelb L, Tan J, Margolis J, Shah SN, Kim EE, Zimmerman T, Hahn SR. Using pharmacy claims data to study adherence to glaucoma medications: methodology and findings of the Glaucoma Adherence and Persistency Study (GAPS). Invest Ophthalmol Vis Sci 2007;48 :5052-5057.

29.  Donaldson LJ, Reckless IP, Scholes S, Mindell JS, Shelton NJ. The epidemiology of fractures in England. J Epidemiol Community Health 2008;62:174-180. 

30.  Hadji P, Klein S, Gothe H, Haussler B, Kless T, Schmidt T, Steinle T, Verheyen F, Linder R. The epidemiology of osteoporosis–Bone Evaluation Study (BEST): an analysis of routine health insurance data. Dtsch Arztebl Int 2013;110:52-57. 

31.  Haussler B, Gothe H, Gol D, Glaeske G, Pientka L, Felsenberg D. Epidemiology, treatment and costs of osteoporosis in Germany–the BoneEVA Study. Osteoporos Int 2007;18:77-84. 

32.  Holroyd C, Cooper C, Dennison E. Epidemiology of osteoporosis. Best Pract Res Clin Endocrinol Metab 2008;22 (5):671-685. 

33.  Hopkins RB, Pullenayegum E, Goeree R, Adachi JD, Papaioannou A, Leslie WD, Tarride JE, Thabane L. Estimation of the lifetime risk of hip fracture for women and men in Canada. Osteoporos Int 2012;23:921-927. 

34.  Brauer CA, Coca-Perraillon M, Cutler DM, Rosen AB. Incidence and mortality of hip fractures in the United States. JAMA 2009;302:1573-1579. 

35.  Feldstein A, Elmer PJ, Orwoll E, Herson M, Hillier T. Bone mineral density measurement and treatment for osteoporosis in older individuals with fractures: a gap in evidence-based practice guideline implementation. Arch Intern Med 2003;163:2165-2172. 

36.  Bliuc D, Nguyen ND, Milch VE, Nguyen TV, Eisman JA, Center JR. Mortality risk associated with low-trauma osteoporotic fracture and subsequent fracture in men and women. JAMA 2009;301:513-521. 

37.  Center JR, Nguyen TV, Schneider D, Sambrook PN, Eisman JA. Mortality after all major types of osteoporotic fracture in men and women: an observational study. Lancet 1999;353:878-882. 

38.  Lehouck A, Boonen S, Decramer M, Janssens W. COPD, bone metabolism, and osteoporosis. Chest 2011;139:648-657.

39.  Bernstein CN, Blanchard JF, Leslie W, Wajda A, Yu BN. The incidence of fracture among patients with inflammatory bowel disease: a population-based cohort study. Annals of internal medicine 2000;133:795-799

40.  O’Malley C, Tran N, Zapalowski C, Daizadeh N, Olenginski T, Cauley J. Multimorbidity in women with and without osteoporosis: results from a large US retrospective cohort study 2004–2009. Osteoporosis International: 2014;1-14

41.  Gliklich R, Dreyer N. Registries for Evaluating Patient Outcomes. Agency for Healthcare Research and Quality, Rockville, MD, 2010


Appendix A Distribution of inclusion criteria in the Maccabi healthcare services osteoporosis registry

nn1