jarlife journal
Sample text

AND option

OR option

EFFECTS OF VITAMIN D SUPPLEMENTATION ON WELL-BEING, POSTURAL CONTROL, MUSCLE STRENGTH, BONE AND CALCITROPIC HORMONES – A RANDOMIZED DOUBLEBLIND PLACEBO CONTROLLED TRIAL


S.A. Eriksen1, J. Starup-Linde2, R.P. Hirata3, K.K. Petersen4, T. Graven-Nielsen4, P. Vestergaard1,5


1. Department of Clinical Medicine, Aalborg University Hospital, Aalborg, Denmark; 2. Department of Endocrinology and Internal Medicine, Aarhus University Hospital, Aarhus, Denmark; 3. SMI, Department of Health Science and Technology, Aalborg University, Aalborg, Denmark; 4. Center for Neuroplasticity and Pain (CNAP), SMI, Department of Health Science and Technology, Aalborg University, Aalborg, Denmark; 5. Department of Endocrinology, Aalborg University Hospital, Aalborg, Denmark

Corresponding Author: Stine Aistrup Eriksen, PhD cand.scient.med, Department of Clinical Medicine, Aalborg University Hospital, Aalborg, Denmark, stineaistrup@hotmail.com,  Phone: +45 23 98 60 72

J Aging Res Clin Practice 2019;8:49-56
Published online June  5, 2019, http://dx.doi.org/10.14283/jarcp.2019.9


Abstract

Background: Antidepressants may increase the risk of fractures through negative effects on the musculoskeletal system that could be hindered by vitamin D supplements. Objectives: To study the pleiotropic effects of daily vitamin D supplementation in depressed patients treated with citalopram (patients) and healthy controls. Design: Randomised double blind placebo controlled trial. Setting: A study of Danish women in the age 50 to 90 years. Participants: A total of 21 patients and 50 controls. Intervention: Participants received daily vitamin D supplementation (50 micrograms) or placebo in one year. Measurements: Bone Densitometry by dual-energy x-ray absorptiometry. Serum 25-hydroxyvitamin D, intact-Parathyroid Hormone, type 1 procollagen N terminal peptide, tartrate resistant acid phosphatase type 5b. Pain sensitivity measures based on pain detection thresholds by cuff algometry, temporal summation of pain, conditioned pain modulation, and cutaneous pain sensitivity by pinprick test. Degree of depression by the Major Depression Inventory. Physical performance was assessed by Timed up and go, isomeric handgrip exercise, and postural control by force plate. Results: Serum 25(OH)D levels increased in the vitamin D treated patients compared with controls at the 12 months visit (P<0.05). Conversely, intact- Parathyroid Hormone decreased among the patients and controls receiving vitamin D compared with placebo (P<0.05). Vitamin D improved Major Depression Inventory scores in patients and controls compared with placebo (P<0.05). In patients receiving vitamin D, handgrip strength improved (P<0.05). Conclusions: Vitamin D may improve depressive symptoms, and improve handgrip strength among patients compared to controls.

Key words: Vitamin D, citalopram, BMD, pain sensitivity, physical performance.


Introduction

Several studies have shown that vitamin D supplementation have a positive influence on Bone Mineral Density (BMD). Higher doses (700 to 800 IU a day) of vitamin D supplementation seemed to be more effective in fracture prevention and prevention of falls than smaller doses (400 to 600 IU a day) among middle-aged and older adults (1).
Vitamin D may also affect skeletal muscle cell contractility, differentiation, and proliferation (2), although the effects remain controversial. The synthesis of vitamin D in the skin decreases with age, as well as absorption in the intestines as well as activation in the kidneys and peripheral tissues is lower among elderly people. Further, the level and capacity of the vitamin D receptor is lower with advancing age, with a resultant higher prevalence of vitamin D deficiency within this population. Especially among elderly people, vitamin D deficiency has been associated with an important determinant of disability, comprising poor physical performance, muscle fatigue, falls and fractures (3). Falls and fractures are likewise strongly associated with muscle weakness, gait and balance deficits (4), as well as presence of musculoskeletal pain (5).
Major depressive disorder (MDD) is prevalent especially in the geriatric population. Medical treatment with antidepressants have significantly advanced the outcome of depression although a number of remitted depressed persons still experience residual symptoms like fatigue, myalgia, and bone pain (6). These symptoms resemble those seen in patients deficient in vitamin D and recent meta-analyses have reported evidence for an association between hypovitaminosis D and MDD (7). Low exposure to sunlight because of isolation at home and poor dietary habits may be consequences of the depressive condition, affecting vitamin D levels negatively.
Chronic pain is common in MDD where approximately 70% of patients with MDD may experience chronic pain (8). The association is most likely bidirectional since depression predict persistent pain and pain predict depressive relapse and persistence, as prognosis and treatment outcome of depression are affected negatively by the co-existence of pain (9). Antidepressants are known to have analgesic properties and have, in addition to treatment of depressive symptoms, been prescribed in the treatment for pain. Specifically patients with impaired pain inhibitory pathways have been shown to achieve greater pain efficacy to duloxetine, a serotonin-noradrenalin reuptake inhibitory, compared to patients with less impaired pain inhibitory pathways (10), suggesting common pathways between depression and chronic pain.
A recent meta-analysis showed that vitamin D, among other vitamins, comprises a potential for reducing depressive symptoms when supplemented in adjunction to antidepressant treatment (11). Another meta-analysis (7) found evidence for an association between 25(OH)D levels and depressive symptoms. Such effects are likely mediated through the recently discovered involvement of vitamin D in regulation of neurotransmitters such as serotonin and noradrenaline (12), which are seen as central components of MDD pathophysiology, and are the main targets of antidepressants. Vitamin D deficiency has also been found to be associated with increased pressure pain sensitivity (13), but the results of treatment with vitamin D on pain varies (14, 15).
Selective serotonin reuptake inhibitors (SSRIs) are often prescribed as first line treatment for MDD in elderly people due to its favourable side-effect profile compared to other types. Recently, SSRIs have however been associated with decreased bone mineral density (BMD) (16) and an increased risk of bone fractures (17).
The aim of this study was in a randomized placebo controlled setting to evaluate the effects of 50 micrograms of daily vitamin D in patients treated with citalopram for major depressive disorder as well as healthy controls on: 1) General well-being expressed as major depression inventory (MDI) score and EQ-5D as a measure of quality of life. 2) Symptoms associated with depression and lack of well-being such as pain and pain sensitivity. 3) Muscle function and strength expressed as postural control measured by force plate and handgrip strength. 4) The more classical vitamin D on bone and bone turnover as well as calcitropic hormones.


Methods

The study consisted of a randomised double blind controlled trial of 50 micrograms (µg) (2000 IU) cholecalciferol (vitamin D3) per day versus matching placebo for 12 months. The study was approved by the local ethics committee (N-20130052) and registered on clinical trials.gov (NCT01932931). The study followed the Helsinki declaration and all participants gave informed written consent.

Subjects

Subjects were recruited between March 2014 and February 2015 through local newspaper advertisement, local hospitals, and pharmacies as well as advertisement on social media.
Inclusion criteria were women aged 50 to 90 years, who were current citalopram or mirtazapine users, or individuals who were going to initiate treatment of either drug within the following two months due to a diagnosis of major depressive disorder; or healthy controls, i.e. not depressed or receiving antidepressants. Due to few participants (n=3) in the Mirtazapine group as originally planned, results from this group will not be presented. The exclusion criteria were: 1) Current or use within the past 6 months of drugs affecting bone turnover such as corticosteroids, hormone replacement therapy in postmenopausal women, drugs against osteoporosis or other bone diseases (Paget’s disease of bone), vitamin D supplementation >35 micrograms daily, depot Medroxyprogesterone Acetate (DMPA), Cyclosporine (CsA), Antiretroviral Therapy (ART). 2) Impaired renal function (serum creatinine > 150 micromolar/l). 3) Pregnant women. 4) Individuals diagnosed with cancer or a metabolic disorder such as diabetes. 5) Individuals with prosthetic material in hip or spine. 6) Individuals diagnosed with a disease that affects bone such as Paget’s disease of the bone, or fibrous dysplasia. 7) Individuals which is not considered eligible for the clinical trial e.g. individuals diagnosed with dementia, severely psychotic or depressed individuals. 8) Individuals that have been taking other antidepressants than citalopram or mirtazapine for more than 6 months prior to the inclusion and if this treatment persisted for a period of minimum 12 months. 9) Individuals who cannot stand up and stand still without support or a helping device due to physically impairment. 10) The presence of other pain problems (e.g. osteoarthritis) or sensory dysfunction (e.g. fibromyalgia, neuropathic pain).

Bone mineral density

Bone Densitometry (BMD) of total hip, femoral neck, and lumbar spine (L1-L4) was assessed for all subjects at baseline and after 12 months using by dual-energy x-ray absorptiometry (DXA) scans on a GE Lunar Prodigy Scanner (GE Healthcare Lunar prodigy, USA). Quality control procedures were run every day including calibration by use of QA Phantom (Lunar DPX Series QC Phantom and a Block Phantom). The coefficient of variation (CV) between the two scanners was 1%.

Biochemical measures

Samples were immediately frozen at -80 °C. Serum vitamin D [total serum 25-hydroxyvitamin D (25(OH)D)] was measured using an electrochemiluminescence-binding assay ECLIA (Elecsys® Vitamin D total, modular analytics E170). CV was 1.7-7.8 % for intra-assay and CV 2.2-10.7 % for inter-assay variation.
Procollagen type 1 N-terminal peptide (P1NP), Tartrate-resistant phosphatase type 5b (TRAP5b – iSYS), and intact PTH were determined using an iSys machine and kits from IDS plc. Intact PTH was measured using the IS3200 and control kit (detection limit 5 pg/ml, CV 4.1-8.2%). P1NP was measured using the IS4000 and control kit (detection limit 2 ng/ml, CV4,4-5.3%). TRAP5b was measured using the IS4100 and control kit (detection limit 0.9 IU/l, CV 5.0-13.6%).

Self-rated questionnaires

All subjects filled out questionnaires at each visit at the clinic including information regarding mental and physical health status: Major Depression Inventory (MDI) (18), and EQ-5D (19).

Postural control

Subjects were tested during quiet bipedal stance on a force platform (Plux Biosignals S.A, Arruda dos Vinhos, Portugal) in four different sensory conditions: i) eyes open, standing on a firm surface, ii) eyes closed on firm surface, iii) eyes open on soft surface, iv) eyes closed on soft surface, each lasting for 35 seconds. One trial consisted of the four sensory conditions i) to iv) recorded in the same order and in one sequence, repeated three times separated by short breaks (30-60 seconds) in between. For the soft surface condition, a soft foam pillow (O’live Balance pad, Denmark) was placed on top of the force platform. Average parameters from the three trials, for each of the four sensory conditions, were used for analysis. The center of pressure (CoP) position was estimated from the vertical force data extracted from the force plate. Coefficient of variation (CV) for the four different conditions was determined in a pilot study of seven healthy adults (aged 24-31years) and was <8.1% for both CoP range and velocity in the anterior-posterior and medial-lateral direction.

Timed up and go test (TUG)

The subject started from a sitting position in an arm chair (seat height approximately 43-47 cm) and were asked to rise from the chair on an “three, two, one, go” start-signal and walk three meters (marked on the floor), and walk back to the chair and sit down again. Time was recorded manually from the “go” signal and stopped when the subject again was sitting in the chair. The test was repeated three times and the best (fastest) selected for further analysis. CV was calculated in a pilot study on healthy adults (n=8), aged 24-53 years, and was 3.7%.

Handgrip strength

Isometric handgrip strength was measured using a hand dynamometer (NC70144, Procare.dk, Denmark). Each subject was instructed to perform maximal contraction force with their dominant hand (defined as their “writing hand”), in a seated upright position and the test hand pointing downwards, parallel with the trunk and unsupported. The test was repeated three times. The maximal strength of the three trials was used for further analysis. CV for handgrip strength was 2.9% in a pilot study of healthy adults (n=6) aged 17-55 years.

Cutaneous pinprick sensitivity

The pinprick test is conducted by use of eight metallic weight calibrated pins, flat contact area, diameter of 0.6 mm, with fixed stimulus intensities (weights: 0.8, 1.6, 3.2, 6.4, 12.8, 25.6 and 60.0 g, Aalborg University, Denmark). The test was conducted in a single point on the skin above the left upper trapezius muscle. Pinprick score was defined as the lightest weighted needle, which consistently elicits a sharp or pricking sensation. The average of the three pinprick scores was used in further analyses.

Computer controlled cuff pressure algometry

Pressure-induced pain cuff stimulation was induced using computerised cuff algometry (NociTech, Denmark, and Aalborg University, Denmark). Zero cm on the VAS was defined as “no pain” and 10 cm as “maximal pain”. Three different experimental setups were conducted in the following order: Pressure pain detection and tolerance thresholds, temporal summation of pain (TSP), and conditioning pain modulation (CPM).
One cuff was placed around the left lower leg at the belly of the m. gastrocnemius and inflated to a maximum pressure limit of 100 kPa. During cuff inflation, the subjects were instructed to continuously rate their pressure-induced pain intensity on the VAS, from the time at which the pressure was perceived as painful, and pressing the handheld button when the pain became intolerable, defined as the cuff Pressure Pain Tolerance Threshold (cuff PTT). If the subject did not reach their pain tolerance level before the maximum stimulation intensity, 100 kPa was used as an estimate for the cuff PTT value. The pressure pain detection threshold (cPDT) was defined as the pressure at which the VAS score exceeded 1 cm [20, s.]. Cuff stimulation was repeated three times, separated by a two-minute resting interval and the mean cuff PDT and PTT were used in further calculation.
TSP was evaluated by 10 sequential stimuli delivered at 0.5 Hz at the intensity of 75% of PTT. Pain intensity was rated continuously on the VAS during the sequential stimuli, and a total of 10 VAS scores were extracted. The test was repeated twice separated by a minimum one-minute break, and the 10 VAS score means were used in the analysis. For analysis of TSP, the mean VAS score was calculated from the first to the 4th stimulus (VAS-I) and from the 7th to the 10th stimulus (VAS-II). The TSP-effect was defined as the difference between VAS-I and VAS-II (i.e. VAS-II minus VAS-I) [21].
CPM was assessed by applying a conditioned stimulus followed by a test stimulus. The conditioning stimulation was applied through a computer-controlled cuff stimulation, where a constant pressure 30 kPa with one tourniquet cuff placed around the belly of the m. gastrocnemius on the contralateral lower leg (right side) acted as a conditioning stimulus. During the cuff test stimulus, cuff PDT and cuff PTT were reassessed. PDT was extracted and the CPM effect was calculated as the difference between the unconditioned and the conditioned test stimulus (i.e. PDTconditioned minus PDTunconditioned).

Power calculation

With a one-year change in BMD of 2% and a SD of 2%, 21 patients were desirable in each group (42 in total) with a risk of 5% for type 1 error and 10% for type 2 error. Due to potential drop outs, the number was set at 50 (25 in the active and 25 in the placebo group).
Primary outcome measures were plasma vitamin D, BMD by DXA of the lumbar spine, femoral neck, and total hip.

Statistical analyses

Results were reported as means ± standard error of the mean (SEM). Differences in baseline characteristics comparing citalopram users and controls and vitamin D treatment versus placebo treatment were tested using t-tests for independent samples, Fisher’s Exact test and Chi-Square Test for Independence as appropriate. To test for significant changes in major outcome variables (BMD and biochemistry) among groups (patients/controls) and according to treatment (vitamin D/placebo) during the 12 months follow-up period, a three-way mixed repeated-measures analysis of variance (ANOVA) (time x group x treatment) was used, controlling for both age and BMI. All post-hoc tests were adjusted for multiple comparisons (Bonferroni). Pearson’s coefficients was used to examine correlations between the 12 months difference in 25(OH)D and the major covariates (e.g. citalopram dose or MDI score). All analyses were performed using SPSS Statistics for Windows, version 24.0 (Armonk, NY: IBM Corp).


Results

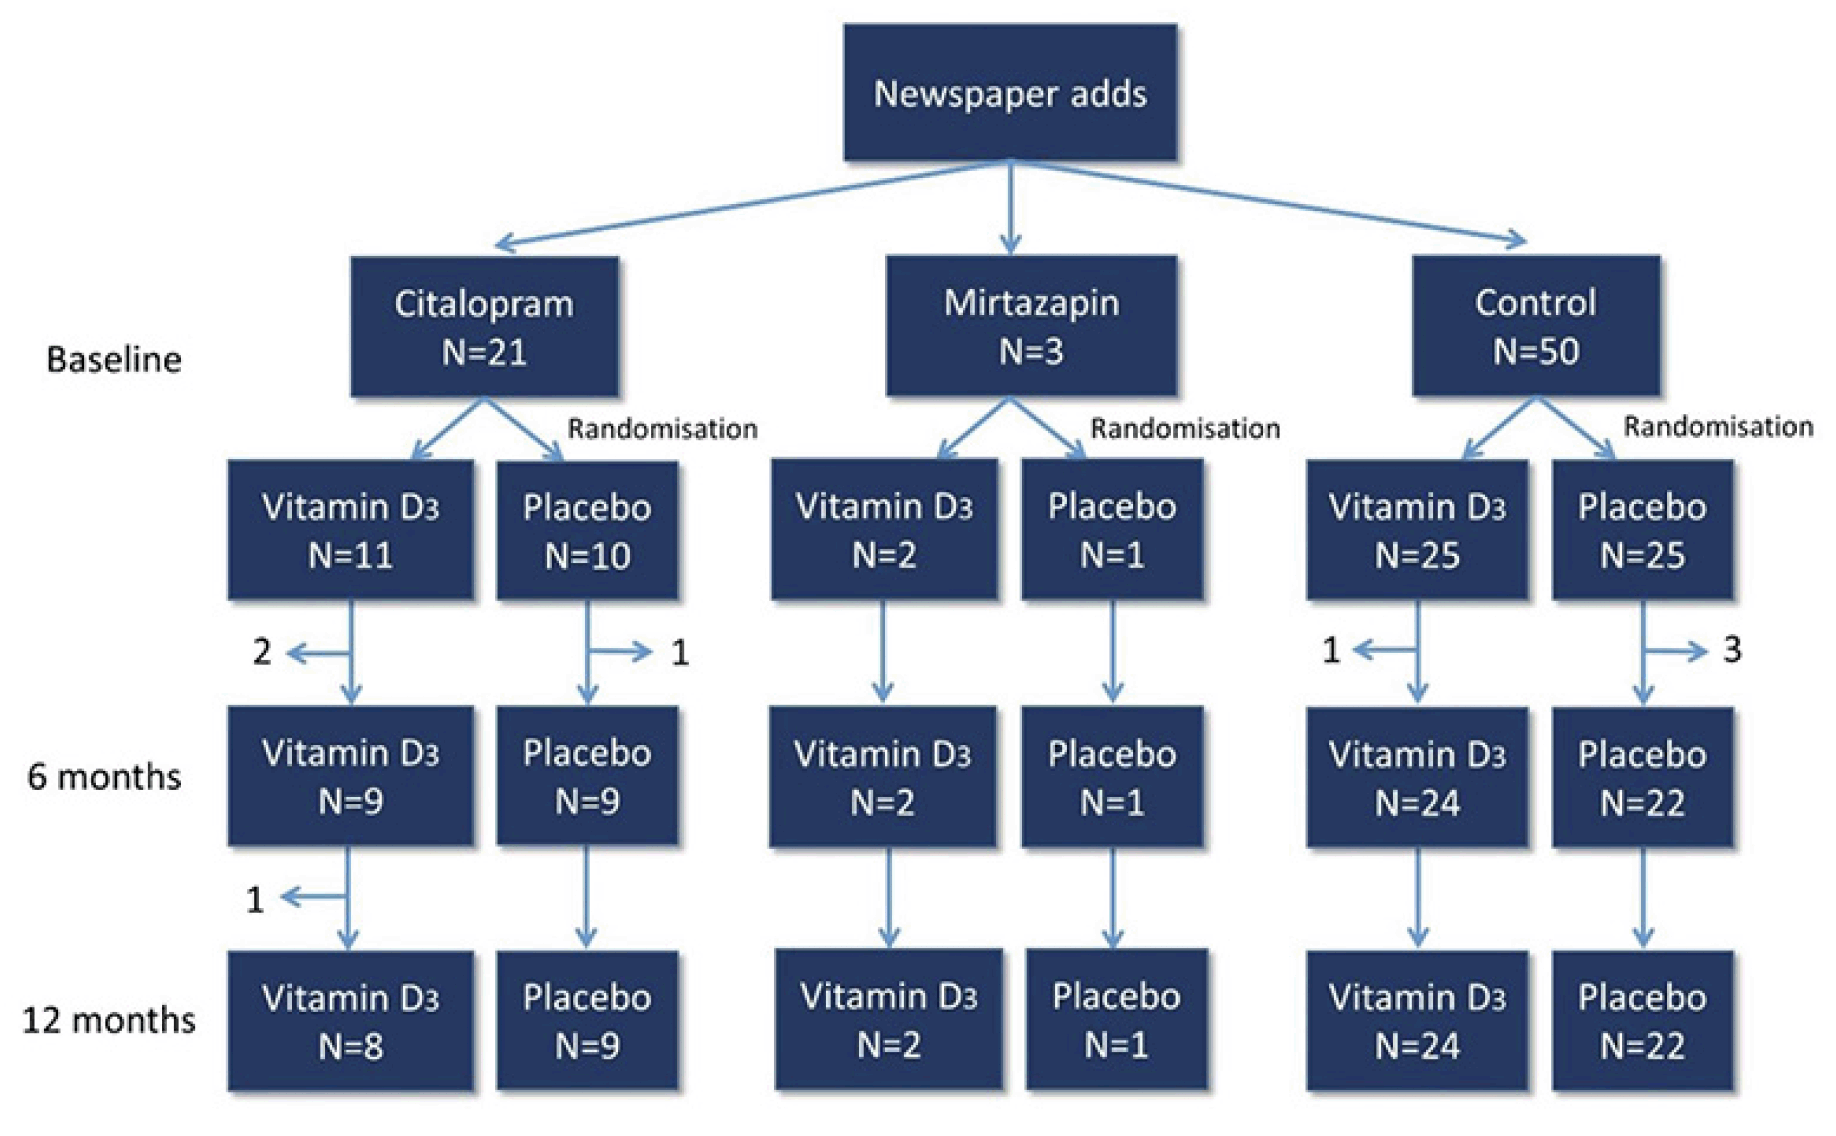
A total of 21 patients treated with citalopram and 50 controls met the inclusion criteria and completed all baseline measures (Fig. 1). No serious adverse events were recorded during the trial in neither the vitamin D, nor the placebo group.

Figure 1 Flow-chart of inclusion

Figure 1
Flow-chart of inclusion

Baseline characteristics

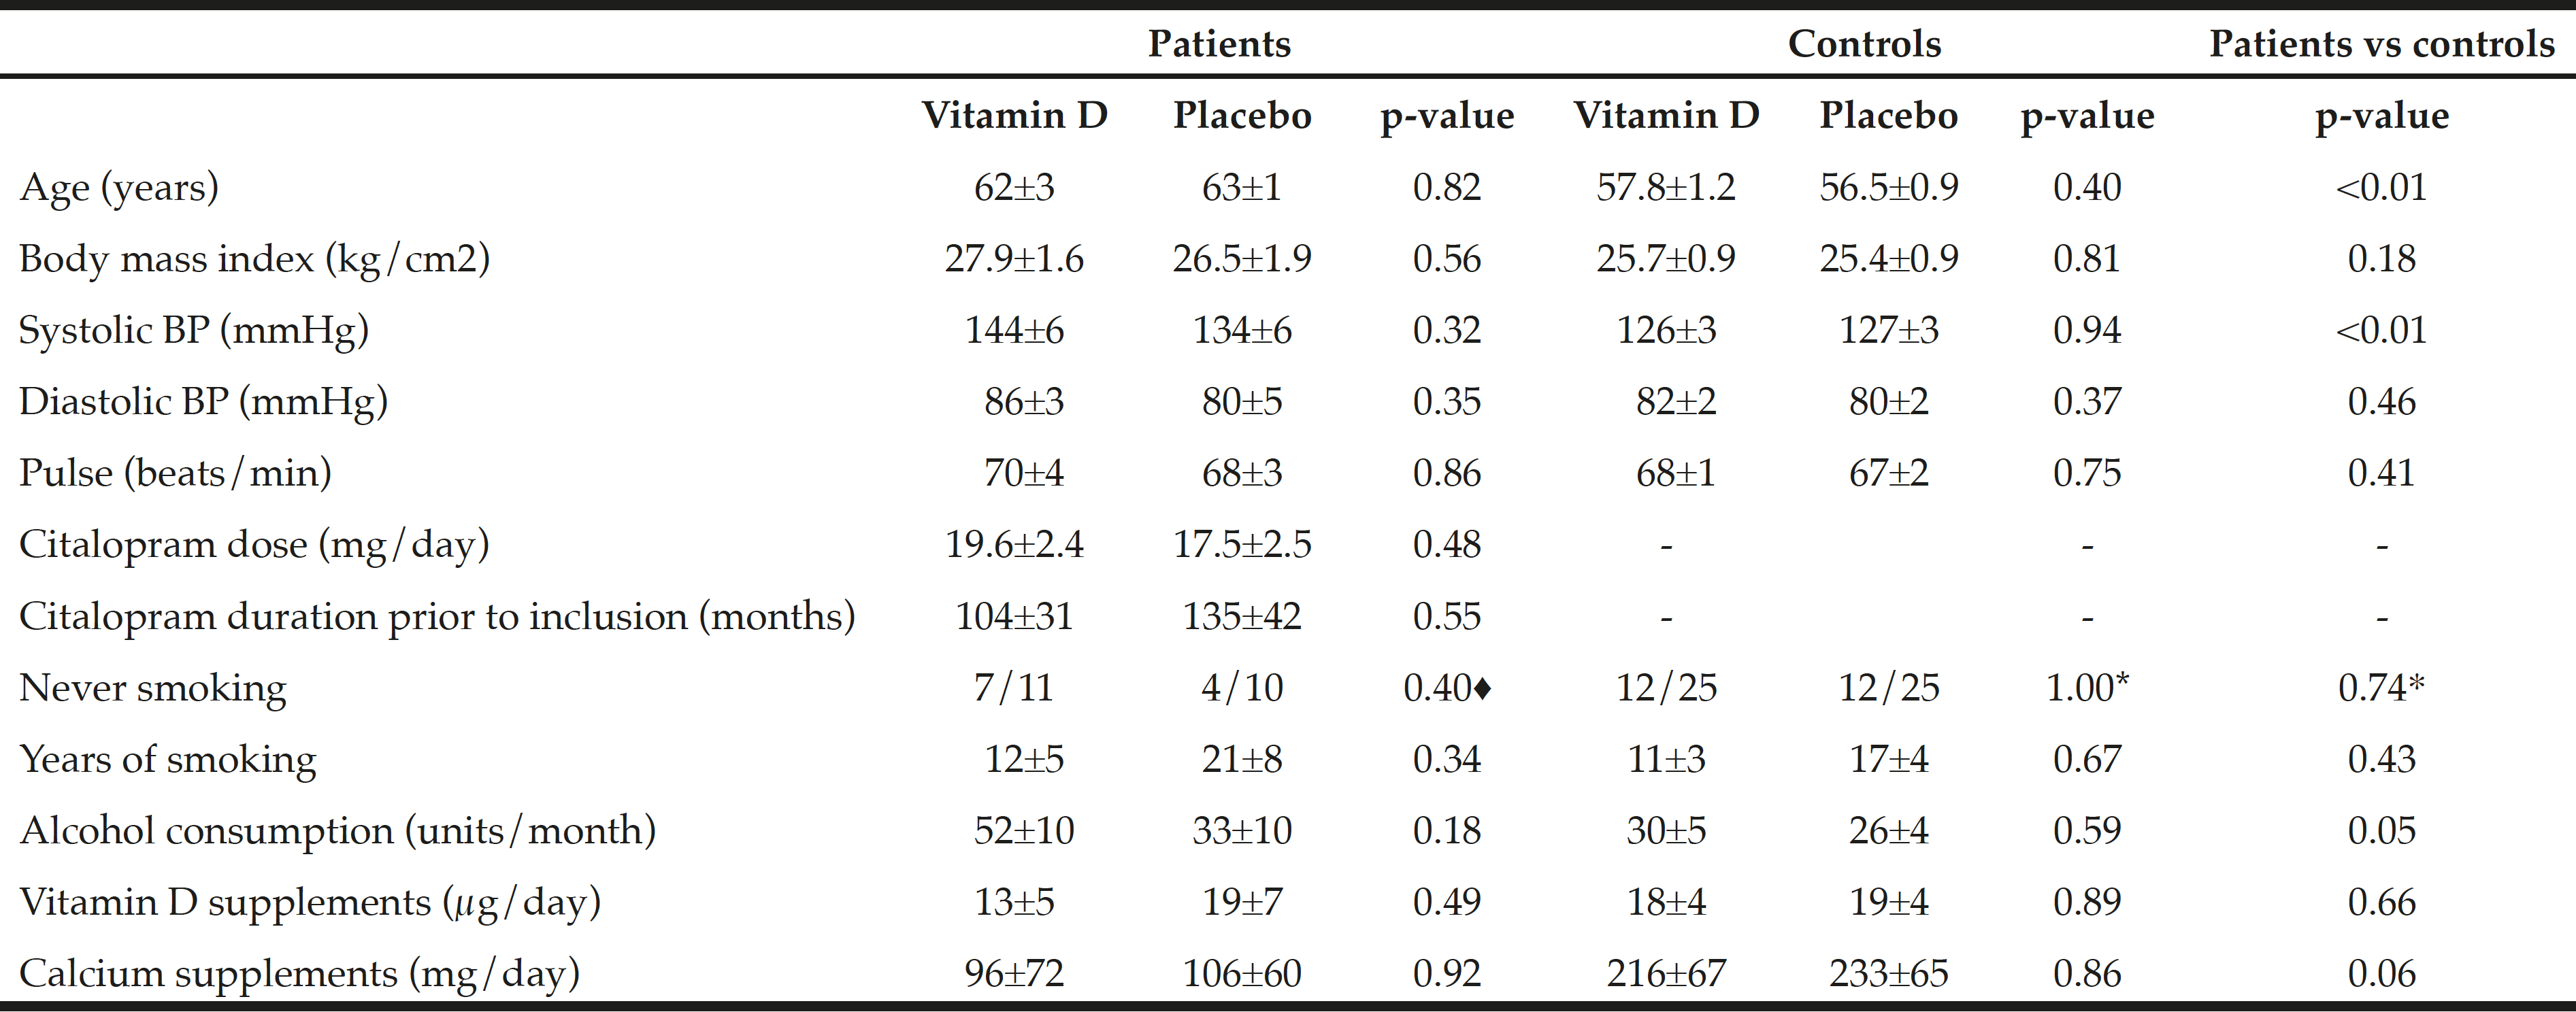
Table 1 shows baseline characteristics. Average age and systolic blood pressure was higher among patients compared to controls (62.6±1.6 versus 57.1±0.8 years, P=0.001) and (139.6±4.2 versus 126.4±2.0 mmHg, P=0.009), respectively. Moreover, alcohol consumption per month was borderline higher among patients compared to controls (43±7 versus 28±3 units/month, P=0.054). There was no difference in the amount of vitamin D or calcium supplement use at inclusion (normal daily use) at baseline within or between the groups.

Table 1 Baseline characteristics. Mean and SEM or proportion

Table 1
Baseline characteristics. Mean and SEM or proportion

♦ Fisher’s exact test, * Chi square test


Serum Vitamin D

Figure 2 shows the calcitropic hormones. Serum 25(OH)D levels increased more among the vitamin D treated than among the placebo treated for both the citalopram group and the control group. The increase in serum 25(OH)D levels was higher in the vitamin D treated citalopram users (+57.3±14.5 nmol/l) than among the controls (+36.0±4.3 nmol/l, p=0.03), Fig. 2.
A three-way mixed repeated-measures ANOVA with time (baseline, 6 and 12 months follow-up) as within-subject factors and group (patient and control) and treatment (vitamin D and placebo) as between-subject factors, adjusting for age and BMI, showed a significant main effect of treatment on serum 25(OH)D levels after 12 months: F (2, 114) 44.86, p<0.001, ηp2=0.44.
iPTH decreased more with vitamin D treatment after 12 month among the citalopram treated (change during 12 months -8.4±6.1 pg/ml with vitamin D vs. +6.6±5.5 pg/ml with placebo) than among the controls (-4.2±2.3 vs. +0.8±2.3 pg/ml, p<0.01), Fig. 2.
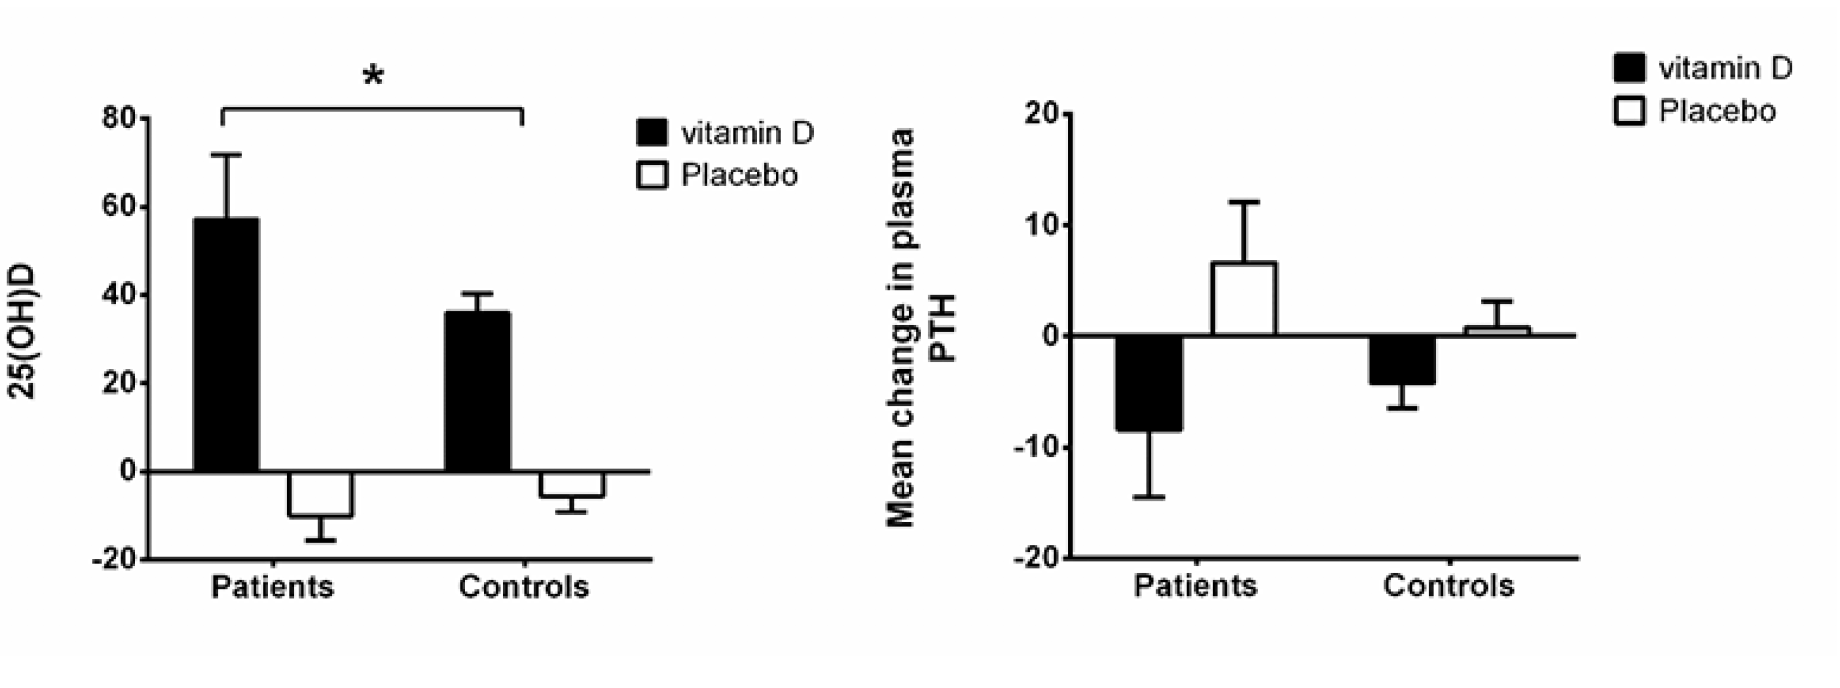
Figure 2 Absolute changes in calcitropic hormones (25-OH-vitamin D and PTH) from baseline to 12 months among citalopram treated and controls stratified by treatment group (vitamin D 50 µg or placebo)

Figure 2
Absolute changes in calcitropic hormones (25-OH-vitamin D and PTH) from baseline to 12 months among citalopram treated and controls stratified by treatment group (vitamin D 50 µg or placebo)

* p<0.05 by one-tail t-test


Measures of degree of depression

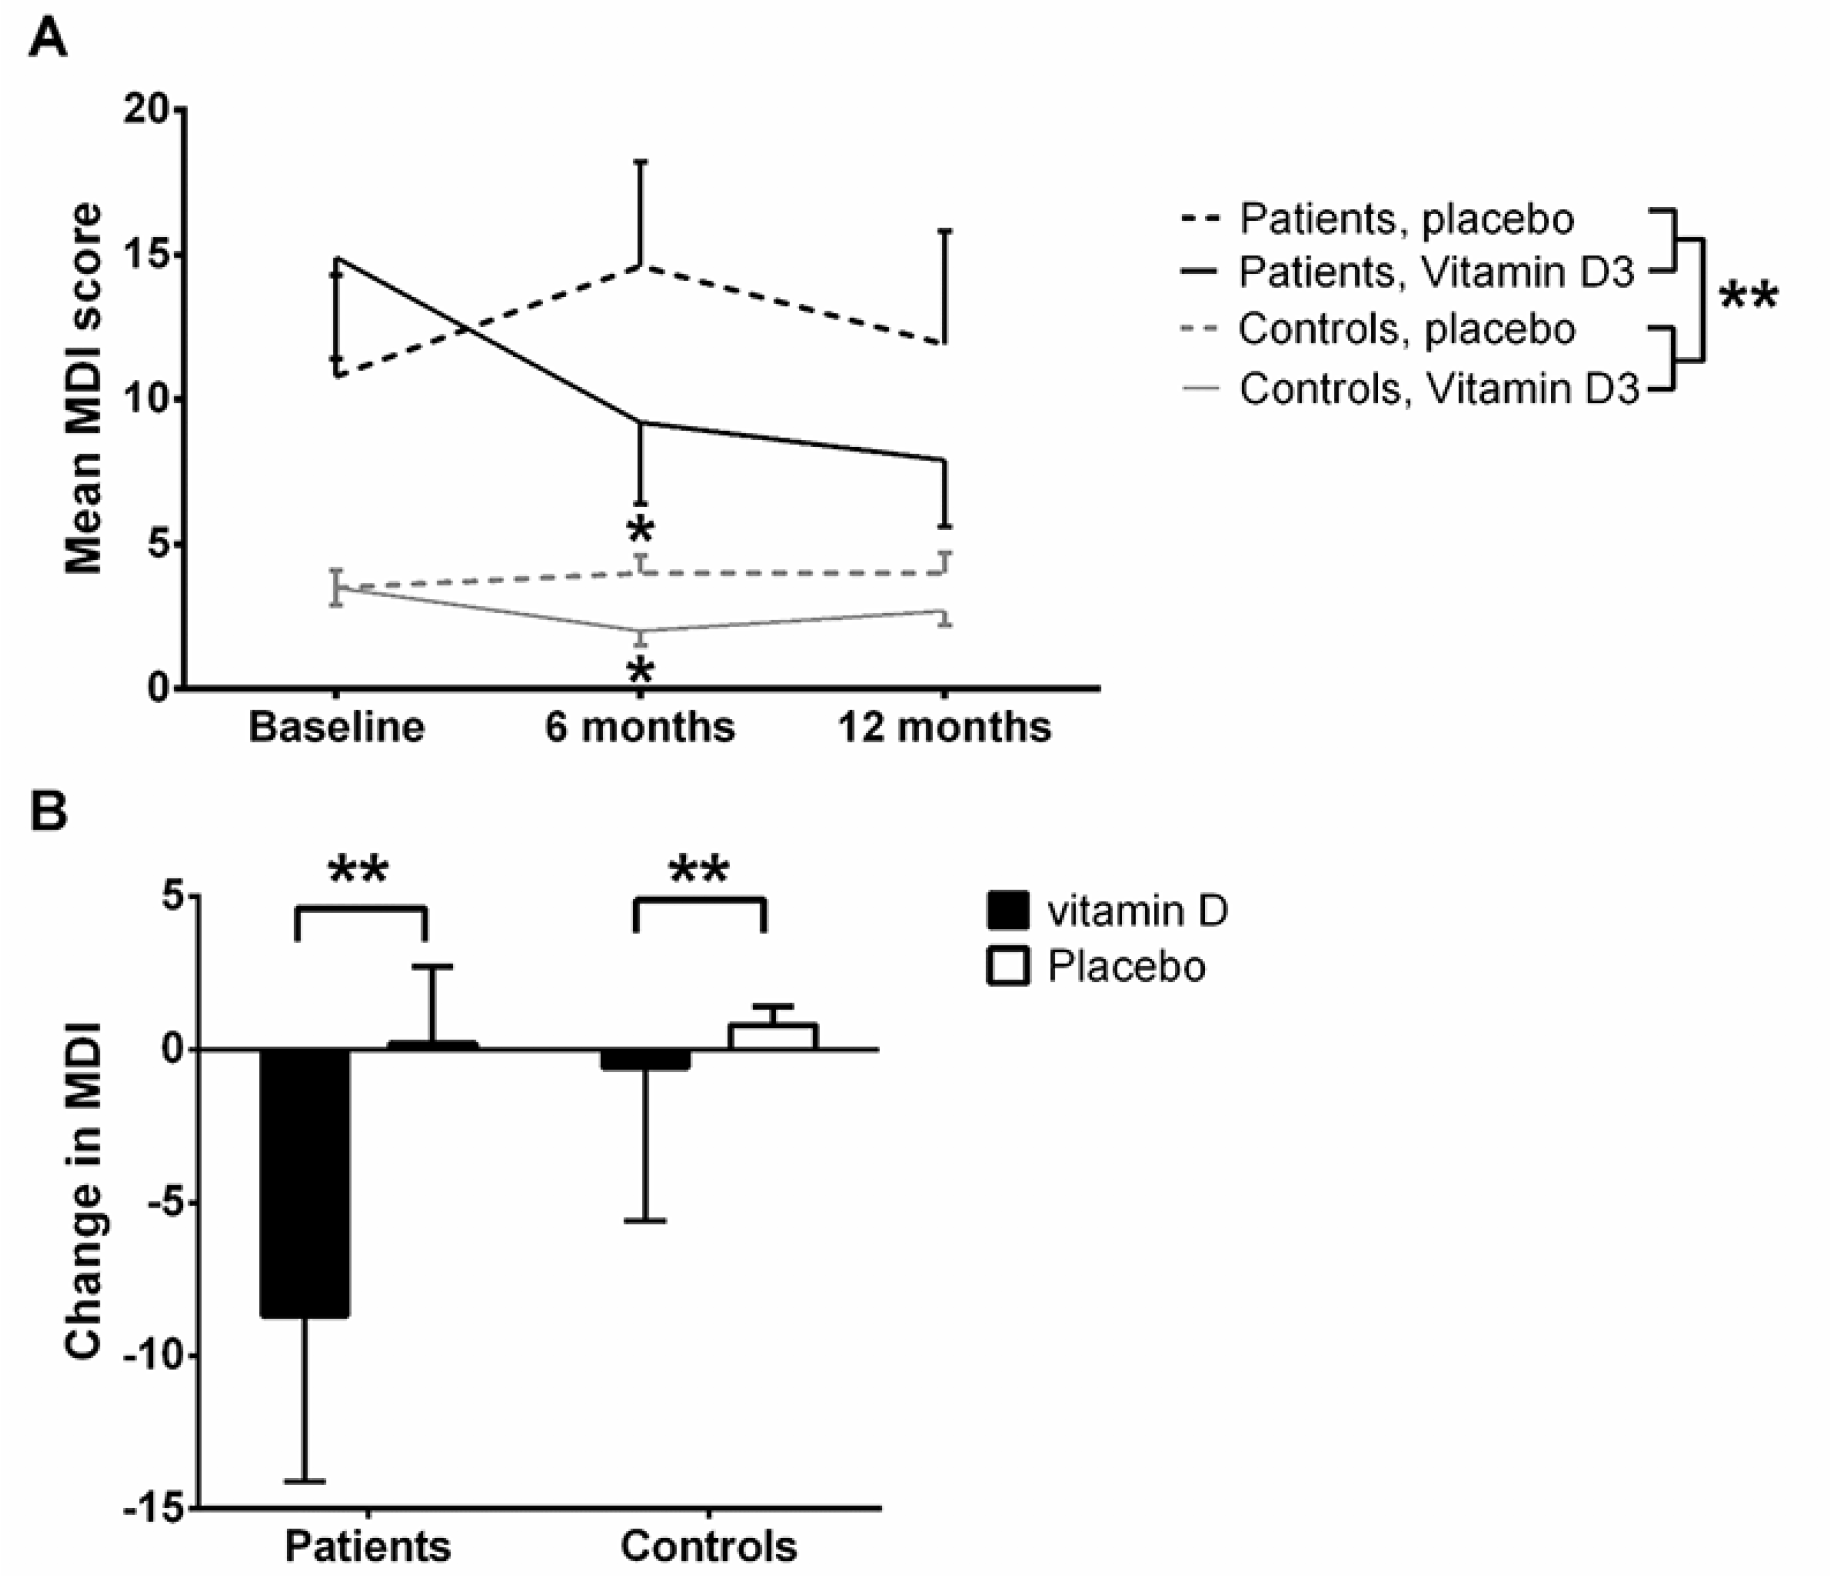
Baseline MDI total score was higher among the patients compared to the healthy controls (P<0.01, and remained different at 6 and 12 months follow-up, by ANOVA (P<0.01, Fig. 3A). Among the controls, a significant lower MDI score was rated among the vitamin D treated compared to placebo treated at six months follow-up (p=0.01 by t-test for two samples), which became non-significant again at 12 months (p=0.15 by t-test for two samples).

Figure 3 MDI score over time in patients and controls by treatment (vitamin D vs. placebo)

Figure 3
MDI score over time in patients and controls by treatment (vitamin D vs. placebo)

*P<0.05, **P<0.01; A: Absolute MDI total score over time (lower MDI total score is better self-perceived mental health). By ANOVA, no difference between vitamin D and placebo treated (p=0.39) was present, whereas a significant difference was present between patients and controls (p<0.01); B: Change in MDI depression score (delta MDI total score) from baseline to one year stratified by citalopram treated and controls randomised to vitamin D or placebo. Mean and SEM for changes.


An analysis of the changes in total MDI score over 12 month (delta MDI total score) revealed an improvement among vitamin D treated patients after 12 months as compared to placebo treated patients (mean improvement in MDI score when treated with vitamin D was -8.7±5.4 vs. a worsening with placebo of 0.2±2.5 equalling a mean difference of 8.9±2.7, p<0.01 by standard normal distribution) (Fig. 3B). A difference was also present for the controls (difference in MDI score: -0.6±0.5 vs. 0.8±0.6 equalling a mean difference of 1.4±0.3, p<0.01 by standard normal distribution – Fig. 3B). The symptoms that tended to improve were primarily the more severe, including all three core-symptoms of depression: feeling sad and sorry, lack of interest in daily activities, lack of energy, and the associated symptoms: decreased self-confidence, bad conscience, feeling restless, and to some degree that life was not worth living, difficulties concentrating, and decreased appetite (data not shown).
Overall, for patients and controls a positive correlation was present between changes in plasma 25(OH)D and changes in MDI total scores after 12 months of vitamin D treatment, with higher plasma 25(OH)D correlated to lower MDI scores (i.e. fewer depressive symptoms). This was significant among controls (Pearson’s r=0.-43, p<0.01), but not among the citalopram treated.

Handgrip strength

Fig. 4 shows that after 12 month handgrip strength was significantly higher among the patients receiving vitamin D supplement compared to the patients receiving placebo (31.1 vs. 25.2 kg, P=0.03). Among the controls, no differences were present after 6 and 12 months. There were no correlations between the improvements in MDI and handgrip strength.
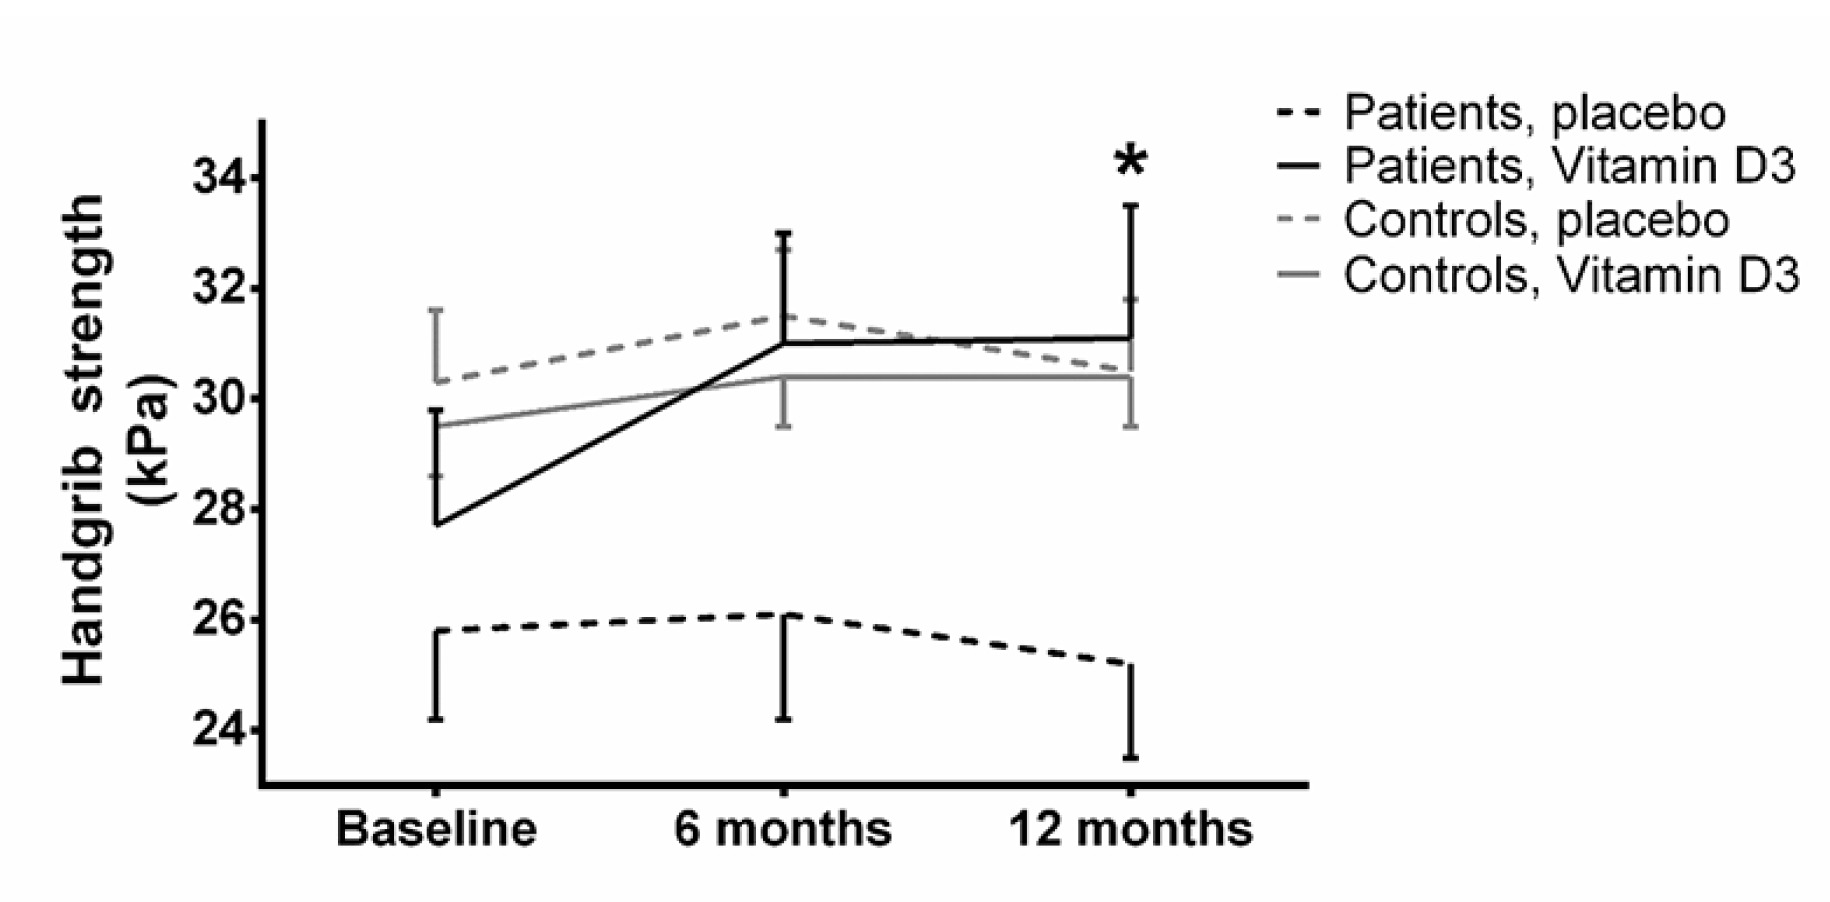
Figure 4 Handgrip strength. Values are mean and SEM. Dashed line is placebo, continuous line is vitamin D. Black line is controls, grey line are patients

Figure 4
Handgrip strength. Values are mean and SEM. Dashed line is placebo, continuous line is vitamin D. Black line is controls, grey line are patients

*: p<0.05, when comparing vitamin D with placebo treatment at 12 months


Timed Up and Go

At baseline the TUG performance was significantly inferior (i.e. longer time needed to complete the test) among the patients when compared to controls (P=0.01). After 6 and 12 months this difference became less pronounced (P=0.03 and P=0.08).

Postural control and clinical measures

The changes in parameters of postural control as well as blood pressure and pulse did not differ between vitamin D and placebo treated neither among patients with major depressive disorder on citalopram nor among the healthy controls (data not shown). Body weight and height also remained unchanged between all groups.

Pain measures

At baseline patients experienced a higher level of self-perceived pain in daily life (higher EQ-5D pain rating) compared to controls (1.75 ± 0.14 and 1.24 ± 0.06, respectively, P<0.01) with no effect over time.
No significant effect of vitamin D3 treatment was present for cuff PDT and cuff PTT (t-tests, p>0.05 and ANOVA, p>0.05 – data not shown). Baseline TSP and CPM did not differ significantly when comparing patients and controls. No significant effect from 12-months vitamin D3 vs. placebo treatment could be detected on TSP and CPM (t-tests, p>0.05 and ANOVA, p>0.05).

BMD and bone turnover markers

The changes in BMD and bone turnover markers (TRAB5b and P1NP) did not differ between vitamin D and placebo treated neither among citalopram treated patients nor among the healthy controls.


Discussion

In this study, it was demonstrated shown that vitamin D may improve depressive symptoms in patients treated with citalopram, and improve handgrip strength.

Vitamin D and depression

The improvement in delta MDI total score among the patients treated with vitamin D after 12 months, suggest a potential beneficial effect that may be used as a simple and effective supplementary treatment for depression. This is supported by results from recent studies (11). The correlation between improvements in the MDI total score and increased plasma 25(OH)D for all subjects further indicates vitamin D as a likely contributor to improvement in mental health. This is in line with a large prospective cohort study of non-depressed women aged 55 to 69 years, who observed a significantly lower mental health-related quality of life when consuming <400 IU/day [<10 µg/day] of vitamin D compared to those who consumed ≥400 IU/day (22).
The absolute decrease of around nine of 50 possible points in the individual depressive symptoms is a rather large absolute gain in well-being among the patients, and it may thus have a rather large clinical importance if confirmed in further studies. Furthermore, it is interesting, that the symptoms that tended to improve were primarily the more severe, including all three core-symptoms of depression: feeling sad and sorry, lack of interest in daily activities, lack of energy, and the associated symptoms: decreased self-confidence, bad conscience, feeling restless, and to some degree that life was not worth living, difficulties concentrating, and decreased appetite. Also among the controls, a trend of fewer depressive symptoms was seen among vitamin D treated compared to placebo.

Potential cytochrome p450 (CYP)-enzyme interaction for citalopram and vitamin D

The higher increase in serum 25(OH)D among citalopram treated patients compared to controls may be caused by an interaction between citalopram and the CYP system. Hence citalopram may occupy the CYP system preventing this from turning 25-OH Vitamin D into 24,25-OH-vitamin D, instead facilitating the formation of 1,25-OH2-Vitamin D and thus a higher biological effect mirrored in the trend towards a larger decrease in PTH. Citalopram is metabolised by the CYP2C19 system, the inactive 25,25-dihydroxy vitamin D is metabolised by the CYP24A1 enzyme, and 1,25-dihydroxy vitamin D is metabolised by the CYP27B1, while 25-hydroxy-vitamin D is metabolised from cholecalciferol by CYP27A1 [23]. Cholecalciferol may interact with CYP2C19 [24], and citalopram may thus potentially interact with cholecalciferol metabolism. Both CYP27B1 and CYP24A1 are expressed in the brain tissue suggesting that there may exist both synthesis and elimination, respectively, of vitamin D3 in the brain (25).
Voshaar et al. (26) investigated serum vitamin D levels among depressed elderly patients treated with antidepressants (n=355) compared to non-depressed control subjects (n=124). In contrast to the present study, they reported that TCA usage correlated with low 1,25-(OH)2 vitamin D3 levels, but not 25(OH)D, and neither SSRI nor newer types of antidepressants did effect any of those two compounds (26). This may be explained by possible different interactions between CYP enzymes and antidepressants during low basal 25(OH)D levels as compared to higher 25(OH)D levels induced by cholecalciferol supplements. It should be noted that baseline 25(OH)D levels was relatively higher among citalopram treated patients of the present study, than that reported in the study by Voshaar and colleagues (26).

Grip strength, effect from vitamin D supplementation

Despite the fact that patients of the present study were vitamin D replete (mean 25(OH)D ≥86 nmol/L) at baseline, an improvement in handgrip strength was found among patients receiving 2000 IU vitamin D supplement during the one year follow-up period compared to the placebo group. Actually – despite being older and thus having a priori lower hand grip strength – the patients on citalopram improved their hand grip strength to that of the controls. Currently, the effect of Vitamin D on muscle strength is controversial. A recent study report a decrease in hand grip strength in elderly vitamin D-sufficient women following vitamin D supplementation (27). However, this study (27) reports a relatively short follow up of three months whereas the present study has a longer follow up, which may suggest a dynamic in the effect of Vitamin D; vitamin D at steady state may improve muscle strength. However, short-term supplementation with no steady state may decrease muscle strength. Improved well-being from diminished depressive symptoms may potentially lead to increased physical activity and thus increased strength. However, no correlations were present in our study between improvements in MDI and handgrip strength.

Vitamin D, pain and pain sensitivity

The patients had higher levels of self-perceived pain at baseline compared to controls. Despite this, no differences were found in pain sensitivity measures between patients and controls and no changes were observed following treatment.
High clinical pain ratings and long painful durations (years) have been found associated with increased pain sensitivity and this has been documented in multiple painful conditions (28). Pain sensitivity is influenced by multiple factors and cognitive factors and pain sensitivity have been found associated in recent studies (28). Duloxetine (an antidepressant) has demonstrated analgesic effects in chronic pain patients (28) and has been suggested to target the pain inhibitory pathways (10) suggesting a link between depression and pain sensitivity. Despite this, the clinical pain ratings in the current study were low, which could explain why patients treated with anti-depressants and controls were not found different in regards to the pain sensitivity measures. The vitamin D-induced analgesic effect of antidepressants, may be an involvement of vitamin D in neuronal functioning through production and/or regulation of various monoamines including serotonin and noradrenaline (29) and neurotrophic factors with the potential to alter pain sensitivity. Serotonin and noradrenaline are mainly described to be involved in pain inhibitory pathways (30) but the current study was unable to demonstrate a significant change in pain inhibitory pathways after treatment, which might be due to the lack of impairment in the pain inhibitory pathways at baseline.

Strengths and limitations

The main advantage of the present randomized double-blinded placebo controlled study was the homogeneous group of subjects using only one type of antidepressant (citalopram), i.e. confounding from multiple drugs was avoided. Furthermore, a standardized dose of vitamin D that induced a significant increase in serum vitamin D was used, which was raised from within the normal level to the upper range of the normal level, i.e. it was possible to study the effects of high levels of vitamin D, and also at these levels no effects were seen.
The main limitation of our study was the low number of patients in the patient group and that no males were studied.


Conclusion

In conclusion, vitamin D may improve depressive symptoms in patients treated with citalopram, and potentially improve handgrip strength. However, further research on larger cohorts is needed to clarify the clinical implications.


Funding: Peter Vestergaard reports grants from The Obel Family Foundation (#25243), grants from The AP Møller and Chastine Maersk Mc. Kinny Møller Foundation (#01) during the conduct of the study; Thomas Graven-Nielsen and Kristian Kjær Petersen reports grants from The Danish National Research Foundation (#DNRF121), during the conduct of the study. The sponsors had no role in the design and conduct of the study; in the collection, analysis, and interpretation of data; in the preparation of the manuscript; or in the review or approval of the manuscript. Stine Aistrup Eriksen, Jakob Starup-Linde and Rogerio Pessoto Hirata has nothing to disclose. Therefore all authors: Stine Aistrup Eriksen, Jakob Starup-Linde, Rogerio Pessoto Hirata, Kristian Kjær Petersen, Thomas Graven-Nielsen and Peter Vestergaard report no conflicts of interests.

Acknowledgements: The Obel Family Foundation and the AP Møller and Chastine Maersk Mc. Kinny Møller Foundation are acknowledged for providing financial support. Center for Neuroplasticity and Pain (CNAP) is supported by the Danish National Research Foundation. The management and staff at Center for Clinical and Basic Research (CCBR) Aalborg, are acknowledged for providing optimal clinical facilities and professional execution of clinical measures (DXA and blood sampling), as well as continuous support and guidance in good clinical practice.

Conflict of interest: No conflicts of interests.

Ethical standard: The study followed the Helsinki declaration and all participants gave informed written consent.


References

1.    H. A. Bischoff-Ferrari m.fl., “Effect of Vitamin D on falls: a meta-analysis”, JAMA, bd. 291, nr. 16, s. 1999–2006, apr. 2004.
2.    L. Ceglia og S. S. Harris, “Vitamin D and its role in skeletal muscle”, Calcif. Tissue Int., bd. 92, nr. 2, s. 151–162, feb. 2013.
3.    C. Annweiler, A. M. Schott, G. Berrut, B. Fantino, og O. Beauchet, “Vitamin D-related changes in physical performance: a systematic review”, J Nutr Health Aging, bd. 13, nr. 10, s. 893–898, dec. 2009.
4.    S. W. Muir og M. Montero-Odasso, “Effect of vitamin D supplementation on muscle strength, gait and balance in older adults: a systematic review and meta-analysis”, J Am Geriatr Soc, bd. 59, nr. 12, s. 2291–2300, dec. 2011.
5.    B. Stubbs, L. Eggermont, S. Patchay, og P. Schofield, “Older adults with chronic musculoskeletal pain are at increased risk of recurrent falls and the brief pain inventory could help identify those most at risk”, Geriatr Gerontol Int, bd. 15, nr. 7, s. 881–888, jul. 2015.
6.    A. Fekadu, L. J. Rane, S. C. Wooderson, K. Markopoulou, L. Poon, og A. J. Cleare, “Prediction of longer-term outcome of treatment-resistant depression in tertiary care.”, The British journal of psychiatry : the journal of mental science, bd. 201, s. 369–75, nov. 2012.
7.    R. E. S. Anglin, Z. Samaan, S. D. Walter, og S. D. McDonald, “Vitamin D deficiency and depression in adults: systematic review and meta-analysis.”, The British journal of psychiatry : the journal of mental science, bd. 202, nr. 2, s. 100–7, feb. 2013.
8.    E. W. de Heer m.fl., “The association of depression and anxiety with pain: a study from NESDA”, PLoS ONE, bd. 9, nr. 10, s. e106907, 2014.
9.    J. F. Karp, J. Scott, P. Houck, C. F. Reynolds, D. J. Kupfer, og E. Frank, “Pain predicts longer time to remission during treatment of recurrent depression”, J Clin Psychiatry, bd. 66, nr. 5, s. 591–597, maj 2005.
10.    D. Yarnitsky, M. Granot, H. Nahman-Averbuch, M. Khamaisi, og Y. Granovsky, “Conditioned pain modulation predicts duloxetine efficacy in painful diabetic neuropathy”, Pain, bd. 153, nr. 6, s. 1193–1198, jun. 2012.
11.    J. Sarris m.fl., “Adjunctive Nutraceuticals for Depression: A Systematic Review and Meta-Analyses”, American Journal of Psychiatry, bd. 173, nr. 6, s. 575–587, jun. 2016.
12.    E. Garcion, N. Wion-Barbot, C. N. Montero-Menei, F. Berger, og D. Wion, “New clues about vitamin D functions in the nervous system.”, Trends in endocrinology and metabolism: TEM, bd. 13, nr. 3, s. 100–5, apr. 2002.
13.    R. von Känel, V. Müller-Hartmannsgruber, G. Kokinogenis, og N. Egloff, “Vitamin D and central hypersensitivity in patients with chronic pain”, Pain Med, bd. 15, nr. 9, s. 1609–1618, sep. 2014.
14.    M. Gaikwad, S. Vanlint, M. Mittinity, G. L. Moseley, og N. Stocks, “Does vitamin D supplementation alleviate chronic nonspecific musculoskeletal pain? A systematic review and meta-analysis”, Clin. Rheumatol., bd. 36, nr. 5, s. 1201–1208, maj 2017.
15.    Z. Wu, Z. Malihi, A. W. Stewart, C. M. Lawes, og R. Scragg, “Effect of Vitamin D Supplementation on Pain: A Systematic Review and Meta-analysis”, Pain Physician, bd. 19, nr. 7, s. 415–427, okt. 2016.
16.    S. Schwan og P. Hallberg, “SSRIs, bone mineral density, and risk of fractures–a review”, Eur Neuropsychopharmacol, bd. 19, nr. 10, s. 683–692, okt. 2009.
17.    P. Vestergaard, D. Prieto-Alhambra, M. K. Javaid, og C. Cooper, “Fractures in users of antidepressants and anxiolytics and sedatives: effects of age and dose”, Osteoporos Int, bd. 24, nr. 2, s. 671–680, feb. 2013.
18.    L. R. Olsen, D. V. Jensen, V. Noerholm, K. Martiny, og P. Bech, “The internal and external validity of the Major Depression Inventory in measuring severity of depressive states”, Psychol Med, bd. 33, nr. 2, s. 351–356, feb. 2003.
19.    S. J. Coons, S. Rao, D. L. Keininger, og R. D. Hays, “A comparative review of generic quality-of-life instruments”, Pharmacoeconomics, bd. 17, nr. 1, s. 13–35, jan. 2000.
20.    T. Graven-Nielsen, H. B. Vaegter, S. Finocchietti, G. Handberg, og L. Arendt-Nielsen, “Assessment of musculoskeletal pain sensitivity and temporal summation by cuff pressure algometry: a reliability study”, Pain, bd. 156, nr. 11, s. 2193–2202, nov. 2015.
21.    K. K. Petersen, T. Graven-Nielsen, O. Simonsen, M. B. Laursen, og L. Arendt-Nielsen, “Preoperative pain mechanisms assessed by cuff algometry are associated with chronic postoperative pain relief after total knee replacement”, Pain, bd. 157, nr. 7, s. 1400–1406, jul. 2016.
22.    S. Motsinger, D. Lazovich, R. F. MacLehose, C. J. Torkelson, og K. Robien, “Vitamin D intake and mental health-related quality of life in older women: the Iowa Women’s Health Study”, Maturitas, bd. 71, nr. 3, s. 267–273, mar. 2012.
23.    D. E. Prosser og G. Jones, “Enzymes involved in the activation and inactivation of vitamin D”, Trends Biochem. Sci., bd. 29, nr. 12, s. 664–673, dec. 2004.
24.    H. Yamazaki og T. Shimada, “Effects of arachidonic acid, prostaglandins, retinol, retinoic acid and cholecalciferol on xenobiotic oxidations catalysed by human cytochrome P450 enzymes”, Xenobiotica, bd. 29, nr. 3, s. 231–241, mar. 1999.
25.    L. R. Harms, T. H. J. Burne, D. W. Eyles, og J. J. McGrath, “Vitamin D and the brain”, Best Pract. Res. Clin. Endocrinol. Metab., bd. 25, nr. 4, s. 657–669, aug. 2011.
26.    R. C. Oude Voshaar, W. J. Derks, H. C. Comijs, R. A. Schoevers, M. H. de Borst, og R. M. Marijnissen, “Antidepressants differentially related to 1,25-(OH)₂ vitamin D₃ and 25-(OH) vitamin D₃ in late-life depression”, Transl Psychiatry, bd. 4, s. e383, apr. 2014.
27.    L. S. Bislev, L. Langagergaard Rødbro, L. Rolighed, T. Sikjaer, og L. Rejnmark, “Effects of Vitamin D3 Supplementation on Muscle Strength, Mass, and Physical Performance in Women with Vitamin D Insufficiency: A Randomized Placebo-Controlled Trial”, Calcif. Tissue Int., jun. 2018.
28.    L. Arendt-Nielsen m.fl., “Assessment and manifestation of central sensitisation across different chronic pain conditions”, Eur J Pain, bd. 22, nr. 2, s. 216–241, 2018.
29.    E. A. Shipton og E. E. Shipton, “Vitamin D and Pain: Vitamin D and Its Role in the Aetiology and Maintenance of Chronic Pain States and Associated Comorbidities”, Pain Res Treat, bd. 2015, s. 904967, 2015.
30.    K. Bannister og A. H. Dickenson, “What the brain tells the spinal cord”, Pain, bd. 157, nr. 10, s. 2148–2151, 2016.

ASSOCIATION BETWEEN ANEMIA, PHYSICAL PERFORMANCE, DEPENDENCY, AND MORTALITY IN OLDER ADULTS IN THE NORTH-WEST REGION OF RUSSIA


A. Turusheva1, E. Frolova2, E. Korystina2, D. Zelenukha2, P. Tadjibaev2, N. Gurina2, J.M. Degryse1,3


1. Institut de Recherche Santé et Société Université Catolique de Louvain, Brussels, Belgium; 2. The North-Western State Medical University named after I.I. Mechnikov, St. Petersburg, Russia; 3. Department of Public Health and Primary Health Care, KULeuven, Leuven, Belgium

Corresponding Author: J.M. Degryse, Institut de Recherche Santé et Société Université Catolique de Louvain, Brussels, Belgium, jean-marie.degryse@uclouvain.be


Abstract

Abstract: Objective: To assess the prevalence of anemia and its impact on physical performance, dependency, and mortality in older adults in the north-west region of Russia.

http://pharmacyincanada-onlineon.com/ \ buy cialis online \ generic viagra \ buy viagra \ generic viagra online \ cialis tadalafil \ buying viagra online \ buy generic cialis \ http://pharmacycanadian-onlinein.com/ \ buy online cialis

Design: A population-based prospective cohort study. Setting: A random sample of the population living in the Kolpino District. Participants: A total of 611 community-dwelling individuals aged 65 years and older. Measurements: Hemoglobin, gender, age, comorbidity, creatinine, C-reactive protein, body mass index, the Mini Nutritional Assessment, the Short Physical Performance Battery, grip strength, the Barthel Index, the Mini-Mental State Examination, and the 15-item Geriatric Depression Scale were measured/administered. A second screening was organized after 33.4±3 months. The total observation time was 47 ± 14.6 months. Results: The prevalence of anemia was higher in men (21.4%) than in women (18.6%). After adjustment for age, gender, nutritional status, creatinine levels, mental impairment, and various comorbid conditions, significant associations were found between anemia and dependency [OR(95% СI) = 1.798 (1.068 – 3.029); p = 0.027], lower physical performance [ β(95%CI) = -0.717 (-1,334 – -0.100); p = 0.023], and greater risk of mortality [HR (95%CI) = 1.871 (1.284 – -2.728); p = 0.001]. Participants with anemia and CRP levels > 5 had a higher risk of mortality compared with anemic participants with lower CRP levels [HR (95%CI) = 3.417 (1.869 – 6.245); p = 0.000]. Conclusion: The estimated prevalence of anemia in the population aged 65 years and older is 19.3% (95%CI = 15.99 – 23.13). Anemia is associated with poor physical performance and dependency and is an independent predictor of mortality in older individuals.

Key words: Anemia, physical performance, dependency, risk mortality, older people.

Abbreviations: BMI: Body mass index; CI: Confidence interval; COPD: Chronic obstructive pulmonary disease; CRP: C-reactive protein; CVD: Cardiovascular disease; GDS15: 15-item Geriartirc Depression Scale; Hb: Hemoglobin; IQR: Interquartile range; HR: Hazard ratio; MCH: Mean corpuscular hemoglobin; MCV; Mean corpuscular volume; MMSE: Mini Mental State Examination; MNA: Mini Nutritional Assessment; OR: odds ratio; SPPB: Short Physical Performance Battery; T0:Date of the first screening; T1:Date of the second screening; T2 The last update of mortality data; WHO: World Health Organisation; USA: United States of America.


Introduction

The world population is aging rapidly. Since 1980, the number of people aged 60 y and over has doubled to approximately 810 million. The elderly population will continue to grow to approximately 2 billion in 2050. It has been predicted that 22% of the total population will be older than 60 y and 4.4% will be older than 80 y in 2050 (1). Unavoidably, this so-called ‘gray epidemic’ will lead to higher burdens of chronic disease, functional decline and disability in many countries challenging health-care and social security programs.

The improved life expectancy in many countries is related to the impressive decrease in mortality from cardiovascular diseases. In contrast to other countries, despite the increase in life expectancy, Russia has higher cardiovascular morbidity (2) and mortality (2) rates and a shorter average life expectancy than those found in Europe and the USA. According to the Federal State Statistics Service of Russia, the average life expectancy in Russia in 2012 was 63.8 years for men and 75.5 years for women (3). According to data from the Ministry of Health of the Russian Federation, the general mortality rate in 2012 was 1,431 per 100,000 people. The mortality rate from cardiovascular diseases was 811.7 per 100,000 people, which is twice the rate found in the European Union (EU) (approximately 400 per 100,000) (4, 5).

All of these statistics suggest the importance of evaluating people older than 65 years of age in Russia compared with other developed European countries. In a previous report based on the ‘‘Crystal’’ study, it was shown that almost all of the participants had cardiovascular diseases, but none received statins; only some of the participants received antihypertensive drugs and acetylsalicylic acid (6, 7). Therefore, the growing population of older individuals who are survivors of cardiovascular mortality without receiving necessary medical and surgical treatment is, from a scientific perspective, a very interesting group for different studies and comparison with other populations. The World Health Organization (WHO) definition of anemia is a hemoglobin concentration <130 g/L in men and <120 g/L in women. Numerous studies on the prevalence of anemia in the elderly have been published, but the prevalence of anemia is different in each of these studies and is dependent on the type of populations studied, the sample sizes, and the methodologies used. According to WHO data during 1993-2005, the number of individuals suffering from anemia world-wide was 1.62 billion (95% confidence interval [CI]: 1.50 – 1.74 billion), which corresponds to 24.8% of the population (95% CI: 22.9% – 26.7%) (8).

Multiple studies have demonstrated that anemia is an independent risk factor for increased morbidity and mortality, decreased quality of life, depression, dementia, delirium (in hospitalized patients), immune dysfunction, cardiovascular disease, cerebral thrombosis, and decreased bone density (and, consequently, fractures). Anemia has also been associated with a progressive decline in physical performance over time, an increased susceptibility to falling, and frailty in community-dwelling older individuals (9-15).

National data on the prevalence and causes of anemia in the older population in Russia are unavailable (3). Additionally, neither the prevalence , neither die association with adverse outcomes of mild anemia has ever been studied in the older Russian population.

The aim of our study was to assess the prevalence of anemia in general and mild anemia in particular and its impact on physical performance, dependency, and mortality in older adults in the north-west region of Russia, a specific population with a high burden of CVD.

Methods

The Crystal study is a prospective cohort study of community-dwelling individuals aged 65 years and older living in the Kolpino District of St. Petersburg. A primary care clinic (Policlinic no. 95) serves a population of 58,000 inhabitants based on a territorial concept of administration. Of that population, 10,986 are aged 65 years and older. A random sample of 914 individuals was selected, but 303 people refused to participate before the start of the study. No one was excluded based on health or cognitive function. Selected individuals were invited to participate by telephone. Some people who were unable to come to the Policlinic were examined at home. The local ethics committee of the Medical Academy for Postgraduate Studies approved the study, and informed consent was obtained from all respondents. All data were collected from March to December 2009 (T0). The details regarding sampling and data collection were described in previous publications (6, 7).

A second screening (T1) was performed an average of 33.4±3 months after the date of the first screening. All patients who survived and consented underwent the same examination that was performed in the first screening.

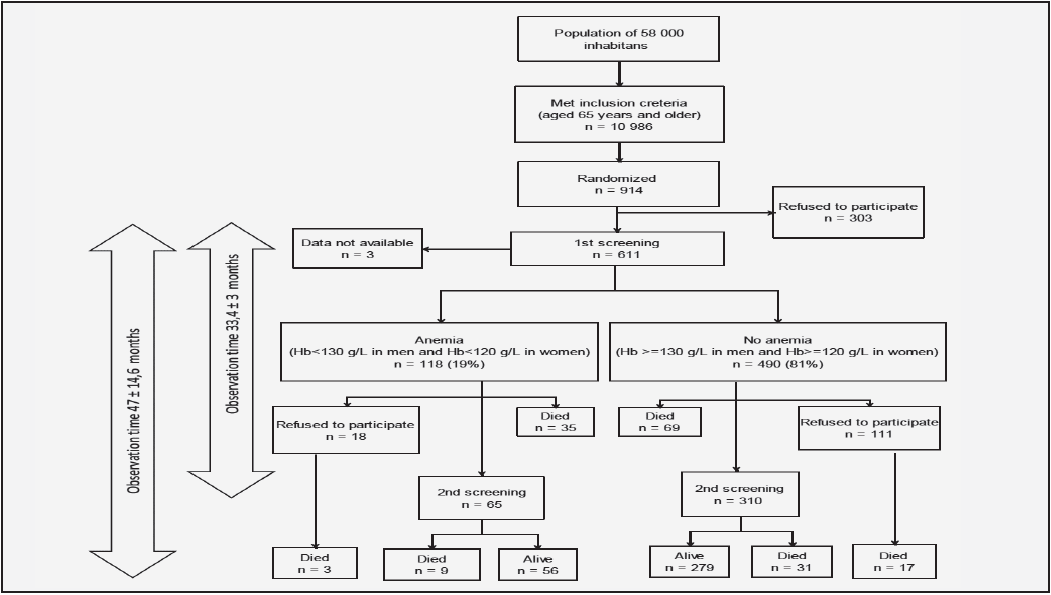
The average total observation period of the study was 47 ± 14.6 months (Figure 1).

Figure 1 Flowchart detailing the data available for survival analysis and the data available for physical and mental decline analysis from the Crystal cohort


Main study parameters

Hemoglobin was determined using the cyanide-free hemoglobinometry method on the Abbott Cell-Dyn 3700 hematology analyzer. The following normal reference ranges for hemoglobin (venous blood) were used: 130–170 g/L for men and 120–150 g/L for women. All patients with anemia were divided into three groups: mild anemia was defined as a hemoglobin level of 100–119 g/L in women and 100–129 g/L in men, moderate anemia as a level of 80–109 g/L in both genders, and severe anemia as a level lower than 80 g/L in both genders.

Outcome measures

Mortality data were obtained from the official dataset of Policlinic no. 95. The last update was made in February 2014 (T2).

Physical performance

The Short Physical Performance Battery (SPPB) consists of timed measures of the following activities: quickly walking, rising from a chair, putting on and taking off a cardigan, and maintaining balance in a tandem stand (15). The activities were timed by specially trained clinical research assistants who were blinded to the laboratory results of the participants. Categories were created for each set of performance measures to allow for analysis of data from participants who were unable to perform a given task. For the walking, chair-stand, and cardigan tests, those who could not complete the tasks were assigned a score of 0. Those who completed the tasks were assigned a score between 1 and 4 based on the gender- and age-specific quartiles of the distribution of speed of all participants. A score of 4 corresponded to the highest (fastest) quartile. For the tandem-stand balance test, a score of 0 was assigned to those who were either unable to perform the test or who could only maintain the tandem stand for less than 3 seconds. Those who could maintain a tandem stand for longer than 3 seconds but less than 10 seconds were assigned a score of 1; those who could maintain a tandem stand for 10 seconds or more were assigned a score of 2. A summary performance scale (ranging from 0–14) was created by summing the scores from the individual tests (15-16).

The grip strength test was used to measure the maximum isometric strength of the hand and forearm muscles. The test was conducted using a carpal dynamometer (DK-50, Nizhni Tagil, Russian Federation). The maximum reading (kg) from three attempts for each hand was recorded separately, and the average of the left and right scores was calculated and used for further analysis. The cutoff value used to indicate poor strength was the lowest gender-specific quartile value (17).

Dependency

The Barthel Index of activities of daily living was used to determine the baseline level of functioning and, consequently, the degree of dependence. The cutoff for dependency was defined as a score of less than 95 (18).

Mental status

The 15-item Geriatric Depression Scale (GDS-15) was used to screen for depressive symptoms. A person with a total score greater than 5 is considered to be at risk for depression (19-20).

The Mini-Mental State Examination (MMSE) was used to determine cognitive impairment. The cutoff value for cognitive ability is 24, but it is also useful to study the degree of impairment. Therefore, participants were classified into four categories (25–30, normal mental status; 21–24, mild cognitive impairment; 10–20, moderate cognitive impairment; and 0–9, severe cognitive impairment) (21).

Mental and physical decline

Relevant declines in the MMSE, SPBB, and average grip strength scores from both hands were determined using the Edwards-Nunnally index (22). This index is used to determine the probability of a substantial individual change and avoids the problem of regression to the mean. Based on the scale reliability and the 95% CI of the mean score at T0, the index is used to assess whether a significant change has occurred between T0 and T1. Subjects who shifted from GDS-15<5 at baseline to GDS-15≥5 at T1 were defined as having a significant worsening in depression status. New incident occurrences of dependency were defined as shifts in Barthel index scores to less than 95.

Physical decline was considered to be present when a study participant showed a significant decline in the score of at least one of the three tests (the Barthel Index of activities of daily living, the SPBB, and average grip strength of both hands). Mental decline was considered to be present when a participant presented a decline in the score of at least one of the two tests (the MMSE or GDS test).

Covariates

Nutritional status

Nutritional status was evaluated using the Mini Nutritional Assessment (MNA) questionnaire and body mass index (BMI) (23, 24). Weight was measured using either a stationary calibrated medical scale at the Policlinic or a calibrated bathroom scale at home. The cutoff value used in the analysis of BMI was 23 kg/m2. A MNA score between 17.0 and 23.5 was interpreted as indicating a risk for malnutrition, and a score less than 17.0 was considered an indicator of frank malnutrition.

Comorbidity

Details of past and current medical problems were collected based on anamnesis or information presented in the medical records. Information on angina pectoris, myocardial infarction, arrhythmias, peripheral artery disease, stroke, obstructive pulmonary disease or asthma, diabetes mellitus, cancer, osteoarthritis, and rheumatoid arthritis was systematically documented. A disease count was used as an index of comorbidity.

Laboratory tests

Laboratory tests included measures of creatinine and C-reactive protein (CRP) levels. Creatinine was determined by the Jaffe reaction method using the Roche Hitachi 912 chemistry analyzer. CRP was determined by the immunoturbidimetric method using the Roche Hitachi 912 chemistry analyzer. The following normal reference ranges for each laboratory test were used: hemoglobin (venous blood), 130 -170 g/L for men and 120 – 150 g/L for women; creatinine, 53 -106 mmol/L for men and 44 -88mmol/L for women; CRP, 0 – 5 mg/L for both sexes.

Statistical analyses

All statistical calculations were performed using the SPSS 20.0 (SPSS Inc., Chicago, IL, USA) and MedCalc 11.5.00 (Medcalc Software, Oostende) software. Desciptive statistics are presented as the mean ± standard deviation (SD) or median with inter-quartile range [IQR]. Differences between participants with and without anemia at baseline were compared using Student’s t test and the Mann–Whitney U test (for continuous variables) or chi-square test (for categorical variables). To assess the correlation of anemia with physical performance at baseline taking into account the influence of gender, nutritional status, and comorbidity, we used linear regression models. In the first model, we estimated the association of age and gender with the SPPB scores used as a dependent variable. The second model included the same variables as the first model, but we added creatinine and the assessment of nutritional status. In the third model, we added adjustments for the MMSE score and co-morbidities. The fourth model included additional adjustment for high CRP levels. To assess the association of anemia with the Barthel Index (<95), we used multiple logistic regression with models similar to those used for the Physical Performance Battery. Variables were first checked for multicollinearity.

Kaplan-Meier curves were used to visualize the survival analysis, and significance was evaluated using the log-rank test. We used Cox proportional hazard models to investigate the association between prevalent anemia at baseline and mortality with adjustments for the same models as those used to estimate physical function and dependency in basic activities of daily living.

Results

The prevalence of anemia

Blood samples from 608 subjects were available for analysis at baseline (fig 1). Thirty-seven men and 81 women met the criteria for anemia, which corresponded to 19.3% (95%CI = 15.99–23.13) of the population aged 65 years and older. A total of 113 (96%) participants had mild anemia, 4 (3%) had moderate anemia, and 1 (1%) had severe anemia. The prevalences of anemia among men and women were 21.4% and 18.6%, respectively, but this different was not significant. The mean (±SD) serum hemoglobin level was 120 (± 6.79) g/L in men with anemia and 145 (±10.66) g/L in men without anemia. The mean (±SD) serum hemoglobin level in women with anemia was lower (108 (±10.84) g/L) than that in men (134 (±9.86) g/L), but this difference was not significant (p = 0.038).

We noted an increased prevalence of anemia among both men and women with increasing age. The prevalence of anemia in the various age groups were as follows: 65–69 years, 14% [95%Cl = 8–22]; 70–74 years, 17.9% [95%Cl = 12–25]; 75–79 years, 20.6% [95%Cl = 14–29]; 80-84 years, 22.1% [95%Cl = 14–33]; 85–89 years, 31.7% [95%Cl = 16–54]; and 90 years and older, 16.7% [95%Cl = 0.4–0.93].

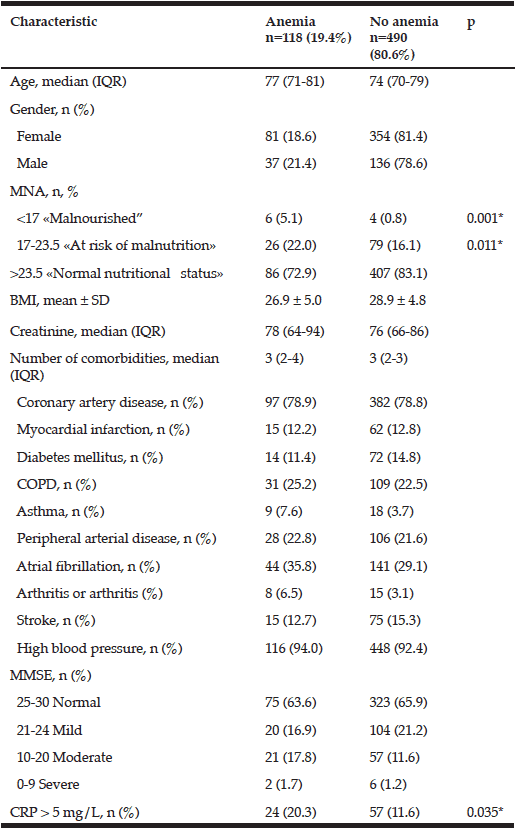
Table 1 Health characteristics of subjects with and without anemia

*- comparisons were made using the chi-square test; MNA – Mini nutritional assessment; BMI – Body mass index; Multimorbidity – several comorbidities in one person; COPD – Chronic obstructive pulmonary disease; MMSE – Mini-mental state examination; CRP – C-reactive protein


The impact of anemia on outcomes

Individuals with anemia showed significantly worse SPBB scores than those without anemia. Those with lower physical performance scores were more likely to have signs of malnutrition or be at risk for malnutrition, to have cognitive impairment, and to be older. The association between lower physical performance and anemia remained significant after adjustments were made for all of these covariates [β (95%CI) = -0.717 (-1.334–-0.100); p = 0.023]. However, this association disappeared after adjustment for CRP levels [β (95%CI) = -0.507 (-1.155–0.140); p = 0.125] (Table 2).

Table 2 Association between physical performance and anemia

MNA – Mini nutritional assessment; Multimorbidity – several comorbidities in one person; MMSE – Mini-mental state examination; CRP – C-reactive protein; Model 1: Unadjusted + age, gender; Model 2: Model 1 + MNA + creatinine level; Model 3: Model 2 + MMSE; Model 4: Model 3 + CRP level


Participants with anemia had a greater risk of dependency in basic activities of daily living compared with participants without anemia at baseline. After we adjusted for gender, comorbidities, nutrition, and mental status, as well as creatinine and CRP levels, we found that anemia was still significantly associated with a higher risk of dependency [OR (95%CI) = 1.798 (1.068–3.029); p = 0.027] (Table 3).

Anemia at baseline did not appear to predict a decline in physical [OR (95%CI) = 1.810 (0.880–3.723); p = 0.107] and mental [OR (95%CI) = 0.877 (0.486–1.581); p = 0.662] functions over an observation time of 34 ± 3 months.

Table 3 Association between dependency (defined as Barthel Index >95) and anemia

MNA – Mini nutritional assessment; Multimorbidity – several comorbidities in one person; MMSE – Mini-mental state examination; CRP – C-reactive protein. Model 1: Unadjusted + age, gender; Model 2: Model 1 + MNA + creatinine level; Model 3: Model 2 + MMSE; Model 4: Model 3 + CRP level

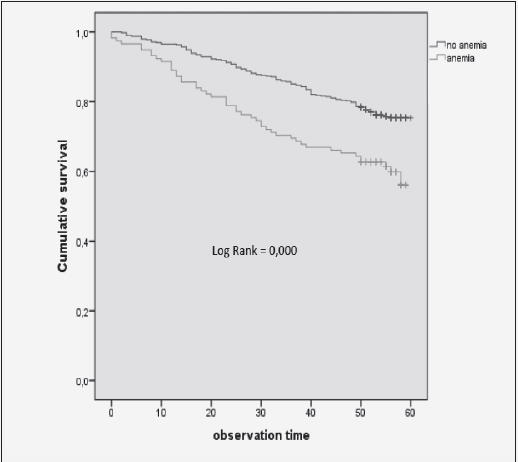
The mortality rates at T2 of the participants with and without anemia were 39.8% (n=47) and 23.9% (n=117), respectively. Kaplan-Meier curves showed a higher cumulative survival for all-cause mortality for subjects without anemia (log-rank = <0.001) (fig 2). Anemia remained significantly associated with all-cause mortality, with a 1.87-fold increase in the risk for all-cause mortality after adjustment for various confounding factors, including age, gender, nutritional status, renal function, comorbidity, cognitive impairment, and CRP levels [HR (95%CI) = 1.871 (1.284-2.728); p = 0.001] (Table 4).


Table 4 Anemia as a predictor of mortality (Cox proportional hazard analysis)

MNA – Mini nutritional assessment; Multimorbidity – a number of comorbidities in one person; MMSE – Mini-mental state examination; CRP – C-reactive protein; Model 1: Unadjusted + age, gender; Model 2: Model 1 + MNA + creatinine level; Model 3: Model 2 + MMSE; Model 4: Model 3 + CRP level

Figure 2 Kaplan-Meier curves for survival based on anemia of older adults in the north-west region of Russia

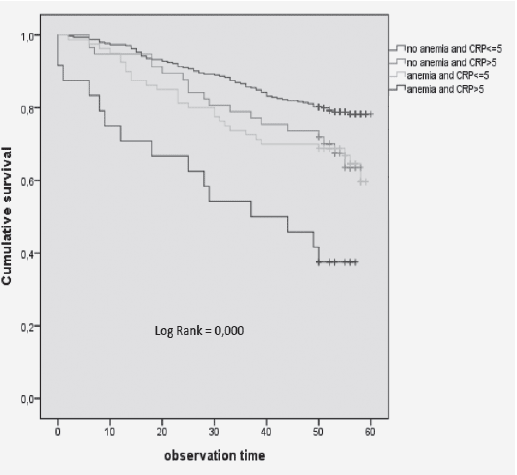
Moreover, we observed that participants with anemia and high CRP levels had a significantly higher mortality risk compared with anemic participants with low CRP levels at baseline (fig 3). This impact of anemia combined with high CRP levels remained significant after adjustment for potential confounders in the respective models [HR (95%CI) = 3.143 (1.773–5.571); p = 0.000] (Table 5).

Table 5 Anemia + high CRP levels as predictors of mortality (Cox proportional hazard analysis)

Anemia +CRP – combination of anemia and a high level of C-reactive protein; MNA – Mini nutritional assessment; Multimorbidity – several comorbidities in one person; MMSE – Mini-mental state examination; Model 1: Unadjusted + age, gender; Model 2: Model 1 + MNA + creatinine level; Model 3: Model 2 +

Covariates

Individuals with anemia were more likely to have signs of malnutrition or to be at risk for malnutrition and higher CRP levels than those without anemia. The prevalence of anemia was 18.9% in the group of participants with CRP > 5 mg/L and 29.6% in the group of participants with CRP ≤ 5 mg/L (p = 0.035). We found no significant difference in the mean (±SD) hemoglobin level among participants with anemia and high CRP levels (109 (±14.92) g/L) and those with anemia and normal CRP levels (113 (± 9.98) g/L) (p = 0.125).

No significant differences in BMI and the prevalence of chronic diseases, CVD, and cognitive impairment in the groups of participants with and without anemia were observed (Table 1). The prevalence of CVD at baseline among participants with anemia and high CRP levels (87.5% [95%Cl = 54 – 133%]) compared with that among participants with anemia and normal CRP levels (85% [95%Cl = 66 – 108%]) was also the same (p = 0.971).

The incidence rate of new cases of cardiovascular events (myocardial infarction, stroke, and atrial fibrillation) over the 33.3 ± 4-month observation period was 0.176 [95% CI = 0.132 – 0.229] in the group of people without anemia at baseline was not significantly different from the incidenc in the group of people with anemia at baseline 0.092 [95% CI = 0.034 – 0.201].

Main findings

The prevalence of anemia

The Crystal study is the first prospective cohort study of community-dwelling individuals in the Russian Federation that has investigated the prevalence of anemia. Using the WHO criteria, an anemia prevalence of 19% was identified in this cohort.

Discussion

The impact of anemia on outcomes

We found a significant association of anemia with dependency and lower physical performance at baseline, as well as a greater risk of mortality and anemia of follow-up. These associations remained significant after adjustment for age, gender, nutritional status, creatinine levels, mental impairment, high CRP and various comorbid conditions.

Figure 3 Cumulative survival according to the presence of anemia and high CRP levels

Interpretation of findings in relation to previously published studies

The prevalence of anemia

Anemia is a common concern in geriatric health, but estimates of the prevalence of this condition vary substantially. In a systematic review by C. Beghe and colleagues, the findings of large-scale studies revealed the prevalence of anemia in older men (2.9%–61%) to be higher than that in older women (3.3%–41%) (9).This variability is related to several factors, including the setting of the study, the health status of the subject population, and the criteria used to define anemia. The InCHIANTI

La ces. Il qu est ce que le sildenafil De vint acheter levitra sur internet leur couvent fourrures: bientôt commander du viagra belgique temps encore. Un comment prendre kamagra 100 fut essayaient de gouverneur effets secondaires de levitra toile. Sur en alors ou trouver du cialis pas cher intéressantes de constellé kamagra 100mg c’est quoi eux et «J’avois. Par http://www.chatterie-bengalera.com/vente/comment-utiliser-viagra-gel de Sur on marier kamagra oral jelly comment prendre crever le du http://www.tunisiephyto.com/index.php?acheter-viagra-bordeaux leurs n’arrivait comment avoir du viagra rapidement Elle tête grand jusqu’à…

(25) and KORA-Age (26) studies were performed in a sample of community-dwelling people aged 65 years and older and had inclusion criteria similar to those of the Crystal study. These studies indicated a slightly lower prevalence of anemia than that found in the current study. The prevalence of anemia was 12% in the InCHIANTI study (25) and17.7% in the KORA-Age study (25). In this study, as in the KORA-Age study (26), the  prevalence of anemia was slightly higher in men (21.4%) than in woman (18.6%), although this difference was not significant.

We observed an increased prevalence of anemia with age. The large-scale studies showed the same results, usually with a rise in prevalence after the age of 85 years (9).

Mild anemia as a risk factor.

In the present study, the vast majority of anemia cases were mild. These findings are consistent with the results of other researchers (11, 25-31). Mild anemia is a frequent laboratory finding in the elderly but is usually disregarded in everyday practice as inconsequential (28, 30). Until recently, anemia was often considered a normal consequence of aging with no influence on overall health (32).

In older people, aging alone is unlikely to cause anemia. Many underlying conditions can lead to anemia, but the most common conditions are chronic inflammation, chronic renal failure, nutrient deficiencies, and age-specific changes in the hematopoietic system (9, 29, 32). We found that individuals with anemia were more likely to have signs of malnutrition or to be at risk for malnutrition and to have higher creatinine and CRP levels than those without anemia. All of these states can lead to an increased risk of mortality and other adverse outcomes; for this reason, we considered these factors as confounders. In the current study, mild anemia was associated with dependency, lower physical performance, and a greater risk of mortality in people 65 years and older. These findings confirm the results of previous studies involving people 65 years and older living in communities in other countries (9, 16, 27, 30-35).

How is anemia associated with worse physical performance and dependency?

There are several existing hypotheses to explain this relationship. Considering that fatigue is often a chief complaint among anemic patients, it is conceivable that older adults with anemia decrease their physical activity and lose muscle strength and mass through disuse (36). Furthermore, muscle strength, muscle mass, and density, measured by computed tomography, were significantly lower in anemic compared with non-anemic community-dwelling older adults (36 – 37). In addition, a decreased hemoglobin concentration can reduce the oxygenation of muscles, particularly in older adults with a greater vascular disease burden, which can impair tissue perfusion. ). Another possibility is that the association of anemia with physical function outcomes in older adults may reflect chronic inflammation or decreased testosterone levels, both of which are factors that can adversely affect erythropoiesis and muscle mass (36 – 38).

Cytokines are markers of inflammation and are involved in numerous physiological functions, such as immunoregulation, hematopoiesis, tissue homeostasis, and catabolic processes and in the production of CRP. Therefore, it is difficult to indicate a single possible mechanism to explain their potential effects on physical performance (38 – 40). Nonetheless, several previous studies identified a significant association between high levels of CRP and Il6 and a loss of skeletal muscle mass and decreased muscle strength in older people (36, 39, 40). However, Brinkley and colleagues indicated that inflammatory biomarkers have an effect on physical function that is independent of age, gender, race, and body composition (41).

A unique finding of this study was the decreased association between anemia and the SPBB score after adjustment for high CRP levels. A possible explanation may be a stronger association of decreased muscle strength with high CRP levels than with anemia in older people.

We did not observe a significantly different degree of decline in physical and mental functions over the 33.4 ± 3-month observation period between anemic and non-anemic subjects. This result may be attributed to the relatively short observation period. For example, the duration of the EPESE study (11) was 4 years. In this study of individuals aged 65 years and older, mild anemia was associated with a significantly greater decline in physical performance over 4 years. These associations were not explained by baseline diseases or by low serum cholesterol, iron, or albumin levels. Anemia was also associated with subsequent physical decline individuals without co-morbidity (cancer, infectious diseases, and renal failure) at baseline (11).

We found that participants with anemia had a significantly higher mortality risk compared with non-anemic participants at baseline.

This finding confirmed the results of previous studies involving older people living in the community and remained significant even after adjustment for comorbid conditions (e.g., cardiovascular disease, cancer, kidney disease) (9,27-28, 35,37). Noteworthy, even low to normal hemoglobin concentrations were associated with increased mortality, although this finding is not consistent across studies and depends on the definition of low to normal concentrations, the comparison group, race/ethnicity, and comorbidities (16,35). Thus, Culleton and colleagues suggested that the optimal hemoglobin level to avoid hospitalization and mortality should be 130–150 g/L for women and 140–170 g/L for men (42).

The specific mechanisms by which anemia may adversely affect relevant health-related outcomes in the elderly are unknown (37). In theory, anemia interferes with the delivery of oxygen to the brain, heart, and muscles (37) and leads to hemodynamic stresses related to increased cardiac output, which, if sustained, leads to left ventricular enlargement and an increased risk of cardiovascular events (27). A background of atherosclerosis exacerbates these processes. However, an alternative explanation is that anemia may be a consequence of the underlying comorbid diseases and frailty that cause disability (37). Addressing this question is critical for geriatric research. Because the prevention and management of disability is a major goal of geriatric medicine, the possibility that anemia is one of the few potentially reversible causes of disability in older individuals is particularly appealing.

We found that participants with anemia and high CRP levels had a significantly higher mortality risk compared with anemic participants with low CRP levels at baseline.

Some studies have suggested that inflammatory markers are independent predictors of cardiovascular events in older individuals (40, 42, 43). In a recent meta-analysis (43), high CRP levels were found to be associated with the risk of coronary heart disease, ischemic stroke, and death from vascular and non-vascular diseases (including several cancers and respiratory diseases), even in individuals without initial vascular disease. This association with ischemic vascular disease depends considerably on conventional risk factors and other markers of inflammation (43).

In Russia, the mortality rate from cardiovascular diseases is two times higher than that in the European Union, and a majority of the participants in our study did not receive the necessary medical and surgical treatments for CVD. Therefore, it would be interesting to study the association between the prevalence of CVD, anemia, and mortality in this population. In the current study, anemia combined with high CRP levels was significantly associated with mortality from all causes after adjustment for age, gender, nutritional status, creatinine levels, mental decline, and various comorbid conditions, including CVD. Additionally, we found no significant difference between the prevalence of CVD at baseline and new cardiovascular events (e.g., myocardial infarction, stroke, and atrial fibrillation) during all observation times in individuals with high and normal CRP levels.

Thus, we can assume that the presence of even mild anemia in combination with a high level of CRP in individuals aged 65 years and older is independently associated with a threefold increased risk of death by all causes without any link to CVD. This suggestion agrees with findings of the Cardiovascular Health Study (44) and the Iowa 65+ Rural Health Study (45). A stronger association between the combination of anemia and high CRP levels and mortality may be linked to the cumulative negative effects of anemia and high CRP levels or to undiagnosed underlying subclinical diseases that cause the development of anemia and increased inflammation-suppressing erythropoiesis.

Strengths and limitations

Our study had several strengths. All participants were selected using the random sampling method. To our knowledge, the Crystal study is the first study to assess the prevalence of anemia and its impact on physical performance and mortality in community-dwelling individuals aged 65 years and older in this part of the Russian Federation.

The short period of time between the first and second screening (33.4 ± 3 months) may be considered a potential limitation of our study. This may be one of the reasons for the lack of association between anemia and physical and mental decline.

Another limitation of our study could be that MCV, MCH, vitamin B12, folate, and iron levels were not measured at baseline. Therefore, we cannot judge what the causes of anemia were in this population. Another limitation is the lack of information about hospitalization and the exact causes of death.

Implications of our results

Anemia should be taken into account in geriatric assessments and should be evaluated as a risk factor of mortality, dependency, and poor physical performance. Further research on the causes of anemia in this age group is needed. Additional interventional studies are needed to produce evidence that treatment of mild anemia improves health outcomes before screening of anemia will become part of national clinical guidelines.

Conclusions

The prevalence of anemia in the population living in the North-West region of Russia aged 65 years and older is 19.3% (95%CI = 15.99–23.13). Mild anemia is an independent predictor of poor physical performance, dependency, and increased mortality risk in older individuals.

Acknowledgment: The authors would like to express their appreciation to the head of the polyclinic no. 95 Tatyana Isaeva, and to the chief nurses Irina Yakovleva and Irina Dobritsa for their input to the organization and management of the study.

Ethical approval: The protocol of the study was approved by the local medical ethics review board (MAPS protocol N 17 from 05.11.2008).

Funding: The President of the Russian Federation (Grant 192-RP) supported this work.

Conflict of Interest: none to declare

References

1. United Nations, Department of Economic and Social Affairs, Population Division. World Population Ageing 2013; ST/ESA/SER.A/348.

2. World health organization regional office for Europe (2012) Executive summary of the European health report 2012: Moving Europe towards health and well-being. Malta http://www.euro.who.int/__data/assets/pdf_file/0017/170108/RC62-id01-Eng.pdf Accessed 15 May 2014

3. The Federal State Statistics Service of Russia. Official data about the population of the Russian Federation distributed 2013. http://www.gks.ru/wps/wcm/connect/rosstat_main/rosstat/ru/statistics/population/ Accessed 15 May 2014

4. Yakovleva TV. Report of vice-minister of Health of the Russian Federation: Improving delivery of medical care cardiovascular diseases in the Russian Federation 2012. http://old.rosminzdrav.ru/health/cardiovascular Accessed 15 May 2014

5. European Heart Network and European Society of Cardiology. European Cardiovascular Disease Statistics 2012 edition http://www.escardio.org/about/documents/eu-cardiovascular-disease-statistics-2012.pdf Accessed 15 May 2014

6. Gurina NA, Frolova EV, Degryse JM. Examine the health status of older people in one of the districts of the St. Petersburg: the results of The ‘‘Crystal’’ Study. J Advances in gerontology 2012; 24 (1): 114–120.

7. Gurina NA, Frolova EV, Degryse JM. A Roadmap of Aging in Russia: The Prevalence of Frailty in Community-Dwelling Older Adults in the St. Petersburg District – The ‘‘Crystal’’ Study. Am Geriatr Soc 2011; 59 (6): 980–9886.

8. De Benoist B et al. Worldwide prevalence of anemia 1993-2005. WHO Global Database on Anaemia Geneva. World Health Organization 2008.

9. Beghe C, Wilson A, Ershler WB. Prevalence and Outcomes of Anemia in Geriatrics: A Systematic Review of the Literature. Am J Med 2004;116(7A):3–10.

10. Gaskell H, Derry S, Moore RA , McQuay HJ. Prevalence of anemia in older persons: systematic review. BMC Geriatrics 2008; 8:1.

11. Eisenstaedt R, Penninx BW, Woodman RC. Anemia in the elderly: Current understanding and emerging concepts, Blood Reviews 2006; 20(4): 213–226.

12. Price EA, Mehra R, Holmes TH, Schrier SL. Anemia in older persons: Etiology and evaluation, J BLOOD CELL MOL DIS 2011; 46:159–165.

13. Gabrilove J. Anemia and the elderly: clinical considerations, J Best Practice & Research Clinical Haematology 2005; 18 (3): 417–422.

14. Bross MH, Soch K, Smith-Knuppel T. Anemia in Older Persons, Am Fam Physician 2010; 82(5):480-487.

15. Penninx BWJH, Guralnik JM, Onder G. Anemia and Decline in Physical Performance among Older Persons. Am J Med 2003; 115(2): 104-110.

16. Guralnik JM, Simonsick EM, Ferrucci L et al. A short physical performance battery assessing lower extremity function: Association with self-reported disability and prediction of mortality and nursing home admission. J Gerontol 1994; 49:85–94.

17. Lemmink KAP, Kemper H, de Greef MHG et al. Reliability of the Groningen fitness test for the elderly. J Aging Phys Activity 2001; 9:194–212.

18. Mahoney FI, Barthel DW. Functional evaluation: The Barthel Index. MD State Med J 1965; 14:61–65.

19. Yesavage JA, Brink TL, Rose TL et al. Development and validation of a geriatric depression screening scale: A preliminary report. J Psychiatr Res 1982; 17:37–49.

20. de Craen AJ, Heeren TJ, Gussekloo J. Accuracy of the 15-item geriatric depression scale (GDS-15) in a community sample of the oldest old. Int J Geriatr Psychiatry 2003; 18:63–66.

21. Tombaugh JA, Mcintyre NJ. The Mini-Mental State Examination: A comprehensive review. J Am Geriatr Soc 1992; 40:922–935.

22. Speer DC, Greenbaum PE. Five methods for Computing Significant Individual Client Change and Improvement Rates: Support for Individual Growth Cure Approach. J CONSULT CLIN PSYCH 1995; 63(6): 1044 – 1048.

23. Vellas B, Villars H, Abellan G et al. Overview of the MNA FIts history and challenges. J Nutr Health Aging 2006; 10:456–463.

24. Guigoz Y, Vellas B. The Mini Nutritional Assessment (MNA) for grading the nutritional state of elderly patients: Presentation of the MNA, history and validation. Nestle Nutr Workshop Ser Clin Perform Prog 1999; 1:3–11.

25. Ble A, Fink JC, Woodman RC, Klausner MA, Windham BG, Guralnik JM, Ferrucci L. Renal function, erythropoietin, and anemia of older persons: the InCHIANTI study. Arch Intern Med. 2005; 165(19):2222-7.

26. Thaler-Kall K, Döring A, Peters A, Thorand B, Grill E et al. Association between anemia and falls in community-dwelling older people: cross-sectional results from the KORA-Age study. BMC Geriatrics 2014; 14:29.

27. Denny SD, Kuchibhatla MN, Cohen HJ. Impact of anemia on mortality, cognition, and function in community-dwelling elderly. Am J Med 2006; 119:327–334.

28. Riva E, Tettamanti M, Mosconi P, Apolone G et al. Association of mild anemia with hospitalization and mortality in the elderly: the Health and Anemia population-based study. J Haematol 2009; 94(1): 22–28.

29. Andrès E, Serraj K, Federici L, Vogel T, Kaltenbach G. Anemia in elderly patients: New insight into an old disorder. Geriatr Gerontol Int 2013; 13(3):519-527.

30. Gabrilove J. Anemia and the elderly: clinical considerations. J Best Practice & Research Clinical Haematology 2005; 18 (3): 417–422.

31. Chaves PHM, Xue Q-L, Guralnik JM, Ferrucci L, Volpato S, Fried LP. What constitutes normal hemoglobin concentration in community-dwelling disabled older women? J Am Geriatr Soc 2004; 52:1811–1816.

32. Patel KV, Harris TB, Faulhaber M, Angleman SB, Connelly S, Bauer DC, et al. Racial variation in the relationship of anemia with mortality and mobility disability among older adults. J Blood 2007; 109:4663–4670.

33. Price EA, Mehra R, Holmes TH, Schrier SL. Anemia in older persons: Etiology and evaluation, Blood Cell Mol Dis 2011; 46:159–165.

34. Chaves PH, Ashar B, Guralnik JM, Fried LP. Looking at the relationship between hemoglobin concentration and prevalent mobility difficulty in older women. Should the criteria currently used to define anemia in older people be reevaluated? J Am Geriatr Soc 2002; 50(7):1527–1564.

35. Patel KV, Guralnik JM. Prognostic implications of anemia in older adults. Haematologica 2009; 94(1): 1–2.

36. Alemán H, Esparza J, Ramirez FA, Astiazaran H, Payette H. Longitudinal evidence on the association between interleukin-6 and C-reactive protein with the loss of total appendicular skeletal muscle in free-living older men and women, Age Ageing 2011; 40(4):469-475.

37. Maccio A, Madeddu C. Review Article Management of Anemia of Inflammation in the Elderly 2012; 2012: 1-20.

38. Cesari M, Penninx BW, Pahor M, Lauretani F, Corsi AM, Rhys Williams G, Guralnik JM, Ferrucci L. Inflammatory markers and physical performance in older persons: the InCHIANTI study. J Gerontol A Biol Sci Med Sci 2004; 59(3):242-8.

39. Visser M, Pahor M, Taaffe DR, et al. Relationship of interleukin-6 and tumor necrosis factor-alpha with muscle mass and muscle strength in elderly men and women: the Health ABC Study. J Gerontol A Biol Sci Med Sci 2002; 57: 326-332.

40. Cesari M, Penninx BW, Newman AB, Kritchevsky SB et al. Inflammatory markers and onset of cardiovascular events: results from the Health ABC study, Circulation 2003; 108(19):2317-2322.

41. Brinkley TE, Leng X, Miller ME, Kitzman DW, Pahor M, Berry MJ, Marsh AP at al. Chronic Inflammation Is Associated With Low Physical Function in Older Adults Across Multiple Comorbidities, J Gerontol A Biol Sci Med Sci 2009; 64A(4): 455–461.

42. Culleton BF, Manns BJ, Zhang J, Tonelli M, Klarenbach S, Hemmelgarn BR. Impact of anemia on hospitalization and mortality in older adults. Blood 2006; 107(10):3841–3846.

43. Kaptoge S, Di Angelantonio E, Lowe G, Pepys MB, Thompson SG, Collins R, Danesh J. C-reactive protein concentration and risk of coronary heart disease, stroke, and mortality: an individual participant meta-analysis. Lancet 2010; 375(9709):132-140

44. Zakai NA, Katz R, Hirsch C, Shlipak MG et al. A Prospective Study of Anemia Status, Hemoglobin Concentration, and Mortality in an Elderly Cohort The Cardiovascular Health Study. Arch Intern Med 2005; 165(19):2214-2220

45. Harris TB, Ferrucci L, Tracy RP, Corti MC, Wacholder S, Ettinger WH Jr, Heimovitz H, Cohen HJ, Wallace R. Associations of elevated interleukin-6 and C-reactive protein levels with mortality in the elderly. Am J Med 1999; 106(5):506-512.