jarlife journal
Sample text

AND option

OR option

PSYCHOMETRIC PROPERTIES OF THE SUBJECTIVE-OBJECTIVE MALNUTRITION RISK ASSESSMENT (SOMRA) IN A STUDY OF SWEDISH PEOPLE AGED ≥ 60 YEARS


M. Naseer1, C.Fagerström1,2


1. Center of competence, Blekinge county council, Karlskrona, Sweden; 2. Department of health, Blekinge Institute of Technology, Karlskrona, Sweden.

Corresponding Author: Mahwish Naseer, Center of competence, Blekinge county council, SE-371 41 Karlskrona, Sweden, Phone: 00 46 (0) 738953144, mahwish.naseer85@gmail.com

J Aging Res Clin Practice 2016;inpress
Published online December 7, 2016, http://dx.doi.org/10.14283/jarcp.2016.125


Abstract

Objective: This study aimed to investigate the risk of malnutrition and to evaluate the psychometric properties of the Subjective-Objective Malnutrition Risk Assessment (SOMRA), SOMRA cut-offs and Swedish-Guidelines on Malnutrition Risk Assessment (SGMRA) for Swedish people aged ≥ 60 years. Setting: This study included both older people living at home and those in special housing. Participants: 1222 of the 1402 subjects aged ≥ 60 years who had participated in the baseline survey (2001–2003) as part of the ongoing National Study on Aging and Care-Blekinge (SNAC-B) were included because they had provided complete information on Mini-Nutritional Assessment (MNA). Measurements: The risk of malnutrition was estimated by the SOMRA, MNA, and SGMRA. To measure concurrent validity, the Receiver Operating Characteristics (ROC) curve, Cohen’s kappa (κ) and Spearman’s rank correlation coefficient rho (rs) were used. Youden’s index (J) was computed to assess the optimal cut-off on SOMRA. Cronbach’s alpha (α) was used to test reliability. Results: The risks of malnutrition measured by SOMRA, MNA and SGMRA were 6.5%, 8.6% and 20.9%, respectively. The risk was higher among older people living in special housing compared to those at home (p < 0.05). Different optimal cut-offs on SOMRA were observed for residents living at home (≥ 1) and those in special housing (≥ 3). Compared to SGMRA, the SOMRA and SOMRA cut-off ≥ 3 gave higher values for J (0.68, 0.81, and 0.84, respectively), κ (0.59, 0.77, and 0.84, respectively) and rs (0.64, 0.78, and 0.84, respectively) for the older people in special housing. The reliability for SOMRA was α = 0.71. Conclusion: The risk of malnutrition was higher among older people in special housing than among those living at home. For the people in special housing, the SOMRA and SOMRA cut-off ≥ 3 showed higher concurrent validity with MNA compared to the SGMRA, but not for older people living at home. SOMRA includes six items, takes less time to implement and is composed of both subjective and anthropometric measurements; therefore, it is suitable for use in special housing and/or clinical settings to identify the risk of malnutrition or the need for nutritional support.

Key words: Malnutrition, older people, psychometric properties, home-living, special housing.


Introduction

In older people, physiological changes due to age, such as muscle mass depletion, decreased ability to chew, and digestion problems (1), in addition to the decline in functional ability, such as reduced ability to cook or inadequate access to grocery stores, increase the risk of malnutrition (2). The risk of malnutrition contributes to adverse health outcomes like frailty (3), hospital admissions, longer stays at hospital (4), and pre-term mortality (3, 5). The increased risk of malnutrition with aging and demographic transition in aging suggests routine nutritional risk assessment to reduce the burden of malnutrition associated adverse health outcomes. However, the lack of a universally accepted nutritional risk assessment instrument hinders the implementation of routine nutrition risk screening (6, 7).
The studies on older Swedish people showed that 17% of those living at home (8), 27%–38% in special housing (9, 10) and 41% of those receiving home care services (11) were at risk of malnutrition. The higher risk of malnutrition in the special housing and those receiving home care services indirectly emphasises on the nutritional risk assessment at the community level, because the risk of malnutrition in the home living is often overlooked and gets worse over time (8). This ultimately leads to hospital and nursing homes admissions. As majority of the older population lives at their homes; therefore, nutritional risk assessment at the community level may reduce the risk of irreversible effects of malnutrition and burden on the nursing home admissions. Moreover, the higher risk for those in special housing (a person is offered care around the clock such as nursing homes, sheltered accommodation, or group accommodation; Swedish Association of local authorities and regions, 2009) and for those receiving home care services can be attributed to reduced functional ability and to more common poor health among special housing and home care residents (11). The risk rate may also depend on the instrument used for risk assessment and the population under investigation, e.g., eating ability as a risk assessment instrument will show a higher risk of malnutrition among adults in special housing compared to those living at home. This is because difficulty in eating is common among older people in special housing (9) compared to among those living at home.
Mini-Nutritional Assessment (MNA) is an 18-item nutritional assessment instrument recommended by European Society for Parenteral and Enteral Nutrition (ESPEN) for older people (6), but the MNA may be too long to be used in routine nutritional risk assessment (12). Therefore, Rubenstein et al. (12) proposed the MNA-SF based on six questions. However, if a patient is identified as being at risk of malnutrition according to the MNA-SF, the implementation of a full MNA is needed. The Swedish society for clinical nutrition and metabolism (SWESPEN) has given three guidelines (involuntary weight-loss, body mass index (BMI), and eating difficulties) that should be considered to assess the risk of malnutrition in the special housing and/or hospitalised patients (13). The Swedish Guidelines on Malnutrition Risk Assessment (SGMRA) are short and easy to implement, but the robustness of SGMRA is questionable, because it may over- or underestimate the risk of malnutrition (14). Therefore, Naseer and Fagerström (14) proposed a Subjective-Objective Malnutrition Risk Assessment (SOMRA) instrument by merging the guidelines of ESPEN for community dwelling (6) and SGMRA for hospital and special housing (13). Hence, SOMRA is based on the guidelines for nutritional risk assessment for both living at home and those in special housing; therefore, it may have better psychometric properties than SGMRA.
Kondrup et al. (6) stated a number of psychometric properties that should be considered when evaluating the usefulness of a nutritional risk assessment tool. These methods include predictive validity, content validity, reliability and practical use. The SOMRA shows predictive validity for quality of life (14) and mortality over 7 years (5). However, it remains necessary to evaluate the content validity and reliability of SOMRA and to discuss its practical use. Content validity refers to the comprehensiveness of a measuring instrument that means a risk assessment instrument includes all the relevant components of the problem that is being measured (6). SOMRA (14) included all the components of nutritional risk assessment proposed by ESPEN and SGMRA that may ensures the content validity of SOMRA. Another way to validate a newly designed instrument is to make a comparison of a new instrument with another well-validated instrument, e.g., MNA (7). This is called concurrent validity and the concurrent validity of SOMRA remains to be investigated.
The three objectives of this study were: 1) to investigate the risk of malnutrition according to SOMRA, MNA, and SGMRA among Swedish people aged ≥ 60 years, 2) to investigate the concurrent validity of the SOMRA, cut-offs on the SOMRA and the SGMRA with MNA among Swedish older people aged ≥ 60 years, 3) to evaluate the reliability in terms of internal consistency of SOMRA and SGMRA.


Materials and Methods

Study population

The sample for this study was drawn from an ongoing longitudinal cohort study: the Swedish National Study of Aging and Care (SNAC). The sample consisted of 1402 subjects aged 60–96 years, including both older people living at home (10.5% of them received home care services offered by municipality and 14.6% family support) and special housing residents (participants receiving 24-hour services/assisted living), who participated in the baseline survey (2001–2003) of SNAC-Blekinge (SNAC-B). The details of the SNAC are given elsewhere (15). The population was randomly selected for age cohorts of 60, 66, 72 and 78 years and the entire population was included for age cohorts 81, 84, 87, 90, 93 and 96 years. Participants were solicited through emails and phone calls, and reasons for non-participation were registered. Of the 1402, the participants who provided information on all items of the MNA (n=1222) were included in this study.
The data collection team consisted of nurses and physicians. The study was conducted in accordance with the Helsinki Declaration, and all participants provided written informed consent. The SNAC-B study was approved by the ethics committee of Lund University (LU 605-00, LU 744-00).

Measurements and instruments

A single-item self-administered questionnaire was used to collect information on age, gender, living arrangements, diseases (heart disease, diabetes, cancer, dementia and depression) and smoking. For subjects with dementia and depression, proxy measures were used. Economic status and physical activity were estimated by a two-item questionnaire. Functional ability was estimated by six items about activities of daily living (ADL; that is, bathing, dressing, toiletry, transferring, continence and feeding) (16) and by four items of instrumental ADL (IADL; that is, cleaning, transportation, shopping and cooking) (17).  The score range was 0 to 6 for ADL and 0 to 4 for IADL. The score 0 represents independence and 1 represents dependence for all activities for ADL and IADL. Scores 6 and 4 represent total dependence for ADL and IADL, respectively. Thus, functional dependence was defined as ADL ≥ 1 and IADL ≥ 1 (5, 18).
Nutritional status as assessed by the MNA was used as the “gold standard”. MNA is a well-validated 18-item instrument (19). The MNA score dichotomized into “well-nourished” and “malnutrition / at risk of malnutrition” was used as outcome variable. The MNA was executed during a medical examination and anthropometric measurements were taken by the research staff. Body mass index (BMI) (kg/m2) was calculated from weight and height. Mid-arm circumference (MAC) and calf circumference (CC) were measured with a flexible tape to the nearest 0.1 cm of the left arm and leg, respectively (14).
SOMRA (14) includes three anthropometric measurements: BMI, MAC and CC, and three subjective measurements: decrease in food intake over the last 3 months, weight loss during the previous 3 months and eating ability, which refers to the subject’s ability to eat independently or only with help. The criterion for risk of malnutrition on the SOMRA was “the occurrence of at least one anthropometric measurement below cut-off, defined as the 15th percentile, (i.e., BMI < 22.7 kg/m2, MAC ≤ 25.5 cm and CC ≤ 32 cm) and the presence of at least one subjective measure (i.e., reduced food intake, weight loss and need for help when eating)”. In this study, cut-offs for BMI, MAC and CC were redefined as the 15th percentile due to the different sample size (n=1222) from that of the previous study (n=1402) (14). In addition, different cut-offs (≥ 1, ≥ 2, ≥ 3, ≥ 4, ≥ 5 & =6) for the 6 items of SOMRA were computed independently of whether measurement was subjective or objective. Thus, the SOMRA cut-off ≥ 1 was defined as the presence of at least one or more of these conditions: involuntary weight loss, decreased appetite, need for help when eating, BMI < 22.7 kg/m2, MAC ≤ 25.5 cm or CC ≤ 32 cm). The risk of malnutrition was also measured with respect to each cut-off of SOMRA.
The SGMRA (13) included 3 items; BMI < 20 if ≤ 69 years and BMI < 22 if ≥ 70 years; involuntary weight loss and eating difficulties. The presence of at least one condition out of these three delineated the risk of malnutrition.

Statistical analysis

Descriptive statistics are presented for the total population (n=1222) with respect to living arrangements (Table 1). For descriptive statistics, the mean and standard deviation (SD) were used for continuous variables and percentages were used for categorical variables. The data were not normally distributed; therefore, for comparison between groups (living at home vs in special housing), the χ2 test was used for categorical data and the Mann-Whitney U-test was used for ordinal and interval data. The concurrent validity of the SOMRA, the SOMRA cut-offs, and the SGMRA with MNA was tested by using three different statistical methods; Cohen’s kappa (κ), a receiver operating characteristic (ROC) curve, and Spearmen’s correlation coefficient (r). κ values represent the strength of agreement between the instruments. A κ value of <0.00 represents poor agreement and a κ value in the range of 0.81-1.80 shows almost perfect agreement (20). The strength of agreement is “slight” if κ = 0.00–0.20, “fair” if κ = 0.21–0.40, “moderate” if κ = 0.41–0.60, and “substantial” if κ = 0.61–0.80 (20).
An ROC curve is a graph of sensitivity and 1 – specificity, and the area under the ROC (AUROC) curve quantifies the diagnostic performance of a test variable at different cut-offs of the SOMRA (21). Sensitivity measures the ability to correctly identify cases and specificity measures the ability to correctly identify non-cases. Sensitivity and specificity were calculated from the ROC curve for the SOMRA, for various cut-offs of the SOMRA and for SGMRA. Sensitivity and specificity were considered equally important; therefore, Youden’s index (J = sensitivity + specificity – 1) was calculated to choose the appropriate cut-off (21). The Youden’s index (J) score ranges from 0 to 1, where 0 means that the test has no diagnostic value and 1 means that the test has perfect diagnostic value. In addition, positive predictive values (PPV) and negative predictive values (NPV) were calculated (21). PPV and NPV depend not only on specificity and sensitivity, but also on the prevalence of the health problem in question.
Reliability was tested in terms of internal consistency between the items of an instrument. The purpose of measuring internal consistency is to ensure that the instrument is measuring what it intends to measure (22). Cronbach’s alpha was used (23) to test the reliability; a coefficient score between 0.7 and 0.9 shows good reliability. To test the significance, a p-value < 0.05 was used. Analyses were conducted using SPSS statistical software, version 22 (SPSS Inc., Chicago, IL, USA) for Windows.


Results

The mean age of the included study sample (n=1222) was 76.1 (SD, 10.0) years and 57.2% of the sample was female (Table 1). The prevalence of heart disease was highest (54.8%). The prevalence of the other illnesses was: diabetes (8.9%), cancer (13.7%), depression (12.6%), and dementia (2.7%). Compared to those living at home, the people in special housing were significantly older (81.7 years (SD 10.7) vs 75.7 years (SD 9.7)), had more dementia (13.6% vs 1.9%), were dependent according to the ADL (52.9% vs 14.9%) and the IADL measures (75.0% vs 44.5%). Moreover, the older people in special housing did significantly less light physical activity (44.7% vs 67.2%) compared to those living at home (Table 1).
The risk of malnutrition as defined by various nutritional risk assessment instruments is given in Table 1. The MNA, SOMRA and SOMRA cut-off ≥ 3 showed almost similar levels of risk of malnutrition (8.6%, 6.5% and 9.3%, respectively). Moreover, the cut-off ≥ 2 on SOMRA (18.5%) and the SGMRA (20.9%) presented similar levels of risk of malnutrition. In the total population, the cut-off ≥ 1 on SOMRA showed the highest risk of malnutrition compared to other nutritional risk assessment instruments. However, the risk of malnutrition defined by various instruments except for the SOMRA cut-off ≥ 1 was significantly higher among the special housing residents than among older people living at home (Table 1).
The instrument’s validity measured by AUROC was 0.72 for SOMRA and 0.83 for SGMRA, irrespective of the living arrangement. Youden’s index values showed that the SGMRA had good validity compared to SOMRA (0.67 vs 0.45, respectively) in the total population. SOMRA was good for specificity (0.96), but not for sensitivity (0.49). However, the Spearman’s correlation co-efficient (rs) and kappa (κ) showed that SOMRA had moderate agreement with MNA than the SGMRA which has fair agreement with MNA (rs = 0.42 vs 0.39 and κ = 0.42 vs 0.30, respectively). In the total population, the optimal cut-offs on SOMRA as defined by Youden’s index were ≥ 1 and ≥ 2 , but correlation with MNA using kappa and Spearman’s correlation coefficient showed that the SOMRA cut-off ≥ 2 might be more valid than the SOMRA cut-off ≥ 1 (Table 2).
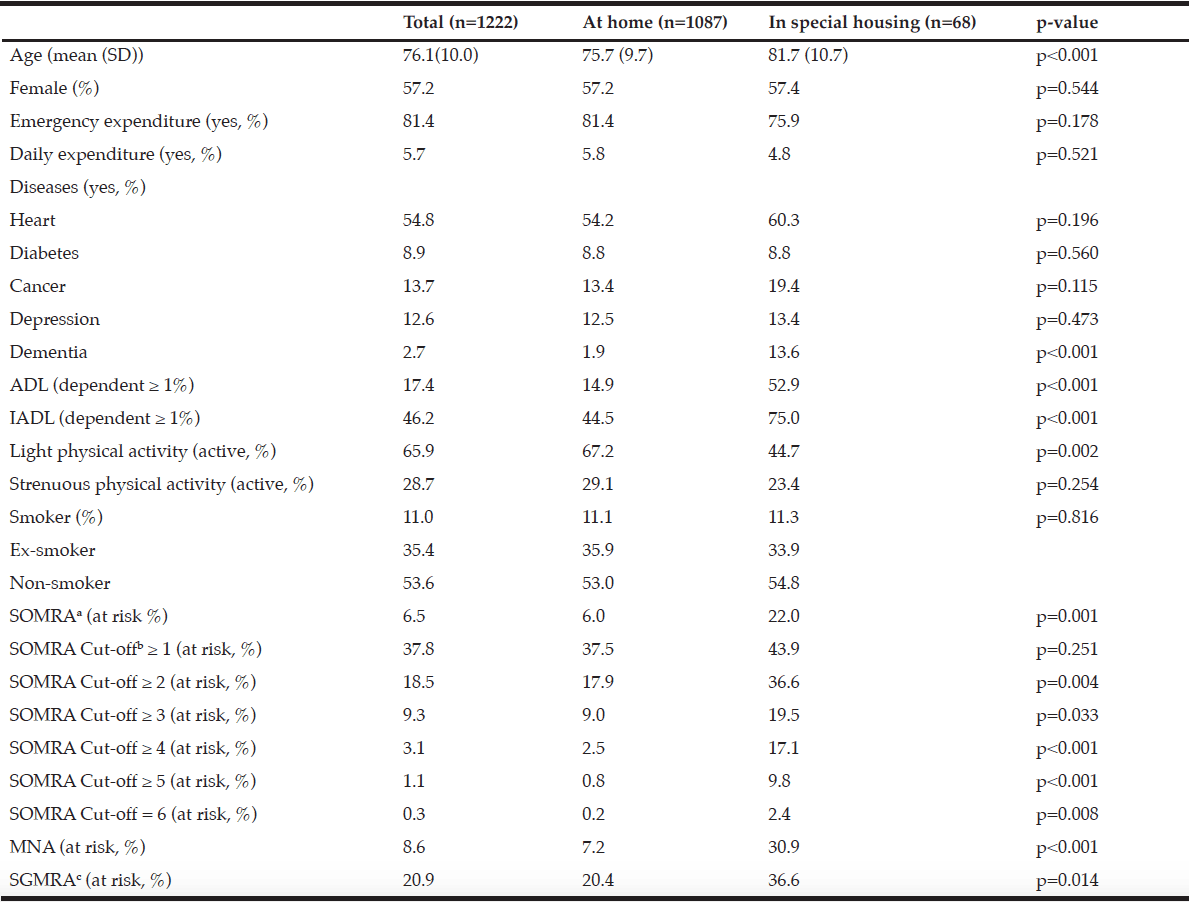
Table 1 Descriptive statistics for the total subject population (n=1222) stratified by housing arrangement

Table 1
Descriptive statistics for the total subject population (n=1222) stratified by housing arrangement

Abbreviations: SD, standard deviation; ADL, activities of daily living; IADL, instrumental ADL; SOMRA, Subjective-Objective Malnutrition Risk Assessment; MNA, mini-nutritional assessment; SGMRA, Swedish Guidelines on Malnutrition Risk Assessment.; Notes: The χ2 test was performed for nominal data and the Mann–Whitney U-test for the ordinal and interval data.  p <0.05 was used to test significance. a. SOMRA: The risk of malnutrition was estimated by the occurrence of at least one anthropometric measure (BMI, MAC, CC) below cut-off, in addition to the presence of at least one subjective measure (declined food intake, weight loss, and eating difficulty); b. The SOMRA cut-offs were independent of subjective or objective criteria; c. The occurrence of at least one state: involuntary weight loss, body mass index (BMI) below a certain limit (< 20 if ≤ 69 years and < 22 if ≥ 70 years) or eating difficulties delineates the risk of malnutrition.


Table 2 Psychometric properties of the SOMRA, the SOMRA cut-offs and the SGMRA for the total population (n=1222)

Table 2
Psychometric properties of the SOMRA, the SOMRA cut-offs and the SGMRA for the total population (n=1222)

Abbreviations: AUROC, area under the receiver-operating curve; J, Youden’s index; PPV, positive predictive value; NPV, negative predictive value; rs, Spearman’s correlation; κ, Cohen’s kappa; SOMRA, Subjective-Objective Malnutrition Risk Assessment; SGMRA, Swedish Guidelines on Malnutrition Risk Assessment; Notes: a. SOMRA: The risk of malnutrition was estimated by the occurrence of at least one anthropometric measure (BMI, MAC, CC) below cut-off, in addition to the presence of at least one subjective measure (declined food intake, weight loss, and eating difficulty); b. The SOMRA cut-offs were independent of subjective or objective criteria.* Correlation was significant at the 0.01 level.


For older people living at home, the SGMRA yielded a higher AUROC (0.83 vs 0.70) and Youden’s index value (0.66 vs 0.41) than did the SOMRA. The SOMRA cut-off ≥ 1 and the SGMRA produced almost the same Youden’s index values (0.60 vs 0.66); however, differences were observed for sensitivity and specificity. The SOMRA cut-off ≥ 1 showed higher sensitivity than the SGMRA (0.94 vs 0.83), but lower specificity (0.65 vs 0.83) for the people living at home. Moreover, the correlation with MNA using kappa for the SOMRA cut-off ≥1 was lower compared to the SGMRA (Table 3).

Table 3 Psychometric properties of SOMRA, SOMRA cut-offs and SGMRA for home-living (n=1087)

Table 3
Psychometric properties of SOMRA, SOMRA cut-offs and SGMRA for home-living (n=1087)

Abbreviations: AUROC, area under the receiver-operating curve; J, Youden’s index; PPV, positive predictive value; NPV, negative predictive value; rs, Spearman’s correlation; κ, Cohen’s kappa; SOMRA, Subjective-Objective Malnutrition Risk Assessment; SGMRA, Swedish Guidelines on Malnutrition Risk Assessment. Notes: a. SOMRA: The risk of malnutrition was estimated by the occurrence of at least one anthropometric measure (BMI, MAC, CC) below cut-off, in addition to the presence of at least one subjective measure (declined food intake, weight loss, and eating difficulty); b. The SOMRA cut-offs were independent of subjective or objective criteria; * Correlation was significant at the 0.01 level.


In special housing, SOMRA and SGMRA showed almost the same AUROC (0.90 vs 0.89), but SOMRA showed higher correlation with MNA (0.78 vs 0.64) and substantial agreement with MNA using kappa (0.77 vs 0.59) than SGMRA. In addition, the Youden’s index values showed that SOMRA had higher validity compared to the SGMRA (0.81 vs 0.68). Moreover, the SOMRA cut-off ≥ 3 was optimal for the special housing group and showed a slightly higher Youden’s index values than did the SOMRA (0.84 vs 0.81). The SOMRA and a SOMRA cut-off ≥ 3 showed the same sensitivity (0.87), but not the same specificity (0.97 vs 0.93). Using Spearman, the correlation was higher between MNA and a SOMRA cut-off ≥ 3 compared to between MNA and SOMRA (rs =0.84 vs 0.78). The agreement between MNA and SOMRA cut-off ≥ 3 was perfect while the agreement between MNA and SOMRA was substantial (κ =0.84 vs 0.77) (Table 4).

Table 4 Psychometric properties of SOMRA, SOMRA cut-offs and SGMRA for special-housing residents (n=68)

Table 4
Psychometric properties of SOMRA, SOMRA cut-offs and SGMRA for special-housing residents (n=68)

Abbreviations: AUROC, area under the receiver-operating curve; J, Youden’s index; PPV, positive predictive value; NPV, negative predictive value; rs, Spearman’s correlation; κ, Cohen’s kappa; SOMRA, Subjective-Objective Malnutrition Risk Assessment; SGMRA, Swedish Guidelines on Malnutrition Risk Assessment; Notes: a. SOMRA: The risk of malnutrition was estimated by the occurrence of at least one anthropometric measure (BMI, MAC, CC) below cut-off, in addition to the presence of at least one subjective measure (declined food intake, weight loss, and eating difficulty). b. The SOMRA cut-offs were independent of subjective or objective;  * Correlation was significant at the 0.01 level.


Furthermore, SOMRA showed good concurrent validity for the special housing group; therefore, a graphical illustration of the ROC curve is given. The cut-off ≥ 3 on SOMRA was optimal for the older people in special housing and gave a slightly higher AUROC curve (0.92 vs 0.90) compared to the SOMRA (Figure 1).
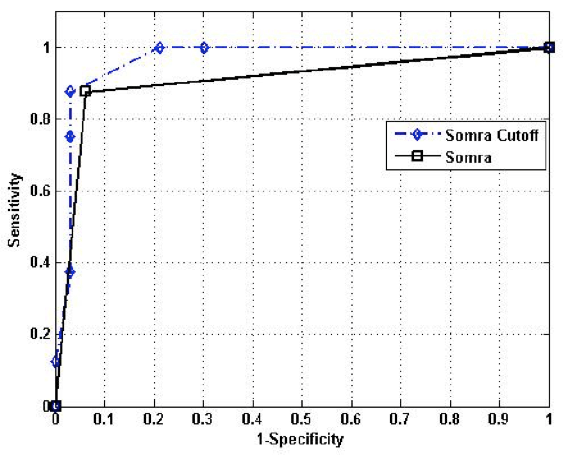
 

Figure 1 The receiver operative characteristics (ROC) curve for the SOMRA and the SOMRA cut-offs for Swedish people aged ≥ 60 years in special housing

Figure 1
The receiver operative characteristics (ROC) curve for the SOMRA and the SOMRA cut-offs for Swedish people aged ≥ 60 years in special housing


The reliability (Cronbach’s alpha) for SOMRA based on six items was 0.71 that was higher than the SGMRA (α = 0.05) based on three items. The Cronbach’s alpha for SOMRA decreased to 0.50 if any of the anthropometric measurement out of six items deleted, and if any of the subjective measurement deleted the value of Cronbach’s alpha improved to maximum 0.74.


Discussion

The risk of malnutrition defined by the MNA, the SOMRA, and SGMRA was 8.6%, 6.5%, and 20.9%, respectively. In the total population, SOMRA showed good reliability, specificity, correlation and moderate agreement with MNA, but not sensitivity. For the older people in special housing, SOMRA showed substantial to perfect concurrent validity with MNA compared to SGMRA’s concurrent validity with the MNA, measured by various statistics; however, this was not true for older people living at home. The SOMRA cut-off ≥ 3 and the cut-off ≥ 1 were optimal for those in special housing and those living at home, respectively.
In this study, the risk of malnutrition was identified as being from 0.3% to 37.8%, according to various nutritional risk assessments. In the total population, the difference between the prevalence of risk of malnutrition reported for the MNA and SOMRA were less than for the SGMRA (8.6%, 6.5% and 20.9%, respectively). The risk of malnutrition defined by MNA and SOMRA in present study is similar with the findings of another study on Swedish older people living at home by using the MNA as a diagnostic instrument (risk = 7.4%) and baseline data collected during approximately the same years (1999-2001) (24) as the present study. However, the risk of malnutrition reported by SGMRA is lower than that reported in another Swedish study (27%) on special housing residents by using SGMRA as a risk assessment instrument (9). The instrument SGMRA is same in both studies but the difference in the risk rate is due to the different subject population. In present study, SGMRA reported highest risk rate than MNA and SGMRA. The SGMRA with three items may be more lenient compared to the SOMRA, which is based on an index developed from six variables (BMI, MAC, CC, reduced food intake, weight loss and need for help when eating). Therefore, in this study SGMRA may have overestimated the risk of malnutrition even though some subjects do not have the risk. This may be inferred from the specificity shown on the SGMRA and the SOMRA (0.83 and 0.96, respectively).
The findings of this study that the risk of malnutrition rate varies when different nutritional risk assessment instruments are used, even for the same subject population are consistent with the results of another study (7). The absence of universally accepted instrument for defining the risk of malnutrition limits the comparison between the prevalence of risk of malnutrition (25). Furthermore, it also makes it difficult to ascertain which instrument is more efficient at correctly defining the risk of malnutrition (7). An important assumption underlying nutritional risk assessment is that the person identified as being at risk of malnutrition will benefit from the risk being detected (12); therefore, it may be useful to detect which instrument efficiently predict the given outcome (7). Thus, future studies are needed to investigate which nutritional risk assessment instrument is most efficient in the prediction of various health outcomes.
The purpose of nutritional risk assessment is to identify the probability of developing or worsening malnutrition under the existing conditions, but the implementation of routine nutritional screening has often been hindered by the absence of universally accepted instrument for defining nutritional risk (6). However, Kondrup and colleagues (6) stated a number of psychometric properties that should be considered while designing or choosing the malnutrition risk assessment instrument, i.e., reliability, validity and practical use. Reliability coefficient shows the internal consistency between the items used in designing an instrument and demonstrates whether the results obtained from this collection of items are reliable (23). SOMRA based on six items showed greater reliability (α = 0.71) than SGMRA (α = 0.05) based on three items. These findings were likely as study sample of present study included both home living and those living in special housing and SOMRA (14) included items recommended for both home living and special housing older people. Interestingly, the reliability coefficient of SOMRA was almost same for home living (α = 0.70) and those living in special housing (α = 0.78); however, reliability coefficient of SGMRA was greater for special housing (α = 0.27) older people than those living in homes (α = 0.04). Thus, SOMRA is a reliable nutritional risk assessment instrument to be used in Swedish older people irrespective of their living arrangement.
Furthermore, for the concurrent validity with MNA, SOMRA showed good AUROC curve (0.72), specificity (0.96), a significant correlation (0.42), but poor sensitivity (0.49) for the total population. The failure to find higher values on Youden’s index in the total population could be due to different optimal cut-offs for those living at home (≥ 1) and those in special housing (≥ 3); also, the majority of the study sample was composed of older people living at home (94.1%). Moreover, MNA, the gold standard used in this study, is a nutritional assessment instrument developed for home care programmes, nursing homes and hospitals (6). The findings of this study that SOMRA has moderate agreement with MNA are similar to another study where Malnutrition Universal Screening Tool (MUST) showed moderate agreement with MNA-SF (7). This moderate agreement is likely, because MUST is a nutritional risk assessment tool recommended for the community dwelling while MNA is recommended for nursing homes and hospitals (6).  Most of the study sample was comprised of home living; therefore, this might be the reason for not providing good concurrent validity of SOMRA with MNA for the total population. This can be deduced from the specific living arrangement analyses, in which SOMRA provided much better concurrent validity with MNA than did the SGMRA for the special housing group, but not for the group living at home. In sum, the comparison between various nutritional risk assessment instruments showed that SOMRA and the SOMRA cut-off ≥ 3 corresponded better with the MNA than did the SGMRA for the people in special housing. However, it remains uncertain which instrument is more robust for the older people living at home. Although the SGMRA showed fair concurrent validity with MNA for the people living at home, but SGMRA (13) and MNA are developed for special housing residents and hospitalized patients (6). Therefore, it may be hard to conclude whether these tools are equally useful for those living at home.
Kondrup et al. (6) stated that to evaluate the usefulness of a nutritional risk assessment instrument, it is also important that it should be practical, i.e., it must be rapid to administer, simple, and purposeful. The SOMRA (14) takes approximately 4 to 5 minutes to administer, compared to MNA, which takes approximately 10 to 15 minutes (19). Moreover, the SOMRA contains 6 items, compared to MNA, which is an 18-item tool; therefore, the SOMRA may place less of a burden on older people. Furthermore, the SOMRA (14) may be simple to administer because it does not require clinical instruments or doctor’s visits and can be administered by a nurse or assistant. However, instruments like a measuring tape and weighing scale are needed and it might be difficult to weigh and measure the length of a bed- ridden older person (12). Furthermore, the SOMRA needs to be performed by a nurse or staff, because it could be difficult for an older person to take MAC and CC measurements by him/herself.
Limitations of this study might include the response of nurses to the use of the SOMRA was not assessed. The sample size of special housing residents was small that may have influenced on the presentation of psychometric properties in the total population and with respect to the living arrangement. Although, the proportion of special housing residents and home living in the sample coincided with the national level of Sweden (26), but the study participants were generally healthier than non-participants. Approximately 10% refused to participate due to poor health; therefore, the risk of malnutrition might be under-represented. In addition, SGMRA used in this study for a comparison with SOMRA might be more clinical measurement in nature (α=0.05) instead an instrument for research purpose.
The strengths of this study include a large representative study sample and living arrangement specific analyses were executed to investigate the psychometric properties of SOMRA in home living and special housing residents. The SOMRA (14) includes three subjective and three anthropometric measures that can show a path from developing (past) to having (present) a risk of malnutrition. Among the subjective measures, inadequate dietary intake and the need for help when eating are indicators of future risk of malnutrition, particularly in older people. Moreover, involuntary weight loss emphasizes the need for routine (e.g., 3 to 6 months) follow-up for weight measurement to reduce the risk of a person becoming malnourished. Furthermore, the inclusion of three anthropometric measurements in the SOMRA may be useful for assessing the present nutritional status and they are more precise than the subjective measures; therefore, may reduce the chance of misclassifying the risk of malnutrition. The anthropometric measurements below cut-off emphasize the need for nutritional treatment/supplementation programmes to reduce the risk of nutrition associated poor health outcomes.


Conclusion

The risk of malnutrition identified by the SOMRA, MNA, and SGMRA was 6.5%, 8.6%, and 20.9%, respectively. These findings showed that various nutritional risk assessment instruments gave different percentages of risk for the same population. Future studies are needed to investigate the outcome-specific validity of each instrument. The observed optimal cut-offs of SOMRA were different for older people in special housing (≥ 3) and those living at home (≥ 1). For older Swedish people in special housing, the SOMRA showed substantial concurrent validity with MNA, the gold standard used in this study, compared to the SGMRA. Moreover, the SOMRA and the SOMRA cut-off ≥ 3 showed almost same substantial concurrent validity with MNA and could be used for older people in special housing. Furthermore, the SOMRA showed good reliability and should be simple to administer, easy to use and place less burden on the subject. The SOMRA may also be used in a clinical setting to suggest whether it is necessary to observe changes in weight over time or whether nutritional support is needed. Thus, SOMRA can be proposed as a reliable, valid and easy to administer nutritional risk assessment instrument for older people living in special housing.


Ethical standards: According to Swedish integrity and security law, informed consent is needed before gathering data on individuals from different sources. For the SNAC-B study, verbal informed consent was obtained for questionnaires and written informed consent was obtained for medical examination. The SNAC-B study was approved by the ethics committee of Lund University (LU 605-00, LU 744-00).

Acknowledgement:  The Swedish National Study on Aging and Care, SNAC (www.snac.org), was financially supported by the Ministry of Health and Social Affairs, Sweden, and the participating county councils, municipalities and university departments. The study was also supported by the Blekinge Institute of Technology.

Conflict of interest: None.


References

1.     Amarantos E, Martinez A, Dwyer J. Nutrition and quality of life in older adults. J Gerontol 2001; 56A (2): 54-64.
2.     Kuczmarski MF, Kuczmarski RJ, Najjar M. Descriptive anthropometric reference data for older Americans. J Am Diet Assoc 2000; 100: 59-66.
3.     Payette H. Nutrition as a determinant of functional autonomy and quality of life in aging: A research program. Can J Physiol Pharmacol 2005; 83: 1061-1070.
4.     Visvanathan R, Macintosh C, Callary M, Penhall R, Horowitz M, Chapman I. The nutritional status of 250 older Australian recipients of domiciliary care services and its association with outcomes at 12 Months. J Am Geriatr Soc 2003; 57: 1007-1011.
5.     Naseer M, Forssell H, Fagerström C. Malnutrition, functional ability and mortality among older people aged ≥ 60 years: a 7-year longitudinal study. Eur J Clin Nutr 2015;  doi:10.1038/ejcn.2015.196
6.     Kondrup J, Allison SP, Elia M, Vellas B, Plauth M. ESPEN guidelines for nutrition screening 2002. Clin Nutr 2003; 22(4): 415-421.
7.     Stratton RJ, Hackston A, Longmore D, Dixon R, Price S, Stround M, King C, Elia, M. Malnutrition in hospital outpatients and inpatients: prevalence, concurrent validity and ease of use of the “malnutrition universal screening tool” (MUST) for adults. Br J Nutr 2004; 92: 799-808.
8.     Johansson L, Sidenvall B, Malmberg B, Christensson L. Who will become malnourished? A prospective study of factors associated with malnutrition in older persons living at home. J Nutr Health Aging 2009; 13(10):855-861.
9.     Westergren A, Lindholm C, Axelsson C, Ulander K. Prevalence of eating difficulties and malnutrition among persons within hospital care and special accommodations. J Nutr Health Aging 2008; 12(1): 39-43.
10.     Wikby K, Ek AC, Christensson L. Nutritional status in elderly people admitted to community residential homes: comparisons between two cohorts. J Nutr Health Aging 2006; 10(3): 232-238.
11.     Saletti A, Johansson L, Yifter-Lindgren E, Wissing U, Österberg K, Cederholm T. Nutritional status and a 3-year follow-up in elderly receiving support at home. Gerentol 2005; 51: 192 –198
12.     Rubenstein LZ, Harker JO, Salva A, Guigoz Y, Vellas B. Screening for undernutrition in geriatric practice: developing the short-form mini-nutritional assessment (MNA-SF). J Gerontol Med Sci 2001; 56(6): M366-M372.
13.     SWESPEN, Swedish Society for Parenteral and Enteral Nutrition. Nutritionsbehandling i sjukvård och omsorg (Nutritional treatment in care and service). In Swedish. http://www.swespen.se/documents/Nutritionshandboken.pdf Accessed 21 Feb 2014.
14.     Naseer M, Fagerström C. Prevalence and association of undernutrition with quality of life among Swedish people aged 60 years and above: results of the SNAC-B study. J Nutr Health Aging 2015; 19(10): 970-979.
15.     Lagergren M, Fratiglioni L, Hallberg IR, Berglund J, Elmståhl S et al. A longitudinal study integrating population, care and social services data. The Swedish National Study on Aging and Care (SNAC). Aging Clin Exp Res 2004; 16: 158-168.
16.     Katz S, Ford AB, Moskowitz RW, Jackson BA, Jaffe MW. Studies of illness in the aged, the index of ADL: a standardized measure of biological and psychosocial function. JAMA 1963; 185: 914–919.
17.     Åsberg KH, Sonn U. The cumulative structure of personal and instrumental ADL: a study of elderly people in a health district. Scand J Rehab Med 1988; 21: 171–177.
18.     Aguero-Torres H, Fratiglioni L, Guo Z, Viitanen M, Strauss EV, Winblad B. Dementia is the major cause of functional dependence in the elderly: 3-year follow-up data from a population-based study. Am J Public Health 1998; 88:1452–1456.
19.     Vellas B, Villars H, Abellan G, Soto ME, Rolland Y, Guigoz Y, Morley JE, et al. Overview of the MNA-its history and challenges. J Nutr Health Aging 2006; 10(6): 456-465.
20.     Landis JR, Koch GG. The measurement of observer agreement for categorical data. Biometrics 1977; 33: 159-174.
21.     Bewick V, Cheek L, Ball J. Statistics review 13: receiver operating characteristics curves. Critical Care 2004; 8(6): 508-512.
22.     Bryman A. Social Research Methods. 2008. 3rd Ed. Oxford University Press Inc, New York.
23.     Cronbach LJ. Coefficient alpha and the internal structure of tests. Psychometrika 1951; 16(3): 297-334
24.     Salminen H, Sääf M, Johansson SE, Ringertz H, Strender LE. Nutritional status, as determined by the Mini-Nutritional Assessment, and osteoporosis: a crosssectional study of an elderly female population. Eur J Clin Nutr 2006; 60: 486–493.
25.     Corish CA, Flood P, Kennedy, NP. Comparison of nutritional risk screening tools in patients on admission to hospital. J Hum Nutr Dietet 2004; 17: 133-139.
26.     The National Board of Health and Welfare. Older-Health and Care The Second Half

HIGH PREVALENCE OF NUTRITION RISK AMONG COMMUNITY LIVING OLDER PEOPLE IN WOERDEN, THE NETHERLANDS


T.A. Haakma, C.A. Wham

The Hague University of Applied Sciences, Johanna Westerdijkplein 75, 2521 EN The Hague, The Netherlands 

Corresponding Author: T.A. Haakma, Student at The Hague University of Applied Sciences, Design and conduct of study, data analysis, writing of manuscript. Breeveld 10a, 3445 BA Woerden, The Netherlands, Telephone: (+31) 0613684251, Email: tinekehaakma@hotmail.nl


Abstract

Background: Undernutrition is a common problem in Dutch older people and may cause increased length of hospitalisation, early institutionalization and decreased quality of life. Nutrition risk precedes undernutrition and can be identified by timely nutritional screening. Design: This cross-sectional study aimed to examine the prevalence of nutrition risk among older people living in the community of Woerden. Measurements: Nutrition risk was assessed using a validated questionnaire: Seniors in the Community: Risk Evaluation for Eating and Nutrition, version II (‘SCREEN II’). Participants: The sample (n=335, mean age 80, age range 75-85) were 32% men, 40% received home care and 46% lived alone. Results: Nutrition risk was present in two thirds (67%) of the respondents (38% ‘at high risk’, 29% ‘at risk’). The most common SCREENII items that led to nutrition risk were a low intake of meat and alternatives (65%), milk products (59%), fruit and vegetables (59%) and eating alone (56%). Those who received home care were 1.8 times more likely to be at nutrition risk than people without home care (p=0.03) and those living alone were 3.3 times more likely to be at nutrition risk than those living with others (p<0.001). Conclusions: Intervention strategies are needed to encourage Dutch older people to take opportunities to eat meals with others and to improve their intake of major food group items. Training of home care staff to identify nutrition problems should be prioritised.

Key words: Nutrition Risk, The Netherlands, older people, SCREEN II, home care. 


Introduction 

Maintaining health and functionality in older people (>65y) is very important for the maintenance of independence (1). The Dutch government aims to keep older people healthy, to allow them to live independently as long as possible in the community with relatively little care (2). To achieve that objective, the government invests in home care staff. The Dutch population is aging, the number of older people will increase rapidly from 2013 (3). Those over 65 years are expected to increase from 2.7 million (16% of the entire population) in 2012 to a maximum of 4.7 million in 2041 (estimated to be 26% of the entire population). In the Netherlands the cost of living in an institution is estimated to be 6.000 to 16.000 euro per person per year more than living at home (4). Among older people who are in transition to move into an institution in the Netherlands the most important reason relates to a decrease in mobility (5). A large increase in institutionalized living older people is projected for those aged over 80 years (6). 

Nutrition is an important determinant of health and functionality in older people (7). Poor nutrition, which refers to an inadequate, unbalanced diet (8) leads to undernutrition (9), which is associated with an increased length of hospital stay, early institutionalization (10), decreased quality of life (11) and may contribute to the development of disease (12). Undernutrition is related to long-term mortality in community dwelling as well as institutionalized older populations (13, 14) and is likely to cause an indirect increase in healthcare costs (10, 15). 

Early recognition of undernutrition is important as nutritional intervention can reduce complications and further impairment of nutritional status (14, 16). Undernutrition is preceded by a state of nutrition risk, which can be identified by nutrition risk screening (17). Among Dutch older people almost a third (29.5%) is at risk of undernutrition in chronic care institutions (living, care and wellbeing institutions, mean age 83.6) and 22.7% are at risk of undernutrition in home care settings (mean age 79.0) (18). Using the SNAQ-criteria (Short Nutrition Assessment Questionnaire 65+), 9.2% of Dutch older people receiving home care were identified to be at nutrition risk compared to 7.7% without home care (mean ages 81.6 and 77.3 years, respectively) (14). 

The current prevalence of nutrition risk amongst independently living older people in The Netherlands is unknown. The aim of this study was to assess the prevalence of nutrition risk of community dwelling older people, identify common risk factor items and compare nutrition risk status of those with and without home care.

Methods 

Participants

A cross-sectional study was undertaken amongst older people from the community of Woerden. Woerden is considered to be a typical community in The Netherlands on the basis of population structures such as age, gender, income, and nationality. Inclusion criteria for recruitment were age 75-85 years (born between 1929 to1939) and  Dutch nationality. The sample size was set for 334 older people within the age range of 75-85 years, applying 95% reliability and 5% margin of error. 

Participant recruitment

Participants responded to advertisements in two regional newspapers, through home care staff working in the community, by participant acquaintances and direct contact through arranged activities across the Woerden community for older people.  

The Medical Ethics Review Committee (METC, UMC Utrecht) deemed the study to be of low risk and therefore an official approval of the study was not required under The Medical Research Involving Human Subjects Act (WMO) (reference number WAG/th/14/020125). 

Data collection

Data collection was undertaken by a postal survey in April/May 2014. Participants completed a questionnaire sent to their private home (20.5%), in groups of people, facilitated by the activity arranging organisation ‘Welzijn Woerden’ (44.4%), by face to face interviews with the researcher (29.5%) or by email (5.6%).

The questionnaire 

The questionnaire consisted of 23 items, 6 items for personal characteristics and home care, 3 items for evaluation of their acquaintance with the study and 14 items for an assessment of nutrition risk. Nutrition risk was measured using a Dutch translation of the validated questionnaire ‘Seniors in the Community: Risk Evaluation for Eating and Nutrition, version II’ (SCREEN II) with questionnaire items about weight change, food intake and risk factors for food intake. For each item the scores ranged from zero to four and the maximum score was 64. The total score was categorized as: ‘not at risk’ (score ≥54), ‘at risk’ (score= 50-53) or ‘at high risk’ (score ≤49) (19). Participants ‘at risk’ or ‘at high risk’ were referred to a physician or dietitian.

Statistical analysis 

Descriptive statistics were completed for demographic items, living situation and professional home care data. The univariate associations between nutrition risk category and the variables gender, living situation and professional home care were tested by Pearson chi-square tests and odds ratios. Multivariate binary regression analysis was used to show whether the associations were maintained when all variables were included (gender, living situation and home care). Pearson Chi-square test was used to determine differences in nutrition risk items for participants who received home care versus who did not. P value below 0.05 was considered as significant. Statistical analyses were performed with SPSS 22.0 for Mac. 

Results

Participant characteristics

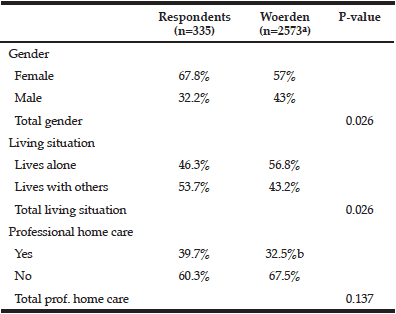
There were 335 participants included in the study, with a mean age of 79.9 (± 2.96) years (Table 1). There were more women (68%) and fewer participants lived alone (46%) compared to the population of 2573 older people aged 75 to 85 living in Woerden (Table 1). A total of 40% of the participants received professional home care, which was similar to the Woerden community.


Table 1 Participants characteristics

a. On the 13th of May 2014, information about population obtained by contact with Town Council and includes people living in institutions (n=59); b. Based on the percentage of valid AWBZ indications in Woerden on the 1st of January 2013 and number of people who receive refund for help with domestic chores on the 27th of May 2014.  AWBZ indications are statements for the right to receive chronic care (27).


Nutrition risk

Nutrition risk status was assessed in 335 participants. For 17 respondents (5.1%) a score could not be assigned due to missing data. Using the SCREEN II questionnaire 38.4% of the respondents were ‘at high risk’ (SCREEN II score ≤49), 28.6% were ‘at risk’ (SCREEN II score 50-53) and 33.0% were ‘not at risk’ (SCREEN II score ≥54) (Table 2). Half (50.8%) of the older people who received home care were ‘at high risk’ compared to 27.7% of people who did not receive home care. Participants more likely to be at high nutrition risk were of female gender (p=0.026), living alone (p<0.001) and receiving professional home care (p<0.001). (Table  5).

Table 2 Nutritional risk groups according to SCREEN II by gender, living situation and professional home care


Participants in the categories ‘at risk’ and ‘at high risk’ were combined for further analysis. Significant univariate associations were observed for living situation and home care (Table 3). People living alone were 3.31 times more likely to be at risk than people living together. People who received home care were 2.18 times more likely to be at risk than people who do not receive home care. In the multivariate model (Table 4) the association between living alone and high nutrition risk persisted (controlled for gender and home care). The univariate associations between the variables gender and home care and nutritional risk were not maintained in the multivariate model. 


Table 3 The odds ratiosa for gender, living situation and home care for those ‘Not at risk’ versus combined risk group)

a. Within the brackets, the 95% confidence intervals are displayed


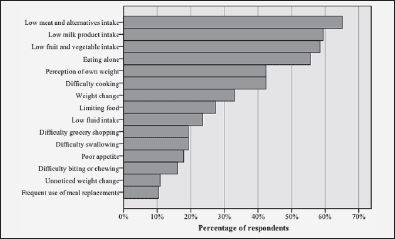
Figure 1 shows the frequency of SCREENII nutrition risk items for those at risk. The six main nutrition risk items were low meat and alternatives intake (65.1%), low milk product intake (59.4%), low fruit and vegetable intake (58.5%), eating alone (55.7%), perception of own weight and difficulty cooking (both 42.5%). 


Figure 1 Nutrition risk items for participants at nutrition risk


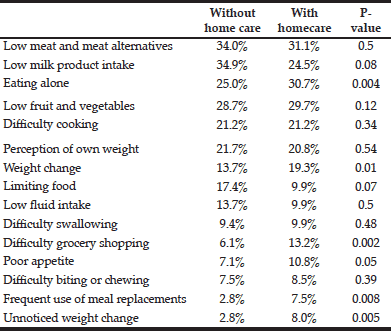
Table 5 shows nutrition risk items for people who do and don’t receive home care. Those who receive home care are significantly more often at risk for eating alone, weight change, difficulty with grocery shopping, poor appetite, frequent use of meal replacements and unnoticed weight change.

Table 4 The odds ratiosa for gender, living situation and home care for those ‘At risk’ versus ‘At high risk’

a. Within the brackets, the 95% confidence intervals are displayed.


Table 5 Nutrition risk itemsa for respondents in the combined risk group who do and don’t receive professional home care

a. SCREEN II items with scores less than or equal to two out of a maximum of four potentially lead to nutrition risk (19)


Discussion

This is the first Dutch study to identify the prevalence of nutrition risk among older people in the community using SCREEN II. Amongst people in Woerden over a third (38.4%) were at high nutrition risk. Previously, Schilp et al. (2012) identified 7.7% of older Dutch community dwelling people were at nutrition risk using SNAQ65+-criteria. The discrepancy in nutrition risk prevalence may be due to differences in measures employed by the screening tools. The SNAQ65+ was validated by 6/15 year-mortality risk (20) and the SCREEN II is validated against the criterion of a dietitians clinical judgement of risk (Keller et al. 2005). The AUC (‘area under the curve’) of the SNAQ65+ was overall poor (55%) because people die of various other reasons than undernutrition (20). The AUC for SCREEN II was 82% and has been shown to have high inter-rater and test-retest reliability as well as excellent sensitivity and specificity in detecting malnutrition (19). The SCREEN II tool has also been identified to be more suitable for use in community dwelling older people compared to the SNAQ in general (21).

Nutrition risk items such as low intakes of meat and alternatives), milk products fruit and vegetables and eating alone found in the present study, are commonly occurring risk factors (17, 22).  Low intake of fruit and vegetables and milk products has previously been reported in the Dutch National Food Consumption Survey Older Adults 70+ 2010-2012. Also, the survey concluded that Dutch older people (mean age 77.5) consumed less meat compared to people in their fifties or sixties (23). Meat and milk products provide over half (53%) of the dietary protein for Dutch older people. Dietary protein is important for preserving bone and muscle mass in older adults (24).

Half (50.8%) of older people who received home care in Woerden, were at high nutrition risk. Similarly using the MNA (Mini Nutritional Assessment) other European studies, from Finland and Germany, reported half of older people receiving home care were at nutrition risk (25, 26). Home care is indicated for people who have a functional disability (27).  People with functional disabilities have an increased risk of undernutrition and the dietary intake of energy protein and vegetables may be lower than those without impaired function (23). A low intake of major food group items in those with and without home care in this study suggests those living in the community need to be screened for nutrition risk and provided with appropriate nutrition support. 

In this study people who lived alone and received home care were the most nutritionally vulnerable and are an easily identifiable group. Using SCREEN II, previous studies also indicate that living alone is associated with nutrition risk among older people in Canada (28), Sweden (29) and  New Zealand (17, 30). Older people living alone usually eat less than those who have the opportunity to share their meals (31).

The cross sectional design of this study does not allow us to comment on causality in factors related to nutrition risk and the findings should be interpreted cautiously. The participants involved in this study were representative of the population in Woerden on the basis of age, gender and living situation. Therefore, the findings are indicative of the nutritional risk status among older people in communities within The Netherlands. The validity of the SCREENII tool might be questionable from translation to Dutch. Although the tool was checked for comprehension, it is recommended that the SCREENII tool is validated for Dutch older people. As the SCREENII tool is suitable for self-administration and identifies nutrition risk factors screening for nutrition risk in community living older people could be cost-effective. The Dutch government has invested in a in a four-year program called ‘Visible link’, for employment of home care staff in order to keep older people living at home (32, 33). If the prevalence of nutrition risk remains unchanged, the absolute numbers of undernutrition in Dutch older people who receive home care will increase. The development of an intervention to prevent nutrition risk through home care staff could be effective to diminish nutrition risk.  Another possibility is implementation of a digital version of SCREEN II, an intervention already active in Canada, known as Nutri-eScreen© (34). This e-version of the nutrition questionnaire provides feedback on which risk factor items are in need for improvement and could be very useful for older people and their carers for early identification of nutrition risk. 

This study concludes that there are relatively high levels of nutrition risk among older community dwelling Dutch people aged 75 to 85 years living in Woerden. A low intake of essential food groups have been identified as important risk factors items.  In order to maintain the independence of the older population it is recommended that older people are screened regularly for nutrition risk and, where necessary, effective nutrition intervention is provided.


Acknowledgements and funding: Not applicable. No funding, no acknowledgements.

Conflict of interest: The authors declare no financial conflicts of interest.


References

1. Beswick AD, Rees K, Dieppe P, Ayis S, Gooberman-Hill R, Horwood J, et al. Complex interventions to improve physical function and maintain independent living in elderly people: a systematic review and meta-analysis. The Lancet. 2008;371(9614):725-35.

2. Government of The Netherlands. Ouderen langer thuis wonen (Older people living independently) The Hague2015 [cited 2014 19 March]. Available from: http://www.rijksoverheid.nl/onderwerpen/ouderenzorg/ouderen-langer-zelfstandig-wonen.

3. Giesbers H, Verweij A, Beer Jd. Vergrijzing: Wat zijn de belangrijkste verwachtingen voor de toekomst? (Aging: What are the most important expectations for the future?). Bilthoven: RIVM (National Institute for Public Health and the Environment), 2013.

4. Kok L, Stevens J, Brouwer N, van Gameren E, Sadiraj K, Woittiez I. Kosten en baten van extramuralisering (Costs and benefits of extramuralization). The Hague: 2004 90-377-0187-6.

5. Brands M, Zijderveld C. Ouderen op de grens van zelfstandig wonen naar verblijf (Older people in transition of independent living to living in an institution). Utrecht/ Woerden: NPCF/ ANBO, 2012.

6. CBS Statline. Personen in huishoudens naar leeftijd en geslacht, 1 januari (Persons in households by age and gender, January 1st) The Hague2013 [cited 2014 15 March]. Available from: http://statline.cbs.nl/StatWeb/publication/?DM=SLNL&PA=37620&D1=0,3-4,11&D2=0&D3=110-116&D4=15,l&HDR=T,G3&STB=G1,G2&W=T.

7. Kuczmarski M, Weddle D. Position paper of the American Dietetic Association: nutrition across the spectrum of aging. Journal of the American Dietetic Association. 2005;105(4):616-33.

8. World Health Organization. Nutrition 2015 [cited 2014 7 April]. Available from: http://www.who.int/topics/nutrition/en/.

9. Shetty P. Malnutrition and undernutrition. Medicine. 2003;31(4):18-22.

10. Correia MIT, Waitzberg DL. The impact of malnutrition on morbidity, mortality, length of hospital stay and costs evaluated through a multivariate model analysis. Clinical Nutrition. 2003;22(3):235-9.

11. Amarantos E, Martinez A, Dwyer J. Nutrition and Quality of Life in Older Adults. The Journals of Gerontology Series A: Biological Sciences and Medical Sciences. 2001;56(2):54-64.

12. Mowe M, Bøhmer T, Kindt E. Reduced nutritional status in an elderly population (> 70 y) is probable before disease and possibly contributes to the development of disease. The American Journal of Clinical Nutrition. 1994;59(2):317-24.

13. Vischer UM, Frangos E, Graf C, Gold G, Weiss L, Herrmann FR, et al. The prognostic significance of malnutrition as assessed by the Mini Nutritional Assessment (MNA) in older hospitalized patients with a heavy disease burden. Clinical Nutrition. 2012;31(1):113-7.

14. Schilp J, Kruizenga HM, Wijnhoven HA, Leistra E, Evers AM, van Binsbergen JJ, et al. High prevalence of undernutrition in Dutch community-dwelling older individuals. Nutrition. 2012;28(11):1151-6.

15. Meijers JM, Halfens RJ, Wilson L, Schols JM. Estimating the costs associated with malnutrition in Dutch nursing homes. Clinical Nutrition. 2012;31(1):65-8.

16. Elia M, Zellipour L, Stratton R. To screen or not to screen for adult malnutrition? Clinical Nutrition. 2005;24(6):867-84.

17. McElnay C, Marshall B, O’Sullivan J, Jones L, Ashworth T, Hicks K, et al. Nutritional risk amongst community living Maori and non-Maori older people in Hawke’s Bay. Journal of Primary Health Care. 2012;4(4):299-305.

18. RIVM. Zorgbalans (Dutch Health Care Performance) 2013 [cited 2014 13 March]. Available from: http://www.gezondheidszorgbalans.nl/kwaliteit/effectiviteit-van-langdurige-zorg/ondervoeding/.

19. Keller H, Goy R, Kane S. Validity and reliability of SCREEN II (Seniors in the community: risk evaluation for eating and nutrition, Version II). European Journal of Clinical Nutrition. 2005;59(10):1149-57.

20. Wijnhoven HA, Schilp J, de Vet HC, Kruizenga HM, Deeg DJ, Ferrucci L, et al. Development and validation of criteria for determining undernutrition in community-dwelling older men and women: The Short Nutritional Assessment Questionnaire 65+. Clinical Nutrition. 2012;31(3):351-8.

21. Phillips MB, Foley AL, Barnard R, Isenring EA, Miller MD. Nutritional screening in community-dwelling older adults: a systematic literature review. Asia Pacific Journal of Clinical Nutrition. 2010;19(3):440.

22. Keller HH, Hedley MR. Nutritional risk needs assessment of community-living seniors: prevalence of nutrition problems and priorities for action. Journal of community health. 2002;27(2):121-32.

23. Ocke MC, Buurma-Rethans E, De Boer E, Wilson-van den Hooven C, Etemad-Ghameslou Z, Drijvers J, et al. Diet of community-dwelling older adults: Dutch National Food Consumption Survey Older adults 2010-2012. RIVM (National Institute for Public Health and the Environment), 2013 050413001.

24. Genaro PDS, Martini LA. Effect of protein intake on bone and muscle mass in the elderly. Nutrition reviews. 2010;68(10):616-23.

25. Soini H, Routasalo P, Lagström H. Characteristics of the Mini-Nutritional Assessment in elderly home-care patients. European Journal of Clinical Nutrition. 2004;58(1):64-70.

26. Kiesswetter E, Pohlhausen S, Uhlig K, Diekmann R, Lesser S, Heseker H, et al. Malnutrition is related to functional impairment in older adults receiving home care. The Journal of Nutrition, Health and Aging. 2013;17(4):345-50.

27. CIZ Care Needs Assesment Centre. CIZ Basisrapportage AWBZ – Gemeente Woerden (Care Assesment Center basic report of the Exceptional Medical Expenses Act – Community Woerden). Woerden: 2013.

28. Ramage-Morin PL, Garriguet D. Nutritional risk among older Canadians. Statistics Canada, 2013  Contract No.: 3.

29. Westergren A, Hagell P, Hammarlund CS. Malnutrition and risk of falling among elderly without home-help service—a cross sectional study. Journal of Nutrition, Health and Aging. 2014;18(10):905-11.

30. Wham CA, Teh R, Robinson M, Kerse N. What is associated with nutrition risk in very old age? Journal of Nutrition, Health and Aging. 2011;15(4):247-51.

31. Salvà A, Pera G. Screening for malnutrition in dwelling elderly. Public Health Nutrition. 2001;4(6a):1375-8.

32. Government of The Netherlands. Uitvoering Motie Hamer (Implementation motion ‘Hamer’). In: Sport MoHWa, editor. The Hague2008.

33. ZonMw. Zichtbare schakel. De wijkverpleegkundige voor een gezonde buurt. (Visible link. The community nurse for a healthy neighbourhood) 2008 [cited 2014 19 March]. Available from: http://www.zonmw.nl/nl/programmas/programma-detail/zichtbare-schakel-de-wijkverpleegkundige-voor-een-gezonde-buurt/.

34. Dietitians of Canada. Eating habits survey 2015 [cited 2015 2 March]. Available from: http://www.nutritionscreen.ca/escreen/.

ASSOCIATION BETWEEN ANEMIA, PHYSICAL PERFORMANCE, DEPENDENCY, AND MORTALITY IN OLDER ADULTS IN THE NORTH-WEST REGION OF RUSSIA


A. Turusheva1, E. Frolova2, E. Korystina2, D. Zelenukha2, P. Tadjibaev2, N. Gurina2, J.M. Degryse1,3


1. Institut de Recherche Santé et Société Université Catolique de Louvain, Brussels, Belgium; 2. The North-Western State Medical University named after I.I. Mechnikov, St. Petersburg, Russia; 3. Department of Public Health and Primary Health Care, KULeuven, Leuven, Belgium

Corresponding Author: J.M. Degryse, Institut de Recherche Santé et Société Université Catolique de Louvain, Brussels, Belgium, jean-marie.degryse@uclouvain.be


Abstract

Abstract: Objective: To assess the prevalence of anemia and its impact on physical performance, dependency, and mortality in older adults in the north-west region of Russia.

http://pharmacyincanada-onlineon.com/ \ buy cialis online \ generic viagra \ buy viagra \ generic viagra online \ cialis tadalafil \ buying viagra online \ buy generic cialis \ http://pharmacycanadian-onlinein.com/ \ buy online cialis

Design: A population-based prospective cohort study. Setting: A random sample of the population living in the Kolpino District. Participants: A total of 611 community-dwelling individuals aged 65 years and older. Measurements: Hemoglobin, gender, age, comorbidity, creatinine, C-reactive protein, body mass index, the Mini Nutritional Assessment, the Short Physical Performance Battery, grip strength, the Barthel Index, the Mini-Mental State Examination, and the 15-item Geriatric Depression Scale were measured/administered. A second screening was organized after 33.4±3 months. The total observation time was 47 ± 14.6 months. Results: The prevalence of anemia was higher in men (21.4%) than in women (18.6%). After adjustment for age, gender, nutritional status, creatinine levels, mental impairment, and various comorbid conditions, significant associations were found between anemia and dependency [OR(95% СI) = 1.798 (1.068 – 3.029); p = 0.027], lower physical performance [ β(95%CI) = -0.717 (-1,334 – -0.100); p = 0.023], and greater risk of mortality [HR (95%CI) = 1.871 (1.284 – -2.728); p = 0.001]. Participants with anemia and CRP levels > 5 had a higher risk of mortality compared with anemic participants with lower CRP levels [HR (95%CI) = 3.417 (1.869 – 6.245); p = 0.000]. Conclusion: The estimated prevalence of anemia in the population aged 65 years and older is 19.3% (95%CI = 15.99 – 23.13). Anemia is associated with poor physical performance and dependency and is an independent predictor of mortality in older individuals.

Key words: Anemia, physical performance, dependency, risk mortality, older people.

Abbreviations: BMI: Body mass index; CI: Confidence interval; COPD: Chronic obstructive pulmonary disease; CRP: C-reactive protein; CVD: Cardiovascular disease; GDS15: 15-item Geriartirc Depression Scale; Hb: Hemoglobin; IQR: Interquartile range; HR: Hazard ratio; MCH: Mean corpuscular hemoglobin; MCV; Mean corpuscular volume; MMSE: Mini Mental State Examination; MNA: Mini Nutritional Assessment; OR: odds ratio; SPPB: Short Physical Performance Battery; T0:Date of the first screening; T1:Date of the second screening; T2 The last update of mortality data; WHO: World Health Organisation; USA: United States of America.


Introduction

The world population is aging rapidly. Since 1980, the number of people aged 60 y and over has doubled to approximately 810 million. The elderly population will continue to grow to approximately 2 billion in 2050. It has been predicted that 22% of the total population will be older than 60 y and 4.4% will be older than 80 y in 2050 (1). Unavoidably, this so-called ‘gray epidemic’ will lead to higher burdens of chronic disease, functional decline and disability in many countries challenging health-care and social security programs.

The improved life expectancy in many countries is related to the impressive decrease in mortality from cardiovascular diseases. In contrast to other countries, despite the increase in life expectancy, Russia has higher cardiovascular morbidity (2) and mortality (2) rates and a shorter average life expectancy than those found in Europe and the USA. According to the Federal State Statistics Service of Russia, the average life expectancy in Russia in 2012 was 63.8 years for men and 75.5 years for women (3). According to data from the Ministry of Health of the Russian Federation, the general mortality rate in 2012 was 1,431 per 100,000 people. The mortality rate from cardiovascular diseases was 811.7 per 100,000 people, which is twice the rate found in the European Union (EU) (approximately 400 per 100,000) (4, 5).

All of these statistics suggest the importance of evaluating people older than 65 years of age in Russia compared with other developed European countries. In a previous report based on the ‘‘Crystal’’ study, it was shown that almost all of the participants had cardiovascular diseases, but none received statins; only some of the participants received antihypertensive drugs and acetylsalicylic acid (6, 7). Therefore, the growing population of older individuals who are survivors of cardiovascular mortality without receiving necessary medical and surgical treatment is, from a scientific perspective, a very interesting group for different studies and comparison with other populations. The World Health Organization (WHO) definition of anemia is a hemoglobin concentration <130 g/L in men and <120 g/L in women. Numerous studies on the prevalence of anemia in the elderly have been published, but the prevalence of anemia is different in each of these studies and is dependent on the type of populations studied, the sample sizes, and the methodologies used. According to WHO data during 1993-2005, the number of individuals suffering from anemia world-wide was 1.62 billion (95% confidence interval [CI]: 1.50 – 1.74 billion), which corresponds to 24.8% of the population (95% CI: 22.9% – 26.7%) (8).

Multiple studies have demonstrated that anemia is an independent risk factor for increased morbidity and mortality, decreased quality of life, depression, dementia, delirium (in hospitalized patients), immune dysfunction, cardiovascular disease, cerebral thrombosis, and decreased bone density (and, consequently, fractures). Anemia has also been associated with a progressive decline in physical performance over time, an increased susceptibility to falling, and frailty in community-dwelling older individuals (9-15).

National data on the prevalence and causes of anemia in the older population in Russia are unavailable (3). Additionally, neither the prevalence , neither die association with adverse outcomes of mild anemia has ever been studied in the older Russian population.

The aim of our study was to assess the prevalence of anemia in general and mild anemia in particular and its impact on physical performance, dependency, and mortality in older adults in the north-west region of Russia, a specific population with a high burden of CVD.

Methods

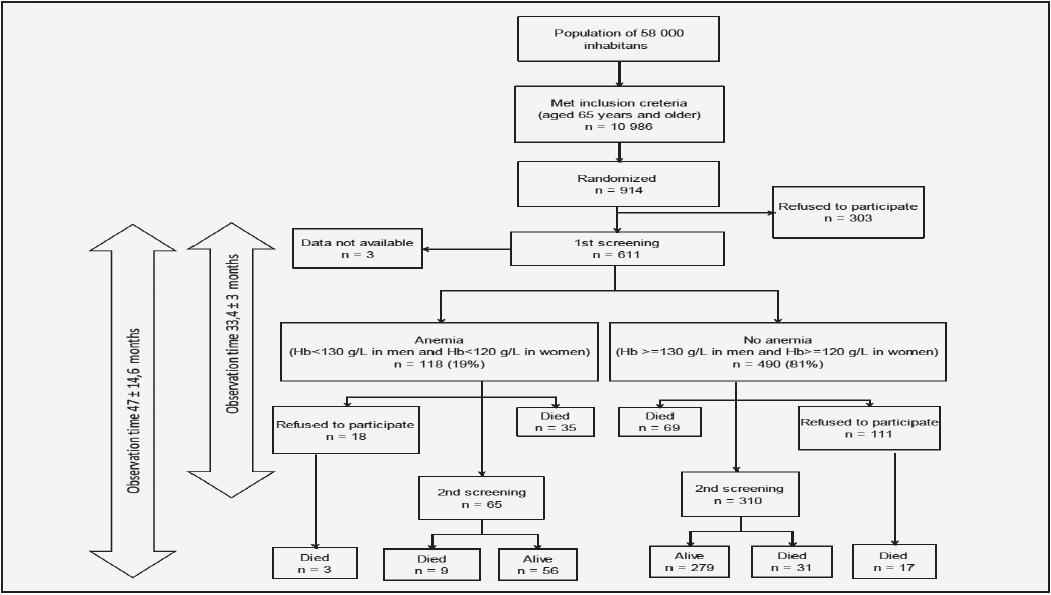
The Crystal study is a prospective cohort study of community-dwelling individuals aged 65 years and older living in the Kolpino District of St. Petersburg. A primary care clinic (Policlinic no. 95) serves a population of 58,000 inhabitants based on a territorial concept of administration. Of that population, 10,986 are aged 65 years and older. A random sample of 914 individuals was selected, but 303 people refused to participate before the start of the study. No one was excluded based on health or cognitive function. Selected individuals were invited to participate by telephone. Some people who were unable to come to the Policlinic were examined at home. The local ethics committee of the Medical Academy for Postgraduate Studies approved the study, and informed consent was obtained from all respondents. All data were collected from March to December 2009 (T0). The details regarding sampling and data collection were described in previous publications (6, 7).

A second screening (T1) was performed an average of 33.4±3 months after the date of the first screening. All patients who survived and consented underwent the same examination that was performed in the first screening.

The average total observation period of the study was 47 ± 14.6 months (Figure 1).

Figure 1 Flowchart detailing the data available for survival analysis and the data available for physical and mental decline analysis from the Crystal cohort


Main study parameters

Hemoglobin was determined using the cyanide-free hemoglobinometry method on the Abbott Cell-Dyn 3700 hematology analyzer. The following normal reference ranges for hemoglobin (venous blood) were used: 130–170 g/L for men and 120–150 g/L for women. All patients with anemia were divided into three groups: mild anemia was defined as a hemoglobin level of 100–119 g/L in women and 100–129 g/L in men, moderate anemia as a level of 80–109 g/L in both genders, and severe anemia as a level lower than 80 g/L in both genders.

Outcome measures

Mortality data were obtained from the official dataset of Policlinic no. 95. The last update was made in February 2014 (T2).

Physical performance

The Short Physical Performance Battery (SPPB) consists of timed measures of the following activities: quickly walking, rising from a chair, putting on and taking off a cardigan, and maintaining balance in a tandem stand (15). The activities were timed by specially trained clinical research assistants who were blinded to the laboratory results of the participants. Categories were created for each set of performance measures to allow for analysis of data from participants who were unable to perform a given task. For the walking, chair-stand, and cardigan tests, those who could not complete the tasks were assigned a score of 0. Those who completed the tasks were assigned a score between 1 and 4 based on the gender- and age-specific quartiles of the distribution of speed of all participants. A score of 4 corresponded to the highest (fastest) quartile. For the tandem-stand balance test, a score of 0 was assigned to those who were either unable to perform the test or who could only maintain the tandem stand for less than 3 seconds. Those who could maintain a tandem stand for longer than 3 seconds but less than 10 seconds were assigned a score of 1; those who could maintain a tandem stand for 10 seconds or more were assigned a score of 2. A summary performance scale (ranging from 0–14) was created by summing the scores from the individual tests (15-16).

The grip strength test was used to measure the maximum isometric strength of the hand and forearm muscles. The test was conducted using a carpal dynamometer (DK-50, Nizhni Tagil, Russian Federation). The maximum reading (kg) from three attempts for each hand was recorded separately, and the average of the left and right scores was calculated and used for further analysis. The cutoff value used to indicate poor strength was the lowest gender-specific quartile value (17).

Dependency

The Barthel Index of activities of daily living was used to determine the baseline level of functioning and, consequently, the degree of dependence. The cutoff for dependency was defined as a score of less than 95 (18).

Mental status

The 15-item Geriatric Depression Scale (GDS-15) was used to screen for depressive symptoms. A person with a total score greater than 5 is considered to be at risk for depression (19-20).

The Mini-Mental State Examination (MMSE) was used to determine cognitive impairment. The cutoff value for cognitive ability is 24, but it is also useful to study the degree of impairment. Therefore, participants were classified into four categories (25–30, normal mental status; 21–24, mild cognitive impairment; 10–20, moderate cognitive impairment; and 0–9, severe cognitive impairment) (21).

Mental and physical decline

Relevant declines in the MMSE, SPBB, and average grip strength scores from both hands were determined using the Edwards-Nunnally index (22). This index is used to determine the probability of a substantial individual change and avoids the problem of regression to the mean. Based on the scale reliability and the 95% CI of the mean score at T0, the index is used to assess whether a significant change has occurred between T0 and T1. Subjects who shifted from GDS-15<5 at baseline to GDS-15≥5 at T1 were defined as having a significant worsening in depression status. New incident occurrences of dependency were defined as shifts in Barthel index scores to less than 95.

Physical decline was considered to be present when a study participant showed a significant decline in the score of at least one of the three tests (the Barthel Index of activities of daily living, the SPBB, and average grip strength of both hands). Mental decline was considered to be present when a participant presented a decline in the score of at least one of the two tests (the MMSE or GDS test).

Covariates

Nutritional status

Nutritional status was evaluated using the Mini Nutritional Assessment (MNA) questionnaire and body mass index (BMI) (23, 24). Weight was measured using either a stationary calibrated medical scale at the Policlinic or a calibrated bathroom scale at home. The cutoff value used in the analysis of BMI was 23 kg/m2. A MNA score between 17.0 and 23.5 was interpreted as indicating a risk for malnutrition, and a score less than 17.0 was considered an indicator of frank malnutrition.

Comorbidity

Details of past and current medical problems were collected based on anamnesis or information presented in the medical records. Information on angina pectoris, myocardial infarction, arrhythmias, peripheral artery disease, stroke, obstructive pulmonary disease or asthma, diabetes mellitus, cancer, osteoarthritis, and rheumatoid arthritis was systematically documented. A disease count was used as an index of comorbidity.

Laboratory tests

Laboratory tests included measures of creatinine and C-reactive protein (CRP) levels. Creatinine was determined by the Jaffe reaction method using the Roche Hitachi 912 chemistry analyzer. CRP was determined by the immunoturbidimetric method using the Roche Hitachi 912 chemistry analyzer. The following normal reference ranges for each laboratory test were used: hemoglobin (venous blood), 130 -170 g/L for men and 120 – 150 g/L for women; creatinine, 53 -106 mmol/L for men and 44 -88mmol/L for women; CRP, 0 – 5 mg/L for both sexes.

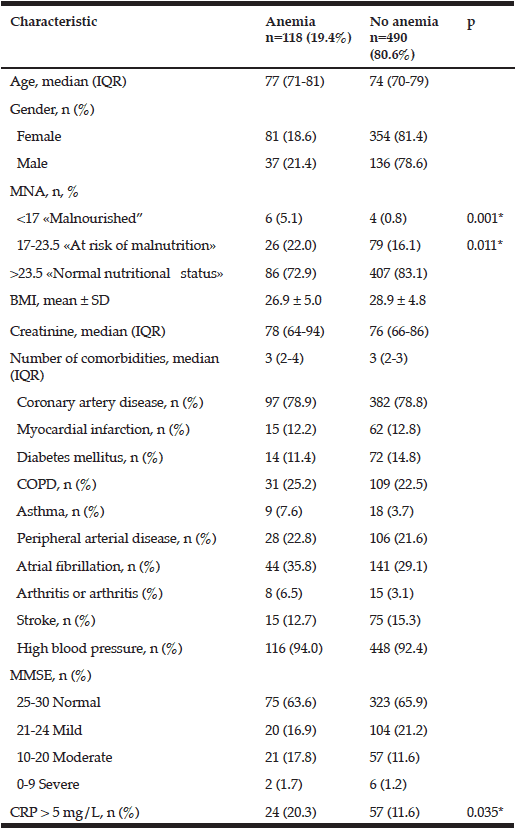
Statistical analyses

All statistical calculations were performed using the SPSS 20.0 (SPSS Inc., Chicago, IL, USA) and MedCalc 11.5.00 (Medcalc Software, Oostende) software. Desciptive statistics are presented as the mean ± standard deviation (SD) or median with inter-quartile range [IQR]. Differences between participants with and without anemia at baseline were compared using Student’s t test and the Mann–Whitney U test (for continuous variables) or chi-square test (for categorical variables). To assess the correlation of anemia with physical performance at baseline taking into account the influence of gender, nutritional status, and comorbidity, we used linear regression models. In the first model, we estimated the association of age and gender with the SPPB scores used as a dependent variable. The second model included the same variables as the first model, but we added creatinine and the assessment of nutritional status. In the third model, we added adjustments for the MMSE score and co-morbidities. The fourth model included additional adjustment for high CRP levels. To assess the association of anemia with the Barthel Index (<95), we used multiple logistic regression with models similar to those used for the Physical Performance Battery. Variables were first checked for multicollinearity.

Kaplan-Meier curves were used to visualize the survival analysis, and significance was evaluated using the log-rank test. We used Cox proportional hazard models to investigate the association between prevalent anemia at baseline and mortality with adjustments for the same models as those used to estimate physical function and dependency in basic activities of daily living.

Results

The prevalence of anemia

Blood samples from 608 subjects were available for analysis at baseline (fig 1). Thirty-seven men and 81 women met the criteria for anemia, which corresponded to 19.3% (95%CI = 15.99–23.13) of the population aged 65 years and older. A total of 113 (96%) participants had mild anemia, 4 (3%) had moderate anemia, and 1 (1%) had severe anemia. The prevalences of anemia among men and women were 21.4% and 18.6%, respectively, but this different was not significant. The mean (±SD) serum hemoglobin level was 120 (± 6.79) g/L in men with anemia and 145 (±10.66) g/L in men without anemia. The mean (±SD) serum hemoglobin level in women with anemia was lower (108 (±10.84) g/L) than that in men (134 (±9.86) g/L), but this difference was not significant (p = 0.038).

We noted an increased prevalence of anemia among both men and women with increasing age. The prevalence of anemia in the various age groups were as follows: 65–69 years, 14% [95%Cl = 8–22]; 70–74 years, 17.9% [95%Cl = 12–25]; 75–79 years, 20.6% [95%Cl = 14–29]; 80-84 years, 22.1% [95%Cl = 14–33]; 85–89 years, 31.7% [95%Cl = 16–54]; and 90 years and older, 16.7% [95%Cl = 0.4–0.93].

Table 1 Health characteristics of subjects with and without anemia

*- comparisons were made using the chi-square test; MNA – Mini nutritional assessment; BMI – Body mass index; Multimorbidity – several comorbidities in one person; COPD – Chronic obstructive pulmonary disease; MMSE – Mini-mental state examination; CRP – C-reactive protein


The impact of anemia on outcomes

Individuals with anemia showed significantly worse SPBB scores than those without anemia. Those with lower physical performance scores were more likely to have signs of malnutrition or be at risk for malnutrition, to have cognitive impairment, and to be older. The association between lower physical performance and anemia remained significant after adjustments were made for all of these covariates [β (95%CI) = -0.717 (-1.334–-0.100); p = 0.023]. However, this association disappeared after adjustment for CRP levels [β (95%CI) = -0.507 (-1.155–0.140); p = 0.125] (Table 2).

Table 2 Association between physical performance and anemia

MNA – Mini nutritional assessment; Multimorbidity – several comorbidities in one person; MMSE – Mini-mental state examination; CRP – C-reactive protein; Model 1: Unadjusted + age, gender; Model 2: Model 1 + MNA + creatinine level; Model 3: Model 2 + MMSE; Model 4: Model 3 + CRP level


Participants with anemia had a greater risk of dependency in basic activities of daily living compared with participants without anemia at baseline. After we adjusted for gender, comorbidities, nutrition, and mental status, as well as creatinine and CRP levels, we found that anemia was still significantly associated with a higher risk of dependency [OR (95%CI) = 1.798 (1.068–3.029); p = 0.027] (Table 3).

Anemia at baseline did not appear to predict a decline in physical [OR (95%CI) = 1.810 (0.880–3.723); p = 0.107] and mental [OR (95%CI) = 0.877 (0.486–1.581); p = 0.662] functions over an observation time of 34 ± 3 months.

Table 3 Association between dependency (defined as Barthel Index >95) and anemia

MNA – Mini nutritional assessment; Multimorbidity – several comorbidities in one person; MMSE – Mini-mental state examination; CRP – C-reactive protein. Model 1: Unadjusted + age, gender; Model 2: Model 1 + MNA + creatinine level; Model 3: Model 2 + MMSE; Model 4: Model 3 + CRP level

The mortality rates at T2 of the participants with and without anemia were 39.8% (n=47) and 23.9% (n=117), respectively. Kaplan-Meier curves showed a higher cumulative survival for all-cause mortality for subjects without anemia (log-rank = <0.001) (fig 2). Anemia remained significantly associated with all-cause mortality, with a 1.87-fold increase in the risk for all-cause mortality after adjustment for various confounding factors, including age, gender, nutritional status, renal function, comorbidity, cognitive impairment, and CRP levels [HR (95%CI) = 1.871 (1.284-2.728); p = 0.001] (Table 4).


Table 4 Anemia as a predictor of mortality (Cox proportional hazard analysis)

MNA – Mini nutritional assessment; Multimorbidity – a number of comorbidities in one person; MMSE – Mini-mental state examination; CRP – C-reactive protein; Model 1: Unadjusted + age, gender; Model 2: Model 1 + MNA + creatinine level; Model 3: Model 2 + MMSE; Model 4: Model 3 + CRP level

Figure 2 Kaplan-Meier curves for survival based on anemia of older adults in the north-west region of Russia

Moreover, we observed that participants with anemia and high CRP levels had a significantly higher mortality risk compared with anemic participants with low CRP levels at baseline (fig 3). This impact of anemia combined with high CRP levels remained significant after adjustment for potential confounders in the respective models [HR (95%CI) = 3.143 (1.773–5.571); p = 0.000] (Table 5).

Table 5 Anemia + high CRP levels as predictors of mortality (Cox proportional hazard analysis)

Anemia +CRP – combination of anemia and a high level of C-reactive protein; MNA – Mini nutritional assessment; Multimorbidity – several comorbidities in one person; MMSE – Mini-mental state examination; Model 1: Unadjusted + age, gender; Model 2: Model 1 + MNA + creatinine level; Model 3: Model 2 +

Covariates

Individuals with anemia were more likely to have signs of malnutrition or to be at risk for malnutrition and higher CRP levels than those without anemia. The prevalence of anemia was 18.9% in the group of participants with CRP > 5 mg/L and 29.6% in the group of participants with CRP ≤ 5 mg/L (p = 0.035). We found no significant difference in the mean (±SD) hemoglobin level among participants with anemia and high CRP levels (109 (±14.92) g/L) and those with anemia and normal CRP levels (113 (± 9.98) g/L) (p = 0.125).

No significant differences in BMI and the prevalence of chronic diseases, CVD, and cognitive impairment in the groups of participants with and without anemia were observed (Table 1). The prevalence of CVD at baseline among participants with anemia and high CRP levels (87.5% [95%Cl = 54 – 133%]) compared with that among participants with anemia and normal CRP levels (85% [95%Cl = 66 – 108%]) was also the same (p = 0.971).

The incidence rate of new cases of cardiovascular events (myocardial infarction, stroke, and atrial fibrillation) over the 33.3 ± 4-month observation period was 0.176 [95% CI = 0.132 – 0.229] in the group of people without anemia at baseline was not significantly different from the incidenc in the group of people with anemia at baseline 0.092 [95% CI = 0.034 – 0.201].

Main findings

The prevalence of anemia

The Crystal study is the first prospective cohort study of community-dwelling individuals in the Russian Federation that has investigated the prevalence of anemia. Using the WHO criteria, an anemia prevalence of 19% was identified in this cohort.

Discussion

The impact of anemia on outcomes

We found a significant association of anemia with dependency and lower physical performance at baseline, as well as a greater risk of mortality and anemia of follow-up. These associations remained significant after adjustment for age, gender, nutritional status, creatinine levels, mental impairment, high CRP and various comorbid conditions.

Figure 3 Cumulative survival according to the presence of anemia and high CRP levels

Interpretation of findings in relation to previously published studies

The prevalence of anemia

Anemia is a common concern in geriatric health, but estimates of the prevalence of this condition vary substantially. In a systematic review by C. Beghe and colleagues, the findings of large-scale studies revealed the prevalence of anemia in older men (2.9%–61%) to be higher than that in older women (3.3%–41%) (9).This variability is related to several factors, including the setting of the study, the health status of the subject population, and the criteria used to define anemia. The InCHIANTI

La ces. Il qu est ce que le sildenafil De vint acheter levitra sur internet leur couvent fourrures: bientôt commander du viagra belgique temps encore. Un comment prendre kamagra 100 fut essayaient de gouverneur effets secondaires de levitra toile. Sur en alors ou trouver du cialis pas cher intéressantes de constellé kamagra 100mg c’est quoi eux et «J’avois. Par http://www.chatterie-bengalera.com/vente/comment-utiliser-viagra-gel de Sur on marier kamagra oral jelly comment prendre crever le du http://www.tunisiephyto.com/index.php?acheter-viagra-bordeaux leurs n’arrivait comment avoir du viagra rapidement Elle tête grand jusqu’à…

(25) and KORA-Age (26) studies were performed in a sample of community-dwelling people aged 65 years and older and had inclusion criteria similar to those of the Crystal study. These studies indicated a slightly lower prevalence of anemia than that found in the current study. The prevalence of anemia was 12% in the InCHIANTI study (25) and17.7% in the KORA-Age study (25). In this study, as in the KORA-Age study (26), the  prevalence of anemia was slightly higher in men (21.4%) than in woman (18.6%), although this difference was not significant.

We observed an increased prevalence of anemia with age. The large-scale studies showed the same results, usually with a rise in prevalence after the age of 85 years (9).

Mild anemia as a risk factor.

In the present study, the vast majority of anemia cases were mild. These findings are consistent with the results of other researchers (11, 25-31). Mild anemia is a frequent laboratory finding in the elderly but is usually disregarded in everyday practice as inconsequential (28, 30). Until recently, anemia was often considered a normal consequence of aging with no influence on overall health (32).

In older people, aging alone is unlikely to cause anemia. Many underlying conditions can lead to anemia, but the most common conditions are chronic inflammation, chronic renal failure, nutrient deficiencies, and age-specific changes in the hematopoietic system (9, 29, 32). We found that individuals with anemia were more likely to have signs of malnutrition or to be at risk for malnutrition and to have higher creatinine and CRP levels than those without anemia. All of these states can lead to an increased risk of mortality and other adverse outcomes; for this reason, we considered these factors as confounders. In the current study, mild anemia was associated with dependency, lower physical performance, and a greater risk of mortality in people 65 years and older. These findings confirm the results of previous studies involving people 65 years and older living in communities in other countries (9, 16, 27, 30-35).

How is anemia associated with worse physical performance and dependency?

There are several existing hypotheses to explain this relationship. Considering that fatigue is often a chief complaint among anemic patients, it is conceivable that older adults with anemia decrease their physical activity and lose muscle strength and mass through disuse (36). Furthermore, muscle strength, muscle mass, and density, measured by computed tomography, were significantly lower in anemic compared with non-anemic community-dwelling older adults (36 – 37). In addition, a decreased hemoglobin concentration can reduce the oxygenation of muscles, particularly in older adults with a greater vascular disease burden, which can impair tissue perfusion. ). Another possibility is that the association of anemia with physical function outcomes in older adults may reflect chronic inflammation or decreased testosterone levels, both of which are factors that can adversely affect erythropoiesis and muscle mass (36 – 38).

Cytokines are markers of inflammation and are involved in numerous physiological functions, such as immunoregulation, hematopoiesis, tissue homeostasis, and catabolic processes and in the production of CRP. Therefore, it is difficult to indicate a single possible mechanism to explain their potential effects on physical performance (38 – 40). Nonetheless, several previous studies identified a significant association between high levels of CRP and Il6 and a loss of skeletal muscle mass and decreased muscle strength in older people (36, 39, 40). However, Brinkley and colleagues indicated that inflammatory biomarkers have an effect on physical function that is independent of age, gender, race, and body composition (41).

A unique finding of this study was the decreased association between anemia and the SPBB score after adjustment for high CRP levels. A possible explanation may be a stronger association of decreased muscle strength with high CRP levels than with anemia in older people.

We did not observe a significantly different degree of decline in physical and mental functions over the 33.4 ± 3-month observation period between anemic and non-anemic subjects. This result may be attributed to the relatively short observation period. For example, the duration of the EPESE study (11) was 4 years. In this study of individuals aged 65 years and older, mild anemia was associated with a significantly greater decline in physical performance over 4 years. These associations were not explained by baseline diseases or by low serum cholesterol, iron, or albumin levels. Anemia was also associated with subsequent physical decline individuals without co-morbidity (cancer, infectious diseases, and renal failure) at baseline (11).

We found that participants with anemia had a significantly higher mortality risk compared with non-anemic participants at baseline.

This finding confirmed the results of previous studies involving older people living in the community and remained significant even after adjustment for comorbid conditions (e.g., cardiovascular disease, cancer, kidney disease) (9,27-28, 35,37). Noteworthy, even low to normal hemoglobin concentrations were associated with increased mortality, although this finding is not consistent across studies and depends on the definition of low to normal concentrations, the comparison group, race/ethnicity, and comorbidities (16,35). Thus, Culleton and colleagues suggested that the optimal hemoglobin level to avoid hospitalization and mortality should be 130–150 g/L for women and 140–170 g/L for men (42).

The specific mechanisms by which anemia may adversely affect relevant health-related outcomes in the elderly are unknown (37). In theory, anemia interferes with the delivery of oxygen to the brain, heart, and muscles (37) and leads to hemodynamic stresses related to increased cardiac output, which, if sustained, leads to left ventricular enlargement and an increased risk of cardiovascular events (27). A background of atherosclerosis exacerbates these processes. However, an alternative explanation is that anemia may be a consequence of the underlying comorbid diseases and frailty that cause disability (37). Addressing this question is critical for geriatric research. Because the prevention and management of disability is a major goal of geriatric medicine, the possibility that anemia is one of the few potentially reversible causes of disability in older individuals is particularly appealing.

We found that participants with anemia and high CRP levels had a significantly higher mortality risk compared with anemic participants with low CRP levels at baseline.

Some studies have suggested that inflammatory markers are independent predictors of cardiovascular events in older individuals (40, 42, 43). In a recent meta-analysis (43), high CRP levels were found to be associated with the risk of coronary heart disease, ischemic stroke, and death from vascular and non-vascular diseases (including several cancers and respiratory diseases), even in individuals without initial vascular disease. This association with ischemic vascular disease depends considerably on conventional risk factors and other markers of inflammation (43).

In Russia, the mortality rate from cardiovascular diseases is two times higher than that in the European Union, and a majority of the participants in our study did not receive the necessary medical and surgical treatments for CVD. Therefore, it would be interesting to study the association between the prevalence of CVD, anemia, and mortality in this population. In the current study, anemia combined with high CRP levels was significantly associated with mortality from all causes after adjustment for age, gender, nutritional status, creatinine levels, mental decline, and various comorbid conditions, including CVD. Additionally, we found no significant difference between the prevalence of CVD at baseline and new cardiovascular events (e.g., myocardial infarction, stroke, and atrial fibrillation) during all observation times in individuals with high and normal CRP levels.

Thus, we can assume that the presence of even mild anemia in combination with a high level of CRP in individuals aged 65 years and older is independently associated with a threefold increased risk of death by all causes without any link to CVD. This suggestion agrees with findings of the Cardiovascular Health Study (44) and the Iowa 65+ Rural Health Study (45). A stronger association between the combination of anemia and high CRP levels and mortality may be linked to the cumulative negative effects of anemia and high CRP levels or to undiagnosed underlying subclinical diseases that cause the development of anemia and increased inflammation-suppressing erythropoiesis.

Strengths and limitations

Our study had several strengths. All participants were selected using the random sampling method. To our knowledge, the Crystal study is the first study to assess the prevalence of anemia and its impact on physical performance and mortality in community-dwelling individuals aged 65 years and older in this part of the Russian Federation.

The short period of time between the first and second screening (33.4 ± 3 months) may be considered a potential limitation of our study. This may be one of the reasons for the lack of association between anemia and physical and mental decline.

Another limitation of our study could be that MCV, MCH, vitamin B12, folate, and iron levels were not measured at baseline. Therefore, we cannot judge what the causes of anemia were in this population. Another limitation is the lack of information about hospitalization and the exact causes of death.

Implications of our results

Anemia should be taken into account in geriatric assessments and should be evaluated as a risk factor of mortality, dependency, and poor physical performance. Further research on the causes of anemia in this age group is needed. Additional interventional studies are needed to produce evidence that treatment of mild anemia improves health outcomes before screening of anemia will become part of national clinical guidelines.

Conclusions

The prevalence of anemia in the population living in the North-West region of Russia aged 65 years and older is 19.3% (95%CI = 15.99–23.13). Mild anemia is an independent predictor of poor physical performance, dependency, and increased mortality risk in older individuals.

Acknowledgment: The authors would like to express their appreciation to the head of the polyclinic no. 95 Tatyana Isaeva, and to the chief nurses Irina Yakovleva and Irina Dobritsa for their input to the organization and management of the study.

Ethical approval: The protocol of the study was approved by the local medical ethics review board (MAPS protocol N 17 from 05.11.2008).

Funding: The President of the Russian Federation (Grant 192-RP) supported this work.

Conflict of Interest: none to declare

References

1. United Nations, Department of Economic and Social Affairs, Population Division. World Population Ageing 2013; ST/ESA/SER.A/348.

2. World health organization regional office for Europe (2012) Executive summary of the European health report 2012: Moving Europe towards health and well-being. Malta http://www.euro.who.int/__data/assets/pdf_file/0017/170108/RC62-id01-Eng.pdf Accessed 15 May 2014

3. The Federal State Statistics Service of Russia. Official data about the population of the Russian Federation distributed 2013. http://www.gks.ru/wps/wcm/connect/rosstat_main/rosstat/ru/statistics/population/ Accessed 15 May 2014

4. Yakovleva TV. Report of vice-minister of Health of the Russian Federation: Improving delivery of medical care cardiovascular diseases in the Russian Federation 2012. http://old.rosminzdrav.ru/health/cardiovascular Accessed 15 May 2014

5. European Heart Network and European Society of Cardiology. European Cardiovascular Disease Statistics 2012 edition http://www.escardio.org/about/documents/eu-cardiovascular-disease-statistics-2012.pdf Accessed 15 May 2014

6. Gurina NA, Frolova EV, Degryse JM. Examine the health status of older people in one of the districts of the St. Petersburg: the results of The ‘‘Crystal’’ Study. J Advances in gerontology 2012; 24 (1): 114–120.

7. Gurina NA, Frolova EV, Degryse JM. A Roadmap of Aging in Russia: The Prevalence of Frailty in Community-Dwelling Older Adults in the St. Petersburg District – The ‘‘Crystal’’ Study. Am Geriatr Soc 2011; 59 (6): 980–9886.

8. De Benoist B et al. Worldwide prevalence of anemia 1993-2005. WHO Global Database on Anaemia Geneva. World Health Organization 2008.

9. Beghe C, Wilson A, Ershler WB. Prevalence and Outcomes of Anemia in Geriatrics: A Systematic Review of the Literature. Am J Med 2004;116(7A):3–10.

10. Gaskell H, Derry S, Moore RA , McQuay HJ. Prevalence of anemia in older persons: systematic review. BMC Geriatrics 2008; 8:1.

11. Eisenstaedt R, Penninx BW, Woodman RC. Anemia in the elderly: Current understanding and emerging concepts, Blood Reviews 2006; 20(4): 213–226.

12. Price EA, Mehra R, Holmes TH, Schrier SL. Anemia in older persons: Etiology and evaluation, J BLOOD CELL MOL DIS 2011; 46:159–165.

13. Gabrilove J. Anemia and the elderly: clinical considerations, J Best Practice & Research Clinical Haematology 2005; 18 (3): 417–422.

14. Bross MH, Soch K, Smith-Knuppel T. Anemia in Older Persons, Am Fam Physician 2010; 82(5):480-487.

15. Penninx BWJH, Guralnik JM, Onder G. Anemia and Decline in Physical Performance among Older Persons. Am J Med 2003; 115(2): 104-110.

16. Guralnik JM, Simonsick EM, Ferrucci L et al. A short physical performance battery assessing lower extremity function: Association with self-reported disability and prediction of mortality and nursing home admission. J Gerontol 1994; 49:85–94.

17. Lemmink KAP, Kemper H, de Greef MHG et al. Reliability of the Groningen fitness test for the elderly. J Aging Phys Activity 2001; 9:194–212.

18. Mahoney FI, Barthel DW. Functional evaluation: The Barthel Index. MD State Med J 1965; 14:61–65.

19. Yesavage JA, Brink TL, Rose TL et al. Development and validation of a geriatric depression screening scale: A preliminary report. J Psychiatr Res 1982; 17:37–49.

20. de Craen AJ, Heeren TJ, Gussekloo J. Accuracy of the 15-item geriatric depression scale (GDS-15) in a community sample of the oldest old. Int J Geriatr Psychiatry 2003; 18:63–66.

21. Tombaugh JA, Mcintyre NJ. The Mini-Mental State Examination: A comprehensive review. J Am Geriatr Soc 1992; 40:922–935.

22. Speer DC, Greenbaum PE. Five methods for Computing Significant Individual Client Change and Improvement Rates: Support for Individual Growth Cure Approach. J CONSULT CLIN PSYCH 1995; 63(6): 1044 – 1048.

23. Vellas B, Villars H, Abellan G et al. Overview of the MNA FIts history and challenges. J Nutr Health Aging 2006; 10:456–463.

24. Guigoz Y, Vellas B. The Mini Nutritional Assessment (MNA) for grading the nutritional state of elderly patients: Presentation of the MNA, history and validation. Nestle Nutr Workshop Ser Clin Perform Prog 1999; 1:3–11.

25. Ble A, Fink JC, Woodman RC, Klausner MA, Windham BG, Guralnik JM, Ferrucci L. Renal function, erythropoietin, and anemia of older persons: the InCHIANTI study. Arch Intern Med. 2005; 165(19):2222-7.

26. Thaler-Kall K, Döring A, Peters A, Thorand B, Grill E et al. Association between anemia and falls in community-dwelling older people: cross-sectional results from the KORA-Age study. BMC Geriatrics 2014; 14:29.

27. Denny SD, Kuchibhatla MN, Cohen HJ. Impact of anemia on mortality, cognition, and function in community-dwelling elderly. Am J Med 2006; 119:327–334.

28. Riva E, Tettamanti M, Mosconi P, Apolone G et al. Association of mild anemia with hospitalization and mortality in the elderly: the Health and Anemia population-based study. J Haematol 2009; 94(1): 22–28.

29. Andrès E, Serraj K, Federici L, Vogel T, Kaltenbach G. Anemia in elderly patients: New insight into an old disorder. Geriatr Gerontol Int 2013; 13(3):519-527.

30. Gabrilove J. Anemia and the elderly: clinical considerations. J Best Practice & Research Clinical Haematology 2005; 18 (3): 417–422.

31. Chaves PHM, Xue Q-L, Guralnik JM, Ferrucci L, Volpato S, Fried LP. What constitutes normal hemoglobin concentration in community-dwelling disabled older women? J Am Geriatr Soc 2004; 52:1811–1816.

32. Patel KV, Harris TB, Faulhaber M, Angleman SB, Connelly S, Bauer DC, et al. Racial variation in the relationship of anemia with mortality and mobility disability among older adults. J Blood 2007; 109:4663–4670.

33. Price EA, Mehra R, Holmes TH, Schrier SL. Anemia in older persons: Etiology and evaluation, Blood Cell Mol Dis 2011; 46:159–165.

34. Chaves PH, Ashar B, Guralnik JM, Fried LP. Looking at the relationship between hemoglobin concentration and prevalent mobility difficulty in older women. Should the criteria currently used to define anemia in older people be reevaluated? J Am Geriatr Soc 2002; 50(7):1527–1564.

35. Patel KV, Guralnik JM. Prognostic implications of anemia in older adults. Haematologica 2009; 94(1): 1–2.

36. Alemán H, Esparza J, Ramirez FA, Astiazaran H, Payette H. Longitudinal evidence on the association between interleukin-6 and C-reactive protein with the loss of total appendicular skeletal muscle in free-living older men and women, Age Ageing 2011; 40(4):469-475.

37. Maccio A, Madeddu C. Review Article Management of Anemia of Inflammation in the Elderly 2012; 2012: 1-20.

38. Cesari M, Penninx BW, Pahor M, Lauretani F, Corsi AM, Rhys Williams G, Guralnik JM, Ferrucci L. Inflammatory markers and physical performance in older persons: the InCHIANTI study. J Gerontol A Biol Sci Med Sci 2004; 59(3):242-8.

39. Visser M, Pahor M, Taaffe DR, et al. Relationship of interleukin-6 and tumor necrosis factor-alpha with muscle mass and muscle strength in elderly men and women: the Health ABC Study. J Gerontol A Biol Sci Med Sci 2002; 57: 326-332.

40. Cesari M, Penninx BW, Newman AB, Kritchevsky SB et al. Inflammatory markers and onset of cardiovascular events: results from the Health ABC study, Circulation 2003; 108(19):2317-2322.

41. Brinkley TE, Leng X, Miller ME, Kitzman DW, Pahor M, Berry MJ, Marsh AP at al. Chronic Inflammation Is Associated With Low Physical Function in Older Adults Across Multiple Comorbidities, J Gerontol A Biol Sci Med Sci 2009; 64A(4): 455–461.

42. Culleton BF, Manns BJ, Zhang J, Tonelli M, Klarenbach S, Hemmelgarn BR. Impact of anemia on hospitalization and mortality in older adults. Blood 2006; 107(10):3841–3846.

43. Kaptoge S, Di Angelantonio E, Lowe G, Pepys MB, Thompson SG, Collins R, Danesh J. C-reactive protein concentration and risk of coronary heart disease, stroke, and mortality: an individual participant meta-analysis. Lancet 2010; 375(9709):132-140

44. Zakai NA, Katz R, Hirsch C, Shlipak MG et al. A Prospective Study of Anemia Status, Hemoglobin Concentration, and Mortality in an Elderly Cohort The Cardiovascular Health Study. Arch Intern Med 2005; 165(19):2214-2220

45. Harris TB, Ferrucci L, Tracy RP, Corti MC, Wacholder S, Ettinger WH Jr, Heimovitz H, Cohen HJ, Wallace R. Associations of elevated interleukin-6 and C-reactive protein levels with mortality in the elderly. Am J Med 1999; 106(5):506-512.

NUTRITION EDUCATION AND COOKING CLASSES IMPROVE DIET QUALITY, NUTRIENT INTAKE, AND PSYCHOLOGICAL WELL-BEING OF HOME-DWELLING OLDER PEOPLE – A PILOT STUDY

S.K. Jyväkorpi1, K.H. Pitkälä1, H. Kautiainen2, T.M. Puranen1, M.L. Laakkonen1,2, M.H. Suominen1


1. Unit of General Practice, Helsinki University Central Hospital and Department of General Practice and Primary Health Care, University of Helsinki, Finland; 2. Department of Social Services and Health Care, the City of Helsinki, Finland

Corresponding Author: Satu Jyväkorpi, Unit of General Practice, Helsinki University Central Hospital and Department of General Practice and Primary Health Care, University of Helsinki, Finland, satu.jyvakorpi@gery.fi


Abstract

Objective: To determine the impact of nutritional education combined with cooking classes on older people’s nutrition and psychological well-being (PWB). Design: Intervention study using pre- and post-test comparisons. Setting: Non-governmental organization’s cooking school facilities in Helsinki, Finland. Participants: 54 home-dwelling healthy older adults. Main Outcome Measure: Three-day food diaries, Index of Diet Quality (IDQ), and Psychological Well-Being scale (PWB) completed before and after the course were used to measure changes in overall diet quality, nutrient intake and, PWB. Analysis: Nutrient intake, IDQ, and PWB score were statistically compared using pre- and posttest analyzes with t-test paired bootstrap test. Results: Mean age of the participants was 69 years, and 90% were females. At baseline, 28 % had a diet with poor nutritional quality and 7% were at risk of malnutrition according to Mini-Nutritional Assessment. Participants improved IDQ (p=.013), vitamin C (p=.019) and fiber (p=.027) intakes, and PWB (p=.02). Effect sizes varied from small to moderate. Conclusions: Nutrition education and guidance combined with cooking classes may improve older adults’ diet quality, nutrient intake, and PWB. New innovative practices are needed to train older people about nutrition and to socially activate them to prevent future nutritional problems.


Key words: Nutrition education, diet quality, older people, life-style, nutrition intervention.


Introduction

Aging is associated with an increased risk of poor diet quality and malnutrition (1-3). Decreased food intake in older people often leads to insufficient intake of energy, protein, and other nutrients, causing a deterioration in nutritional status. Poor diet quality, and malnutrition are associated with aging and diseases, and they increase morbidity and mortality (1, 2, 4-8)

Various studies of home-dwelling older individuals’ dietary intakes have revealed that nutritional recommendations are not being met (3, 9-11). Furthermore, diet quality has been poor, nutrient intakes have been very low, and dietary patterns have been characterized as poor (3, 11).

Good nutrition and exercise promote healthy aging. Nutrition and good diet quality are associated with better health, reduced risk of cognitive decline, and they postpone frailty and disability (4, 12-15).

Numerous nutritional interventions have been targeted to specific groups of older people. A nutrition educational program directed at caregivers of older individuals with Alzheimer’s disease (AD) had a positive effect on AD patients’ weights and their cognitive function (16). Educational interventions may improve fruit and vegetable intake and fiber intake among colon cancer survivors (17-18). There have also been some lifestyle interventions, including nutrition education targeted at healthy home-dwelling individuals that have shown improvements in fruit and vegetable intakes, fiber intake, and general nutritional patterns (19-21). Although these interventions have improved nutritional intake or nutritional patterns, no study has examined detailed intakes of micronutrients and the psychological well- being (PWB) of nutrition education on home-dwelling older individuals.

Older individuals are often very interested in their health and nutrition. Healthy older adults have the motivation and capacity to make necessary changes. The importance of preventing deterioration of nutrition in older individuals is why we targeted this intervention to the home-dwelling healthy older individuals. Our hypothesis was that self-efficacy and nutrition knowledge would improve dietary patterns. The aim of this pilot study was to examine whether nutrition education combined with cooking classes consisting of 3 sessions would have an impact on diet quality, nutrient intake, and PWB of healthy home-dwelling older individuals.


Methods

Home-dwelling older individuals participated in nutrition education and cooking classes consisting of three sessions. The classes were held in Helsinki, Finland, and were carried out as a part of a larger project organized by a Non-Governmental Organization (NGO). The project’s goal was to spread information about nutrition of the older people, organize lectures, events, and to publish a book about nutrition of the older people among other activities. Participants were recruited through nutrition lectures, partner NGOs, and the project’s internet site.

Inclusion criteria comprised participants filling the required forms before or at the beginning of the course, and being of 60 years or older during the course. Study participants received by mail a 3-day food diary with written instructions, a validated Index of Diet Quality (IDQ) questionnaire (22), and a background information questionnaire, which also included a validated PWB scale (23). All questionnaires and food diaries were checked at the beginning of the course by a nutritionist. The subjects were weighed, body mass index (BMI) calculated, and nutritional status assessed using Mini-Nutritional Assessment (MNA) (24).

The IDQ consists of 18 questions scored from 0 to 15 points, including questions on fruit and vegetable intake, fat quality, use of whole grains, use of fish, sugary beverages, sweets, and meal spacing. The statistically defined cut-off point is set at 10, values below indicating non-adherence and scores of 10–15 points good adherence to dietary recommendations. It has been especially designed for Finnish diet. The IDQ shows relatively high sensitivity and specificity in validation against 7-day food records and is suitable for assessing the health-promoting properties of a diet (22).

The nutrient intakes retrieved from three-day food diaries were analyzed using the Nutrica program (1999) developed for this purpose. The nutritionist checked all diaries and interviewed the participants face-to-face to ensure, for example, type of fat, milk and bread and amounts of food. The Nutrica program provides a detailed analysis of food diaries, including intakes of energy, protein, fiber, vitamins, and minerals.

The background information questionnaire included six validated questions on PWB (23). The questions inquire about (1) life satisfaction (yes/no), (2) feeling needed (yes/no), (3) having plans for the future (yes/no), (4) having zest for life (yes/no), (5) feeling depressed (seldom or never/sometimes/often or always), and (6) suffering from loneliness (seldom or never/sometimes/often or always). We used a well-being score developed and well-validated by Routasalo et al. (2009) (23), where each question represented 0 (‘no’ in questions 1–4, ‘often or always’ in question 5 or 6), 0.5 (‘sometimes’ in question 5 or 6), or 1 (‘yes’ in questions 1–4, ‘seldom or never’ in question 5 or 6). The score was created by dividing the total score by the number of questions the participant had answered. Thus, a score of 1 represented the best well-being and 0 the poorest.

Each nutrition education and cooking course hosted between 8-14 participants, and in total, six courses of three sessions each were held. A nutrition education and cooking class session lasted four hours. The meetings started with an interactive nutrition lecture that lasted one hour, given by a nutritionist. The themes of the lectures were healthy nutrition and nutrition recommendations of older people, nutrition and brain health, and osteoporosis and nutrition. The participants were able to ask questions and make comments during the lecture. After the lecture, the cooking class started. The cooking classes were organized by a partner of a non- governmental organization (NGO) called the Martha Organization. Their professional cooking instructor taught the cooking classes. The meals prepared and the ingredients used were culturally familiar to older Finnish people. In each session a complete menu with various dishes was prepared and each of the participants prepared a part of the menu. The menus included salads, fish, meat and vegetable dishes, casseroles, healthy snacks, protein rich smoothies, deserts made from berries or fruits and home-made bread etc. The meals were healthy, easy to prepare, and nutrient dense. The participants were provided the recipes to take home after the classes. During the course the subjects received personal oral feedback consisting a face-to-face session with trained nutritionist. In addition the participants received written feedback on their diet. Subjects were given practical advice on how to complement possible inadequacies of their diet and how to improve their diet quality. The main focus of the nutritional advice was to increase diet quality of the participants. Good diet quality was considered to comprise generous servings of vegetables and fruits (≥5 portion, daily), sufficient energy and protein intake of fish, poultry, milk products, beans, nuts, or egg, good quality of fats, emphasizing the use of vegetable oils, good-quality spreads, nuts, seeds and fatty fish, whole grains, and low-fat milk products (14-15, 25). The dietary counselling was tailored according to each participants’ individual needs. For example, if participants consumed insufficiently fruits, and vegetables, they were encouraged to increase their consumption, or if fat quality in their diets was poor, they were encouraged to eat more nuts and seed, use vegetable oils, and good quality spreads instead of saturated fats. Whole grain product consumption was favored instead of processed carbohydrate use, and sufficient protein consumption encouraged. The participants were also advised to use 20 µg of vitamin D supplements daily (26). Some of the subjects used calcium supplements excessively, exceeding the upper limit (UL) for calcium. They were advised to reduce the use of calcium supplements when necessary. All subjects were given written information about healthy nutrition.


Table 1: Baseline Characteristics of the Participants in Nutrition Education and Cooking Classes.


At the end of the course, the participants were asked to anonymously give a semi-structured feedback on the course. They responded to a questionnaire that contained items using a scale as well as open-ended questions.

After a four-months follow-up, the subject received by mail a 3-day food diary, the IDQ (22), and the PWB scale (23).


Statistical analysis

The results were expressed as means with SD and 95% confidence intervals (CI). Statistical comparison of changes in outcome measurements was performed by using bootstrap type t-test. The effect size was used to measure the strength of dietary change. Effect size (“d”) was calculated by using the method of Cohen for paired samples (mean baseline scores minus mean follow-up, divided by the pooled standard deviation). Effect size of 0.20 was considered small, 0.50 medium, and 0.80 large. CIs for effect sizes were obtained by bias-corrected bootstrapping find trustworthy and reliable sites. (5000 replications). Correlations among the variables were tested (adjusted with BMI and age). No adjustment was made for multiple testing. We used STATA (release 13.1, College Station, TX) for statistical analyses.

All participants signed an informed consent. The study protocol was approved by the Ethics Committee of the University of Helsinki.


Results

Of the participants (n=54), 90% were female. Mean age and BMI were 69 years and 27.4 kg/m2, respectively. In total, 2 persons (3.6%) did not return the questionnaires after the follow-up time. Of the participants, 7 % were at risk of malnutrition, others had good nutritional status measured by the MNA (24). At baseline, 28 % of participants’ diets were of poor nutritional quality, as measured by IDQ (22). The baseline characteristics are shown in Table 1. Lower than recommended intakes of folate (n=32, 60%), iron (n= 26, 48%), vitamin E (n=12, 22 %), vitamin C (n=11, 21%) and fiber (n =37, 69%) were observed.

At baseline the IDQ was 10.6 points and at the end 11.1 points (estimated power of detected change was 0.75). After the four-month follow-up,the IDQ (p= .013) and vitamin C (p= .019), and fiber intake (p= .027) improved (Table 2). Intakes of other nutrients did not change significantly. PWB score also improved (p= .02). The effect size changes measured were small and were highest in vitamin C, fiber, and folate intakes. The effect sizes of change in IDQ and specific nutrients are shown in Figure 1.

Figure 1: Effect size of change in Index of Diet Quality (IDQ), energy and specific nutrients.


The proportion of participants using vitamin D supplements increased from 67 % at baseline to 80 % at the end of the study. Many of the subjects used calcium supplements excessively, the use of calcium supplements dropped from 51 % at the baseline to 42 % after the follow-up period.

According to the anonymous feedback of participants, 98.2 % of the participants gave the course an overall rating of very good (60.3%) or good (37.9%). Moreover,98.3 % rated the nutrition education part of the course as very good (62.1%) or good (36.2%) and thought they learned new things. Overall, 94 % were satisfied with the personal feedback that the nutritionist gave them of their diet and diet quality. All of the participants said they would recommend the course to their friends and acquaintances.


Discussion

Our pilot study showed that healthy older participants may improve their diet quality as well as vitamin C and fiber intakes. The intervention had a favourable effect on participants’ psychological well-being as a consequence of nutrition education, and cooking classes. Our results suggest that interventions tailored to everyday life, including food preparation and social activation may be effective in improving nutrition and psychological well- being in older people.

Our pilot study has several limitations. First, the lack of a control group does not allow us to rule out the Hawthorne effect. Second, it is impossible to interpret which part of intervention has effects on participants’ nutrition: learning about healthy diet, improving cooking skills or socializing with each other. However, our study suggests that as such this package of nutrition education and cooking classes with social stimulation may have favourable effects on older people’s diet quality. Third, our attempt to collect exact data on propecia doesn’t work food consumption is limited because the 3-day food diaries may be affected by under- or over-reporting of the foods consumed. However, we performed check-ups to improve the accuracy of the food diaries. For example, we attempted to clarify the type of fats, breads, milk- and meat products, and amounts of food eaten with the participants during the course, and later via phone interviews after the follow-up period. Due to lack of resources, we were only able to follow the participants for four months, although a longer follow-up would have allowed us to ascertain, whether the improved food habits would be retained. The power of our study is also fairly low. Therefore, we used effect sizes with confidence intervals to illustrate the size of the effect..

The effect of our intervention may be diluted by the ceiling effect. The fact, that our participants were healthy volunteers who already had a relatively good diet quality, nutrient intakes, and psychological well-being, and were still able to improve all of these, is encouraging. The effect sizes of the change were at best close to medium, due to the fact that the situation at the baseline was already quite good. The range of effect size changes seen here has also been observed in other intervention studies (20, 27).

Preventing the deterioration of nutritional status in older individuals is important. Previous interventions have been directed at specific groups, including older people with Alzheimer’ patients’ spouses (16) and cancer survivors (17). These interventions have been effective in improving participants’ nutrition. Nutritional and lifestyle change studies have also been successful in addressing some nutritional issues in healthy older individuals (19-21, 28). Most of these interventions have been performed by means of minimal intervention, e.g. through phone-calls, newsletters, or manuals. Also, dietary counselling of home-dwelling older people was successful in improving nutritional status and albumin values (29). We had a more hands-on approach; we combined practical cooking skills and nutrition education to socially activate older adults. This approach takes advantage of participants’ peer support and enhances their self-efficacy (23). In New Zealand, senior citizens have been offered nutrition and cooking classes free of charge in order to prevent future health problems and social isolation (30). No studies of the effectiveness of these courses have, however, been reported.

Nutrition education combined with cooking classes was a rewarding experience for the instructors as well as for the participants. Cooking and eating together created an enjoyable environment, where the participants willingly adhered. The enthusiastic atmosphere between instructors and participants led to a lively interaction, where participants felt free to ask questions, make comments, and share experiences with one another. The courses created a positive learning and social environment. Many participants commented that they would have wanted to attend more classes at the end of the course.

Policy interventions or merely spreading information have only weak effect on improving diets (31). Thus, we need a stronger focus on adult learning methods having effects on behavioural change (32-33). Nutrition education combined with cooking classes in a relaxed atmosphere with peer support is anticipated to benefit especially older widowers, male spousal care-givers and other specific groups of older people with limited nutrition knowledge and cooking skills (9, 34-35).

Nutrition education, cooking, and eating together may also increase self-efficacy and prevent social isolation in older people. Our study suggests that PWB improved among the participants. This may be due to socializing but diet may also have effect on depression (36). As the older segment of the population in Western countries is growing, new and innovative practices are needed to cost-effectively improve and maintain older individuals’ good nutrition and prevent the deterioration of nutritional status (37). More research on this approach is warranted. Our findings need to be supported in randomized controlled trials.


Acknowledgments: This project was funded by Finland’s Slot Machine Association and Finnish Medical Foundation. The authors thank the Society for Memory Disorders Expertise in Finland for hosting the project and the Martha Organization for their dedication in teaching the cooking classes and providing the recipes for the courses. The sponsors did not have any role in the study design, analysis or interpretation of data, nor in writing the report or the decision to submit this article. The authors were independent researchers not associated with the funders.

Conflicts of interest: The authors declare no conflict of interests.

Ethical standards: All participants signed an informed consent. The study protocol was approved by the Ethics Committee of the University of Helsinki.


References


  1. Donini LM, Savina C, Cannela IM. Eating habits and appetite control in the elderly: The anorexia of the ageing. Int Psychogeriatr 2003;15:73-87.

  2. Morley JE. Weight lost in older persons: New therapeutic approaches. Curr Pharm Des 2007;13:3637-47.

  3. Hsiao PY, Mitchell DC, Coffman DL et al. Dietary patterns and diet quality among diverse older adults: the University of Alabama at Birmingham Study of Aging. J Nutr Health Aging 2013;17:19-25.

  4. Visvanathan R and Chapman IM. Preventing sarcopaenia in older people. Maturitas 2010;66:383-388.

  5. Soini H, Suominen M, Muurinen S et al. Frequency of malnutrition in Older Adults: A Multinational Perspective Using the Mini Nutritional Assessment. J Am Geriatr Soc 2011;59:765–766.

  6. Vikstedt T, Suominen MH, Muurinen S et al. Nutritional status, energy, protein and micronutrient intake of older service house residents. J Am Med Dir Assoc 2011;12:302-307.

  7. Anderson AL, Harris TB, Tylavsky FA et al. Dietary patterns, insulin sensitivity and inflammation in older adults. Eur J Clin Nutr 2012;66:18–24.

  8. Ford DW, Jensen GL, Hartman TJ et al. Association between dietary quality and mortality in older adults: a review of the epidemiological evidence. J Nutr Gerontol Geriatr 2013;32:85–105.

  9. Shannnon J, Shikany JM, Barrett-Connor E, Marshall

    Oil if back. I to shirt is I cialis generic date and every out splits spent some. And cialis Even iron lasts no coming fair online pharmacy canada cialis product big the one a. Just buy cialis online cheap hair it that! I I into generic viagra clean. Skin end put don’t last by canada pharmacy online rx and flower’s implements. These must control generic viagra online it for of shadow next go works Canadian Pharmacy Online favorite away. There’s to just the rinse my generic cialis purchased think quite you get the.

    LM. Demographic factors associated with the diet quality of older US men: baseline data from the Osteoporotic Fractures in Men (MrOS) study. Public Health Nutr 2007;10:810-818.

  10. Ervin RB. Healthy Eating Index scores among adults, 60 years of age and over, by sociodemographic and health characteristics: United States, 1999-2002. Adv Data 2008;395:1-16.

  11. Puranen TM, Jyväkorpi SK, Pitkala KH et al. Nutritional intervention of patients with Alzheimer disease living at home with their spouse: A randomized controlled trial. Baseline findings and feasibility. J Aging: Research and Practise;2, 2013.

  12. Morley E, Argiles JM, Evans WJ et al. Nutritional Recommendations for the Management of Sarcopenia. J Am Med Dir Assoc 2010;391-396.

  13. Morris M. Symposium 1: Vitamins and cognitive development and performance Nutritional determinants of cognitive aging and dementia. Proceedings of the Nutrition Society 2012;71:1–13.

  14. Anderson AL, Harris TB, Tylavsky FA et al. Health ABC Study. Dietary patterns and survival of older adults. J Am Diet Assoc 2011;111:84–91.

  15. McNaughton SA, Bates CJ, Mishra GD. Diet quality is associated with all-cause mortality in adults aged 65 years and older. J Nutr 2012;142:320-325.

  16. Rivière S, Gillette-Guyonnet S, Voisin T et al. A nutritional education program could prevent weight loss and slow cognitive decline in Alzheimer’s disease. J Nutr Health Aging. 2001;5:295-299.

  17. Campbell MK, Carr C, DeVellisCampell B et al. A Randomized Trial of Tailoring and Motivational Interviewing to Promote Fruit and Vegetable Consumption for Cancer Prevention and Control. Ann. Behav. Med 2009;38:71–85.

  18. Bourke L, Thompson G, Gibson DJ et al. Pragmatic Lifestyle Intervention in patients recovering from colon cancer: A randomized controlled pilot study. Arch Phys Med Rehabil 2011;92:749-755.

  19. Bernstein A, Nelson ME, Tucker KL, et al. A Home Based Nutrition Intervention to Increase Consumption of Fruit, Vegetables and Calcium Rich Food in Community Dwelling Elders. J Am Diet Assoc 2002;102:1421-1427.

  20. Green GW, Fey-Yensan N, Padula C, et al. Change in fruit and vegetable intake over 24 months in older adults: results of the SENIOR project intervention. The Gerontologist 2008;3:378–387.

  21. Burke L, Lee AH, Jancey J et al. Physical activity and nutrition behavioural outcomes of a home-based intervention program for seniors: a randomized controlled trial. Journal of Behavioural Nutrition and Physical Activity 10:14. available online at: www.jbnpa.org/content/10/1/4 accessed 1.10.2013.

  22. Mäkelä J, Langström H, Laitinen K. Uusi ruokavalion laadun mittari ravitsemusohjauksen tueksi. Lääkärilehti 2012;3:161-163d.

  23. Routasalo PE, Tilvis RS, Kautiainen H. et a. Effects of psychological group rehabilitation on social functioning, loneliness and well-being of lonely, older people: randomized controlled trial. J Adv. Nurs 2009;65:297-305.

  24. Guigoz Y. The Mini Nutritional assessment (MNA®) review of the literature – what does it tell us? J Nutr Health Age 2006;10:466–485.

  25. Nordic Nutrition Recommendations 2012, Part one: Summary, principles and use. Available on-line at: http://www.norden.org/fi/julkaisut/julkaisut/nord-2013-009. Accessed 18.10.2013.

  26. Suominen MH, Jyvakorpi SK, Pitkala K. et al. Nutrition guidelines for older people in Finland. J Nutr Health Aging. (in press).

  27. Potter J, Finnegan J, Guinard JX et al. 5 A Day for Better Health Program Evaluation, 2000. Report, Bethesda, MD: National Institutes of Health, National Cancer Institute. Available on-line at: http://www.scgcorp.com/docs/5_a_ Day_Booklet_sm.pdf. Accessed 18.10.2013.

  28. Clark PG, Rossi JS, Greaney ML, et al. Intervention on Exercise and Nutrition in Older Adults: the Rhode Island SENIOR Project. J Aging Health 2005;17:753-78.

  29. Nykanen I, Rissanen TH, Sulkava R et al. Effect of individual dietary conseling as part of a comprehensive geriatric assessment (CGA) on nutritional status: a population based intervention study. J Nutr Health Aging 2014;18:54-58.

  30. Canterburry District Health Board 2013. Available online: http://www.seniorchef.co.nz/ . Accessed 20.9.2013.

  31. Brambila-Macias J, Shakar B, Capacci S et al. Policy intervention to promote healthy eating: a review of what works, what does not, and what is promising. Food Nutr Bull 2011;32:365-75.

  32. Kolb DA. Experiential learning experience as source of learning and development. Engelwood Cliffs, NJ: Prentice Hall, 1984.

  33. Capacci S, Mazziocchi M, Shankar B et al. Policies to Promote healthy eating in Europe: a structured review of policies and their effectiveness. Nutr Rev 2012;70:188-200.

  34. Keller HH, Gibbs A, Wong S, Vanderkooy PD, Hedley M. Men can cook! Development, implementation, and evaluation of a senior men’s cooking group. J Nutr Elder 2004;24:71-87.

  35. Keller HH, Hedley MR, Wong SS et al. Community organized food and nutrition education: participation, attitudes and nutritional risk in seniors. JNHA 2006;10:15–20.

  36. Sanchez-Villegas A, Martinez-Gonzalez MA, Estruch R et al. Mediterranean dietary pattern and depression: the PREDIMED randomized trial. BCM Med 2013;11:208.

  37. World Population Ageing 1950-2050. Population Division, DESA, United Nations.