jarlife journal
Sample text

AND option

OR option

PREVALENCE AND CHARACTERISTICS ASSOCIATED WITH ALCOHOL USE AND ALCOHOL RELATED PROBLEMS IN COMMUNITY DWELLING OLDER ADULTS


Y. van Gils1,2, E. Franck2, S.J.P. van Alphen1,3,4,5,6, E. Dierckx1,7


1. University of Brussels, Faculty of Psychology and Educational Science, Pleinlaan 2, 1050 Elsene, Belgium; 2. University of Antwerp, Faculty of Medicine and Social Science, Universiteitsplein 1, 2610 Wilrijk, Belgium; 3. Tilburg University, School of Social and Behavioural Sciences, Department of Medical and Clinical Psychology, Warandelaan 2, Tilburg, The Netherlands; 4. Professor of Clinical Geropsychology at Faculty of Psychology & Educational Sciences, Department of Clinical & Lifespan Psychology, Vrije Universiteit Brussel (VUB), Brussels, Belgium; 5. Manager of the Clinical Center of Excellence for Personality Disorders in Older Adults, Mondriaan Hospital, Heerlen-Maastricht, The Netherlands; 6. Professor of Health Care Psychology at School of Social and Behavioral Sciences, Department of Medical and Clinical Psychology, Tilburg University, Tilburg, The Netherlands; 7. Alexianen Zorggroep Tienen, Psychiatric Hospital

Corresponding Author: Y. van Gils, University of Brussels, Faculty of Psychology and Educational Science, Pleinlaan 2, 1050 Elsene, Belgium, yannic.vangils@uantwerpen.be

J Aging Res Clin Practice 2019;8:28-38
Published online April 2, 2019, http://dx.doi.org/10.14283/jarcp.2019.6


Abstract

Objective: This study examine the prevalence, characteristics and associated factors of alcohol use and alcohol related problems among Belgian community dwelling older adults. Design: Retrospective cross-sectional study by extensive examination survey. Setting: The participants were questioned in their homes or in community centres. Participants: Overall, 1,366 adults ≥65 years participated in this study. Method: Information about self-reported alcohol use during the past year, Health Related Quality of Life (HRQL) and alcohol related problems was gathered with respectively the AUDIT, SF36 and MAST-G. Results: Of the total sample, 84.4% reported alcohol consumption. Using the NIAAA guidelines, the  overall prevalence for at risk drinking was 26.6% and for binge drinking 14.8%, both risky alcohol patterns. Logistic regression analyses were performed on the drinking sample to determine the predictors associated with at risk drinking, binge drinking and hazardous drinking. Being male, a smoker of former smoker and living alone were associated with at risk drinking. Being male, being aged 65-74 years, being a smoker, reporting polypharmacy, MCS and having recent loss experience were associated with binge drinking. More than 25% of respondents were classified as hazardous drinking (score ≥5 on MAST-G). Associated factors with hazardous drinking were being male, having a family history of alcohol problems, PCS and MCS. Conclusions:  The prevalence rates for at risk alcohol patterns and alcohol related problems were higher than in previous studies. As older adults are more vulnerable to the adverse consequences of alcohol use, awareness about alcohol use should be raised among older adults, as well as amongst health care givers and researchers.

Key words: Older adults, alcohol use, alcohol related problems.


Introduction

In Europe the use of alcoholic beverages is widespread and commonly accepted. Due to the destigmatization during the last decades, alcohol has become part of the European culture.  Despite results of longitudinal studies about decrease in alcohol consumption among older adults (1, 2), alcohol use by older adults seems more prevalent than generally assumed (3-6). Based on European data, the prevalence among older adults was approximately 57% ranging from 44% to 80% (5, 7-11). Older male adults seemed to consume more alcohol compared to older females (11-13). Living with someone, being younger than 80 (12-14) and having a higher educational level (5, 12) were associated with more alcohol consumption among older adults. According to Geels et al. (2013) a higher prevalence in alcohol use among the population of older adults might also be due to the increasing amount of healthy life years in combination with a higher average income.
Alcohol use among older adults carries risks since older adults are more vulnerable to the adverse consequences. Biological as well as psychological and social problems have been reported. Cancers, like liver and pharynx cancers, cardiovascular disease, liver disease (15, 16), more severe functional problems and even mortality (11, 17, 18) have been associated in older adults with excessive drinking. Also, at risk drinking is associated with the tendency for injuries (16, 19) and falling (20). In addition, older people reported using multiple medication more frequently than their younger peers. This will expose them to greater risks because of the possible adverse interaction between alcohol and medication (12). Within the psychological domain, stressful life events (13) and an increased risk for depressive and anxiety symptoms (12, 21, 22) frequently co-occurred. Finally, alcohol use in older adults may have an impact on their social context. Spouses of older adults with alcohol related problems showed more health problems, emotional problems and depressive symptoms and were less involved in social activities (23, 24). Moreover, at risk drinking was associated with social isolation (22, 25).
Given the higher vulnerability for these negative consequences of alcohol, the National Institute for Alcohol Abuse and Alcoholism (NIAAA) developed guidelines  for safe alcohol use especially for this population of older adults. The NIAAA describes the maximum drink limits for adults 65 years and older as ‘drinking no more than three drinks per day and no more than seven drinks in a week’. Drinking more than three drinks per day or more than seven in a week has been considered as risky drinking behaviour. Binge drinking means, for men and women respectively, drinking five and four or more units during one occasion (18). Prevalence figures of at risk alcohol use in Europe are variable. Immonen et al. (2013)reported that 6.4% of their Finish community dwelling older adults were classified as at risk drinkers, whereas Cousins et al. (2014)reported in a population based sample of older Irish adults almost 20% at risk drinkers. This variation is largely due to the use of different methods of assessment and the lack of consistency in the definition of ‘at risk drinking’ in older adults (27). In general, there is a shortage of data on alcohol use among older adults in Europe (28). Also in Belgium knowledge about the prevalence of alcohol use among older adults is limited. Nevertheless alcohol use among community dwelling older adults across the world is rising. According to a longitudinal study in the United States, the prevalence of binge drinking and alcohol use disorders among older adults is significantly increasing. There was a relative increase of 19.2 % for binge drinking and a 23.3% relative increase for alcohol use disorders over the last decade. This increase of unhealthy drinking was significant for both men and women (29). The burden on our health care and on the health of drinking older adults is substantial and may grow the following years as the babyboom generation ages (12). Awareness of the use of alcohol in this population and the associated factors seems necessary in order to provide relevant and adapted prevention programs and interventions and to reduce the negative consequences. In previous studies, the following associated factors with at risk drinking have already been identified. Adults older than 65 years of age in the at risk drinking group were more likely to be men (13, 30, 31), having a higher educational level (19, 31), suffering from depression (32) having a history of alcoholism in the family (13), were currently smoking (13, 19, 31) and were younger than 80 years of age (19, 30).
As older adults make up the fastest growing segment of the population, monitoring their alcohol consumption will be increasingly important, including in our Northern part of Belgium (Flanders). Therefore, the aim of this study is:
1. To describe the prevalence of a. non-drinking, drinking within the guidelines and at risk drinking, b. binge drinking and c. hazardous drinking among older adults in Flanders.
2. To describe the characteristics of a. non-drinking, drinking within the guidelines and at risk drinking, b. binge drinking and c. hazardous drinking among older adults in Flanders.
3. To determine the associated factors of a. at risk drinking, b. binge drinking and c. hazardous drinking among older adults in Flanders.


Methods

This is a retrospective crosssectional study exploring alcohol use and associated factors in community dwelling older adults by using an extensive quantitative survey.

Sample

Adults aged 65 or older and living at home were invited to participated. Older adults reporting memory problems, having a neurodegenerative disease or sensory deficits were excluded. As the questionnaire was in Dutch, older adults needed to have a good comprehension of the Dutch language. If they reported difficulties understanding the questions due to language problems, they were also excluded.
The sample population, enrolled from October 2013 to April 2016, consisted of 1,368 older adults living in the Flemish part of Belgium (Flanders). This study is part of a larger research project on the drinking patterns of older adults in Belgium.
The population was recruited by a snowball sampling. During gatherings in community centres and local activity groups the purpose and  procedure of the study were explained. Subjects were able to sign up and those who did were asked to make an appointment. The appointments were made at their own residence. At that time, a trained research assistant explained the purpose and procedure of the study for a second time. Most older adults were able to complete the questionnaire by themselves, yet the research assistant was at all time available for help and assistance. When both spouses were questioned, they were placed in different rooms of the residence to reduce potential influences. After the assessment, participants were asked if they had acquaintances that would volunteer to fill in the questionnaire. When contacting these acquaintances, only a small number of eligible participants refused to participate, mostly due to the length of the questionnaire.

Measurements

Sociodemographics

The following variables were included: age, gender, educational level (lower then primary school, lower secondary, high secondary, higher education bachelor degree or higher), living arrangement (widowhood, living alone, living together), loss of a loved one in previous year and family history of alcohol problems. The population was categorized into three age groups: the ‘younger older adults’ from 65 to 74 years of age, the ‘older adults’ from 75 to 84 years of age and the ‘older older adults’ ≥ 85 years of age.

Alcohol use

To define alcohol use, two category systems were used. Firstly, participants were categorized as 1. non-drinkers, 2. drinkers within the guidelines or 3. at risk drinkers. ‘Non-drinkers’ were defined by using two questions: ‘How often do you drink alcohol’ and ‘How much alcohol do you drink on a typical day?’. Those questions were based on the first two questions of the Alcohol Use Disorder Identification Test (AUDIT) (33). Respondents answering both questions with ‘never’ and ‘none’ respectively were categorized as non-drinkers. Since there are no specific guidelines for safe alcohol use for older adults in Belgium (www.vad.be) the NIAAA guidelines (18) were used. According to these guidelines ‘at risk drinking’ was defined as exceeding three units a day or seven units a week. Drinking three or less units per day and drinking seven or less units per week was considered as ‘drinking within the guidelines’. Secondly, participants were categorized as non-binge drinkers or binge drinkers. ‘Heavy episodic drinking’ or ‘binge drinking’ for men was defined as drinking five or more alcohol units on the same occasion at least one day per month. For women, binge drinking was defined as more than four units on the same occasion. For this study a standard drink consisted of 10 gram of alcohol (www.vad.be).

Alcohol related problems

The geriatric version of the Michigan Alcohol Screening Test (MAST-G) was used to register self-reported alcohol problems (34). The MAST-G is a suitable screening instrument for older people in a wide range of settings including clinical settings (34-36) and a general population with a sensitivity of 94% and a specificity of 78% (34, 37). This questionnaire consists of 24 items requiring a yes or no answer. The generally accepted cut off value is positively answering five or more items, indicating hazardous drinking (MAST-G score ≥5). The MAST-G screens current alcohol use and reports the alcohol related problems experienced within the past year (34).
Health related factors: The Medical Outcome Study 36-items Short Form (SF36) was used to determine the health related quality of life (HRL) (38). The SF-36 scores were summarized using two constructs: physical component summary (PCS) and mental component summary (MCS). Both constructs were based on the eight domains of the SF-36. PCS and MCS scores are represented on a standardized scale with a mean of 50 and a standard deviation of 10. Higher scores reflect better HRQL (39). Research from Mishra et al. (2011) suggested that the SF-36 questionnaire is an adequate measure for the health perception of an older population. The internal consistency exceeded the minimum standard of 0.80 for both components. Furthermore, the test-retest reliability was proven to be excellent and the construct validity was considerable (38, 40, 41).
Also data on current medication and tobacco use were collected. Participants were asked whether they have taken any prescription and over-the-counter medications. Masnoon et al. (2017) conducted  a systematic review on definitions for polypharmacy. According to their findings, the most commonly used definition for polypharmacy is using five or more medications. Consequently, their definition was implemented in this study for polypharmacy. Tobacco use was assessed by asking the participant if they were current, former or non- smokers.

Statistical analyses

For the statistical analyses the following category systems were used: 1. non-drinkers, drinking within the guidelines versus at risk drinking, 2. non-binge versus binge drinking and 3. non-hazardous versus hazardous drinking.
We conducted bivariate analyses (Chi-square tests for nominal and categorical variables and independent sample t-test or one way ANOVA’s (with Bonferroni correction for multiple comparisons) for continuous variables) to identify the sociodemographic and health related factors of the different category systems mentioned above.
Three binary logistic regression analyses were used to identify predictors associated with 1. at risk drinking, 2. binge drinking and 3. hazardous drinking. The sample size for the binary logistic regressions were based on the subsample of drinkers. All the demographic and health related factors were included as covariates in the three different models.  Adjusted odds rations (OR) with 95% confidence intervals (CI) are presented.
The statistical analyses were conducted using SPSS 25.0 (43).

Statements of ethical approval

This research did receive ethical approval from the Ethical Committee of Middelheim Hospital in Antwerp, reference OG 031; 009. Anonymity and confidentiality were emphasized by the interviewer. A written informed consent was obtained before starting the survey: no names were registered and all the obtained data were processed by the research team.


Results

Sample and population

A total of 1,366 adults aged 65 and older completed the questionnaire. The mean age of the participants was 73.24 years (SD=6.13) and 55.8% were women. The majority were in the age category of 65-74 years (60.8%) and were living with a partner (76%). Nearly 23% reported a loss of a loved one significant person in the past 12 months and 20% reported having a family history of alcohol problems. Almost 10% reported smoking and 24.8% reported polypharmacy at the time of the assessment. The total sample scored a mean of 46.97 (SD=10.16) on PCS and a mean of 53.20 (SD=8.57) on MCS of the SF36.
Among the study sample, 84.4% currently consumed alcohol, 57.8% reported drinking within the guidelines, 26.6% at risk drinking (Table 1) and 14.8% binge drinking (Table 2). A smaller percentage of men (10.1%) were non-drinkers in comparison to female non-drinkers (20%). The alcohol use prevalence among younger older adults (65-74 year) was 85.9% and declined with age. Concerning at risk drinking, more men (38.4%) than women (17.1%) were at risk drinkers. Of the older older adults (85+) 21.1% reported at risk drinking. In the category of at risk drinkers, those living alone (35.5%), having a higher educational level (34.1%) and being a smoker (43.9%) were more presented. Of the drinking population, 24.5% of those drinking within the guidelines and 19.6% of the at risk drinkers reported polypharmacy. The non-drinkers reported a lower MCS and PCS in comparison to the drinkers within the guidelines and the at risk drinkers (respectively t(1150) = 3.51, p=.030 and t(1150) = 12.51, p=<.001). The effect size between the drinking patterns is very small for PCS as for MCS (Partial Eta Squared PCS=.201 and MCS= .006).
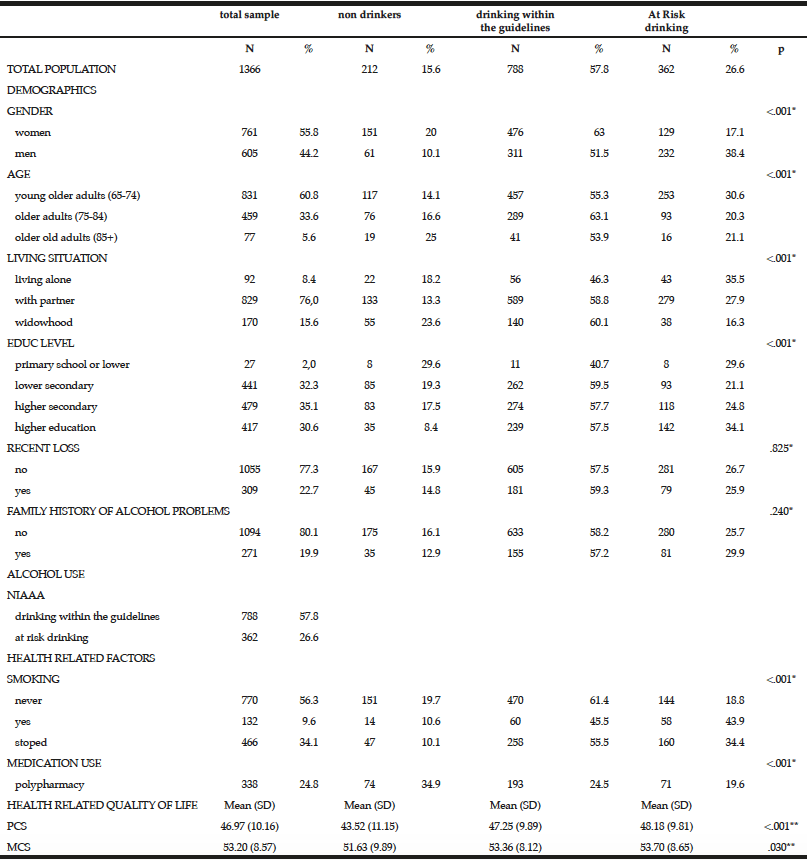
Table 1 Prevalence and characteristics of non-drinking, drinking within the guidelines and at risk drinking among older adults

Table 1
Prevalence and characteristics of non-drinking, drinking within the guidelines and at risk drinking among older adults

* Chi-Square for the three categories non-drinking, drinking within the guidelines and risky drinking; ** Anova analyses with Bonferonni correction for the three categories non-drinking, drinking within the guidelines and risky drinking


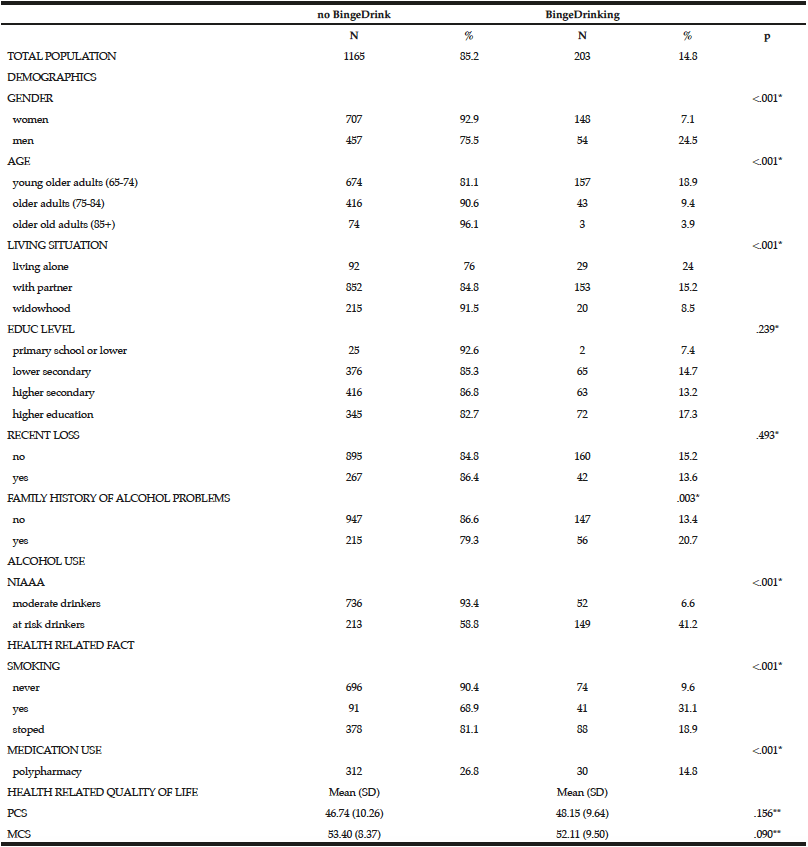
Men (24.5%) were substantially more likely than women (7.1%) to have engaged in binge drinking (Table 2). Almost 20% of the younger cohort (65-74 year) reported binge drinking. Among binge drinkers, more participants were living alone (24%) and were having a family history of alcohol problems (20.7 %). In the binge drinking group, 31.1% reported being a smoker and 14.8% reported polypharmacy. Considering the HRQL, there are no differences between the binge drinking and non-binge drinking groups regarding PCS and MCS (respectively t(1156) = -1.70, p=.156 and t(1156) = 1.85, p=.090).

Table 2 Prevalence and characteristics of binge drinking among older adults

Table 2
Prevalence and characteristics of binge drinking among older adults

* Chi-Square; ** Independent Sample t-test


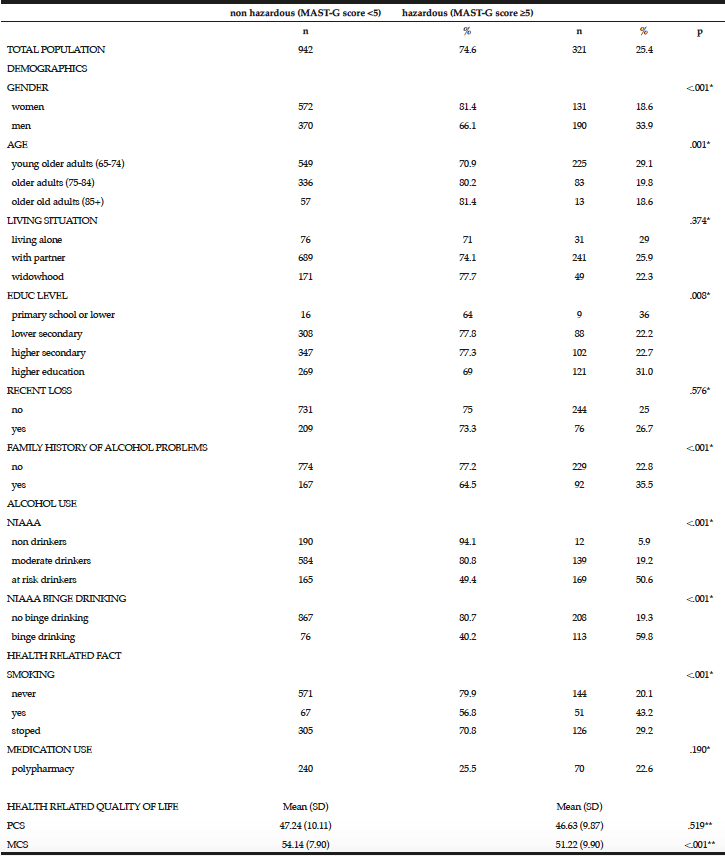
Overall, 25.4% of the total population scored positive on the MAST-G (score ≥5) and were categorized as hazardous drinkers (Table 3). Almost 20% of women and 34% of men reported hazardous drinking (Table 3). The proportion of older adults reporting hazardous drinking declined with age: 29.1% in the age category 65-74 years scored positive on the MAST-G compared with 19.8% of their older peers. Furthermore, older adults with higher education (31%) and those having a family history of alcohol problems (35.5%) reported hazardous drinking. Surprisingly, almost 20% of the older adults drinking within the guidelines scored positive on the MAST-G. Of the older adults categorized as hazardous drinkers, 43.2% reported being a smoker and 22.6% reported polypharmacy. The non-hazardous group scored significantly higher on MCS than the hazardous group (t(1067) = 4.948, p=<.001). PCS was not significant (t(1067) = .877, p=.519).

Table 3 Prevalence and characteristics of hazardous drinking (scoring on Mast-G ≥5)

Table 3
Prevalence and characteristics of hazardous drinking (scoring on Mast-G ≥5)

* Chi-square test; ** Independent Sample t-test


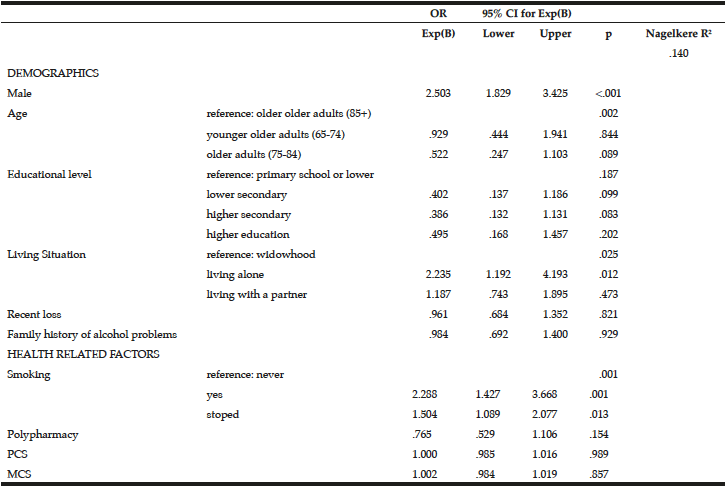
To examine the predictors of at risk drinking, a multivariate logistic regression analysis was performed on the drinking sample (Table 4). Being male (OR=2.503, 95% CI=1.829-3.425, p=<.001),  living alone (OR=2.235, 95% CI=1.192-4.193, p=.012) and being a smoker (OR=2.288, 95% CI=1.427-3.668, p=.001) or a former smoker (OR=1.504, 95% CI=1.089-2.077, p=.013) were associated with at risk drinking.

Table 4 Predictors associated with at risk drinking in a drinking population of older adults

Table 4
Predictors associated with at risk drinking in a drinking population of older adults


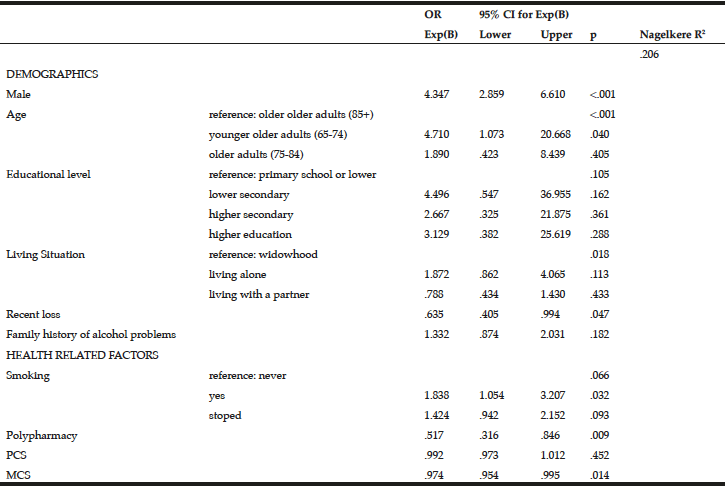
To examine the predictors of binge drinking, a multivariate logistic regression analysis was performed (Table 5). Being male (OR=4.347, 95% CI=2.859-6.610, p=<.001), being between 65 and 74 years (OR=4.710, 95% CI=1.073-20.668, p=.040) and being a smoker (OR=1.838, 95% CI=1.054-3.207, p=.032) were more likely to report binge drinking. Recent loss experience (OR=.653, 95% CI=.405-.994, p=.047), polypharmacy (OR=.517, 95% CI=.316-.846, p=.009) and MCS (OR=.974, 95% CI=.954-.995, p=.014) were inversely associated with binge drinking.

Table 5 Predictors associated with Binge drinking in a drinking population of older adults

Table 5
Predictors associated with Binge drinking in a drinking population of older adults


Multivariate logistic regression modelling of hazardous drinking in the drinking sample (Table 6) confirm that being male (OR=2.273, 95% CI=1.609-3.212, p=<.001) and having a family history of alcohol problems (OR=1.629, 95% CI=1.136-2.336, p=.008) were more likely to report hazardous drinking. PCS (OR=.976, 95% CI=.959-.992, p=.004) and MCS (OR=.950, 95% CI=.933-.968, p=<.001) were inversely associated with hazardous drinking.
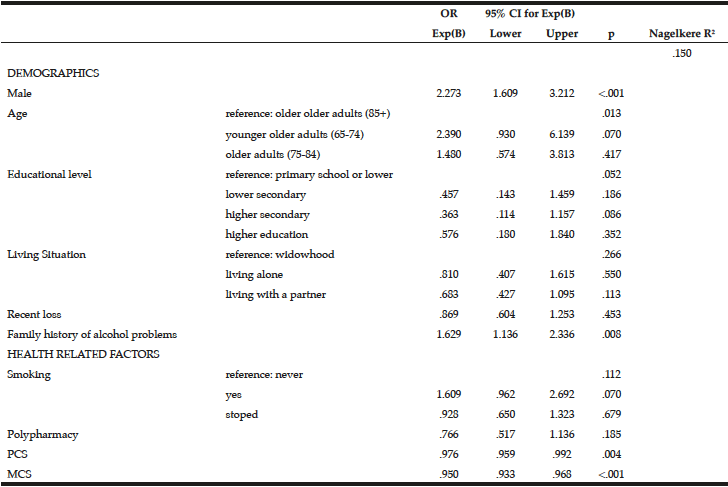
Table 6 Predictors associated with hazardous drinking (score ≥5 on MAST-G) in a drinking population of older adults

Table 6
Predictors associated with hazardous drinking (score ≥5 on MAST-G) in a drinking population of older adults


Discussion

Alcohol consumption was high in our sample, suggesting that the trend of increased alcohol use among older adults is also ongoing in our region [3, 29]. This increase might be due to the growing number of healthy life years in combination with a higher average income (3). Furthermore, the commonality of alcohol use in our culture might be extended in this older segment of the population leading to high prevalence of alcohol consumption. In this study, the NIAAA recommendations were used to define at risk alcohol use and binge drinking in older adults. We found a higher prevalence of at risk drinking and binge drinking than expected in a population of 65 years and older (3, 5, 19, 29, 44). These results raise concerns for health care systems as older adults are more vulnerable for the adverse consequences of alcohol use, especially when consuming alcohol in amounts exceeding NIAAA recommended guidelines (45).
In the at risk drinking category, being male, younger of age (64-75), living with someone, having a higher education and being a former smoker were more frequently represented. The characteristics of binge drinkers determined in this study were being male, younger age (65-74), living with a partner, having a family history of alcohol problem and being a smoker. These characteristics are in line with previous studies (5, 29, 31, 44, 46, 47). Younger older adults reporting at risk and binge drinking more often than their older peers might be due to a survival bias. At risk drinkers and binge drinkers either die at younger age or stop alcohol use at younger age due to health complications (22). Older adults exposed to medication and polypharmacy in combination with alcohol use, are more at risk for alcohol related adverse reactions (9). In our sample, a high prevalence was reported in the different drinking patterns. These older adults, even the ones drinking according to the guidelines, are very likely to use alcohol in circumstances that place them at risk. The increased prevalence of medication use and alcohol use among older adults suggests the necessity for awareness of the potential interactions between medication and alcohol.
Regarding HRQL, self-reported at risk drinkers registered better physical and mental HRQL than non-drinkers. Furthermore, there was no differences in HRQL between binge drinkers and non-binge drinkers. The only two studies to our knowledge evaluating the relationship between alcohol consumption and HRQL in older adults failed to find any association (48, 49). These results may be due to the fact that the development and recognition of negative consequences of at risk alcohol use among older adults may not yet have fully manifested (48). Because older adults generally drink less, health care providers might be less likely to recognize the adverse consequences of alcohol use in an older population (34). Clearly more information is needed to better understand the association between alcohol use and HRQL among older adults (48).
The prevalence rate of older adults reporting hazardous drinking is much higher than other studies (2, 5, 50). A systematic analysis of comparison, however, between all studies is hampered by the different assessment tools for alcohol related problems. This diversity in tools indicates the necessity for more research with more deliberate use of standardised measurements. To date, the MAST-G is the only screening tool for alcohol related problems designed for the older segment of the population. The recognition of the MAST-G as an appropriate instrument for the screening of alcohol related problems in older adults (5, 34) might be useful to overcome this issue.
There is a substantial alcohol related harm and health risk in older adults (2, 51). In our sample, alcohol consumption in excess of NIAAA guidelines was associated with an elevated risk for hazardous drinking. A large portion of the at risk drinkers and binge drinkers scored positive on the MAST-G demonstrating that these two drinking patterns are very precarious for older adults. Drinking in excess of guidelines might result in higher risks for morbidity, including accidents and mortality because older adults are more vulnerable for the adverse consequences of alcohol mortality (19, 37, 52). Furthermore, results of a multi-country study indicated that older adults are not sufficiently informed about alcohol use and the effects on their physical and mental health (53). More surprisingly, almost one fifth of the older adults drinking within the guidelines of safe drinking, could be categorized as hazardous drinkers. These results suggest that a large proportion of older adults with a significant amount of alcohol related problems are unlikely to be identified as such by their health care givers if that identification relies only on whether their consumption exceeds the recommended limits. Our results should increase awareness on the need for proper prevention and information about unhealthy alcohol use among older adults.
Our results are relevant for health care givers wishing to help and advice older adults on their at risk and binge drinking behaviour. Inadequate information about which older adults are at high risk for the adverse consequences of alcohol consumption makes it challenging to give advice to older adults that could benefit from such counselling (30). In our drinking sample, being male, living alone and being a smoker of former smoker are predictors for at risk drinking. These findings are in line with previous studies (6, 12, 30). In addition, binge drinking was associated with being male, being 65-74 years, having a recent loss experience, MCS, being a smoker and polypharmacy. These results may be helpful for health care givers to identify older adults at greater risk for unhealthy drinking habits.
Older adults reporting a significant and harmful amount of alcohol related problems due to their alcohol consumption were categorized as hazardous drinkers. According to multivariate analyses with the sample of drinkers, being male and having a family history of alcohol problems are predictors for hazardous drinking. Higher PCS and MCS were protective factors against hazardous drinking.

Limitations of this study

Despite the fact that questionnaires have been reported as an accurate and reliable measurement (34) and ensuring anonymity, alcohol use as a topic may still be seen as taboo which may lead to socially desirable answers. Consequently, the results on at risk and binge drinking may be underreported and underestimated. Therefore, we should be careful with the interpretations of these prevalence figures.
The relationship between alcohol patterns, socio-demographic characteristics and alcohol related problems are reported as associations due to the cross-sectional nature of the data. It is not possible to determine causality between the different variables.  Neither information on past changes in drinking habits nor a timeline of alcohol use and life events were available. More research on the causality between alcohol use and alcohol related problems with its associated factors is needed. A prospective cohort study seems most appropriate to further study alcohol and its associated factors in this population.
This article has provided an overview of the alcohol use and alcohol related problems and its associated factors among the Flemisch Belgian community dwelling older adults. The high prevalence of alcohol use and alcohol related problems reported in this study is an important issue. Prevalence data concerning alcohol use and alcohol related problems are necessary to understand the drinking patterns of older adults in our country. This is one of the few studies exploring the alcohol use and alcohol related problems of a community dwelling sample of older adults in Belgium. This emphasises the poverty of data concerning alcohol consumption among older adults in our area. An increased attention among public health, care givers and older adults is necessary otherwise at risk alcohol problems in future older generations could be left unnoticed if attention is not given to this issue.


Funding: This research did not receive any grant from funding agencies in the public, commercial, or not-for-profit sectors.

Competing interests: All authors declare that they have no competing interests.

List those individuals who provided help during research: The authors wish to thank all the older adults for participating in this research and all the research assistants for collecting the data.


References

1.    Platt, A., F.A. Sloan, and P. Costanzo, Alcohol-Consumption Trajectories and Associated Characteristics Among Adults Older Than Age 50. Journal of Studies on Alcohol and Drugs, 2010. 71(2): p. 169-179.
2.    Moos, R.H., et al., Older Adults’ Alcohol Consumption and Late-Life Drinking Problems: A 20-Year Perspective. Addiction (Abingdon, England), 2009. 104(8): p. 1293-1302.
3.    Geels, L.M., et al., Increases in alcohol consumption in women and elderly groups: evidence from an epidemiological study. BMC Public Health, 2013. 13(1): p. 207.
4.    Hallgren, M., P. Högberg, and S. Andréasson, Alcohol consumption and harm among elderly Europeans: falling between the cracks. European Journal of Public Health, 2010. 20(6): p. 616-617.
5.    Hoeck, S. and G. Van Hal, Unhealthy drinking in the Belgian elderly population: prevalence and associated characteristics. European Journal of Public Health, 2013. 23(6): p. 1069-1075.
6.    Immonen, S., J. Valvanne, and K.H. Pitkala, Older adults’ own reasoning for their alcohol consumption. International Journal of Geriatric Psychiatry, 2011. 26(11): p. 1169-1176.
7.    Aira, M., S. Hartikainen, and R. Sulkava, Community prevalence of alcohol use and concomitant use of medication–a source of possible risk in the elderly aged 75 and older? Int J Geriatr Psychiatry, 2005. 20.
8.    Breitling, L., et al., Low-to-moderate alcohol consumption and smoking cessation rates: Retrospective analysis of 4576 elderly ever-smokers. Drug and Alcohol Dependence, 2010. 108(1): p. 122-129.
9.    Cousins, G., et al., Potential for alcohol and drug interactions in older adults: evidence from the Irish longitudinal study on ageing. BMC Geriatrics, 2014. 14(1): p. 57.
10.    Gargiulo, G., et al., Moderate alcohol consumption predicts long-term mortality in elderly subjects with chronic heart failure. The journal of nutrition, health & aging, 2013. 17(5): p. 480-485.
11.    Hallgren, M., P. Hogberg, and S. Andreasson, Alcohol consumption among elderly European Union citizens: health effects, consumption trends and related issues. 2009, Ostersund: Swedish National Institute of Public Health.
12.    Merrick, E.L., et al., Unhealthy drinking patterns in older adults: prevalence and associated characteristics. J Am Geriatr Soc, 2008. 56.
13.    Sacco, P., K.K. Bucholz, and E.L. Spitznagel, Alcohol Use Among Older Adults in the National Epidemiologic Survey on Alcohol and Related Conditions: A Latent Class Analysis. Journal of Studies on Alcohol and Drugs, 2009. 70(6): p. 829-838.
14.    Borok, J., et al., Why do older unhealthy drinkers decide to make changes or not in their alcohol consumption? Data from the Healthy Living as You Age study. J Am Geriatr Soc, 2013. 61(8): p. 1296-302.
15.    McClure, L.A., et al., Risky drinking in the older population: A comparison of Florida to the rest of the US. Addictive Behaviors, 2013. 38(4): p. 1894-1897.
16.    Rehm, J., et al., The relationship between different dimensions of alcohol use and the burden of disease—an update. Addiction, 2017. 112(6): p. 968-1001.
17.    Halme, J.T., et al., Alcohol consumption and all-cause mortality among elderly in Finland. Drug and Alcohol Dependence, 2010. 106(2): p. 212-218.
18.    NIAAA, Helping patients who drink too much: a Clinician’s guide. 2005, US: Department of Health and Human Services.
19.    Immonen, S., J. Valvanne, and K.H. Pitkala, Prevalence of at-risk drinking among older adults and associated sociodemographic and health-related factors. Journal of Nutrition Health & Aging, 2011. 15(9): p. 789-794.
20.    Leclerc, B.S., et al., A Classification and Regression Tree for Predicting Recurrent Falling among Community-dwelling Seniors Using Home-care Services. Canadian Journal of Public Health / Revue Canadienne de Sante’e Publique, 2009. 100(4): p. 263-267.
21.    Ilomäki, J., et al., Alcohol consumption and tobacco smoking among community-dwelling older Australian men: The Concord Health and Ageing in Men Project. Australasian Journal on Ageing, 2014. 33(3): p. 185-192.
22.    Kirchner, J.E., et al., Alcohol consumption among older adults in primary care. J Gen Intern Med, 2007. 22.
23.    Moos, R.H., et al., Spouses of Older Adults With Late-Life Drinking Problems: Health, Family, and Social Functioning. Journal of Studies on Alcohol and Drugs, 2010. 71(4): p. 506-514.
24.    Nadkarni, A., et al., The psychological impact of heavy drinking among the elderly on their co-residents: The 10/66 group population based survey in the Dominican Republic. Drug and Alcohol Dependence, 2011. 114(1): p. 82-86.
25.    Choi, N.G. and D.M. DiNitto, Psychological distress, binge/heavy drinking, and gender differences among older adults. Am J Addict, 2011. 20.
26.    Immonen, S., J. Valvanne, and K.H. Pitkala, The prevalence of potential alcohol-drug interactions in older adults. Scand J Prim Health Care, 2013. 31.
27.    Gilson, K.M., Risky Drinking in Older Adults: Toward Better Awareness and Screening in Clinical Practice. Autralian Clinical Psychologist, 2016. 2(1).
28.    Anderson, P., L. Møller, and G. Galea, Alcohol in the European Union: Consumption, harm and policy approaches. 2012, Copenhagen: WHO Regional Office for Europe.
29.    Han, B.H., et al., Demographic trends of binge alcohol use and alcohol use disorders among older adults in the United States, 2005–2014. Drug and Alcohol Dependence, 2017. 170(Supplement C): p. 198-207.
30.    Barnes, A.J., et al., Prevalence and correlates of at-risk drinking among older adults: the project SHARE study. J Gen Intern Med, 2010. 25.
31.    Touvier, M., et al., Demographic, socioeconomic, disease history, dietary and lifestyle cancer risk factors associated with alcohol consumption. International Journal of Cancer, 2014. 134(2): p. 445-459.
32.    St. John, P.D., P.R. Montgomery, and S.L. Tyas, Alcohol misuse, gender and depressive symptoms in community-dwelling seniors. International Journal of Geriatric Psychiatry, 2009. 24(4): p. 369-375.
33.    Babor, T.F., et al., AUDIT: The Alcohol Use Disorders Identification Test – Guidelines for Use in Primary Care. 2001, Geneva: World Health Organization, Department of Mental Health and Substance Dependence.
34.    Blow, F.C., Treatment Improvement Protocol (TIP) Series No. 26. Rockville, MD:U.S. Departement of Health and Human Services, Public Health Service, Substance Abuse and %ental Health Services Administration, Center for Substance Abuse Treatment. 1998.
35.    Beullens, J. and B. Aertgeerts, Screening for alcohol abuse and dependence in older people using DSM criteria: a review. Aging & Mental Health, 2004. 8(1): p. 76-82.
36.    Fiellin, D.A., M. Reid, and P.G. O’Connor, Screening for alcohol problems in primary care: A systematic review. Archives of Internal Medicine, 2000. 160(13): p. 1977-1989.
37.    Barry, K.L. and F.C. Blow, Drinking Over the Lifespan: Focus on Older Adults. Alcohol Research : Current Reviews, 2016. 38(1): p. 115-120.
38.    Ware, J.E. and B. Gandek, Overview of the SF-36 Health Survey and the International Quality of Life Assessment (IQOLA) Project. Journal of Clinical Epidemiology, 1998. 51(11): p. 903-912.
39.    Mishra, G.D., R. Hockey, and A.J. Dobson, A comparison of SF-36 summary measures of physical and mental health for women across the life course. Quality of Life Research, 2014. 23(5): p. 1515-1521.
40.    Mishra, G.D., et al., How useful are the SF-36 sub-scales in older people? Mokken scaling of data from the HALCyon programme. Quality of Life Research, 2011. 20(7): p. 1005-1010.
41.    Brazier, J.E., et al., Validating the SF-36 health survey questionnaire: new outcome measure for primary care. British Medical Journal, 1992. 305(6846): p. 160-164.
42.    Masnoon, N., et al., What is polypharmacy? A systematic review of definitions. BMC Geriatrics, 2017. 17(1): p. 230.
43.    IBM, C., IBM SPSSS Statistics for Windows, Version 25.0. Armonk, NY. IBM Corp., Released 2017.
44.    Blazer, D.G. and L.T. Wu, The epidemiology of at-risk and binge drinking among middle-aged and elderly community adults: National Survey on Drug Use and Health. Am J Psychiatry, 2009. 166.
45.    Moore, A.A., et al., Alcohol use, comorbidity, and mortality. J Am Geriatr Soc, 2006. 54.
46.    Kaplan, M.S., et al., The association between alcohol use and long-term care placement among older Canadians: A 14-year population-based study. Addictive Behaviors, 2014. 39(1): p. 219-224.
47.    Castro-Costa, E., et al., Alcohol consumption in late-life — The first Brazilian National Alcohol Survey (BNAS). Addictive Behaviors, 2008. 33(12): p. 1598-1601.
48.    Martinez, P., et al., Quality of life and social engagement of alcohol abstainers and users among older adults in South Africa. BMC Public Health, 2014. 14(1): p. 316.
49.    Ortolá, R., et al., Patterns of alcohol consumption and health-related quality of life in older adults. Drug and Alcohol Dependence, 2016. 159: p. 166-173.
50.    Lopes, M.A., et al., Prevalence of Alcohol-Related Problems in an Elderly Population and Their Association With Cognitive Impairment and Dementia. Alcoholism: Clinical and Experimental Research, 2010. 34(4): p. 726-733.
51.    Wilson, S.R., et al., The Prevalence of Harmful and Hazardous Alcohol Consumption in Older U.S. Adults: Data from the 2005–2008 National Health and Nutrition Examination Survey (NHANES). Journal of General Internal Medicine, 2014. 29(2): p. 312-319.
52.    Jeong, H.G., et al., Impact of alcohol use on mortality in the elderly: Results from the Korean Longitudinal Study on Health and Aging. Drug and Alcohol Dependence, 2012. 121(1): p. 133-139.
53.    Rundle-Thiele, S., et al., Benchmarking Aclohol Literacy: A Multi Country Study. Modern Managment Review, 2013. 18(20): p. 99-111.

NUTRITIONAL ADEQUACY AND ORAL NUTRITIONAL SUPPLEMENTATION IN OLDER COMMUNITY-DWELLING ADULTS


L. McKeever1, I.C. Farrar2, S. Sulo3, J. Partridge3, P. Sheean4, M. Fitzgibbon5,6


1. Department of Kinesiology and Nutrition, College of Applied Health Sciences, University of  Illinois at Chicago, Chicago, IL, USA; 2. Survey Research Laboratory, University of Illinois at Chicago, Chicago, IL; USA; 3. Abbott Nutrition Research & Development, Columbus, OH, USA; 4. Marcella Niehoff School of Nursing, Loyola University, Chicago, IL, USA; 5. Institute for Health Research and Policy, University of Illinois at Chicago, Chicago, IL, USA; 6. Department of Pediatrics, College of Medicine, University of Illinois at Chicago, Chicago, IL, USA

Corresponding Author: Liam McKeever, PhD, RDN, University of Illinois at Chicago, Department of Kinesiology and Nutrition, College of Applied Health Sciences, 1919 W. Taylor St, Applied Health Sciences Building, Room 633, Chicago, IL 60612, Email: wmckee2@uic.edu, Phone: 773-263-2492

J Aging Res Clin Practice 2019;8:7-14
Published online January 2, 2019, http://dx.doi.org/10.14283/jarcp.2019.2


Abstract

Background: Older adults (65 years and older) comprise a high-risk group that are susceptible to the development of malnutrition. Dietary intake and diet quality represent key modifiable risk factors to help prevent and to treat declines in nutrition status, with oral nutritional supplements (ONS) often being a cost-effective therapy for many to increase protein and caloric intake. The DETERMINE Checklist offers a series of questions capable of mapping the initial landscape of contextual factors that influence the dietary patterns of the at-risk populations. Objectives: To examine independent predictors of inadequate dietary intake and poor diet quality amongst a multi-ethnic sample of urban community-dwelling older adults in an effort to identify target groups of participants that could benefit most from an ONS intervention. Design: Cross-sectional. Participants: Chicago, Illinois, United States urban residents greater than 55 years of age who self-reported to be non-Hispanic White, non-Hispanic Black, or Hispanic. Methods: Telephone surveys were conducted to obtain basic demographic information. The DETERMINE Checklist was administered to (1) characterize participants’ nutritional risk, and (2) identify participants with inadequate intake and/or poor diet quality. Predictors of inadequate intake, defined as any participant who reported either to eat less than two meals per day and/or poor diet quality, defined as any participant who reported to eat few fruits, vegetables or dairy were used to identify groups of participants who could benefit most from ONS consumption. Mantel-Hanzel chi square, Breslow-day tests, and logistic regressions were conducted. Results: 1001 ethnically diverse participants were interviewed (37% non-Hispanic White, 37% non-Hispanic Black, and 26% Hispanic). Respondents were predominantly female (69%) with a mean age of 66.9 (± 6.4) years. The majority were found to be at either moderate or high nutrition risk (78.7%). Domains of the DETERMINE Checklist that predicted either inadequate dietary intake or poor diet quality included social isolation, lower levels of educational attainment, food insecurity, limitations in activities of daily living (ADL), polypharmacy, or three or more alcoholic drinks per day. Of the participants who met the criteria as those who would benefit from ONS, less than 50% had reported consuming ONS in the past six months. Conclusion: Older community-dwelling adults living in an urban setting, especially those with social isolation, lower levels of education, food insecurity, limitations with ADLs, polypharmacy, and those reporting heavy alcohol intake represent a population who could benefit from consuming ONS. Efforts should be made towards further understanding these contextual factors and providing nutrition education along with an ONS intervention that could be beneficial to supplement dietary inadequacies in this population.

Key words: Nutrition risk, community nutrition, older adults, oral nutritional supplement, DETERMINE Checklist.


Introduction

Older adults (65 years and older) comprise a high-risk group that are susceptible to the development of malnutrition. This can occur due to decreased macronutrient intake, poor diet quality (1), mental illness (2, 3) impaired mastication (3, 4) polypharmacy (4), social isolation (5, 6), poverty (1), and declines in activities of daily living (ADL) (4, 7, 8). Preventing or treating malnutrition in this population is important, as it is associated with increased mortality (9), hospital readmission (10, 11), unplanned weight loss (1), increased fractures (12, 13), and loss of independence (14).  Dietary intake and diet quality represent key modifiable risk factors to help prevent and to treat declines in nutrition status, with oral nutritional supplements (ONS) often being a cost-effective therapy for many to increase protein and caloric intake. In fact, when ONS is used independently and in combination with other nutrition interventions (e.g., education, dietary counseling, etc.) among community-dwelling adults, it may result in overall cost savings due to improving health outcomes of at-risk for malnutrition patients (15-17).
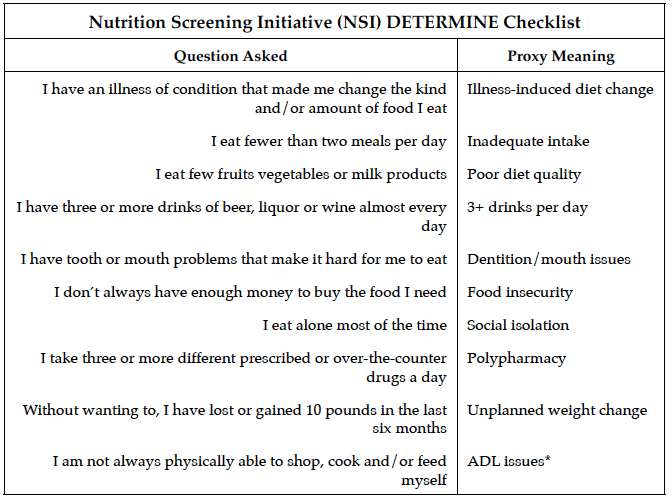
In 1993, the Nutrition Screening Initiative (NSI) developed the DETERMINE Checklist, a nutrition screening tool of 10 questions designed to identify older adult patients who would benefit from more in-depth nutrition assessment (1). This checklist was created primarily to facilitate the education of patients on the importance of nutrition as well as to inform clinicians of the unique dietary needs of older adults. While the DETERMINE Checklist was not designed as a stand-alone screening tool, its 10 questions cover a broad range of scenarios that characterize the unique challenges of the aging population. Of these 10 questions, 1 relates to inadequate intake, identifying patients who ‘eat fewer than 2 meals per day.’ One relates to poor diet quality, detecting patients who eat ‘few fruits, vegetables, or milk products,’ while the remaining 8 questions categorize possible causes for inadequate intake or poor diet quality.
To date, the literature exploring malnutrition in the United States (USA) within community settings is limited and few studies have specifically examined the independent root causes of modifiable malnutrition risk factors. Therefore, the objective of this study was to use the DETERMINE Checklist to: (1) examine the independent predictors of inadequate intake and poor diet quality amongst a multi-ethnic sample of older urban community-dwelling adults, and (2) to use those predictors to identify target groups (Predictor Groups) of participants that could benefit most from ONS intervention.


Methods

This cross-sectional study was conducted in community-dwelling Chicago, Illinois (USA) residents greater than 55 years of age. Respondent information was collected via a telephone survey, which was created by a multidisciplinary team of researchers in collaboration with the Survey Research Laboratory of the University of Illinois at Chicago (SRL). The telephone interviews were conducted by the Interviewing Service of America (ISA).
Interviewer Training: Twenty-nine interviewers from ISA underwent a rigorous 24-hour general training in telephone interviewing skills. They were then trained specifically on the components of the study survey by expert personnel. This included orientation to the background and purpose of the study, training in each survey question, and practice interviews.

Field Procedures

This study was conducted over 4 months. Four sample frames were used; two random digit dial (landline and cell) and two listed (landline and cell). The two listed sample frames were targeted to reach participants within the selected age range and race/ethnicity distributions. Potential participants were called up to 6 times before determining them unreachable.  Computer Assisted Telephone Interviewing (CATI) software was used to administer the survey. Interviews were conducted in English and Spanish on weekends and weekday evenings. Respondents were told the interview would last approximately 20 minutes and they would be paid $10 for their participation if they provided their mailing address.

Participants

Eligible participants for this study were any person residing within the City of Chicago, Illinois, USA who used a landline or a cell phone with a Chicago area code. To be included in the survey, participants had to self-report their race/ethnicity as non-Hispanic White, non-Hispanic Black, or Hispanic; speak either English or Spanish; be 55 years of age or older; and be willing to participate in the study.

The Survey

The goal of the survey was to characterize nutritional risk, specifically seeking information regarding ONS usage. Components of the survey included in the analysis were basic sociodemographic information (i.e., gender, age, height, weight, education, insurance status), administration of the DETERMINE Checklist, and recent ONS usage.

Nutritional Risk

The DETERMINE Checklist is a list of 10 yes/no statements surveying various predetermined risk factors related to malnutrition risk in the older adults. Originally, the DETERMINE Checklist was tested in adults greater than 70 years of age (1), but has since been used and validated in adults as young as 60 years (18, 19). Usually, a score ranging from 0 to 21 is generated from these yes/no comments on nutrition risk in general:  no nutritional risk (0-2), moderate nutritional risk (3-5) or high nutritional risk (6 or more). The current study abandons analysis of the score itself, but makes use of the questions as system of independent and dependent variables to predict groups that might benefit most from ONS.  Figure 1 lists the DETERMINE Checklist questions and details the proxy terms used to describe the study variables. For the purpose of this study, a participant with ‘Inadequate Intake’ was defined as anyone who answered ‘yes’ to the DETERMINE Checklist item for eating fewer than 2 meals per day. A participant with ‘Poor Diet Quality’ was defined as anyone who answered ‘yes’ to the DETERMINE Checklist item for eating few fruits, vegetables, or milk products. These are simple, yet efficient screening questions that directly address the root sources of malnutrition.


Figure 1 The NSI DETERMINE Checklist and Proxy Terms for Each Item

Figure 1
The NSI DETERMINE Checklist and Proxy Terms for Each Item


ONS

ONS was defined for the participants as liquid beverages found in the pharmacy section of their grocery store or in special sections of their pharmacy that are consumed in addition to food when diet alone cannot fully provide calorie, protein, and other nutrient needs. Participants were asked whether they had consumed ONS in the past six months.

Outcome Variables

The analysis centered on identifying groups of participants who had increased odds of inadequate intake and/or poor diet quality. Potential groups explored were participants who answered ‘yes’ to any of the remaining 8 domains of the DETERMINE Checklist, as well as the standard sociodemographic variables. Groups with increased odds of either inadequate nutritional intake and/or poor diet quality were labeled Predictor Groups as they were predictive of those two variables and constituted groups of participants who could benefit most from ONS consumption.

Statistical Analysis

Utilizing basic demographic information from the survey, and data from the DETERMINE Checklist, our analysis centered on identifying groups of participants who had increased odds of inadequate dietary intake and/or poor diet quality. Groups with increased odds of either inadequate intake and/or poor diet quality were labeled Predictor Groups as they were predictive of those two variables and constituted groups of participants who could benefit most from ONS consumption. Descriptive statistics were conducted to assess differences stratified by gender and race/ethnicity. Predictors of inadequate intake and poor diet quality were explored using Mantel-Hanzel chi square tests and logistic regression modeling. Potential predictors explored included the 8 other components of the DETERMINE Checklist as well as basic sociodemographic variables. Breslow-Day tests were then used to explore effect modification amongst the potential predictors. Model one explored predictors of inadequate intake and model two explored predictors of poor diet quality. Regression diagnostics were run to assess collinearity amongst variables and manual backwards elimination with an alpha cut-point of <0.05 being used to derive the final models. All statistical analyses were run in SAS 9.4.


Results

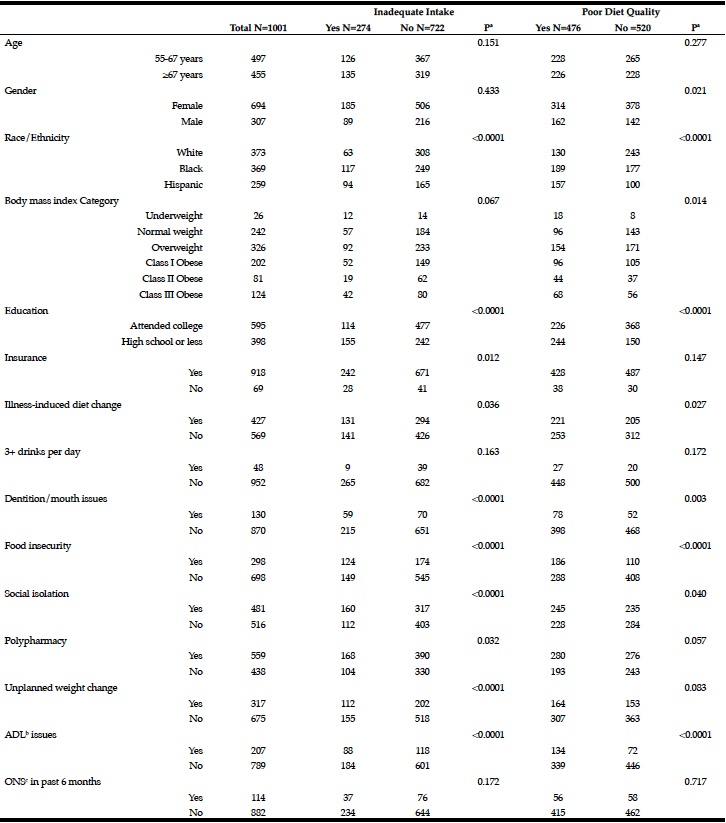
The ISA database contained 64,475 relevant phone numbers. Ninety percent of these numbers were unusable (n=57,381) because they were no longer working (42%; n=27,022), the participant did not answer (27%, n=17,427), they went to voicemail (19%, n=11,922), or the participant was no longer living in Chicago (2%, n=1,010). Of the 7064 remaining numbers, 1001 participants were found eligible, able and willing to complete the interview. Based on the ratio of participants eligible, able and willing to complete the survey and patients known to be eligible, but unwilling or unable, our response rate was 85.8% (n=1001/1165). Based on the sum of eligibility estimates from the larger unreachable sample and the known eligible, a more conservative response rate of 7.7% (n= 1001/12,948) was calculated. The mean age of respondents was 66.9 (± 6.4) years.  Respondents were predominantly female (69%) with fairly equal distribution by race/ethnicity [non-Hispanic White (37%), non-Hispanic Black (37%) and Hispanic (26%)]. Education attainment was high overall with approximately 60% of participants reporting they attended ‘at least some college.’ College attendance was particularly low, however, amongst Hispanics (28%) as compared to non-Hispanic Blacks (60%) and non-Hispanic Whites (82%). Over 73% of the population was either overweight or obese. Very few participants in our sample were underweight (3%) as defined by BMI<18.5 kg/m2. The DETERMINE Checklist found 28.6% of participants to be at moderate nutrition risk and 50.1% of participants to be at high nutrition risk.  Frequency tables for sociodemographic characteristics and DETERMINE Checklist risk factors stratified by oral intake status and diet quality are presented in Table 1. Inadequate dietary intake and poor diet quality were more common in participants with illness-induced diet changes, poor dentition and oral disease, food insecurity, social isolation, polypharmacy, limitations in ADL, and lower levels of educational attainment. Poor diet quality was more common in men.

Table 1 Sociodemographic and NSI DETERMINE Risk Factor Characteristics Stratified by Oral Intake and Diet Quality

Table 1
Sociodemographic and NSI DETERMINE Risk Factor Characteristics Stratified by Oral Intake and Diet Quality

a. Tests for difference between male and female and between race/ethnicity groups: Mantel Hanzel Chi Square tests were used for all variables using P-values derived from nonzero correlation for ordinal variables and general association for all other variables; b. ADL=Activities of Daily Living; c. ONS=Oral Nutritional Supplements


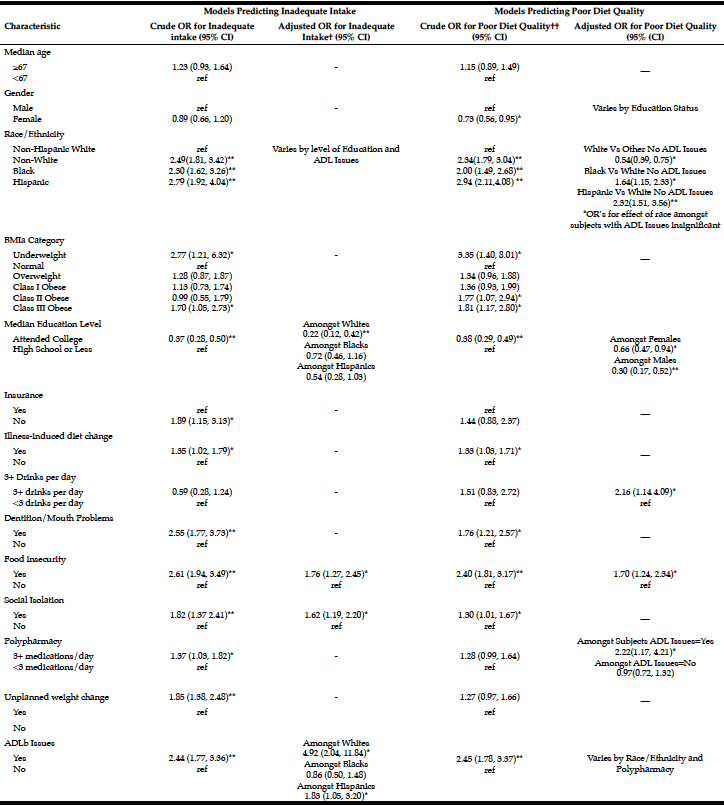
Table 2 provides the predictive modeling results for ‘inadequate dietary intake’ and ‘poor diet quality.’ Overall, inadequate dietary intake was higher in participants reporting food insecurity (P=0.0007) and social isolation (P=0.0019) compared to those who did not. Among non-Hispanic White participants, inadequate nutritional intake was more common in those who did not attend college (P<0.0001) compared to those that attended at least some college. While this association is directionally similar amongst non-Hispanic Black and Hispanic participants, it did not achieve statistical significance. Compared to those who did not have limitations in ADLs, having ADL limitations was associated with inadequate intake amongst non-Hispanic Whites (P=0.0004) and Hispanics (P=0.0302), but not amongst non-Hispanic Black participants (P=0.5922).

Table 2 Crude and Adjusted Odds Ratios (OR) for Logistic Regression Models predicting Inadequate Intake and Poor Diet Quality

Table 2
Crude and Adjusted Odds Ratios (OR) for Logistic Regression Models predicting Inadequate Intake and Poor Diet Quality

a. BMI=Body Mass Index; b. ADL=Activities of Daily Living; †Median Age, gender, BMI Category, Insurance, Illness-induced diet change, 3+ Drinks per day, Dentition/Mouth Problems, Unplanned Weight Change were assessed but were statistically insignificant and dropped from the model; ††Median Age, BMI Category, Insurance, Illness-induced diet change, Dentition/Mouth Problems, Social Isolation, and Unplanned Weight Change were assessed but were statistically insignificant and dropped from the model; *P-value <0.05; **P-value <0.0001


Poor Diet Quality was also higher in participants with food insecurity (P=0.0010) and in those who reported consumption of 3 or more alcoholic drinks per day (P=0.0175). Specifically, poor diet quality was more common in women (P<0.0001) and men (P=0.0209) who did not attend college versus those who did, with college attendance being over two times more protective in men compared to women. Amongst participants without ADL limitations, poor diet quality was more common in non-Hispanic Black (P=0.0061) and Hispanic (P<0.0001) participants compared to non-Hispanic Whites. Amongst those who had ADL limitations, poor diet quality was more common in participants who claimed to take 3 or more medications per day (P=0.0150).

Table 3 Analysis of Subjects Who Would Benefit from Oral Nutritional Supplementation (ONS) by Predictor Group

Table 3
Analysis of Subjects Who Would Benefit from Oral Nutritional Supplementation (ONS) by Predictor Group

a. The number and percent of subjects in the predictor group; b. The number and percent of those in the predictor group who also have either inadequate intake or poor diet quality; c. The number of participants in the predictor group who have either inadequate intake or poor diet quality and who have not taken oral nutritional supplements in the past six months. The percent represents the percent of participants in the total predictor group to target with ONS Intervention; d. ADL = Activities of Daily Living


In total, 585 participants (58%) reported either inadequate dietary intake or poor diet quality; thereby meeting the pre-defined criteria for requiring ONS. Of these 585, only 73 participants (13%) had reported consuming ONS in the past 6 months. Table 3 lists the predictor groups that could benefit most from ONS. Groups to target with ONS therapy include those reporting: social isolation, lower levels of educational attainment, food insecurity, ADL limitations, polypharmacy, or those who drink three or more drinks per day. The percentage of participants in these groups who met the criteria as someone who would benefit from ONS but who had not recently consumed ONS were 55%, 65%, 68%, 63%, 64%, and 54% respectively.


Discussion

Based upon results of the DETERMINE Checklist administered by telephone survey, this study demonstrated that social isolation, less educational attainment, low income, heavy daily alcohol intake, compromised ADL, and polypharmacy were significant independent predictors for inadequate dietary intake and/or poor diet quality among an ethnically diverse, predominantly female community sample. Although these results are consistent with existing literature (5, 6, 19-21), what is perhaps more interesting in our study is that so few participants in these predictor groups who could potentially benefit from ONS reported to be consuming ONS.  This finding reveals a large group who could benefit most from this simple and cost-effective intervention (15, 22).
Poor diet quality and inadequate dietary intake are common themes amongst older community-dwelling adults. In 2015, Borg et al. (23) published a meta-analysis of 44 trials in Western countries in community-dwelling older adults with a pooled sample size of 14,419 participants comparing energy and macronutrient intake against normal reference values. The average energy intake was approximately 13% below the estimated average requirement of 2,450 kcals/day. In general, the oral diets of these older participants were below the acceptable macronutrient distribution ranges (AMDR) for carbohydrates, on the lower end of the AMDR for protein, and on the higher end for fat. These diets were 3% above the upper acceptable range for saturated fat and low in mono- and poly-unsaturated fats. Vitamin and mineral intake is low in older adult diets as well. In one study (19) of 345 elderly homebound Georgians, 81% had intakes deficient in magnesium, 94% in vitamin E, and 51% in zinc. Perhaps more alarming was that >95.6% had deficient calcium intake and almost every participant reported inadequate vitamin D intake. In this study, skipping breakfast alone was associated with deficient energy intake as well as inadequate intake of 12 essential nutrients.
Studies exploring the effects of ONS on clinically relevant outcomes in older adults are abundant. The National Collaborating Center for Acute Care (in United Kingdom) performed a series of meta-analyses (24) exploring the pooled effects of randomizing hospital and community-dwelling subjects to receive proprietary ONS versus standard care. Randomization to receive ONS was found to significantly decrease the risk of mortality and complications, hospital length of stay, and increased weight gain. In addition, ONS has also been found to play a vital role in preventing hospital readmissions. In 2013, Stratton et al. performed a meta-analysis (25)that found a 41% reduced odds of hospital readmission amongst older adults using ONS in addition to standard care as compared to controls receiving only standard care.  Further, adherence to ONS therapy in older individuals appears to be met with minimal resistance.  A meta-analysis (26) of 32 randomized controlled trials and 14 non-randomized studies was performed to confirm compliance to ONS regimens. Overall pooled compliance in community settings was 80.9%. The mean age of the study participants overall (hospital and community-dwellers combined) was 74 years.
Despite the current evidence supporting the positive impact ONS has on various health outcomes for at-risk individuals, very few who might benefit from ONS are actually consuming ONS. In our study, of the 58% of participants classified as individuals who would benefit from ONS due to their poor dietary patterns, only approximately 12% had reported consuming an ONS in the past 6 months. These findings imply that registered dietitians and other healthcare professionals, given their patient’s dietary needs, should target their nutrition education for ONS supplementation towards the key Predictor Groups identified in this study as they are the most likely to have inadequate dietary intake and poor diet quality. These results also highlight the importance of nutrition screening and education by primary care clinicians in these populations.  It also highlights the DETERMINE Checklist as a valuable tool for identifying vulnerable individuals according to specific answers provided.  The information gathered through the DETERMINE Checklist may assist clinicians in mapping the initial landscape of contextual factors that influence the dietary patterns of the at-risk populations. Therefore, efforts should be made towards further understanding these contextual factors and providing nutrition education and ONS that could be beneficial to supplement dietary inadequacies in this population.
Our study had several limitations, which are commonly reported for survey study designs. First, the cross-sectional design of our study precludes causal inference for any of the reported associations. Second, participants without either a landline or a cell phone with a Chicago area code were excluded from the survey. To the extent to which these excluded persons differed from our included participants, our study may be vulnerable to coverage bias. Third, we had a large percentage of non-responders, leading to possible non-response error. Participants who did not respond may differ meaningfully from those who did, inadvertently omitting an important portion of our target population from our analysis. Regardless of these limitations, this study included a large sample size of a multi-ethnic group of participants and the use of a professional survey research laboratory and interviewing service to assemble and administer the survey. Another strength of this study is the use of the DETERMINE Checklist as a set of domains for predicting inadequate intake and poor diet quality rather than as a weighted score. This methodology makes use of the simple strengths of the tool while bypassing the validity issues encountered in other studies (7, 18, 27). The findings generated from this analysis could inform the designing and tailoring of future nutrition-focused interventions that could improve the nutritional outcomes of the older adult population at nutritional risk living in different community settings.


Conclusions

Inadequate dietary intake and/or poor diet quality are highly prevalent in community-dwelling older adults with social isolation, lower levels of educational attainment, food insecurity, ADL concerns, polypharmacy, and high alcohol intake. These adults may benefit from but are mostly not consuming ONS.  Ensuring both the quality and quantity of their oral intake represents a tangible method to potentially treat or even prevent nutritional decline amongst older community-dwelling adults.  It would be helpful to understand more about potential contextual factors in the lives of older adults, such as limited social support, poor access to healthful food options, limited food purchasing and preparation skills, depression, and others that place them at nutrition risk. Future research is needed to further identify specific barriers to proper nutritional support in this population and the potential for successful nutrition-related interventions to supplement their dietary inadequacies.


Funding Disclosure: This study was funded by a grant from Abbott Nutrition (#HA28). I. Farrar, M. Fitzgibbon, and P. Sheean received salary support from Abbott Nutrition. S. Sulo and J. Partridge are employees of Abbott Nutrition.

Conflicts of Interest: Jamie Patridge and Suela Sulo receive a salary and stock from Abbott.

Ethical standards: This study was conducted according to the guidelines laid down in the Declaration of Helsinki and all procedures involving human subjects were approved by the University of Illinois at Chicago and Loyola University Chicago Institutional Review Boards. Verbal informed consent was obtained from all subjects. Verbal consent was witnessed and formally recorded.


References

1.    Posner BM, Jette AM, Smith KW, Miller DR. Nutrition and health risks in the elderly: the nutrition screening initiative. Am J Public Health 1993;83(7):972-8.
2.    Gunduz E, Eskin F, Gunduz M, Bentli R, Zengin Y, Dursun R, Icer M, Durgun HM, Gurbuz H, Ekinci M, et al. Malnutrition in Community-Dwelling Elderly in Turkey: A Multicenter, Cross-Sectional Study. Med Sci Monit 2015;21:2750-6. doi: 10.12659/MSM.893894.
3.    Feldblum I, German L, Castel H, Harman-Boehm I, Bilenko N, Eisinger M, Fraser D, Shahar DR. Characteristics of undernourished older medical patients and the identification of predictors for undernutrition status. Nutr J 2007;6:37. doi: 10.1186/1475-2891-6-37.
4.    Favaro-Moreira NC, Krausch-Hofmann S, Matthys C, Vereecken C, Vanhauwaert E, Declercq A, Bekkering GE, Duyck J. Risk Factors for Malnutrition in Older Adults: A Systematic Review of the Literature Based on Longitudinal Data. Advances in nutrition 2016;7(3):507-22. doi: 10.3945/an.115.011254.
5.    Boulos C, Salameh P, Barberger-Gateau P. Social isolation and risk for malnutrition among older people. Geriatr Gerontol Int 2017;17(2):286-94. doi: 10.1111/ggi.12711.
6.    Locher JL, Ritchie CS, Roth DL, Baker PS, Bodner EV, Allman RM. Social isolation, support, and capital and nutritional risk in an older sample: ethnic and gender differences. Soc Sci Med 2005;60(4):747-61. doi: 10.1016/j.socscimed.2004.06.023.
7.    Sahyoun NR, Jacques PF, Dallal GE, Russell RM. Nutrition Screening Initiative Checklist may be a better awareness/educational tool than a screening one. J Am Diet Assoc 1997;97(7):760-4. doi: 10.1016/S0002-8223(97)00188-0.
8.    Kantoch A, Wielek J, Gryglewska B, Grodzicki T. Nutritional and Functional Status in Newly Hospitalized Older Patients Who are Not Underweight. J Nutr Gerontol Geriatr 2017;36(2-3):111-20. doi: 10.1080/21551197.2017.1377138.
9.    Gariballa S, Forster S. Malnutrition is an independent predictor of 1-year mortality following acute illness. Br J Nutr 2007;98(2):332-6. doi: 10.1017/S0007114507701708.
10.    Kassin MT, Owen RM, Perez SD, Leeds I, Cox JC, Schnier K, Sadiraj V, Sweeney JF. Risk factors for 30-day hospital readmission among general surgery patients. Journal of the American College of Surgeons 2012;215(3):322-30. doi: 10.1016/j.jamcollsurg.2012.05.024.
11.    Mudge AM, Kasper K, Clair A, Redfern H, Bell JJ, Barras MA, Dip G, Pachana NA. Recurrent readmissions in medical patients: a prospective study. J Hosp Med 2011;6(2):61-7. doi: 10.1002/jhm.811.
12.    Goisser S, Schrader E, Singler K, Bertsch T, Gefeller O, Biber R, Bail HJ, Sieber CC, Volkert D. Malnutrition According to Mini Nutritional Assessment Is Associated With Severe Functional Impairment in Geriatric Patients Before and up to 6 Months After Hip Fracture. J Am Med Dir Assoc 2015;16(8):661-7. doi: 10.1016/j.jamda.2015.03.002.
13.    Koren-Hakim T, Weiss A, Hershkovitz A, Otzrateni I, Grosman B, Frishman S, Salai M, Beloosesky Y. The relationship between nutritional status of hip fracture operated elderly patients and their functioning, comorbidity and outcome. Clin Nutr 2012;31(6):917-21. doi: 10.1016/j.clnu.2012.03.010.
14.    Zuliani G, Romagnoni F, Volpato S, Soattin L, Leoci V, Bollini MC, Buttarello M, Lotto D, Fellin R. Nutritional parameters, body composition, and progression of disability in older disabled residents living in nursing homes. J Gerontol A Biol Sci Med Sci 2001;56(4):M212-6.
15.    Elia M, Normand C, Laviano A, Norman K. A systematic review of the cost and cost effectiveness of using standard oral nutritional supplements in community and care home settings. Clin Nutr 2016;35(1):125-37. doi: 10.1016/j.clnu.2015.07.012.
16.    Hamirudin AH, Charlton K, Walton K. Outcomes related to nutrition screening in community living older adults: A systematic literature review. Arch Gerontol Geriatr 2016;62:9-25. doi: 10.1016/j.archger.2015.09.007.
17.    Lyons BP. Nutrition education intervention with community-dwelling older adults: research challenges and opportunities. J Community Health 2014;39(4):810-8. doi: 10.1007/s10900-013-9810-x.
18.    Sinnett S, Bengle R, Brown A, Glass AP, Johnson MA, Lee JS. The validity of Nutrition Screening Initiative DETERMINE Checklist responses in older Georgians. J Nutr Elder 2010;29(4):393-409. doi: 10.1080/01639366.2010.521031.
19.    Sharkey JR, Branch LG, Zohoori N, Giuliani C, Busby-Whitehead J, Haines PS. Inadequate nutrient intakes among homebound elderly and their correlation with individual characteristics and health-related factors. The American journal of clinical nutrition 2002;76(6):1435-45.
20.    Walker D, Beauchene RE. The relationship of loneliness, social isolation, and physical health to dietary adequacy of independently living elderly. J Am Diet Assoc 1991;91(3):300-4.
21.    Weimer JP, United States. Department of Agriculture. Economic Research Service. Factors affecting nutrient intake of the elderly. Washington, D.C. (1800 M. Street NW Washington 20036-5831): United States Department of Agriculture, Economic Research Service, 1998.
22.    Philipson TJ, Snider JT, Lakdawalla DN, Stryckman B, Goldman DP. Impact of oral nutritional supplementation on hospital outcomes. Am J Manag Care 2013;19(2):121-8.
23.    ter Borg S, Verlaan S, Mijnarends DM, Schols JM, de Groot LC, Luiking YC. Macronutrient Intake and Inadequacies of Community-Dwelling Older Adults, a Systematic Review. Ann Nutr Metab 2015;66(4):242-55. doi: 10.1159/000435862.
24.    Edtion ed. Nutrition Support for Adults: Oral Nutrition Support, Enteral Tube Feeding and Parenteral Nutrition. London, 2006.
25.    Stratton RJ, Hebuterne X, Elia M. A systematic review and meta-analysis of the impact of oral nutritional supplements on hospital readmissions. Ageing Res Rev 2013;12(4):884-97. doi: 10.1016/j.arr.2013.07.002.
26.    Hubbard GP, Elia M, Holdoway A, Stratton RJ. A systematic review of compliance to oral nutritional supplements. Clin Nutr 2012;31(3):293-312. doi: 10.1016/j.clnu.2011.11.020.
27.    Vieira LS, Assuncao MCF, Schafer AA, Santos I. Validity assessment of the nutrition screening initiative checklist in older adults. Clin Nutr ESPEN 2016;15:16-20. doi: 10.1016/j.clnesp.2016.05.002.

DETERMINANTS OF FISH CONSUMPTION IN OLDER PEOPLE: A COMMUNITY-BASED COHORT STUDY


A.T. Bakre1, Y. Song2, A. Clifford1, A. Chen3, T. Smith1, Y. Wan1, L. Devlin1, J. Jie Tang4, W. Zhou1, I.M. Danat1, Z.Hu5, R. Chen1


1. Faculty of Education, Health and Wellbeing, University of Wolverhampton, UK; 2. Richard M. Fairbanks School of Public Health, Indiana University Indianapolis, Indiana, US; 3. Faculty of Sciences and Technology, Middlesex University, UK; 4. School of Public Health, Guangzhou Medical University, China; 5. School of Health Administrations, Anhui Medical University, China

Corresponding Author: Professor Ruoling Chen, Centre for Health and Social Care Improvement (CHSCI), University of Wolverhampton, Wolverhampton, WV1 1DT, UK. T: +44 (0)1902 328622, F: +44 (0)1902 321161, E: r.chen@wlv.ac.uk

J Aging Res Clin Practice 2018;7:163-175
Published online November 19, 2018, http://dx.doi.org/10.14283/jarcp.2018.27


Abstract

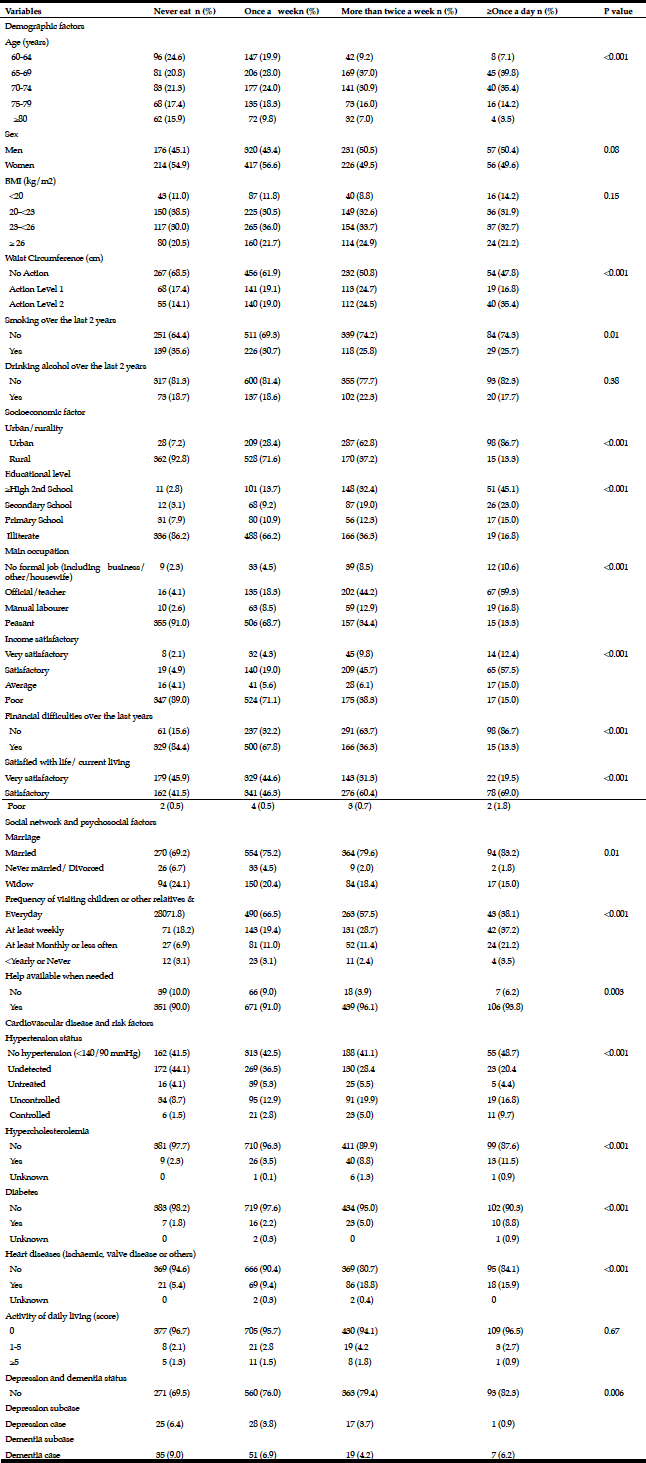
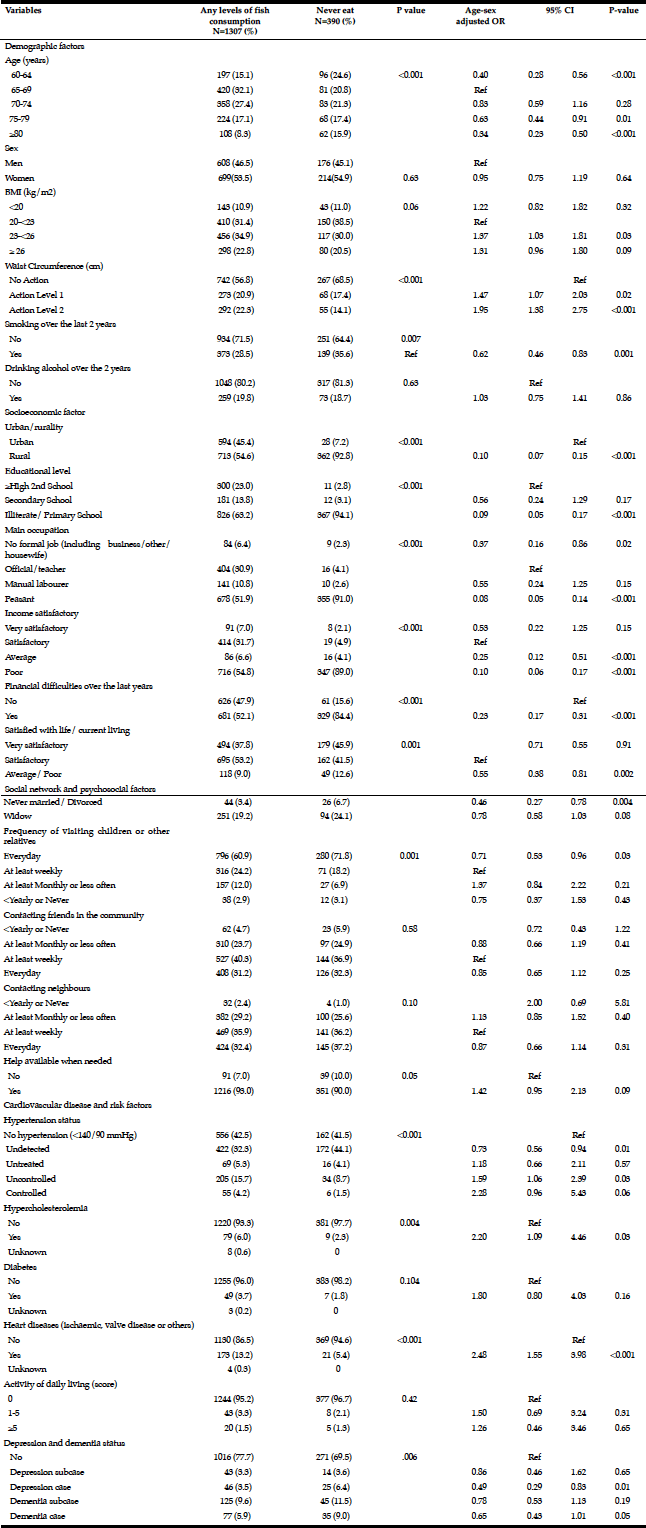
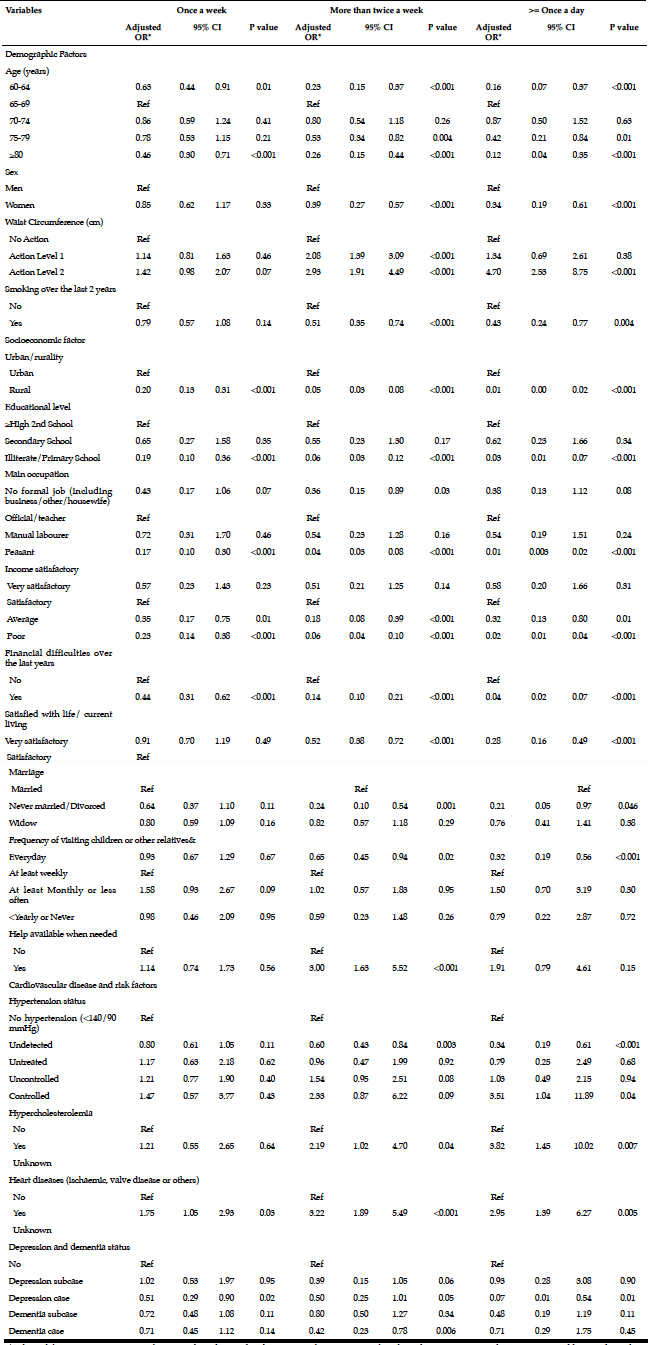
AObjectives: Habitual fish consumption and its determinants in older people have not been well investigated. We addressed these issues through a population-based cohort study. Methods: In 2001-2003 we interviewed a random sample of 3336 residents aged ≥60 years in China, documenting socioeconomic status (SES) and disease risk factors. In 2007-2009 we re-interviewed 1757 survivors, additionally surveying average self-reported intake of fish over the past two years. Results: Of 1757 participants, 1697 responded to the fish consumption questionnaire; 23.0% of whom had “never eat” fish, 43.4% “once a week”, 26.9% “more than twice a week”, and 6.7% “≥once a day”. There was an inverse association of fish consumption with older age (multivariate adjusted odds ratio 0.64 [95% CI 0.45-0.92]  and 0.35 [0.24-0.52] at ages of 75-79, and ≥80 years), female gender (0.63, 0.47-0.84), smoking (0.65, 0.48-0.88), living in a rural area (0.10, 0.07-0.15), having educational level of ≤primary school (0.10,  0.05-0.19), occupation of peasant  (0.08, 0.05-0.14), low income (0.11, 0.07-0.18), financial difficulties (0.25, 0.18-0.34), being never married/divorced (0.48, 0.28-0.81), having undetected hypertension (0.71, 0.55-0.91), depression  (0.50, 0.29-0.84) and dementia (0.64, 0.41-0.98). However, participants with central obesity and heart disease at baseline had increased odds of fish consumption. Separate data analysis for different levels of fish consumption showed a dose-response trend for these associations. Conclusion: In older Chinese, there are large socioeconomic inequalities, and certain lifestyle, psychosocial factors and health-related conditions are strong determinants of fish consumption. Such information is important for future development or refinement of effective dietary interventions targeting older adults.

Key words: Fish consumption, risk factors, older adults.


Introduction

Globally, fish consumption has contributed immensely to the health of the people by reducing their morbidities and mortality (1). Its consumption has been associated with a decreased risk of cardiovascular diseases (CVD) (2).  Fish contains essential nutrients, including vitamins, minerals and amino acids (1, 3, 4), which makes it generally accepted as a vital component of a healthy and balanced diet (5). It is a significant source of animal protein that contains essential nutrients among which are long chain omega-3 polyunsaturated fatty acids (6), that assist in promoting the cognitive wellbeing of people (7, 8). Our recent study (9) showed that older people with increased consumption of fish had a reduced risk of dementia. Fish consumption in older age benefits late-life quality (10) and reduces the risks of neurodegenerative disorders (11) and all-cause mortality (12, 13).  However, many older people reduce their fish consumption or do not eat fish at all. Existing literature (14, 15) shows that older people eat less fish than young and middle-age populations though the reasons for this are unclear. Few studies have examined factors influencing the consumption of fish in older people, despite the world’s population aging. Therefore, this study was conducted to examine the data from a population-based cohort to identify the determinants of fish consumption in older people which may help to increase fish consumption in the aging population.


Methods

Study Participants

The study population was derived from the Anhui cohort study. The methods of the Anhui cohort study have been fully described elsewhere (16). In brief, we randomly recruited 1810 people over 65 years old who had lived more than five years in Yiming subdistrict of Hefei city in 2001 (17, 18) and 1709 over 60 years old from all 16 villages in Tangdian district of Yingshang county in 2003  (19). In total 3336 adults agreed to participate in the present study (response rate of 94.8%), of whom 1736 were living in urban and 1600 in rural area. They were interviewed by a trained survey team from the Anhui Medical University. Permission for interview and written informed consent were obtained from each participant. In about 5% of participants who could not provide informed consent, their nearest relative or carer were approached to provide assent to participation. The interview was conducted using the general health and risk factor record and the Geriatric Mental State (GMS) questionnaire (Wave 1) (17,19). Participants’ socio-demographic characteristics that comprise of their educational attainment, occupational class, level of income, financial status over the last two years, lifestyle, social networks and support, histories of chronic diseases and risk factors were recorded. Participants’ anthropometric data and blood pressure were also measured. Participants’ dementia and depression status were diagnosed using the Geriatric Mental State-Automated Geriatric Examination for Computer Assisted Taxonomy (GMS-AGECAT) data (17).  At one year after baseline, the interview team re-examined 2806 surviving participants (Wave 2), using the same protocol as before (20). In 2007-2009 (6 years after baseline), 1757 survivors were successfully re-interviewed (Wave 3) (16) and information about their dietary intakes of rice, wheat flour, meat, fish, egg, fresh vegetable, fruit, chilli pepper, garlic, ginger and different types of vegetable oils were collected. Participants’ frequency of fish intake in the past two years was recorded as (1) Never eat, (2) ≤Once a week, (3) >Once a week and < Daily, (4) Once a day, and (5) ≥ Twice a day.

Data Analysis

We examined distributions of baseline risk factors and health conditions among participants with different levels of fish consumption documented at Wave 3 survey by chi-squared test for categorical variables and one-way analysis of variance for continuous outcome variables. We employed binomial logistic regression models to examine the determinants of older people having any level of fish consumption over the past two years versus those whose stated they “never eat” fish. We calculated the odds ratio (OR) and 95% confidence intervals of each baseline risk factor associated with the consumption of fish in a 6-year follow up. In the models, we adjusted for age and sex first, to compute the OR. We further examined those variables that were significant in the age-sex adjusted analysis, with multivariate adjustment including waist circumference and smoking at the baseline. Finally, we analysed the data of different levels of fish consumptions respectively versus those who reported they “never eat” fish in the multivariate adjusted logistic regression models to investigate any trend in the associations of baseline risk factors with consumption of fish. All data analysis was performed using SPSS version 20 (SPSS Inc., Chicago, IL).


Results

Of 1757 surviving participants, 1697 (96.6%) responded to the fish consumption questionnaire. The average age (s.d.) of participants was 71.8 (6.9) years, and 53.8% were women. With respect to the past two years there were 390 (23.0%) participants who reported they “never eat” fish, 737 (43.4%) who consumed fish “once a week”, 457 (26.9%) “more than twice a week”, and 113 (6.7%) “≥once a day”. Table 1 shows characteristics of participants across different fish consumption categories. Participants with increased consumption of fish were significantly more likely to be younger (except for participants aged 60-64 years, who were from rural areas only), not smoking and urban living, and to have larger waist circumference, high levels of education, occupational class and income, no financial difficulty, and high satisfaction of life at baseline. High level of fish consumption was significantly associated with being currently married, less frequently visiting children/relatives/neighbours, having help available when needed, and having normal blood pressure/controlled hypertension, hypercholesterolemia, diabetes and heart disease, but not depression and dementia. There were no significant differences in drinking alcohol, contacting friends in the community and activity of daily living (ADL) score (0 – ≥5) across four groups of fish consumption.

Table 1 Characteristics of participants with different fish consumption levels

Table 1
Characteristics of participants with different fish consumption levels

& Data for “Contacting friends in the community” and “Contacting neighbours” showed similar frequencies distributions to those in “Frequency of visiting children or other relatives”; †P-value in the chi square were calculated using the available data i.e. unknowns were excluded; the number (%) of missing data for hypercholesterolemia were 8 (2.3%), diabetes 3 (1.2%), and heart disease 4 (0.7%).


Table 2 shows numbers and age-sex adjusted ORs and 95% CIs of having any level of fish consumption vs. “never eat”. The patterns of distributions of these baseline risk factors between combining any levels of fish consumption and “never eat” were similar to those in Table 1. After adjustment for age and sex, significantly reduced odds of eating fish were found in older people with increased age (except for 60-64 years), smoking, rural living, low levels of education, occupation and income, financial difficulties and low satisfaction of life at baseline. The reduced odds were also found in those who had never married or divorced, visited children or other relatives daily, and had undetected hypertension, depression or dementia. But older people classified as overweight (BMI) and/or having central obesity (WC), heart disease and hypercholesterolemia at baseline had an increased consumption of fish.

Table 2 Age-sex adjusted OR of participants who had consumed fish at any level over the past two years

Table 2
Age-sex adjusted OR of participants who had consumed fish at any level over the past two years


In the multivariate adjusted analysis (Table 3), the significantly reduced odds of having any levels of fish consumption were observed in older people with increased age, female gender, low socio-economic status, financial difficulties and low satisfaction of life, had never married or divorced, and had undetected hypertension, depression and dementia. Having central obesity and heart disease at baseline was significantly associated with increased fish consumption in the follow up.

Table 3 Multivariate adjusted OR* of participants who had consumed fish at any level over the past two years

Table 3
Multivariate adjusted OR* of participants who had consumed fish at any level over the past two years

* adjusted for age, sex, waist circumference and smoking at the baseline; & Data for “Contacting friends in the community” and “Contacting neighbours” showed no significant ORs.


Table 4 shows odds of fish consumption at “once a week”, “more than twice a week” and “≥once a day” in relation to baseline risk factors, respectively. We found that there were similar patterns of ORs for these risk factors to those in their combinations (i.e. in any levels of fish consumption in Table 3). The findings in Table 4 revealed some trends in ORs across different levels of fish consumption. In the age group of ≥ 80 years, a significantly reduced OR of fish consumption at “once a week”, “more than twice a week” and “≥once a day” was 0.46, 0.26 and 0.12, respectively. The matched figures in women were 0.85, 0.39 and 0.34, in rural areas 0.20, 0.05 and 0.01, in financial difficulties 0.44, 0.14 and 0.04; all significant. Other factors (e.g. low education, occupation and income, smoking) showed similar trends in ORs with reduced level of fish consumption, except for heart disease and dementia (Table 4).

Table 4 Multivariate adjusted OR* of participants who had different levels of fish consumption over the past two years

Table 4
Multivariate adjusted OR* of participants who had different levels of fish consumption over the past two years

* adjusted for age, sex, waist circumference and smoking at baseline; & Data for “Contacting friends in the community” and “Contacting neighbours” showed no significant ORs.


Discussion

Our population-based cohort study in China demonstrated that within an older population increased age, female gender, smoking, living in rural areas, low levels of education, occupation and income, financial difficulties, low life satisfaction, being never married/divorced, and having undetected hypertension, depression and dementia were associated with reduced consumption of fish in late life. Older people who had central obesity or heart disease may have increased consumption of fish.

Prevalence of fish consumption in older people

Previous studies showed that compared to young people, older adults had a lower consumption of fish. In Turkey, Erdogan et al (21) found that the proportion of people eating fish twice a week at ages 41-50 years, 51-60 years and ≥60 years was 26.5%, 25.6% and 23.2% respectively. In a USA study of 932 current seafood consumers aged 65 years and above, 18.0% of older people consumed seafood two or more times/week (22). Our finding of 26.9% of older people consuming fish more than twice a week is therefore slightly higher than those in Turkey and USA, but less than reported in a cross-sectional study in France of 9280 participants aged ≥ 65 years, where 44.1% had an intake of fish 2-3 times a week (23). Our results show that 43.4 % of the participants consumed fish once a week, while Barberger-Gateau et al (23) reported a 38.4% fish intake of once a week among their French participants. The Anhui cohort study showed that 6.7% of older people consumed fish ≥Once a day, while 6.3% daily or almost daily fish consumption was reported in Tanskanen et al (24) cross-sectional study of 3204 Finnish adults aged 25-64 years old. There is therefore variation in the amount of fish consumption in older people in different countries, probably due to income, culture and geographic place.

Factors influencing the consumption of fish in older people

Age and Sex

Our data of the Anhui cohort study shows that the odds of fish consumption decrease as age increases even within an older population. This is in accordance with an Australian cross-sectional study of 854 participants aged ≥51 years old, which found an OR of 1.82 (1.20-2.75) for having ≥½ serving of seafood per week among those aged 51-75 years when compared to those aged ≥76 years (15). Larrieu et al (25) also reported infrequent fish consumption among older participants in a large population-based cross-sectional study of 9250 French older adults aged ≥65years.  In a cross-sectional study of 127 randomly selected participants, Can et al (14) found that the annual fish consumption level of young people is almost double that of the older people. In contrast, in a Norway cross-sectional study of 9407 participants aged 45–69 years, Trondsen et al (26) observed that increase in age was associated with increased odds of fish consumption. Also, in a Belgium cross-sectional study examining 429 participants mean aged 40.6 years (age range ≤25->55), Verbeke and Vackier’s (27) found an increase in fish consumption level as age increases. The main literature indicates an inequality in fish consumption in older adults, although there are some inconsistent findings.
The lower odds of fish consumption found among females in this study was consistent with the findings of some previous studies. A Nigerian cross-sectional study of 210 participants aged 21-70 years also revealed a significant reduction in fish consumption level among the female participants (28). In Norway, examining a cross-sectional study of 3144 participants aged 16-79 years, Johansson et al (29) found an increased daily intake of fish among their male participants.  In Taiwan, Li et al (30) carried out a cross-sectional study of 1200 participants aged 14-71 years, and found a significantly reduced odds of fish consumption (OR 0.71) among female participants. However, in a Turkish study, Can et al (14) found that the females’ yearly fish intake level was 1.19 kg more than the male participants’ intake level. The differences among our Chinese study, and the three reported above (28,29, 30) in comparison with the Turkish study (14) could be due to some cultural differences or because women are more likely to be financially incapacitated, thereby making fish products very expensive to purchase, which in turn may impact on their frequency of fish consumption.

Socioeconomic Status

Educational level   In a US cross-sectional study of 1062 participants aged 18 to over 65 years, Hick et al (22) found an increase in the frequency of seafood intake of two or more times a week among participants with higher educational level. Grieger et al’s (15) Australian cross-sectional study of 854 participants found an increase in fresh finfish and canned fish consumption level among older participants aged ≥51 years old with higher educational level. A French cross-sectional study showed an increase in frequency of fish consumption as educational level increases among participants aged ≥65years (23). The studies conducted by Can et al (14) and Anyanwu (28) in Turkey and Nigeria showed that people with low educational level had low level of fish consumption, which were consistent with the findings of our Anhui cohort study in China. But some other studies (27)  did not show a significant association of educational level with fish consumption. Trondsen et al (26) did not observe any significant effect of educational level on fish consumption. In Turkey, Erdogan et al (21)  examined  972 participants aged 20 to over 60 years and found that 89.6% of uneducated or primary school level participants consume seafood, more than the high school and university degree level participants with 80.8% and 85.4% seafood consumption respectively. The variation in the findings of each of the studies could be due to cultural differences in motivations for fish consumption. Where populations are relatively wealthy, e.g. such as in the United States of America, fish consumption is a choice. In poorer countries, it might be about what is available, so it has less to do with education. Coastal areas may also have more access to fresh fish regardless of wealth.
Income Jensen (31) emphasized that the level of income is a significant determinant of the purchasing power of consumers’ food and services, which affect how food is purchased. Can et al (14) established in their study that income is a significant determinant of fish consumption. Barberger-Gateau et al (23) showed a significantly increase odds of fish consumption with increase in income level among regular fish consumers. These findings are consistent with the results of our study. Trondsen et al (26) and Anyanwu (28) stated that a significant increase in household size shows a positive increase in the consumption of fish, which may be associated with income. However, Adeniyi et al’s (32) Nigerian cross-sectional study found that the higher the participants’ level of income the less they spent on fish products, thereby reducing their level of fish intake. This could be due to a preference for other expensive sources of animal protein in some populations.
Occupational class In Taiwan, Li et al (30) demonstrated that odds of fish consumption were reduced among the participants who had blue collar occupations. Johansson et al (29) also established in their Norwegian cross-sectional study of 3144 participants aged 16-79 years that blue-collar workers had a reduced intake of very-long-chain omega-3 fatty acids, which is the main component of fish protein. Galobardes et al (33) in their community based study of 5696 Swiss adults aged 35 to 74 years, found a reduced consumption of fish among participants with manual or lower occupational class. Our study also showed reduced odds among the peasant, manual laborers and those with no formal occupation. The group of low occupational class may have low levels of education and income. Both low levels of education and income appear to reduce the consumption of fish in the population throughout the life course including in older people.

Social network and support

Marriage

Our Anhui cohort study showed reduced odds of fish consumption among the ‘Never married/Divorced’ participants. In a Taiwan cross-sectional study of participants aged 14-71 years, Li et al (30) found lower odds of fish consumption among the unmarried participants. Barberger-Gateau et al (23) also showed reduced odds of fish consumption among the divorced, widow or single participants. Tanskanen et al (24) observed a reduced intake of fish among the unmarried participants in their cross-sectional study of 3204 Finnish adults aged 25-64 years old.  Thong et al.’s (34) cross-sectional study of 966 French adults mean aged 42 years (age range 18-65) revealed that their single participants consumed seafood less frequently when compared to those living with family or partner.  However, Can et al’s (14) cross-sectional study revealed a significantly greater yearly fish intake (1.52 kg) in single compared to married participants. The differences among our Chinese study, and the four reported above (23, 24, 30, 34) in comparison with the Turkish study (14) could be because those who were never married/divorced had a lower household income, and they may have fewer children at home which influences the demand for fish consumption.

Cardiovascular disease and risk factors

Smoking: Our cohort study showed that older people who smoked would have a lower level of fish consumption. A Finnish cross-sectional study of 3204 adults aged 25-64 years old showed that participants who rarely consumed fish are more likely to smoke (24). In a Norwegian cross-sectional study of 3144 participants, a non-significant association was found between smoking habit and intake of very-long-chain omega-3 fatty acids (29).  However, Trondsen et al (26) found a significantly increased consumption of fish with smoking in a cross-sectional study in Norway. These conflicting findings may be influenced by associations between smoking and low socioeconomic status, as well as intentions to maintain healthy lifestyles.
Obesity: Previous cross-sectional studies reported that fish consumers of more than once a week are significantly less likely to be obese (BMI ≥30kg/m2) (23), while another found that participants that  rarely consume fish are less likely to be obese (24). However, our cohort study showed that older people who were overweight/obese (BMI ≥26kg/m2) at baseline may have increased consumption of fish. This may be due to high income in those with obesity in China.
Undetected hypertension: Barberger-Gateau et al (23) France cross-sectional study observed that older people who suffered from hypertension consume fish more frequently, but our study showed that those with undetected hypertension at baseline would have a reduced consumption of fish, probably because these people were unaware of their state of health.
r study shows an increase in fish consumption level among participants with heart disease. It was consistent with the finding from Devadawson et al’s (35) study of 1777 participants aged 25-75 years. Devadawson et al (35) acknowledged that 37% of the participants in the study consumed fish based on curing their heart disease. Previous studies showed that based on health recommendations women with heart disease would have increased consumption of fish (27). Erdogan et al (21) also stated that 84.47% of the 972 participants consumed seafood based on its importance to health. This is in line with Can et al’s (14) result, where 62.5% of their participants consumed fish based on health reasons. Trondsen et al (26) confirmed that seafood consumption was influenced by its beneficial impact on health.

Mental Health

Our result shows that older people with depression had a significant decrease in fish consumption level. This is consistent with Barberger-Gateau et al’s (23) France cross-sectional study that reported a significant decrease in fish consumption level among their older participants with depressive symptoms. Tanskanen et al (24) observed in a large population-based study of Finnish adults that the tendency of developing depressive symptoms is significantly higher among infrequent fish consumers. A five years cohort study of 10,602 men from Northern Ireland and France aged 50-59 years found that higher depressive mood was associated with lower fish intake (36). Astorg et al’s (37) cohort study of 13,017 French participants aged 35-60 years observed a significantly reduced risk of any depressive episode among higher consumers of fatty fish or intake of long-chain omega-3 polyunsaturated fatty acid (PUFA).
Previous studies showed a significant reduction in fish consumption among the older participants with lower cognitive performance (23). Few studies investigated whether people with dementia had a reduced consumption of fish. As far as we know, our cohort study is the first reporting that older people with dementia had a significantly reduced consumption of fish. The reductions in fish intake among older people with depression or dementia could be due to reduced ability of the participants to choose to cook fish or to purchase fish at a restaurant.

Strengths and Limitations of the study

The main strength of our study lies in its cohort design of identifying possible influencing factors for fish consumption in older population.   Our study cohort consists of two random samples of urban and rural Chinese who experienced epidemiological transition with specific characteristics, and we collected data on as many risk factors as possible, including mental health status. These have helped us to identify the determinants of low consumption of fish in older people for prevention. Our study has limitations. Firstly, there may be a recall bias from participants regarding fish consumption level that occurred during the interview. This would attenuate the associations that we found. Secondly, more detailed information about which type of fish intake (e.g. preserved) was not recorded and thus we could not examine its consumption levels. Thirdly, the inability to adjust for total energy intake in our study due to its absence among the variables assessed might have impacted on the overall result. But the adjustment for body weight (waist circumference) in the model and the strong association (e.g. OR 0.10) ensured that our results are robust.

Implication of the Study

Our study offers an insight into how the nutritional status regarding the consumption of inadequate fish protein among older people can be affected by sociodemographic and health factors. There is evidence that no or inadequate consumption of fish could impact on their cognitive function and increase the risk of cardiovascular disease (2, 38) and dementia (9). This result can help the government in their public health policies decision making. This could assist in channeling their resources towards availability and affordability of fish among socio-economically-deprived older populations. Boosting the economy income level through job creation might also enhance their overall food intake level including fish consumption, since food cannot be eaten in isolation, thus having a positive impact on their health and well-being. Facilitating the preparation technique of fish could also ease the stress displayed during cooking through provision of ready-made boneless fish products that is accessible to purchase in the market. Especially for the high-risk groups with inadequate consumption of fish including older people with depression and dementia, possibly improving their prognosis.
In conclusion, the findings from our community-based cohort study suggested that reduced consumption of fish in older people was significantly associated with a number of factors. Targeting these high-risk groups of older people with low educational level, low income level and living in a rural area for preventing low consumption of fish would increase their level of consumption.

 
Acknowledgements: The authors thank the participants and all who were involved in the Anhui cohort study in China. Financial support: Ruoling Chen thanks the Royal Society, the BUPA Foundation and Alzheimer’s Research UK to provide research grants for the Research Programme of Depression and Dementia in China, collecting the Anhui cohort study data.

Conflict of interest: The authors have no conflict of interests to declare.

Ethical standard: The study adhered to the current ethical standard that involve human participants.


References

1.    Food and Agricultural organisation of the United Nations (FAO) 2016. The State of World Fisheries and Aquaculture: Contributing to Food Security and Nutrition for All: In Brief. Internet: http://www.fao.org/3/a-i5798e.pdf (accessed 10 September 2016) (accessed 10 September 2016).
2.     Larsson SC, Orsini N. Fish consumption and the risk of stroke: a dose-response meta-analysis. Stroke 2011;42:3621-3.
3.     Kawarazuka N. The contribution of fish intake, aquaculture, and small-scale fisheries to improving nutrition: A literature review: The World Fish Center Working Paper. Internet: http://www.worldfishcenter.org/resource_centre/WF_2590.pdf (accessed 1st March 2018).
4.     Lund EK. Health benefits of seafood; is it just the fatty acids? Food Chem 2013;140:413-20.
5.     Yaktine AL, Nesheim MC. Seafood choices: balancing benefits and risks. National Academies Press, 2007.
6.     Connor WE. Importance of n-3 fatty acids in health and disease. Am J Clin Nutr 2000;71:171S-5S.
7.     Kalmijn S, van Boxtel MP, Ocke M, Verschuren WM, Kromhout D, Launer LJ. Dietary intake of fatty acids and fish in relation to cognitive performance at middle age. Neurology 2004;62:275-80.
8.     van Gelder BM, Tijhuis M, Kalmijn S, Kromhout D. Fish consumption, n− 3 fatty acids, and subsequent 5-y cognitive decline in elderly men: the Zutphen Elderly Study–. Am J Clin Nutr 2007;85:1142-7.
9.     Bakre AT, Chen R, Khutan R, Wei L, Smith T, Qin G, Danat IM, Zhou W, Schofield P, Clifford A. Association between fish consumption and risk of dementia: a new study from China and a systematic literature review and meta-analysis. Public Health Nutr 2018;1-12.
10.     Schiepers O, De Groot R, Jolles J, Van Boxtel M. Fish consumption, not fatty acid status, is related to quality of life in a healthy population. Prostaglandins, Leukotrienes and Essential Fatty Acids 2010;83:31-5.
11.     Zhang Y, Chen J, Qiu J, Li Y, Wang J, Jiao J. Intakes of fish and polyunsaturated fatty acids and mild-to-severe cognitive impairment risks: a dose-response meta-analysis of 21 cohort studies. Am J Clin Nutr 2016;103:330-40.
12.     Yamagishi K, Iso H, Date C, Fukui M, Wakai K, Kikuchi S, Inaba Y, Tanabe N, Tamakoshi A. Fish, ω-3 Polyunsaturated Fatty Acids, and Mortality From Cardiovascular Diseases in a Nationwide Community-Based Cohort of Japanese Men and Women: The JACC (Japan Collaborative Cohort Study for Evaluation of Cancer Risk) Study. Journal of the American College of Cardiology 2008;52:988-96.
13.     Zhang J, Sasaki S, Amano K, Kesteloot H. Fish consumption and mortality from all causes, ischemic heart disease, and stroke: an ecological study. Prev Med 1999;28:520-9.
14.     Can MF, Günlü A, Can HY. Fish consumption preferences and factors influencing it. Food Science and Technology (Campinas) 2015;35:339-46.
15.     Grieger JA, Miller M, Cobiac L. Knowledge and barriers relating to fish consumption in older Australians. Appetite 2012;59:456-63.
16.     Chen R, Hu Z, Wei L, Wilson K. Socioeconomic status and survival among older adults with dementia and depression. Br J Psychiatry 2014;204:436-40.
17.     Chen R, Hu Z, Qin X, Xu X, Copeland JR. A community-based study of depression in older people in Hefei, China—the GMS-AGECAT prevalence, case validation and socio-economic correlates. Int J Geriatr Psychiatry 2004;19:407-13.
18.     Chen R, Song Y, Hu Z, Brunner EJ. Predictors of diabetes in older people in urban China. PloS one 2012;7:e50957.
19.     Chen R, Wei L, Hu Z, Qin X, Copeland JR, Hemingway H. Depression in older people in rural China. Arch Intern Med 2005;165:2019-25.
20.     Chen R, Hu Z, Wei L, Qin X, McCracken C, Copeland JR. Severity of depression and risk for subsequent dementia: cohort studies in China and the UK. Br J Psychiatry 2008;193:373-7.
21.     Erdogan BE, Mol S, Cosansu S. Factors influencing the consumption of seafood in Istanbul, Turkey. Turkish Journal of Fisheries and Aquatic Sciences 2011;11:631-9.
22.     Hicks D, Pivarnik L, McDermott R. Consumer perceptions about seafood–an internet survey. Journal of Foodservice 2008;19:213-26.
23.     Barberger-Gateau P, Jutand MA, Letenneur L, Larrieu S, Tavernier B, Berr C. Correlates of regular fish consumption in French elderly community dwellers: data from the Three-City study. Eur J Clin Nutr 2005;59:817-25.
24.     Tanskanen A, Hibbeln JR, Tuomilehto J, Uutela A, Haukkala A, Viinamäki H, Lehtonen J, Vartiainen E. Fish consumption and depressive symptoms in the general population in Finland. Psychiatric Services 2001;52:529-31.
25.     Larrieu S, Letenneur L, Berr C, Dartigues J, Ritchie K, Alperovitch A, Tavernier B, Barberger-Gateau P. Sociodemographic Differences in Dieitary Habits in a Population-Based Sample of Elderly Subjects: The 3C Study. J Nutr Health Aging 2004;8:497-502.
26.     Trondsen T, Braaten T, Lund E, Eggen A. Health and seafood consumption patterns among women aged45–69 years. A Norwegian seafood consumption study. Food quality and preference 2004;15:117-28.
27.     Verbeke W, Vackier I. Individual determinants of fish consumption: application of the theory of planned behaviour. Appetite 2005;44:67-82.
28.     Anyanwu S. Quantitative analysis of fish consumption in rivers state, Nigeria. American Journal of Experimental Agriculture 2014;4:469.
29.     Johansson L, Solvoll K, Bjørneboe GA, Drevon C. Intake of very-long-chain n-3 fatty acids related to social status and lifestyle. Eur J Clin Nutr 1998;52:716.
30.     Li H, Houston JE, Wang S, Lee H. Factors affecting consumer preferences for fish in Taiwan. International Institute of Fisheries Economics and Trade (IIFET) 2000 Proceedings 2001;1-7.
31.     Jensen HH. Changes in seafood consumer preference patterns and associated changes in risk exposure. Mar Pollut Bull 2006;53:591-8.
32.     Adeniyi OR, Omitoyin S, Ojo O. Socio-economic determinants of consumption pattern of fish among households in Ibadan North Local Government Area of Oyo State, Nigeria. African journal of food, agriculture, nutrition and development 2012;12:6537-52.
33.     Galobardes B, Morabia A, Bernstein MS. Diet and socioeconomic position: does the use of different indicators matter? Int J Epidemiol 2001;30:334-40.
34.     Thong NT, Solgaard HS. Consumer’s food motives and seafood consumption. Food Quality and Preference 2017;56:181-8.
35.     Devadawson C, Jayasinghe C, Sivakanesan R. Socio-demographic factors and fish eating trends in Eastern community, Sri Lanka. Journal of Experimental Biology and Agricultural Sciences 2015;3:423-9.
36.     Appleton KM, Woodside JV, Yarnell JW, Arveiler D, Haas B, Amouyel P, Montaye M, Ferrieres J, Ruidavets JB, Ducimetiere P, et al. Depressed mood and dietary fish intake: direct relationship or indirect relationship as a result of diet and lifestyle? J Affect Disord 2007;104:217-23.
37.     Astorg P, Couthouis A, Bertrais S, Arnault N, Meneton P, Guesnet P, Alessandri J, Galan P, Hercberg S. Association of fish and long-chain n-3 polyunsaturated fatty acid intakes with the occurrence of depressive episodes in middle-aged French men and women. Prostaglandins, Leukotrienes and Essential Fatty Acids 2008;78:171-82.
38.     He K, Song Y, Daviglus ML, Liu K, Van Horn L, Dyer AR, Goldbourt U, Greenland P. Fish consumption and incidence of stroke: a meta-analysis of cohort studies. Stroke 2004;35:1538-42.

SHORT TERM (24 HOURS) AND LONG TERM (1 YEAR) ASSESSMENTS OF RELIABILITY IN OLDER ADULTS: CAN ONE REPLACE THE OTHER?


T. Abe, S.J. Dankel, S.L. Buckner, M.B. Jessee, K.T. Mattocks, J.G. Mouser, Z.W. Bell, J.P. Loenneke


Department of Health, Exercise Science, & Recreation Management, Kevser Ermin Applied Physiology Laboratory, The University of Mississippi, University, MS 38677, USA.

Corresponding Author: Takashi Abe, PhD  Department of Health, Exercise Science, & Recreation Management, The University of Mississippi, 224 Turner Center, University, MS 38677, USA, Phone: +1 (662) 915-5844, Email:  t12abe@gmail.com

J Aging Res Clin Practice 2018;7:82-84
Published online May 17, 2018, http://dx.doi.org/10.14283/jarcp.2018.15


Abstract

There may be some individuals who do not adapt favorably to an exercise stimulus. This is most commonly determined by assessing the error of the measurement across two separate testing sessions separated by a short period of time. It has been recommended that this error be assessed over the same time frame as the intervention. We examined the 24-h test-retest reliability (n=18, aged 42 to 64 years) of forearm muscle thickness, handgrip strength, and “muscle quality” and compared that to the reliability observed when visits are separated by 1-year (n=80, aged 60 to 79 years). The measurement errors were greater in all measured variables following test-retest separated by 1-year than the test-retest separated by 24-hours. Our findings suggest that a time-matched control group is likely important to fully capture the error of the tester as well as the error associated with random biological variability within a timed intervention.

Key words: Long-term reliability, muscle size, muscle function, older adults, strength, ultrasound.


Introduction

Cross-sectional and longitudinal studies have reported that values of handgrip strength appear to decease gradually with increasing age in both men and women, although the age at which handgrip strength starts to decline differs among those studies (1, 2). Similar declines are observed with muscle mass, and the ratio of muscle strength/size is often used as an index of muscle quality (3).
Resistance exercise is commonly recommended for older individuals in an effort to mitigate these proposed declines in muscle size and strength (4). Moreover, long term (~ 1 year) resistance training is capable of producing favorable changes in muscle size and strength (5). Although this is a well-accepted finding, recent reports suggest that there may be some individuals within these interventions who do not actually respond favorably to the exercise stimulus (6, 7). Knowing if these differential responders exist may lead to better exercise prescriptions and more favorable clinical end points. One way these individuals may be accounted for is by determining the magnitude of the measurement error (i.e. tester error in combination with biological variability). This variability is most commonly assessed using two separate testing sessions separated by 24-48 hours but sometimes can be separated by up to 1-2 weeks (8-10). In addition, this short-term test-retest reliability would ideally be completed on a population similar to that which is going to undergo the long-term training study.
As noted in several recent papers (11, 12), short-term reliability may not be appropriate and, it is suggested, this is best assessed using control groups of similar duration as the actual intervention. Given the added burden this creates for the researcher by including a separate comparative arm that is not actually receiving an intervention, it is important to determine whether or not there are differences between short-term and long-term tests of reliability on biomarkers of muscle mass and function. Thus, the aim of this study was to examine the 24 hours test-retest reliability (Experiment 1) of forearm muscle size, handgrip strength, and an index of muscle quality in older adults and compare that to the reliability observed when visits are separated by 1 year (Experiment 2).


Methods

For Experiment 1, eighteen apparently healthy adults (men = 9, women = 9) between the ages of 42 and 64 [mean of 54 (SD 6)] years were measured twice with 24 hours between measurements. For Experiment 2, eighty healthy older adults (men = 34, women = 46) between the ages of 60 and 79 years [mean of 72 (SD 3)] were measured twice with 1 year between measurements. Participants had no orthopedic abnormalities (e.g. surgery or trauma) in their upper and lower extremities. All participants performed structured regular exercise (mainly walking and/or golf, three to five times per week) for at least 2 years. All participants signed a written informed consent to participate in the study, which was approved by the Ethics Committee of the University. The same investigator completed all ultrasound and strength measurements of the Experiments 1 and 2 (i.e. intra-observer reliability).
Participants were instructed to refrain from any vigorous physical activity for 24 h prior to the testing. Body mass and standing height were measured to the nearest 0.1 kg and 0.1 cm, respectively, by using an electronic weight scale and a stadiometer. During each visit, ultrasound images were taken from the anterior forearm for quantification of forearm muscle thickness. Muscle thickness was measured using B-mode ultrasound (Aloka SSD-500, Tokyo, Japan) on the right side of the anterior forearm at 30% of the distance from the styloid process of the ulna to the head of the radius. The measurements were made while subjects stood with the elbow extended and the forearm supinated. A linear transducer with a 7.5-MHz scanning head was coated with water-soluble transmission gel to provide acoustic coupling and reduce pressure by the scanning head to achieve a clear image. The scanning transducer was placed on the skin surface of the measurement site using the minimum pressure required, and cross sections of each muscle were imaged. Three images were printed (Toshiba Super Sonoprinter TP-8010, Tokyo, Japan). Muscle thickness was measured as the distance between the subcutaneous adipose tissue-muscle interface and muscle-bone interface of the ulna (MT-ulna), as described previously (13), and the average of the three was used for data analysis.
Maximum voluntary handgrip strength was measured using a calibrated Smedley (TKK-5401 Grip-D, Takei Scientific Instruments, Tokyo, Japan) hand dynamometer. All participants were right handed and were instructed to: 1) maintain an upright standing position; 2) keep their arms at their side; and 3) hold the dynamometer in the right hand with the elbow extended downward without squeezing. Participants were allowed to perform one test trial followed by two maximum trials with a 1-minute rest period between attempts. The highest value was used for analysis.
Muscle quality in the forearm was defined as a ratio of handgrip strength to forearm muscle thickness (MT-ulna) (3). The MT-ulna includes two major flexor muscles and there is a strong correlation between MT-ulna and MRI-measured forearm flexor muscle cross-sectional area (14).
Data are presented as mean and standard deviation (SD). The mean and SD of the difference between Visit 1 and Visit 2 (SDdifference) was calculated for body mass, MT-ulna, handgrip strength, and the ratio of muscle strength to size. The minimal difference was formulated as follows: SDdifference x 1.96. Pearson product correlations were performed to determine the associations between Visit 1 and Visit 2. The technical error of measurement (TEM) and the coefficient of reliability (R) were calculated (15). The coefficient of variation was also calculated as the SDdifference divided by the mean of the Visit 1 and Visit 2. Statistical significance was set at P≤0.05.


Results

For Experiment 1, the correlation coefficients between testing visits were 0.999, 0.984, 0.995, and 0.973 for body mass, handgrip strength, MT-ulna, and the ratio of muscle strength to size (p<0.05). The coefficients of variation were 0.4%, 3.9%, 0.8%, and 3.2% for body mass, handgrip strength, MT-ulna, and the ratio of muscle strength to size, respectively.  For Experiment 2, the correlation coefficients between testing visits were 0.948, 0.908, 0.865, and 0.797 for body mass, handgrip strength, MT-ulna, and the ratio of muscle strength to size (p<0.05). The coefficients of variation were 2.0%, 6.8%, 3.3%, and 8.5% for body mass, handgrip strength, MT-ulna, and the ratio of muscle strength to size, respectively.  The minimal differences were greater in all measured variables following test-retest separated by one year than the test-retest separated by 24 hours (Table 1).  The relative TEM values for handgrip strength, MT-ulna and the ratio of strength to size in Experiment 1 were acceptable (4.4%, 1.1%, and 4.0%, respectively) and all the R values were above 0.95 (0.98, 0.99, and 0.96 respectively). For Experiment 2, however, the relative TEM values were higher (9.4%, 4.5%, and 10.9%, respectively) and the R values were lower (0.85, 0.83, and 0.63 respectively) compared with the results of Experiment 1.

Table 1 Short-term (24 h) and long-term (1 yr) test-retest reliability of ultrasound measured forearm muscle thickness (MT-Ulna), handgrip strength, and forearm muscle quality (fMQ) in older adults

Table 1
Short-term (24 h) and long-term (1 yr) test-retest reliability of ultrasound measured forearm muscle thickness (MT-Ulna), handgrip strength, and forearm muscle quality (fMQ) in older adults

MD, minimal difference


Discussion

The present investigation found large differences between short term (Experiment 1) and long term intra-rater test-retest reliability (Experiment 2) evaluated by the correlation coefficient, coefficient of variation, minimal difference, relative TEM, and coefficient of reliability.  Many studies assess long term (i.e. months) changes in variables yet rely on a short test-retest (i.e. a few days) period for informing them on the error needed to surpass (i.e. minimal difference) in order to determine “real” or meaningful changes (8-10) In this study, the minimal difference between testing visits in forearm muscle thickness, handgrip strength and the ratio of strength to size was higher in the one year test-retest compared with the short-term test-retest. Similar results were observed in the TEM and coefficient of reliability. Our findings are of particular importance given the recent attention paid to responders (favorable and adverse) and non-responders to exercise (6, 9, 16).
Some of these studies have relied on short-term test retest reliability to inform them of the variability needed to surpass in order to classify someone into a particular category (6, 9). This is often completed on the same group of people included in the intervention or on a previous sample of individuals who are similar to those included in the present study.  If short-term assessments could indeed assess a similar amount of variability as that observed over the course of a longer time frame, then it would allow for individuals to be placed into an actual exercise intervention group rather than a time matched non-exercise control group. This would help remove a recruiting burden on the investigator by not having to recruit a control group and it would also remove the potential ethical dilemma of withholding perceived “treatment” (e.g. exercise).  However, our findings suggest that a time-matched control group is likely important to fully capture the error of the tester as well as the error associated with random biological variability within a given time frame.  Though it would have been preferable to perform the short-term test-retest on the same individuals as one year sample, we do not feel this potential limitation meaningfully impacts the interpretation.


Funding: This study was supported in part by the Japanese Society of Wellness and Preventive Medicine funded research.

Conflicts of interest: The authors declare that they have no conflict of interests relevant to the content of this study.

Acknowledgements: Our appreciation is extended to the volunteers who participated in this study.


References

1.    Lauretani F, Russo CR, Bandinelli S, Bartali B, Cavazzini C, Di Iorio A, et al. Age-associated changes in skeletal muscles and their effect on mobility: an operational diagnosis of sarcopenia. J Appl Physiol 2003; 95(5): 1851–1860.
2.    Rantanen T, Masaki K, Foley D, Izmirlian G, White L, Guralnik JM. Grip strength changes over 27 yr in Japanese-American men. J Appl Physiol 1998; 85(6): 2047–2053.
3.    Abe T, Thiebaud RS, Loenneke JP. Age-related change in handgrip strength in men and women: is muscle quality a contributing factor? Age (Dordr) 2016; 38(1), 28.
4.    Garber CE, Blissmer B, Deschenes MR, Franklin BA, Lamonte MJ, Lee IM, et al. American College of Sports Medicine position stand. Quantity and quality of exercise for developing and maintaining cardiorespiratory, musculoskeletal, and neuromoter fitness in appatently healthy adults: guidance for prescribing exercise. Med Sci Sports Exerc 2011; 43(7): 1334–1359.
5.    Pyka G, Lindenberger E, Charette S, Marcus R. Muscle strength and fiber adaptations to a year-long resistance training program in elderly men and women. J Gerontol 1994; 49(1): M22–M27.
6.    Bouchard C, Blair SN, Church TS, Earnest CP, Hagberg JM, Hakkinen K, et al. Adverse metabolic response to regular exercise: is it a rare or common occurrence? PLoS One 2012; 7(5): e37887.
7.    Loenneke JP, Fahs CA, Abe T, Rossow LM, Ozaki H, Pujol TJ, et al. Hypertension risk: Exercise is medicine* for most but not all. Clin Physiol Funct Imaging 2014; 34(1): 77–81.
8.    DeFreitas JM, Beck TW, Stock MS, Dillon MA, Kasishke II PR. An examination of the time course of training-induced skeletal muscle hypertrophy. Eur J Appl Physiol 2011; 111(11): 2785–2790.
9.    Barbalho MSM, Gentil P, Izquierdo M, Fisher J, Steele J, Raiol RA. There are no no-responders to low or high resistance training volume among older women. Exp Gerontol 2017; 99: 18–26.
10.    Loenneke JP, Rossow LM, Fahs CA, Thiebaud RS, Mouser GJ, Bemben MG. Time-course of muscle growth, and its relationship with muscle strength in both young and older women. Geriatr Gerontol Int 2017; 17(11): 2000–2007.
11.    Atkinson G, Batterham AM. True and false interindividual differences in the physiological response to an intervention. Exp Physiol 2015; 100(6): 577–588.
12.    Hopkins WG. Individual response made easy. J Appl Physiol 2015; 118(12): 1444–1446.
13.    Abe T, Thiebaud RS, Loenneke JP, Ogawa M, Mitsukawa N. Association between forearm muscle thickness and age-related loss of skeletal muscle mass, handgrip and knee extension strength and walking performance in old men and women: a pilot study. Ultrasound Med Biol 2014; 40(9): 2069–2075.
14.    Abe T, Nakatani M, Loenneke JP. Relationship between ultrasound muscle thickness and MRI-measured muscle cross-sectional area in the forearm: a pilot study. Clin Physiol Func Imaging 2017 Aug 7. doi:10.1111/cpf.12462
15.    Perini TA, de Oliveira GL, Ornallas JS, de Oliveira FP. Technical error of measurement in anthropometry. Rev Bras Med Esporte 2005; 11(1): 86–90.
16.    Churchward-Venne TA, Tieland M, Verdijk LB, Leenders M, Dirks ML, de Groot LC, et al. There are no nonresponders to resistance-type exercise training in older men and women. J Am Med Dir Assoc 2015; 16(5): 400–411.

FIT & STRONG! PLUS: DESCRIPTIVE DEMOGRAPHIC AND RISK CHARACTERISTICS IN A COMPARATIVE EFFECTIVENESS TRIAL FOR OLDER AFRICAN-AMERICAN ADULTS WITH OSTEOARTHRITIS


M. L Fitzgibbon1,2,3, L. Tussing-Humphreys1,3,4, L. Schiffer3, R. Smith-Ray3,5, A.D. Demott3,6, M. Martinez3,6, M.L. Berbaum1,3, G.M. Huber7, S.L. Hughes3,6


1. University of Illinois Cancer Center, Chicago, IL 60612; 2. Department of Pediatrics, University of Illinois at Chicago, Chicago, IL 60612; 3. Institute for Health Research and Policy, School of Public Health, University of Illinois at Chicago, Chicago, IL, 60608; 4. Department of Medicine, University of Illinois at Chicago, Chicago, IL 60612; 5. Health Analytics, Research and Reporting, Walgreen Co., Deerfield, IL, 60015; 6. Center for Research on Health and Aging, University of Illinois at Chicago, Chicago, IL 60608; 7. Physical Therapy and Human Movement Sciences, Northwestern University, Chicago, IL, 60611

Corresponding Author: Marian L. Fitzgibbon, PhD, University of Illinois at Chicago, 486 Westside Research Office Building, 1747 W. Roosevelt Rd., Chicago, IL, 60608, Email: mlf@uic.edu, Phone: 312-996-0146


J Aging Res Clin Practice 2018;7:9-16
Published online February 19, 2018, http://dx.doi.org/10.14283/jarcp.2018.3


Abstract

Objectives: The prevalence of osteoarthritis (OA) has increased in the US. We report on a comparative effectiveness trial that compares Fit & Strong!, an existing evidence-based physical activity (PA) program, to Fit & Strong! Plus, which combines the Fit & Strong! intervention with a weight management intervention. Methods: Participants included 413 overweight/obese (BMI 25-50 kg/m²) adults with lower extremity (LE) OA. The majority of the sample was African-American and female. Both interventions met 3 times weekly for 8 weeks. Primary measures included diet and weight. Results: The baseline mean BMI for all participants was 34.8 kg/m², percentage of calories from fat was high, and self-reported PA was low. Discussion: This sample of overweight/obese African-American adults had lifestyle patterns at baseline that were less than healthful, and there were differences between self-report and performance-based measures as a function of age.

Key words: Weight management, obesity, older adults, physical activity.


Purpose

Arthritis and related rheumatic conditions, including osteoarthritis (OA), affect approximately 50 million or 22% of the adult United States (US) population (1), and the majority of affected individuals are older adults. African Americans with OA have higher rates of inactivity and functional limitations than non-Hispanic whites (2-4), and African-American women with OA have approximately twice the rate of disability compared to non-Hispanic whites (5). Risk factors for OA include genetics, female sex, and obesity (6), and obesity is a strong risk factor for the incidence and progression of knee OA (7, 8). Unfortunately, the prevalence of obesity has increased significantly since the 1980s, with African-American women ≥ 60 years having the highest rates compared to non-Hispanic white women (57.5% vs. 38.2%) (9-13).
Obese individuals who have OA are usually advised to lose weight (14-16). Several studies support the combination of physical activity (PA) and weight management as central to the reduction of knee pain and limitations in mobility (17, 18), and several randomized controlled trials (RCTs) have tested the combined impact of modest weight loss with regular moderate PA compared to either PA or diet/weight management alone (17, 19-22).  These studies highlight  a need to test relatively simple, easily replicable evidence-based programs that combine both PA and weight management for adults with OA and to test these interventions with disadvantaged populations that have consistently higher rates of OA and obesity, such as African-American women (1, 23). To address this need, our team developed and is testing Fit & Strong! Plus.
Fit & Strong! Plus combines interventions from two successful RCTs that have shown improvements in PA (Fit & Strong!) and weight management (the Obesity Reduction Black Intervention Trial, ORBIT) (24-26). The Fit & Strong! intervention and its evidence base are described in detail elsewhere (27-29). ORBIT is a 6-month weight loss and PA intervention targeting African-American women that was successful in reducing weight by 3.0 kg in the intervention group, on average (25). In 2012, we received funding to test the comparative effectiveness of customary Fit & Strong! vs. the new Fit & Strong! Plus version using an RCT. The details of the trial design are published elsewhere (30).


Methods

Design

The Fit & Strong! Plus trial is a randomized comparative effectiveness trial that is testing whether Fit & Strong! Plus produces significantly better results than standard Fit & Strong! on weight, dietary intake, PA, physical performance, OA-associated symptoms of LE pain and stiffness, anxiety / depression, and self-efficacy for weight loss and exercise among overweight / obese adults with OA. The project was approved by the Institutional Review Board at the University of Illinois at Chicago (UIC), and all participants gave written informed consent. The trial is registered at clinicaltrials.gov (NCT03180008).

Setting

Both interventions were conducted at local community sites.

Subjects

Participants were randomly assigned to Fit & Strong! (n = 210) or Fit & Strong! Plus (n = 203) and are being followed for 18 months.

Interventions

Both Fit & Strong! and Fit & Strong! Plus are conducted in 90-minute sessions 3 times per week over an 8-week period. The first 60 minutes of both interventions consist of stretching, low-impact aerobics, and strengthening exercises with a consistent focus on lower extremity muscles. The interventions diverge in the 30-minute health education component at the end of the session. The health education component of Fit & Strong is designed to build self-efficacy (SE) related to managing pain and OA symptoms through PA, while Fit & Strong! Plus also incorporates SE for dietary weight management behaviors.

Measures

Anthropometrics: Height was measured using a portable stadiometer (Seca, United Kingdom), and weight was measured using a calibrated digital scale (Tanita Worldwide). Both height and weight were measured twice. If the two measurements were > 0.5 cm or > 0.2 kg apart, a third measurement was taken, and the mean of the two closest measurements was used. BMI was calculated as weight (kg) divided by height (m) squared. To assess body composition change, we measured waist circumference twice using a Gulick 150-centimeter anthropometric tape (Country Technology, Inc.; Gays Mills, WI, USA). If the two waist measurements were > 1 cm apart, a third measurement was taken, and the mean of the two closest measurements was used.

Dietary intake

We used the Block 2005 Food Frequency Questionnaire (FFQ) to assess dietary intake. The FFQ, which inquires about approximately 110 food items, was designed to estimate habitual intake of an array of nutrients and food groups (31). Using data from the FFQ, participants’ diet quality was calculated using the Healthy Eating Index-2010 (HEI) (32), which measures adherence to the 2010 Dietary Guidelines for Americans (DGA).

Physical Activity

PA was assessed using the Physical Activity Scale for the Elderly (PASE) (33), a valid and reliable self-report measure for older adults, with a higher score indicating greater self-reported physical activity.

Performance measures

Lower extremity (LE) strength was measured using the 30-second Chair Stand, which tests the number of full stands from a seated position a person can complete in 30 seconds with folded arms (34). Mobility was assessed using the 6-minute Walk Test, which measures functional exercise capacity (35-37).

OA Symptoms

The Western Ontario and McMaster Universities Arthritis Index (WOMAC) was used to assess OA symptoms of stiffness and pain in the hip and knee joints during daily activities and the degree to which physical functioning is affected by arthritis.

Depression and anxiety

These outcomes were measured using the GERI-AIMS, a version of the Arthritis Impact Measurement Scale that was adapted for use with an elderly population (38).

Self Efficacy

We assessed weight-related SE using the Weight Efficacy Lifestyle Questionnaire (WEL), a 20-item measure that assesses confidence to manage eating in an array of situations (39).

Statistical Analyses

We tested for differences in participant characteristics between randomization groups at baseline using t-tests for most continuous variables, Wilcoxon rank tests for income and number of chronic conditions, and chi-square tests for categorical variables. We also examined differences in anthropometrics, diet, physical activity, performance measures, WOMAC OA index, anxiety/depression, and self-efficacy by age (<70 vs ≥ 70 years) using t-tests and chi-square tests. We explored associations with diet quality, PA, and physical performance using linear regression models with multiple covariates. SAS v 9.4 was used for all analyses.


Primary Results

This study met its target recruitment goal of 400 subjects. We randomized 413 individuals: 203 to standard Fit & Strong! and 210 to Fit & Strong! Plus. Table 1 reflects the baseline demographic characteristics.  As we anticipated in designing the study, our sample was primarily African-American and representative of the racial and ethnic distribution of older adults in the neighborhoods surrounding the participating Chicago Park District sites. As measured by the Block 2005 FFQ, participants reported a mean energy intake of 1579 (SD = 710) calories, the mean percentage of calories from fat was 39.9 (SD = 6.9%), and the mean HEI total score was 66.3 out of a possible 100, which is in the “needs improvement” range, but is consistent with the HEI-2010 total score reported by the USDA for a nationally representative sample of adults that were 65 years and older (https://www.cnpp.usda.gov/sites/default/files/healthy_eating_index/HEI89-90report.pdf; https://www.cnpp.usda.gov/sites/default/files/healthy_eating_index/HEI-2010-During-2011-2012-Oct21-2016.pdf).

Table 1 Participant characteristics at baseline

Table 1
Participant characteristics at baseline

a. N=345 for income, N=411 for waist. For diet data, N=400; records with estimated energy <500 or >5000 were excluded from the analysis (N=13: 6 in F&S Plus, 7 in F&S). N=409 for physical activity score and 6-minute walk, and N=412 for chair stands; b. Percentage of participants reporting each type of insurance; some participants reported more than one type of insurance; c. Chronic conditions: Number of self-reported conditions currently affecting health (of 17): arthritis, high BP, heart disease, mental illness, diabetes, cancer, alcohol or drug abuse, lung disease, kidney disease, liver disease, stomach disease, blood disease, stroke or other neurologic problems, vascular disease, vision problems, hearing problems, thyroid; d. A higher score indicates greater physical activity; e. A higher score indicates greater difficulties due to OA; f. A higher score indicates greater anxiety/depression; g .A higher score indicates greater self-efficacy.


The mean score on the PASE (33) was 97.2 (SD = 61.3), which is lower than the  mean scores of 169.3 (SD = 88.2) reported by Skou and colleagues (40) and 131.4 (SD = 71.1) by Martin and colleagues (41) in work with older adult samples. Participants had a low mean score of 8.7 (SD = 3.6) on the 30-second chair stand as well as a low mean score of 356.3 meters (SD = 97.1) on the six-minute walk test. On the WOMAC, participants had a mean of 5.6 (SD = 4.0) on the pain subscale, 3.2 (SD = 1.7) on the stiffness subscale and 18.0 (SD = 12.9) on the physical functioning subscale, indicating a moderate amount of OA-related impairment at baseline. The mean score for anxiety/depression measured by the GERI-AIMS was low at 2.5 (SD = 1.7). Mean overall score on weight-related self-efficacy was 134.1 (SD = 32.9), which is higher than reported for other samples of overweight/obese non-Hispanic white samples (5, 42). Mean self-efficacy for exercise was also relatively high: 7.6 (SD=2.0) on a 1-10 scale.

Differences by Age

As shown in Table 2, we tested for differences between younger (60-69 years) and older (≥ 70 years) participants on a number of measures. Younger participants had a higher mean BMI (35.3 vs. 33.6 kg/m2, p = .003), and 23% of younger participants had Class III obesity (≥ 40 kg/m2) compared to 12% of older participants. Consistent with their lower BMI, older participants also scored significantly higher on the HEI (mean=68.4 vs. 65.4, p = .009) and consumed more fiber (10.6 vs. 9.6 g/1000 kcal, p = .02). Mean scores on the self-reported WOMAC showed that younger participants perceived more OA-related impairment than older participants. This was evident across the pain (6.1 vs. 4.6, p < .001), stiffness (3.3 vs. 2.7, p = .002), and physical functioning subscales (19.1 vs. 15.6, p = .01). However, on the performance-based six-minute walk, younger participants had a better mean score than older participants (363.9 m vs. 338.8 m, p = .02).

Table 2 Participant characteristics at baseline by age

Table 2
Participant characteristics at baseline by age

a. Ns differ for some variables due to missing data; see Table 1; b. From t-tests with pooled variance for continuous variables and chi-square tests for categorical variables; c. A higher score indicates greater difficulties due to OA; d. A higher score indicates greater physical activity; e. A higher score indicates greater anxiety/depression; f. A higher score indicates greater self-efficacy.


Finally, we used linear regression models with multiple covariates to explore possible predictors of diet quality, PA, and performance measures at baseline (Table 3). The chosen predictors explained a relatively small percentage of the variance for the HEI-2010 (R2=0.06) and self-reported PA (R2=0.07), somewhat more for chair stands in 30 seconds (R2=0.12) and a substantial percentage for six-minute walk distance (R2=0.29). None of the selected predictors were significantly associated with the HEI-2010 score at baseline. However, increased age was associated with lower self-reported PA (b=-1.69, p = .002), a shorter 6-minute walk distance (b=-3.38, p < .001), and fewer chair stands in 30 seconds (b=-0.08, p = .01). A higher BMI predicted a shorter 6-minute walk distance (b=-4.70, p < .001) and fewer chair stands (-0.08, p =.02). Married participants had higher self-reported PA (b=18.44, p=.009), but did not have significantly higher performance scores. A higher score on the WOMAC (more severe OA symptoms) predicted a shorter 6-minute walk distance (b=-1.16, p < .001) and fewer chair stands (b=-0.04, p < .001).

Table 3 Predictors of diet quality, physical activity, and performance measures

Table 3
Predictors of diet quality, physical activity, and performance measures

From linear regression models with diet and physical activity variables as the dependent variable and the variables shown as independent variables. For diet data, N=400; records with estimated energy <500 or >5000 were excluded from the analysis (N=13: 6 in F&S Plus, 7 in F&S). Due to missing data, N=409 for physical activity score and 6-minute walk; a. A higher score indicates greater physical activity; b. A higher score indicates greater difficulties due to OA; c. A higher score indicates greater anxiety/depression; d. A higher score indicates greater self-efficacy.


Discussion

OA is a leading cause of pain and disability among older adults in the US (43). The primary aim of this comparative effectiveness trial is to assess whether Fit & Strong! Plus is more successful than Standard Fit & Strong! for producing positive dietary changes at post-intervention (2 months) and producing a 5% or greater weight loss at 6 months that is maintained at 18 months among older adults who both have OA and are overweight or obese. The secondary aim is to assess whether Fit & Strong! Plus will produce superior outcomes for this population in self-reported PA and physical performance, lower extremity (LE) pain, stiffness, function, anxiety/depression, and self-efficacy at 2 months that are maintained at 6, 12, and 18 months.
Dietary intake is a central aspect of weight management, and high fat consumption is a key contributor to the obesity epidemic (44, 45). Overall, participants in our study consumed more than the recommended amount of fat and less than the recommended amount of fiber (46).  Although clinical guidelines recommend PA as a central tenet of treating OA, PA in this population is low, with less than 50% meeting current recommended activity levels (47-49).  In addition, a number of articles demonstrate that African Americans are less likely to meet PA guidelines than non-Hispanic whites (50, 51), and that African-American women, in particular, are among those reporting the lowest levels of PA (52-54).
We also administered the performance-based six-minute walk test. The mean score in our sample was 356.3 meters, which was lower than reports from other samples comprising individuals with OA (55).
Measuring lower body strength is vital when evaluating the functional performance of older adults with OA (34, 56) The 30-second chair stand test provides a reliable and valid indication of lower body strength and function (57). In our study, the mean score on this test was 8.7 (SD = 3.6), which is lower than the 13.1 reported in another study of healthy older adults (mean = 70.5 years) (34), and importantly, it was also lower than a score of 10.0 reported in a study of older adults (mean = 56.3 years) with OA(55).
Overall, OA-related pain and functional limitations are known to be higher among African Americans compared to non-Hispanic whites (58, 59). On the WOMAC, we observed both commonalities and differences between our sample and other older adult samples. For example, pain and physical function scores were 6.5 and 24.2 in the Messier IDEA trial respectively (20), compared to our scores of 5.6 and 18.0. Wilcox and colleagues (55) reported lower scores than our sample on the pain subscale (4.6-4.9), but higher scores on the stiffness subscale (5.1-5.5 vs. 3.2 in our sample).  A prior study of customary Fit & Strong! that included approximately 47% African Americans (42) reported similar scores on the pain and stiffness subscales but a higher score on physical function (42).
The differences between our older and younger participants are striking for the WOMAC. On all subscales, younger participants (60-69 years) reported more pain, stiffness, and disability than older participants (≥70 years). This could reflect societal changes in how people think about their health, with younger groups of older adults having higher expectations for their health [60].
Limitations. The current study has several limitations. It is limited to individuals who are overweight and obese (BMI = 25-50 kg/m²) and will not provide information on how Fit & Strong! Plus could benefit those with a BMI < 25 or > 50. We also did not clinically confirm OA, but instead used self-reported LE pain and stiffness. Additionally, our sample consisted of primarily lower-income adults with a median income of $25,000.
Conclusions. This study adds to the limited literature on combined PA and diet and weight management studies with older African-American adults with OA. Our results highlight some differences in self-reported versus performance-based functioning in our study sample at baseline and also documents differences between younger and older individuals within our older adult sample. Our findings regarding increased BMI and poorer self-reported function agree with findings from several recent longitudinal studies on aging that document disturbing trends of increased disability related to overweight/obesity in younger cohorts of aging adults (61, 62). These findings illustrate the need for additional research and ongoing refinement of interventions for this population that is both high-risk and growing rapidly.

Author’s Note

This project is supported by Grant Number R01AG039374 from the National Institute on Aging.  Additional support was provided by the American Cancer Society of Illinois grant (#261775) and American Cancer Society Mentored Research Scholar grant MRSG014-025-01-CNE) to Dr. Lisa Tussing-Humphreys. The content of this manuscript is solely the responsibility of the authors and does not necessarily represent the official views of the National Institute on Aging or National Institutes of Health.  We wish to thank Colleen Lammel and the supportive staff at the Chicago Park Districts. We would also like to thank Mirjana Antonic for her administrative support and the study participants for giving their time generously to the project.


Conflict of Interests: The authors declare that there are no conflicts of interest.

Ethical standards: All authors in this manuscript declare that they have no conflicting interest


References

1.    Trends in aging – united states and worldwide MMWR Suppl. 2003;52:101-6.
2.    Kington RS, Smith JP. Socioeconomic status and racial and ethnic differences in functional status associated with chronic diseases. Am J Public Health. 1997;87(5):805-10.
3.    Dunlop DD, Manheim LM, Sohn MW, Liu X, Chang RW. Incidence of functional limitation in older adults: The impact of gender, race, and chronic conditions. Arch Phys Med Rehabil. 2002;83(7):964-71.
4.    Helmick CG, Lawrence RC, Pollard RA, Lloyd E, Heyse SP. Arthritis and other rheumatic conditions: Who is affected now, who will be affected later? National arthritis data workgroup. Arthritis Care Res. 1995;8(4):203-11.
5.    Clark MM, Cargill BR, Medeiros ML, Pera V. Changes in self-efficacy following obesity treatment. Obes Res. 1996;4(2):179-81.
6.    Silverwood V, Blagojevic-Bucknall M, Jinks C, Jordan JL, Protheroe J, Jordan KP. Current evidence on risk factors for knee osteoarthritis in older adults: A systematic review and meta-analysis. Osteoarthritis Cartilage. 2015;23(4):507-15.
7.    Szoeke CE, Cicuttini FM, Guthrie JR, Clark MS, Dennerstein L. Factors affecting the prevalence of osteoarthritis in healthy middle-aged women: Data from the longitudinal melbourne women’s midlife health project. Bone. 2006;39(5):1149-55.
8.    Washburn RA, Smith KW, Jette AM, Janney CA. The physical activity scale for the elderly (pase): Development and evaluation. J Clin Epidemiol. 1993;46(2):153-62.
9.    Flegal KM, Kruszon-Moran D, Carroll MD, Fryar CD, Ogden CL. Trends in obesity among adults in the united states, 2005 to 2014. Jama. 2016;315(21):2284-91.
10.    Freedman DS. Obesity – united states, 1988-2008. MMWR Suppl. 2011;60(1):73-7.
11.    Crowninshield RD, Rosenberg AG, Sporer SM. Changing demographics of patients with total joint replacement. Clin Orthop Relat Res. 2006;443:266-72.
12.    Leininger RE, Knox CL, Comstock RD. Epidemiology of 1.6 million pediatric soccer-related injuries presenting to us emergency departments from 1990 to 2003. Am J Sports Med. 2007;35(2):288-93.
13.    Deshpande BR, Katz JN, Solomon DH, Yelin EH, Hunter DJ. Number of persons with symptomatic knee osteoarthritis in the us: Impact of race and ethnicity, age, sex, and obesity. Arthritis Care Res (Hoboken). 2016;68(12):1743-50.
14.    Zhang W, Robertson J, Jones AC, Dieppe PA, Doherty M. The placebo effect and its determinants in osteoarthritis: Meta-analysis of randomised controlled trials. Ann Rheum Dis. 2008;67(12):1716-23.
15.    March L, Amatya B, Osborne RH, Brand C. Developing a minimum standard of care for treating people with osteoarthritis of the hip and knee. Best Pract Res Clin Rheumatol. 2010;24(1):121-45.
16.    Gay C, Chabaud A, Guilley E, Coudeyre E. Educating patients about the benefits of physical activity and exercise for their hip and knee osteoarthritis. Systematic literature review. Ann Phys Rehabil Med. 2016;59(3):174-83.
17.    Messier SP, Loeser RF, Miller GD, Morgan TM, Rejeski WJ, Sevick MA, et al. Exercise and dietary weight loss in overweight and obese older adults with knee osteoarthritis: The arthritis, diet, and activity promotion trial. Arthritis Rheum. 2004;50(5):1501-10.
18.    Messier SP, Loeser RF, Mitchell MN, Valle G, Morgan TP, Rejeski WJ, et al. Exercise and weight loss in obese older adults with knee osteoarthritis: A preliminary study. J Am Geriatr Soc. 2000;48(9):1062-72.
19.    Villareal DT, Chode S, Parimi N, Sinacore DR, Hilton T, Armamento-Villareal R, et al. Weight loss, exercise, or both and physical function in obese older adults. N Engl J Med. 2011;364(13):1218-29.
20.    Messier SP, Mihalko SL, Legault C, Miller GD, Nicklas BJ, DeVita P, et al. Effects of intensive diet and exercise on knee joint loads, inflammation, and clinical outcomes among overweight and obese adults with knee osteoarthritis: The idea randomized clinical trial. Jama. 2013;310(12):1263-73.
21.    Somers TJ, Blumenthal JA, Guilak F, Kraus VB, Schmitt DO, Babyak MA, et al. Pain coping skills training and lifestyle behavioral weight management in patients with knee osteoarthritis: A randomized controlled study. Pain. 2012;153(6):1199-209.
22.    Messier SP, Gutekunst DJ, Davis C, DeVita P. Weight loss reduces knee-joint loads in overweight and obese older adults with knee osteoarthritis. Arthritis Rheum. 2005;52(7):2026-32.
23.    Zinn C, Schofield GM, Hopkins WG. A “small-changes” workplace weight loss and maintenance program: Examination of weight and health outcomes. J Occup Environ Med. 2012;54(10):1230-8.
24.    Fitzgibbon ML, Stolley M, Schiffer L, Sharp L, Singh V, Van Horn L, et al. Obesity reduction black intervention trial (orbit): Design and baseline characteristics. J Womens Health (Larchmt). 2008;17(7):1099-110.
25.    Fitzgibbon ML, Stolley MR, Schiffer L, Sharp LK, Singh V, Dyer A. Obesity reduction black intervention trial (orbit): 18-month results. Obesity (Silver Spring). 2010;18(12):2317-25.
26.    Stolley MR, Fitzgibbon ML, Schiffer L, Sharp LK, Singh V, Van Horn L, et al. Obesity reduction black intervention trial (orbit): Six-month results. Obesity (Silver Spring). 2009;17(1):100-6.
27.    Hughes SL, Seymour RB, Campbell R, Pollak N, Huber G, Sharma L. Impact of the fit and strong intervention on older adults with osteoarthritis. Gerontologist. 2004;44(2):217-28.
28.    Hughes SL, Seymour RB, Campbell RT, Desai P, Huber G, Chang HJ. Fit and strong!: Bolstering maintenance of physical activity among older adults with lower-extremity osteoarthritis. Am J Health Behav. 2010;34(6):750-63.
29.    Hughes SL, Seymour RB, Campbell RT, Huber G, Pollak N, Sharma L, et al. Long-term impact of fit and strong! On older adults with osteoarthritis. Gerontologist. 2006;46(6):801-14.
30.    Smith-Ray RL, Fitzgibbon ML, Tussing-Humphreys L, Schiffer L, Shah A, Huber GM, et al. Fit and strong! Plus: Design of a comparative effectiveness evaluation of a weight management program for older adults with osteoarthritis. Contemp Clin Trials. 2014;37(2):178-88.
31.    Block G, Hartman AM, Dresser CM, Carroll MD, Gannon J, Gardner L. A data-based approach to diet questionnaire design and testing. Am J Epidemiol. 1986;124(3):453-69.
32.    Guenther PM, Casavale KO, Reedy J, Kirkpatrick SI, Hiza HA, Kuczynski KJ, et al. Update of the healthy eating index: Hei-2010. J Acad Nutr Diet. 2013;113(4):569-80.
33.    Washburn RA, McAuley E, Katula J, Mihalko SL, Boileau RA. The physical activity scale for the elderly (pase): Evidence for validity. J Clin Epidemiol. 1999;52(7):643-51.
34.    Jones CJ, Rikli RE, Beam WC. A 30-s chair-stand test as a measure of lower body strength in community-residing older adults. Res Q Exerc Sport. 1999;70(2):113-9.
35.    Kennedy DM, Stratford PW, Wessel J, Gollish JD, Penney D. Assessing stability and change of four performance measures: A longitudinal study evaluating outcome following total hip and knee arthroplasty. BMC Musculoskelet Disord. 2005;6:3.
36.    Naylor JM, Hayen A, Davidson E, Hackett D, Harris IA, Kamalasena G, et al. Minimal detectable change for mobility and patient-reported tools in people with osteoarthritis awaiting arthroplasty. BMC Musculoskelet Disord. 2014;15:235.
37.    Guyatt GH, Sullivan MJ, Thompson PJ, Fallen EL, Pugsley SO, Taylor DW, et al. The 6-minute walk: A new measure of exercise capacity in patients with chronic heart failure. Can Med Assoc J. 1985;132(8):919-23.
38.    Hughes SL, Edelman P, Chang RW, Singer RH, Schuette P. The geri-aims. Reliability and validity of the arthritis impact measurement scales adapted for elderly respondents. Arthritis Rheum. 1991;34(7):856-65.
39.    Dutton GR, Martin PD, Rhode PC, Brantley PJ. Use of the weight efficacy lifestyle questionnaire with african american women: Validation and extension of previous findings. Eat Behav. 2004;5(4):375-84.
40.    Skou ST, Wise BL, Lewis CE, Felson D, Nevitt M, Segal NA. Muscle strength, physical performance and physical activity as predictors of future knee replacement: A prospective cohort study. Osteoarthritis Cartilage. 2016;24(8):1350-6.
41.    Martin KA, Rejeski WJ, Miller ME, James MK, Ettinger WH, Jr., Messier SP. Validation of the pase in older adults with knee pain and physical disability. Med Sci Sports Exerc. 1999;31(5):627-33.
42.    Pinto BM, Clark MM, Cruess DG, Szymanski L, Pera V. Changes in self-efficacy and decisional balance for exercise among obese women in a weight management program. Obes Res. 1999;7(3):288-92.
43.    Johnson VL, Hunter DJ. The epidemiology of osteoarthritis. Best Pract Res Clin Rheumatol. 2014;28(1):5-15.
44.    Fung TT, Rimm EB, Spiegelman D, Rifai N, Tofler GH, Willett WC, et al. Association between dietary patterns and plasma biomarkers of obesity and cardiovascular disease risk. Am J Clin Nutr. 2001;73(1):61-7.
45.    Cordain L, Eaton SB, Sebastian A, Mann N, Lindeberg S, Watkins BA, et al. Origins and evolution of the western diet: Health implications for the 21st century. Am J Clin Nutr. 2005;81(2):341-54.
46.    Dietary guidelines for americans, 2010. Washington, D.C.: Office of Disease Prevention and Health Promotion, 2010 December 2010. Report No.
47.    Holden MA, Nicholls EE, Young J, Hay EM, Foster NE. Exercise and physical activity in older adults with knee pain: A mixed methods study. Rheumatology (Oxford). 2015;54(3):413-23.
48.    Herbolsheimer F, Schaap LA, Edwards MH, Maggi S, Otero A, Timmermans EJ, et al. Physical activity patterns among older adults with and without knee osteoarthritis in six european countries. Arthritis Care Res (Hoboken). 2016;68(2):228-36.
49.    Wallis JA, Webster KE, Levinger P, Taylor NF. What proportion of people with hip and knee osteoarthritis meet physical activity guidelines? A systematic review and meta-analysis. Osteoarthritis Cartilage. 2013;21(11):1648-59.
50.    Mama SK, McNeill LH, McCurdy SA, Evans AE, Diamond PM, Adamus-Leach HJ, et al. Psychosocial factors and theory in physical activity studies in minorities. Am J Health Behav. 2015;39(1):68-76.
51.    Matthews CE, Chen KY, Freedson PS, Buchowski MS, Beech BM, Pate RR, et al. Amount of time spent in sedentary behaviors in the united states, 2003-2004. Am J Epidemiol. 2008;167(7):875-81.
52.    Tucker JM, Welk GJ, Beyler NK. Physical activity in u.S.: Adults compliance with the physical activity guidelines for americans. Am J Prev Med. 2011;40(4):454-61.
53.    Troiano RP, Berrigan D, Dodd KW, Masse LC, Tilert T, McDowell M. Physical activity in the united states measured by accelerometer. Med Sci Sports Exerc. 2008;40(1):181-8.
54.    Cohen SS, Matthews CE, Signorello LB, Schlundt DG, Blot WJ, Buchowski MS. Sedentary and physically active behavior patterns among low-income african-american and white adults living in the southeastern united states. PLoS One. 2013;8(4):e59975.
55.    Wilcox S, McClenaghan B, Sharpe PA, Baruth M, Hootman JM, Leith K, et al. The steps to health randomized trial for arthritis: A self-directed exercise versus nutrition control program. Am J Prev Med. 2015;48(1):1-12.
56.    Stump TE, Clark DO, Johnson RJ, Wolinsky FD. The structure of health status among hispanic, african american, and white older adults. J Gerontol B Psychol Sci Soc Sci. 1997;52 Spec No:49-60.
57.    Bohannon RW. Sit-to-stand test for measuring performance of lower extremity muscles. Percept Mot Skills. 1995;80(1):163-6.
58.    Anderson KO, Green CR, Payne R. Racial and ethnic disparities in pain: Causes and consequences of unequal care. J Pain. 2009;10(12):1187-204.
59.    Hardt J, Jacobsen C, Goldberg J, Nickel R, Buchwald D. Prevalence of chronic pain in a representative sample in the united states. Pain Med. 2008;9(7):803-12.
60.    Martin LG, Freedman VA, Schoeni RF, Andreski PM. Health and functioning among baby boomers approaching 60. J Gerontol B Psychol Sci Soc Sci. 2009;64(3):369-77.
61.    Rosen DMCaELGaAB. Is the us population behaving healthier? Working Paper. National Bureau of Economic Research, 2007 April. Report No.:  Contract No.: 13013.
62.    Olshansky SJ. Projecting the future of u.S. Health and longevity. Health Aff (Millwood). 2005;24 Suppl 2:W5r86-9.

DIVERSIFIED ANALYSIS OF NUTRITIONAL STATUS IN COMMUNITY-DWELLING OLDER ADULTS IN JAPAN


M. Kawashima1, M. Kubota1,2, H. Saito1, S. Shinozuka3


1. Department of Human Life and Environment, Nara Women’s University, Nara, Japan; 2. Faculty of Agriculture, Department of Food and Nutrition, Ryukoku University, Shiga, Japan; 3. Shinozuka Clinic, Osaka, Japan

Corresponding Author: Masaru Kubota, Faculty of Agriculture, Department of Food and Nutrition, Ryukoku University, Shiga, Japan, e-mail: masaru_kubota@chime.ocn.ne.jp

J Aging Res Clin Practice 2017;6:223-228
Published online November 8, 2017, http://dx.doi.org/10.14283/jarcp.2017.30


Abstract

Objectives: This study aimed to comprehensively analyze the nutritional status of community-dwelling older adults in Japan. Design and Participant: Participants included 48 outpatients (13 males and 35 females) aged ≧65 years who visited a private clinic in an urban city. Body height, body weight, and blood variables, including albumin, lymphocyte counts and total cholesterol, and pre-albumin, were obtained from the patient charts. The MNA-SF and nutritional intakes, using an established semiquantitative questionnaire, were conducted by an interview with a dietitian. Results: Nutritional risk assessment by MNA-SF revealed that 13 patients (27.1%) were at a risk of malnutrition and 4 patients (8.3%) demonstrated thinness, i.e., BMI <18.5 kg/m2. No statistical difference in terms of sex was found in the MNA-SF or BMI analyses. The caloric, protein, and lipid intake, adjusted by body weight, were significantly higher in females than in males. The daily caloric intake of 15 patients (31.3%) was below the estimated energy requirements defined by Dietary Reference Intakes for Japanese (2015), and the frequency of low estimated energy requirements was significantly higher in males than in females. Multiple regression analysis demonstrated that both BMI and MNA-SF were associated with albumin levels. Conclusions: Our findings suggest that malnutrition is not prevalent among community-dwelling older adults in Japan. Albumin may work as indicators for predicting malnutrition. Considering the lower caloric, protein, and lipid intake of males compared with females, caregivers should note that older adult males may be at a higher risk of malnutrition.

Keywords: Malnutrition, older adults, MNA-SF, albumin, nutritional intake.


Introduction

The number of individuals aged ≥65 years, hereafter referred to as older adults, has rapidly increased in developed countries. In Japan, according to the national census in 2015, approximately 27% of the entire population falls into this category (1). Under these circumstances, healthcare for older adults has become important in terms of minimizing both acute and chronic comorbidities and promoting healthy, active lifestyles. Nutritional care plays an integral role in health, regardless of the type of dwelling (i.e., community, nursing-care, or hospital) (2-4).
For adequate achievement of nutritional care, nutritional assessment is a necessary initial step. There are several methods for nutritional assessment, including short screening questionnaires, anthropometric measures, and laboratory markers. The Mini Nutritional Assessment (MNA) is a widely used screening tool for identifying individuals with malnutrition or those at a risk of malnutrition (5). Because MNA contains specific questions related to older adults (i.e., independence, cognition, quality of life, and morbidity), the European Society for Clinical Nutrition and Metabolism recommends MNA as a commonly acceptable tool for nutritional screening in older adults (6). Recently, the MNA Short-Form (MNA-SF), which includes six questions from the original MNA, has been validated as a more suitable tool for older adults (7). Anthropometric measures, such as body weight, BMI, and calf circumferences, are also useful (8). Finally, among various laboratory markers, albumin level has been used as the gold standard for the diagnosis of malnutrition, although its accuracy and precision can be affected by inflammation or hepatic functions (9,10). In order to compensate for this limitation, the Nutritional Control Status (CONUT) system, which utilizes several laboratory tests simultaneously, including albumin levels, total cholesterol levels and total lymphocyte counts has been developed for clinical use (11).
A nutritional intake study is a distinguished approach for the nutritional assessment, since it tries to focus on a causative factor of malnutrition. A careful investigation of nutrition, both quantitative (i.e., energy intake) and qualitative (i.e., nutrient quality), may provide means of preventing malnutrition (12); however, this method has limitations in the older adult population, given the higher rates of cognitive and functional decline, which may hamper the accuracy of dietary assessment (13). In addition, the standard of nutritional intakes, for example, estimated energy requirements (EER), may differ among countries, making it difficult to compare across populations of different countries. Therefore, it is essential to establish and utilize the standard values specific to each country (14).
As described above, each nutritional assessment methodology has its advantages and limitations. Therefore, our study utilized a mixed-methods approach (i.e., measurement of MNA-SF, BMI, laboratory markers, and nutritional intake measurements) to obtain a more comprehensive understanding of malnutrition prevalence and characteristics among community-dwelling older adults in Japan.


Materials and methods

Study design and subjects

This study was conducted between May and July 2014 on outpatients who visited Shinozuka Clinic, Higashi-Osaka, a private clinic specializing in internal medicine. Higashi-Osaka is one of the satellite cities of Osaka, with a population of approximately 500,000, 27% of which are aged ≥65 years. Among patients visiting the clinic during that period, 330 patients fulfilled the following inclusion criteria: (i) age ≥65 years (definition of older adults in Japan), (ii) ambulant patients, and (iii) had data on body height and weight recorded within the last month. We asked these patients whether they were able to participate in the subsequent nutritional intake study, and 48 were finally enrolled in the study. The basic characteristics, such as sex, age, BMI, and underlying disease status, in these 48 patients were comparable with the 330 patients initially selected to participate (Table 1). This project was approved by the ethical and epidemiological committee of Nara Women’s University.

Measurement of body height, weight, MNA-SF and blood markers

Body height and weight were measured by well-trained nurses. Height was measured to the nearest 0.1 cm, and weight was measured to the nearest 0.1 kg. BMI was calculated by dividing the body weight (kg) by the square of height (m). Nutritional risk assessment was performed using MNA-SF (7). Scores between 8 and 11 and ≤7 were defined as malnutrition at risk and malnutrition, respectively. Data on serum albumin, total leukocytes counts with their differentials, total cholesterol, and pre-albumin levels were obtained from the recent patient charts within 1 month. C-reactive protein (CRP) levels at the time of sampling were <1.0 mg/dl in all patients. The cutoff of albumin level (<3.5 g/dl), total cholesterol levels (<180 mg/dl) and total lymphocyte counts (<1600/μl) were obtained from the CONUT study. CONUT scores were calculated as described by Ignacio de Ulibarri et al. (11), and the scores were classified as follows: healthy, 0–1; light undernutrition, 2–4; moderate undernutrition, 5–8; and severe undernutrition, 9–12. For pre-albumin levels, we used a cutoff of <21.0 mg/dl, described by Takeda et al. (15).


Table 1 Basic characteristics of participants

Table 1
Basic characteristics of participants

* Numbers in parentheses indicate percentages. § Median and range in brakets are shown; †Chi-squared test or Fisher’s exact test. ‡Mann-Whitney U test

Nutritional intake study

We collected nutritional information from each patient (i.e., nutritional intake in the last 1 week), using the established semiquantitative questionnaire “Excel Eiyou-kun, FFG3.5” (Kenpaku-sha, Tokyo, Japan) (16). FFG3.5 consists of 29 food groups and estimates the amount of food group and nutrient ingested based on self-reported intake data (i.e., portion size and frequency). Portion size is a simple, countable unit used to describe the approximate amount of food in each dish. Our dietitian and chief investigator, MK, conducted face-to-face interviews with the patients to obtain this information and demonstrated approximate portion sizes of different foods.

Statistical analysis

Differences in categorical variables were examined using the Chi-squared test or Fisher’s exact test and differences in continuous variables were examined using the Mann–Whitney U test. Correlation between albumin and pre-albumin levels was estimated using the Spearman’s rank-order test. Multiple regression analysis was performed using BMI or MNA-SF as a response variable. All statistical analyses were performed using Excel Statistics (Version 2012). A p-value of <0.05 was considered significant.


Results

Nutritional parameters

Data on various nutritional parameters are summarized in Table 2. Results from MNA-SF showed that 13 patients (27.1%) were at a risk of malnutrition, whereas no patients were malnourished. In contrast, BMI of <18.5 kg/m2, an indicator of thinness, was seen only in four patients (8.3%). Analysis of the blood markers, using the CONUT criteria (11), albumin, total cholesterol levels and total lymphocyte counts, were low in 3 (6.3%), 21 (43.8%), and 12 patients (25.0%), respectively. The results did not significantly differ between sexes; however, when evaluated as a continuous variable, albumin level was significantly lower in males than in females. While differences in terms of sex was marginal (0.05<p<0.1), total cholesterol levels tended to be higher in females than in males. Low pre-albumin levels, as judged by the Japanese criteria, were found in 5 patients (11.1%). Correlation efficiency between albumin and pre-albumin levels was 0.27, demonstrating weak statistical significance (p = 0.059). Finally, in the comprehensive analysis of laboratory tests consisting of 3 parameters (albumin, total cholesterol levels and total lymphocyte counts), 40 patients (83.3%) were found to be healthy, whereas only 1 patient (2.1%) was found to be moderately undernourished.

Table 2 Comparison of various nutritional parameters

Table 2
Comparison of various nutritional parameters

* Median and range in brakets are shown. § Numbers in parentheses indicate percentages; Comparison between “Male” and “Female” groups done by†Mann-Whitney U test ‡ Chi-squared test or Fisher’s exact test

Nutritional intakes

Table 3 depicts the nutritional intakes obtained by FFG3.5. Analysis of caloric intake and ingestion of 3 major nutrients (protein, lipid, and carbohydrate), as adjusted by body weight, showed that females consumed more than males except carbohydrate. In contrast, no difference was found in total daily caloric and protein intakes between males and females. 15 patients (31.3%) showed caloric intakes below EER and 6 (12.5%) patients showed protein intakes below estimated average requirement (EAR) established on the Dietary Reference Intakes for Japanese (2015) (17). This reference recommends 2100 kcal/day for males aged 50–69 years, 1850 kcal/day for males aged >70 years, 1650 kcal/day for females aged 50–69 years, and 1500 kcal/day for females aged >70 years. EAR for protein recommends 50 g/day for males and 40 g/day of protein for females. The rate of males below EER recommendations was significantly higher than that of females.

Table 3 Comparison of nutritional intakes

Table 3
Comparison of nutritional intakes

* EER: Estimated Energy Requirement indicates in males, 2100 (kcal/day) for 50-69 years,1850 (kcal/day) for over 70 years,   in females, 1650 (kcal/day) for 50-69 years, 1500 (kcal/day) for over 70 years, EAR: Estimated Average Requirement   for protein indicates 50 (g/day) in males, and 40 (g/day) in females.  These values are based on “Dietary Reference Intakes for Japanese (2015)”. § Median and range in brakets are shown. ∏ Numbers in parentheses indicate percentages. Comparison between “Male” and “Female” groups done by†Mann-Whitney U test ‡ Chi-squared test or Fisher’s exact test

Multiple regression analysis

As shown in Table 4, significant, positive associations were found between albumin levels and both BMI and MNA-SF. Furthermore, a negative association was found between females and MNA-SF.


Table 4 Correlation between BMI or MNA-SF and various parameters by multiple regression analysis

Table 4
Correlation between BMI or MNA-SF and various parameters by multiple regression analysis

* Coefficient of determination (R2) for BMI, 0.38; MNA-SF, 0.49


Discussion

Nutritional status is a key determinant of health, particularly in the older adult population (2-4). Dwelling type and age have been found to influence malnutrition prevalence of malnutrition.  There are nutritional assessments that focus on older adults within certain dwellings, including community dwellings (18-22), hospital (23) and nursing home (24). In reviewing available data on malnutrition by MNA, Cereda et al. reported considerable differences in malnutrition prevalence by clinical setting, with 3.1% prevalence in communities, 8.7% in homecare services, 22.0% in hospitals, and 29.4% in rehabilitation/sub-acute care clinics (25). Considering the growing older adult population, the nutritional assessment of those living in community settings is essential for early detection and early intervention of malnutrition.
This study used MNA-SF as a screening tool for malnutrition and risk of malnutrition. Consequently, 13 patients (27.1%) were found to be at a risk of malnutrition, without differences in terms of sex. None of our patients were found to be malnourished. Previous studies performed in Japan revealed that 12.6% were at a risk of malnutrition based on MNA (18) and 34.7% (26) on MNA-SF. On the other hand, the reports from Europe (19, 21, 22) and China (20) using either MNA or MNA-SF demonstrated the rates of the sum of malnutrition at risk and malnutrition were 22.5-76.1%. Subject numbers of these studies are not large enough to discuss the reason(s) for the different prevalence at present. However, studies targeting at the population with older age, more than 80 years old, tended to demonstrate higher prevalence of malnutrition (20,21).
Albumin, the most abundant protein in the plasma, works as an indicator of nutritional status, although inflammation and liver function have an effect on its metabolism, which often impacts results (9, 10). When albumin levels of <3.5 g/dl are defined as hypoalbuminemia (11, 27), 3 patients (6.3%) in our study demonstrated hypoalbuminemia, a cutoff value indicating malnutrition.. This prevalence is similar to other studies on the older adult population. One study reported that 3.1% of patients had hypoalbuminemia among 4,115 patients aged 71 years and elder (27), and a Japanese study reported that among 1130 patients aged ≥65 years, 2.4% of males and 1.5% of females had hypoalbuminemia (28). Furthermore, in our multiple regression model, albumin levels were shown to be independently associated with MNA-SF and BMI. This association with MNA-SF is consistent with previous reports by Ülger et al. (19) and Ji et al. (20). Taken together, albumin can work as a good marker for nutritional status assessment in older adults. Pre-albumin is used in evaluating acute nutritional changes because of its shorter half-life than albumin (9). Because the reference value for pre-albumin has not been well established, we used the cutoff value presented by Takeda et al. (15) and demonstrated low levels in 5 patients (11.1%). This prevalence of low pre-albumin was almost identical to a report among the French older adults, using the cutoff of 20 mg/dl (29). This study also demonstrated that pre-albumin levels weakly correlated with albumin levels.
Several methods exist for evaluating nutritional intakes, including validated FFQ, dietary history, 24-h recall, and dietary records of ≥3 days (30). Among them, we have chosen the validated FFQ (16) by a face-to-face interview because of the possible impairment of cognition in the older adult population. EAR for energy presented by the World Health Organization (WHO) is based on a physical activity score of 1.6 and body weight of 80 kg for men and 65 kg for women (30). Because these values are much greater than the Japanese standards, we adapted our own reference values established on the basis of Dietary Reference Intakes for Japanese (2015), to mirror similar Japanese reports (14,16). Our findings indicate that the nutritional intakes in females were more desirable than in males. Namely, caloric and protein intakes in females tended to be higher than those in males. Therefore, older adult males in Japan may have the possibility of becoming malnourished in their later life.
The present study has several limitations. First, the number of subjects was small because only 15% of the 330 initially enrolled patients agreed to participate. However, as shown in Table 1, the basic characteristics, including sex, age, BMI, and underlying disease status, between initially enrolled population and the study population were statistically similar. Second, other factors related to older adult nutritional status (i.e., presence of depression, level of dependence, and physical activity) were not included. In fact, previous studies have shown that these factors were independently associated with malnutrition of older adults in the community (18-22, 25). Finally, although we checked the presence of underlying diseases, including non-communicable diseases, we were unable to incorporate these data into the analysis. The reason behind this is that the status of controlling the disease is quite diverse among patients, even if the clinical diagnosis is the same. In spite of these limitations, the present study is quite informative because comprehensive parameters, i.e., malnutrition screening tool (MNA-SF), anthropometry (BMI), laboratory tests (albumin, pre-albumin, cholesterol, total lymphocyte counts, and CONUT scores), and nutritional intakes (FFQ) were measured simultaneously. In conclusion, Japanese older adults in the community are fairly well nourished; however, the nutritional intake study indicates that older adult males may be at higher risk of malnutrition in the future than women. Community caregivers should take note of this finding and update their care plans accordingly.


Acknowledgments: This research did not receive any specific grant from funding agencies in the public, commercial, or not-for-profit sectors. The authors would like to thank Enago (www.enago.jp) for their pertinent advice on the present review.

Conflict of interests: The authors declare that they have no conflicts of interest. .

Ethical standard: We have obtained only “verbal consent” from the participants. Instead of the formal written consent, the chief physician (S.Shinozuka) explained the details of the study and, when their consent was obtained, he described it in the patient’s chart with his signature. This study was “an observational study” without any invasive procedures. Namely, blood samples were obtained from the participants as one of the regular clinical works, not specifically for this clinical research. In the study of nutritional intake, “no specific” intervention was performed. We just checked the participants’ daily diet life using FFQ. Therefore, we thought that the procedure described above (no.1) was enough from the point of ethics and for protection of patients’ right. This whole procedure of obtaining the informed consent was approved by the ethical committee at Nara Women’s University before starting this research, as described in the text. This study was conducted in accordance with the Declaration of Helsinki


References

1.    Ministry of Internal Affairs and Communications, Japan, A national census (2015), http://www.stat.go.jp/data/kokusei/2015/kekka/kihon1/pdf/youyaku.pdf Accessed 1 April 2016
2.    Artacho R, Lujano C, Sanchez-Vico AB, et al. Nutritional status in chronically-ill elderly patients. Is it related to quality of life? J Nutr Health Aging 2014;18:192-197.
3.    Grattagliano I, Mastronuzzi T. Nutrition as a health determinant in elderly patients. Curr Med Chem 2017 doi: 10.2174/09299867324666170523125806.
4.    Shlisky J, Bloom DE, Beaudreault AR, et al. Nutritional considerations for healthy aging and reduction in age-related chronic disease. Adv Nutr 2017;8:17-26.
5.    Guigoz Y. The Mini Nutritional Assessment (MNA) review of the literature—What does it tell us? J Nutr Health Aging 2006;10:466-485.
6.    Kondrup J, Allison SP, Elia M, Vellas B, Plauth M. Educational and Clinical Practice Committee, European Society of Parenteral and Enteral Nutrition (ESPEN). ESPEN guidelines for nutrition screening 2002. Clin Nutr 2003;22:415-421.
7.    Kaiser MJ, Bauer JM, Ramsch C, et al. Validation of the mini nutritional assessment short-form (MNA-SF): a practical tool for identification of nutritional status. J Nutr Health Aging 2009;13:782-788.
8.    Silva Rodrigues RA, Martinez Espinosa M, Duarte Melo C, Rodrigues Perracini M, Rezende Fett WC, Fett CA. New values anthropometry for classification of nutritional status in the elderly. J Nutr Health Aging 2014;18:655-661.
9.    Omran ML, Morley JE. Assessment of protein energy malnutrition in older persons, part II: Laboratory evaluation. Nutrition 2000;16:131-140.
10.    Cabrerizo S, Cuadras D, Gomez-Busto F, Artaza-Artabe I, Ciancas FM, Malafarina V. Serum albumin and health in older people: Review and meta analysis. Maturitas 2015;81:17-27.
11.    Ignacio de Ulibarri J, González-Madroño A, de Villar NGP, et al. CONUT: A tool for controlling nutritional status. First validation in a hospital population. Nutr Hosp 2005;20:38-45.
12.    Lorenzo-López L, Maseda A, de Labra C, Regueiro-Folgueira L, Rodríguez-Villamil JL, Millán-Calenti JC. Nutritional determinants of frailty in older adults: A systematic review. BMC Geriatr 2017;17:108.
13.    de Vries JHM, de Groot LCPGM, van Staveren WA. Dietary assessment in elderly people: experiences gained from studies in the Netherlands. Eur J Clin Nutr 2009;63(suppl 1) S69-S74.
14.    Iizaka S, Kaitani T, Nakagami G, Sugama J, Sanada H. Clinical validity of the estimated energy requirement and the average protein requirement for nutritional status change and wound healing in older patients with pressure ulcers: A multicenter prospective cohort study. Geriatr Gerontol Int 2015;15:1201-1209.
15.    Takeda H, Ishihama K, Fukui T, et al. Significance of rapid turnover proteins in protein-losing gastroenteropathy. Hepatogastroenterology 2003;50:1963-1965.
16.    Nozue M, Ishikawa M, Takemi Y, et al. Prevalence of inadequate nutritional intake in Japanese community-dwelling older adults who live alone. J Nutr Sci Vitaminol 2016;62:116-122.
17.    Dietary Reference Intakes for Japanese (2015) The Minister of Health, Labor and Welfare (Japan) http://www.mhlw.go.jp/file/06-Seisakujouhou-10900000-Kenkoukyoku/Overview. pdf Accessed 1 April 2016
18.     Iizaka S, Tadaka E, Sanada H. Comprehensive assessment of nutritional status and associated factors in the healthy, community-dwelling elderly. Geriatr Gerontol Int 2008;8:24-31
19.    Ülger Z, Halil M, Kalan I, et al. Comprehensive assessment of malnutrition risk and related factors in a large group of community-dwelling older adults. Clin Nutr 2010;29:507-511.
20.     Ji L, Meng H, Dong B. Factors associated with poor nutritional status among the oldest-old. Clin Nutr 2012;31:922-926.
21.    van Bokhorst-de van der Schueren MAE, Lonterman-Monasch S, de Vries OJ, Danner SA, Kramer MHH, Muller M. Prevalence and determinants for malnutrition in geriatric outpatients. Clin Nutr 2013;32:1007-1011.
22.     Hernández-Galiot A, Goñi I. Quality of life and risk of malnutrition in a home-dwelling population over 75 years old. Nutrition 2017;35:81-86.
23.     Drescher T, Singler K, Ulrich A, et al. Comparison of two malnutrition screening methods (MNA and NRS 2002) and their association with markers of protein malnutrition in geriatric hospitalized patients. Eur J Clin Nutr 2010;64:887-893.
24.     Lilamand M, Kalaiditi E, Demougeot L, Rolland Y, Vellas B, Cesari M. The Mini Nutritional Assessment-Short Form and mortality in nursing home residents—results from the INCUR study. J Nutr Health Aging 2015;19:383-388.
25.     Cereda E, Pedrolli C, Klersy C, et al. Nutritional status in older persons according to healthcare setting: A systematic review and meta-analysis of prevalence data using MNA. Clin Nutr 2016;35:1282-1290.
26.     Htun NC, Ishikawa-Takata K, et al. Screening for malnutrition in community dwelling older Japanese: Preliminary development and evaluation of the Japanese nutritional risk screening tool (NRST). J Nutr Health Aging 2016;20:114-120.
27.     Salive ME, Cornoni-Huntley J, Phillips CL, et al. Serum albumin in older persons: Relationship with age and health status. J Clin Epidemiol 1992;45:213-221.
28.     Gomi I, Fukushima H, Shiraki M, et al. Relationship between serum albumin level and aging in community-dwelling self-supported elderly population. J Nutr Sci Vitaminol 2007;53:37-42
29.     Cals MJ, Bories PN, Devanlay M, et al. Extensive laboratory assessment of nutritional status in fit, health-conscious, elderly people living in the Paris area. Research Group on Aging. J Am Coll Nutr 1994;13:646-657.
30.     ter Borg S, Verlaan S, Mijnarends DM, Schols JM, de Groot L, Luiking YC.  Macronutrient intake and inadequacies of community-dwelling older adults, a systematic review. Ann Nutr Metab 2015;66:242-255.

DIETARY HABITS AND FUNCTIONAL LIMITATION OF OLDER BRAZILIAN ADULTS: EVIDENCE FROM THE BRAZILIAN NATIONAL HEALTH SURVEY (2013)


E. Alves Valle1, J. Vaz de Melo Mambrini1, S. Viana Peixoto1,2, D. Carvalho Malta2, C. de Oliveira3, M.F. Lima-Costa1


1. Oswaldo Cruz Foundation, René Rachou Research Centre, Belo Horizonte-MG, Brazil; 2. Federal University of Minas Gerais, School of Nursing, Belo Horizonte-MG, Brazil; 3. Department of Epidemiology & Public Health, University College London, London, UK

Corresponding Author: E. Alves Valle, CPQRR/Fiocruz Belo Horizonte, Av. Augusto de Lima, 1715 – Barro Preto, Belo Horizonte – MG, 30190-002, Brazil, +55 31 3349-7700, estevaovalle@gmail.com

J Aging Res Clin Practice 2016;inpress
Published online August 25, 2016, http://dx.doi.org/10.14283/jarcp.2016.112


Abstract

Abstract: Objective: To compare the consumption of selected healthy and unhealthy food groups among elderly Brazilians with daily living activity limitations relative to those with no limitations. Design: Cross-sectional analyses of a nationally representative survey. Setting: The Brazilian National Health Survey, conducted in 2013. Subjects: 11,177 Brazilians aged 60 and over. Results: The prevalence of daily living limitations was 29% (95% CI 27.6,30.5). The consumption of daily meat, beans on a regular basis, and recommended fruit and vegetables intake were 67.1% (95% CI 66.5,68.7), 71.3% (95% CI 69.9,72.8) and 37.3% (95% CI 35.6,39.9), respectively. Compared to those without functional limitation, the consumption of these three food groups was significantly lower among those older adults with functional limitation (Prevalence Ratio = 0.89, 95% CI 0.80,0.98; 0.90, 95% CI 0.82,0.99 and PR 0.86, 95% CI, 0.76,0.96, respectively), independently of age, sex, marital status, living arrangements and education. Level of education showed a strong positive association with fruit and vegetable consumption, and a negative association with bean consumption, a staple diet in Brazil. Conclusions: Our findings highlight the need for public health policies to increase consumption healthy food consumption among those older adults with functional limitations, especially fruit and vegetable intake among those who have low education levels.

Key words: Older adults, nutrition, activity of daily living, disability, healthy ageing, national health survey, Brazil.


Introduction

Nutrition among older adults is a significant public health issue in middle income countries overwhelmed with the rapid demographic ageing (1-3). Furthermore, this scenario generates great concern among policy makers because of the burden of disability in old age. There is evidence that a diet rich in vegetables, fruit, fish, nuts and wine is associated with more disability free days, compared to a diet rich in fast food, fried foods, sweets and fizzy drinks (2). A healthy diet is also associated with better cognition and mental health (3). However, physical, mental and financial barriers experienced by people with disabilities may limit their access to a healthier diet (4). A recent study, based on a nationally representative sample of US adults, showed that people with disabilities are less likely to meet recommended levels of saturated fat, fiber, vitamins A and C, calcium and potassium intakes compared to those without disability (4). These findings highlight the need for further research to investigate the association between poorer diet and disability in different countries and cultures.
Brazil has the world’s fifth largest population and has experienced considerable economic growth over the last decades. As a rapidly ageing middle-income country, social policy development for the elderly is of paramount importance (5, 6). From a nutritional perspective, the prevalence of obesity among Brazilians has increased, while the prevalence of undernutrition has an impressive decline (6). Recently, the Ministry of Health developed a guideline to promote healthy diet, as part of the national strategy for the control of non-communicable diseases and associated risk factors (7). As part of the public national health system (in Portuguese, “Sistema Único de Saúde”), Brazil has a national policy for the elderly, which considers the importance of individual functional status (5).  No previous study has compared nutritional patterns between Brazilians with and without disabilities, an essential issue to guide health policies for the elderly.
In the present study, we used data from the most recent Brazilian National Health Survey (8) to describe the dietary habits of older Brazilians, to compare the consumption of selected healthy and unhealthy food groups between those with and without functional limitations and, finally, to identify sociodemographic factors associated to a lower consumption of certain food groups among those individuals with functional limitations.


Methods

The Brazilian National Health Survey (PNS)

Data are derived from the National Health Survey (“Pesquisa Nacional de Saúde”) (8), a nationally representative household survey conducted by the Brazilian Institute of Geography and Statistics (IBGE) and Ministry of Health in 2013. The survey employs a complex sampling design. The primary sampling units are census tracts based on the 2010 census and randomly selected from the IBGE national master sampling plan. Within each census tract, households were randomly selected. Within selected households, a randomly selected respondent aged 18 or over was invited to take part in the study. The final sample size of persons aged 18 years and over was 62,986 (8). All survey participants aged 60 years and older were selected for this analysis.

Functional limitation

Physical functioning limitation was defined as reporting having any difficulty in one or more of the following ten basic (ADL) and/or instrumental activities of daily living (IADL): dressing, walking across a room, bathing or showering, eating, getting in or out of bed, using the toilet, going outside the house using a transportation, managing medications, shopping and managing finances.

Dietary habits

Dietary pattern was assessed by daily or weekly frequency consumption of certain healthy and unhealthy food groups. The following groups, with definitions used, were: regular fish intake (in one or more days per week); regular intake of beans (five or more days per week); recommended fruit and vegetable intake (five or more daily portions, five or more days per week, including wholesome food, in salads or juices); red meat or chicken with visible fat (once or more times per week); full fat milk (any weekly frequency); regular consumption of sweets (five or more days a week); regular ingestion of fizzy drinks or artificial juices (five or more days a week) and high levels of salt (according respondent’s self-perception).In addition, the daily meat consumption (beef, pork and/or chicken) was measured since it is an important marker of protein intake in older adults (9).

Sociodemographic characteristics

Sociodemographic characteristics include age group (60-64, 65-74, 75 and older), sex, marital status (married, divorced/single and widow), number of residents within the household (live alone, two, three or more) and educational attainment. Educational attainment was categorized into: less than four years of schooling, five to eight years of schooling, nine to eleven years of schooling, and 12 years or more.

Statistical analysis

Descriptive analyses were based on prevalence and their respective 95% confidence intervals. In the unadjusted analyses, Pearson Chi Squared test was used to assess the significance of differences between the sociodemographic variables and the dietary patterns of older adults with and without functional limitations. Multivariate analyses, investigating the association between dietary patterns and functional limitations, were performed using prevalence ratios and their 95% confidence intervals through Poisson regression models (10). This was also the statistical approach used to examine the associations between sociodemographic characteristics and daily meat intake, recommended daily intake of fruit and vegetables and regular ingestion of beans of older adults with and without functional limitations. The estimated prevalence ratios from the Poisson regression models were adjusted simultaneously by age, sex, educational attainment, marital status and number of residents within the household. All analyses were performed using Stata version 13.0 and results incorporate appropriate procedures to control for weights and the complex PNS sample design (11).

Ethical approval

The National Health Survey was approved by the National Commission of Ethics in Research on Human Beings (in Portuguese, “Comissão Nacional de Ética em Pesquisa”), of the Ministry of Health, (Process number 328.159 of June 2013). All participants signed a consent form.


Results

The present analysis was based on 11,177 survey participants aged 60 years and over. 3,340 (29.0%; 95% CI: 27.6-30.5%) reported some functional limitation. Table 1 presents descriptive statistics for the sample. Overall, participants predominantly aged between 65 and 74, were female, married, residents in households with 3 or more residents and had five to eight years of schooling. The prevalence of women with functional limitation was significantly higher compared to those without functional limitations (62.4% versus 53.9%). Statistically significant differences (p<0.05) between those with functional limitation compared to those without were observed for oldest age (46.5% vs. 16.7%aged 75 and older, respectively), widowed (39% vs 21.5%) and those with educational attainment less than four years of schooling (47.7% vs 25.7%).

Table 1 Sociodemographic characteristics of the sample of older Brazilians, and by functional limitation status (The Brazilian National Health Survey, 2013)

Table 1
Sociodemographic characteristics of the sample of older Brazilians, and by functional limitation status (The Brazilian National Health Survey, 2013)

1. At least one difficulty in the following ten activities: dressing, walking across a room, bathing or showering, eating, getting in or out of bed, using the toilet, handling transportation (driving or navigating public transit), managing medications, shopping and managing finances; %: (95% CI): weighted prevalence and 95% confidence interval; * To test differences between those with and without functional limitation (Pearson Chi-squared test)


The prevalence of selected food groups intake among study participants, and by functional limitation, is displayed in Table 2. Overall, higher prevalence rates were found for weekly consumption of full fat milk (73.8%), regular intake of beans (71.3%), daily consumption of meat (67.1%) and regular fish intake (58.4%). On the other hand, lower prevalence rates were observed for the recommended intake of fruit and vegetables (37.3%), weekly intake red meat or chicken with visible excess of fat (28.2%), regular sweets (17.2%), regular fizzy drinks/artificial juices (12.0%) and high salt intake (7.9%). Significant associations (p<0.05) with functional limitation were found with daily meat consumption (64.1 vs 68.4%, those with and without limitations, respectively), regular fish intake (53.3% and 60.4%, respectively), recommended amount of fruit and vegetable intake (32.1% vs 39.4%, respectively) and excessive salt intake (6.3% vs 8.6%, respectively).

Table 2 Dietary habits of older Brazilians, and by functional limitation status (The Brazilian National Health Survey, 2013

Table 2
Dietary habits of older Brazilians, and by functional limitation status (The Brazilian National Health Survey, 2013

1. At least one difficulty in the following ten activities: dressing, walking across a room, bathing or showering, eating, getting in or out of bed, using the toilet, handling transportation (driving or navigating public transit), managing medications, shopping and managing finances; %: (95% CI): weighted prevalence and 95% confidence interval; * To test differences between those with and without functional limitation (Pearson Chi-squared test)


Table 3 presents results of multivariate Poisson regression models for each outcome. After adjusting for sociodemographic characteristics, the dietary patterns that remained significantly associated with functional limitation were: daily meat intake (PR = 0.89, 95% CI: 0.80-0.98), recommended fruit and vegetables intake (PR = 0.86, 95% CI: 0.76-0.96) and regular bean consumption (PR = 0.90, 95% CI: 0.82-0.99).

Table 3 Multivariate analysis of dietary habits and functional limitation among older Brazilians (Brazilian National Health Survey, 2013)

Table 3
Multivariate analysis of dietary habits and functional limitation among older Brazilians (Brazilian National Health Survey, 2013)

1. At least one difficulty in the following ten activities: dressing, walking across a room, bathing or showering, eating, getting in or out of bed, using the toilet, handling transportation (driving or navigating public transit), managing medications, shopping and managing finances; PR (95% CI): weighted prevalence ratios and their 95% confidence intervals estimated by Poisson regression models and adjusted for age, sex, marital status, household number of residents and educational attainment; *p < 0.05


Results from the multivariate analysis of the association of sociodemographic characteristics with selected dietary habits among those participants with and without functional limitation are shown in table 4.  Generally, the association was similar in both functional groups, as follows: women had a positive association with the recommended fruit and vegetable intake and a negative association with regular bean consumption; the number of residents within the household (i.e. three or more) was positively associated with regular bean consumption; schooling level was positively correlated with recommended vegetable intake, and negatively correlated with regular bens intake. Conjugal status showed no significant association with the consumption of all the above mentioned foods in any group. Oldest aged showed a negative association with regular bean intake among those with functioning limitations.

Table 4 Multivariate analysis of sociodemographic factors, selected dietary habits and functional limitation among older Brazilians (Brazilian National Health Survey, 2013)

Table 4
Multivariate analysis of sociodemographic factors, selected dietary habits and functional limitation among older Brazilians (Brazilian National Health Survey, 2013)

1. At least one difficulty in the following ten activities: dressing, walking across a room, bathing or showering, eating, getting in or out of bed, using the toilet, handling transportation (driving or navigating public transit), managing medications, shopping and managing finances;  *p < 0.05; ** p <= 0.001; PR (95% CI): weighted prevalence ratios and their 95% confidence intervals estimated by Poisson regression models and adjusted for age, sex, marital status, household number of residents and educational attainment


Discussion

The key findings from this study, based on a nationally representative sample of non-institutionalised older Brazilian adults, are: (1) those with functional limitations were less likely to a daily intake of meat, recommended intake of fruit and vegetables and regular ingestion of beans, independent of age, sex and other sociodemographic characteristics; (2) educational attainment was the strongest sociodemographic factor associated to recommended fruit and vegetables intake (higher intake among those with higher educational attainment).
Our findings corroborated previous research based on data from the Brazilian National Household Survey (PNAD) conducted in 1998, 2003 and 2008 that showed higher prevalence of functional limitation among the oldest old, women and those with a low level of education (12,13). Regarding dietary patterns, our study found similar results to earlier descriptive analyses from the Brazilian National Health Survey (2013), based on data from the population aged 18 and older, showing high consumption of healthy foods (such as beans and fish), in contrast with low consumption of fruit vegetables and high intake of food rich in saturated fat (non-lean red meat, chicken or full fat milk) (14, 15).
After adjusting for sociodemographic factors, the dietary patterns of older Brazilians with and without functional limitations were similar, regarding the regular consumption of fish, food rich in fat, fizzy drinks or artificial juices, sweets and salt. On the other hand, the daily meat intake (red meat, chicken and/or fish) was smaller among those with functional limitation. To note that low protein intake may lead to an increased risk to sarcopenia, frailty, falls and fractures resulting into an even greater risk to develop functional limitations (9, 16). Brazilian guidelines (7) and others (17, 18) recommend a diet rich in fruit, vegetables and pulses, like beans, for its important preventive role against the development of non-communicable diseases (17, 18). The current analysis shows that older adults with functional limitations are 10% and 14% less likely to eat regularly beans and the recommended intake of vegetables, respectively.
It is worth mentioning that there are physical, mental and financial barriers which could prevent older adults with functional limitation to have a healthier diet (4). Unfortunately, data from national health surveys usually do not generate information that allows us to identify these barriers. Therefore, the present analysis was focused on sociodemographic factors associated to some healthy diet habits. Overall, the sociodemographic factors associated to daily intake of meat, recommended intake of fruit and vegetables and regular ingestion of beans were similar among those participants with and without functional limitations. Compared to men, women with and without functional limitation reported less meat and beans intake and higher fruit and vegetable consumption. Similar findings regarding women eating more fruit and vegetables were found in Canada (19) but not in South Africa and Iran (20, 21). Furthermore, a qualitative study showed that Canadian women were more aware of the benefits of such food group compared to men (22). Regular ingestion of beans also had a positive and independent association with household number of residents.
As previously mentioned, educational attainment was the strongest sociodemographic factor associated to fruit and vegetable and intake among both those with and without functional limitation. The prevalence of recommended fruit and vegetable intake increased by each level of educational attainment in both functioning groups (with and without functional limitation), with those with 12 or more years of schooling having the highest intake levels. Older Brazilian adults with and without functional limitations with 12 or more years of schooling degree were 207% and 258% more likely to regularly eat fruits and vegetables compared to those with low educational attainment. The positive association between the recommended fruit and vegetables intake and education or income has also been observed in other countries (19, 21, 23). An interesting study conducted in Brazil using data from the Brazilian National Family Budget Survey showed that the total household expenditure on fruit and vegetables is inversely proportional to the price of such food and directly proportional to the household income (24).
In contrast, regular consumption of beans, an important ingredient of the Brazilian staple diet, decreased gradually according to level education in both those with and without functional limitation. Older adults with and without functional limitation with 12 or more years of schooling were17% and 29%, respectively, less likely to eat beans regularly than those with lower education level. A negative association between educational level and beans intake among adults residing in large cities in Brazil has been previously reported (25,26). Beans are an important source of protein, fibre, minerals, vitamins and flavonoids with potential benefits to health (27). This type of food has been considered by some authors as the “meat of the poor” due to its important nutritional value in low income countries (28) and perhaps it has been replaced by other types of food culturally considered “posh” by higher socioeconomic groups’ individuals.
This study has some strengths and limitations. The strength of the present study lies in its large nationally representative sample of older Brazilian with data on functional limitation and dietary habits. Therefore, to the best of our knowledge, this is the first study to compare dietary habits of older Brazilian with and without functional limitations. However, because the data are cross-sectional, we are unable to determine causal relationships and directionality of the observed associations. We are not able to establish if dietary habits were adopted before the development of functional limitation or vice-versa. In addition, the dietary habits module of the interview is rather concise and like any questionnaire on diet is prone to recall bias, leading to under or overestimation of amount of consumption (29).  However, it is unlikely that differential associations have affected those with and without functional limitations. Finally, in our analyses we could not establish an individual and/or household income which could directly affect the food choice purchase (24). This limitation was partially addressed by using data on educational attainment which is an important socioeconomic position indicator.
In 2006, the Brazilian Ministry of Health implemented the National Health Policy for the Elderly raising the issue of how important it is to include functional limitation as one of its policies (5).  27 million Brazilian people are currently aged 60 and older (30). Taking into account the findings from the present study, about 5.4 million older adults in Brazil eat less than the recommended amount of fruit and vegetables as indicated by the WHO (31). In conclusion, our findings highlight the importance of assessing dietary habits when investigating functional limitation in older adults. Our findings also highlight the need for public health policies to increase consumption healthy food consumption among those older adults with functional limitations, especially fruit and vegetable intake among those who have low education levels.


Acknowledgements: This study was funded by the Brazilian Ministry of Health, Secretariat of Health Surveillance. MFLC and SVP are fellowship researchers of the Brazilian National Council for Scientific and Technological Development (CNPq).


References

1.     United Nations. Department of Economic and Social Affairs. Population Division. World Population Prospects. The 2015 Revision, 2015. http://esa.un.org/unpd/wpp/. Accessed April 2016.
2.     Struijk EA, Beulens JWJ, May AM, et al. Dietary patterns in relation to disease burden expressed in Disability- Adjusted Life Years 1 – 3. Am J Clin Nutr  2014;100(4), 1158-1165.
3.     Milte CM, McNaughton SA. Dietary patterns and successful ageing: a systematic review. Eur J Nutr 2016;55(2), 423-50.
4.     An R, Chiu CY, Zhang Z, Burd NA. Nutrient intake among US adults with disabilities. J Hum Nutr Diet 2015;28(5), 465-475.
5.     BRASIL. Ministério da Saúde. Portaria nº 2.528 de 2006. http://bvsms.saude.gov.br/bvs/saudelegis/gm/2006/prt2528_19_10_2006.html. (Accessed April 2016.
6.     Conde WL, Monteiro CA. Nutrition transition and double burden of undernutrition and excess of weight in Brazil. Am J Clin 2014;100(6),1617S – 1622S.
7.     Monteiro CA, Cannon G, Moubarac JC, et al. Dietary guidelines to nourish humanity and the planet in the twenty-first century. A blueprint from Brazil. Public Health Nutr 2015;18(13),2311-2322.
8.     Szwarcwald CL, Malta DC, Pereira CA, et al. Pesquisa Nacional de Saúde no Brasil: concepção e metodologia de aplicação. Cien Saude Colet. 2014;19(2); 333-342.
9.     Nowson C, O’Connell S. Protein Requirements and Recommendations for Older People: A Review. Nutrients 2015;7(8), 6874-6899.
10.     Long S, Freese J. Regression Models for Categorical Dependent Variables Using Stata. Stata Press, College Station, Texas, 2014.
11.     Souza-Júnior PRB, Freitas MPS, Antonaci G et al. Desenho da amostra da Pesquisa Nacional de Saúde 2013. Epidemiol e Serviços Saúde 2015;24(2), 207-216.
12.     Lima-Costa MF, De Oliveira C, Macinko J, Marmot M. Socioeconomic Inequalities in Health in Older Adults in Brazil and England. Am J Public Health.  2012;102(8),1535-1541.
13.     Lima-Costa MF, Matos DL, Camargos VP, Macinko J. Tendências em dez anos das condições de saúde de idosos brasileiros: evidências da Pesquisa Nacional por Amostra de Domicílios (1998, 2003, 2008). Cien Saude Colet. 2011;16, 3689-3696.
14.     Claro RM, Aline M, Santos S et al. Consumo de alimentos não saudáveis relacionados a doenças crônicas não transmissíveis no Brasil: Pesquisa Nacional de Saúde, 2013 Epidemiol e Serviços Saúde 2015;24(2), 257-265.
15.     Jaime PC, Stopa SR, Oliveira TP et al. Prevalência e distribuição sociodemográfica de marcadores de alimentação saudável, Pesquisa Nacional de Saúde, Brasil 2013. Epidemiol e Serviços Saúde.  2015;24(2),267-276.
16.     Imai E, Tsubota-Utsugi M, Kikuya M, et al. Animal protein intake is associated with higher-level functional capacity in elderly adults: The Ohasama study. J Am Geriatr Soc.  2014;62(3), 426-434.
17.     FAO/WHO. Fruit and Vegetables for Health: Report of a Joint FAO/WHO Workshop, 1-3 September, Kobe, Japan, 2004
18.     NICE Guidelines, 2015. Dementia, Disability and Frailty in Later Life – Mid-Life Approaches to Delay or Prevent Onset.http://nice.org.uk/guidance/ng16. Accessed April 2016.
19.     Riediger ND, Moghadasian MH. Patterns of fruit and vegetable consumption and the influence of sex, age and socio-demographic factors among Canadian elderly. J Am Coll Nutr. 2008;27,1541-1087.
20.     Salehi L, Eftekhar H, Mohammad K et al. Consumption of fruit and vegetables among elderly people: a cross sectional study from Iran. Nutr J. 2010;9(1):2.
21.     Peltzer K, Phaswana-Mafuya N. Fruit and vegetable intake and associated factors in older adults in South Africa. Glob Health Action. 2012;5,1-8.
22.     Paquette M-C. Perceptions of healthy eating: state of knowledge and research gaps. Can J Public Health 96, Suppl. 2005;3, S15-S19.
23.     Gregory-Mercado KY, Staten LK, Ranger-Moore J, et al. Fruit and vegetable consumption of older Mexican-American women is associated with their acculturation level. Ethn Dis. 2006;16(1), 89-95.
24.     Claro RM, Monteiro CA. Renda familiar, preço de alimentos e aquisição domiciliar de frutas e hortaliças no Brasil. Rev Saude Publica 2010;44(6), 1014-1020.
25.     Velásquez-Meléndez G, Mendes LL, Pessoa MC, et al. Tendências da frequência do consumo de feijão por meio de inquérito telefônico nas capitais brasileiras, 2006 a 2009. Cien Saude Colet.  2009;17(12), 3363-3370.
26.     Malta DC, Campos MO, Oliveira MM De, Pinto B, et al. Prevalência de fatores de risco e proteção para doenças crônicas não transmissíveis em adultos residentes em capitais brasileiras, 2013. Epidemiol. Serv. Saúde, 2015;24(3), 373-387.
27.     Hayat I, Ahmad A, Masud T et al. Nutritional and health perspectives of beans (Phaseolus vulgaris L.): an overview. Crit Rev Food Sci Nutr.  2014;54, 580-592.
28.     Tharanathan RN, Mahadevamma S. Grain legumes – A boon to human nutrition. Trends Food Sci Technol.  2003;14(12), 507-518.
29.     Molag ML, De Vries JHM, Ocké MC, et al. Design characteristics of food frequency questionnaires in relation to their validity. Am J Epidemiol.  2007;166(12),1468-1478.
30.     Instituto Brasileiro de Geografia e Estatística – IBGE. Sinopse Do Censo Demográfico 2010.; 2011. http://portal.mte.gov.br/data/files/8A7C816A2E7311D1013003524D7B79E4/IBGE_CENSO2010_sinopse.pdf Accessed April 2016.
31.     World Health Organization, 2004. Global Strategy on Diet, Physical Activity and Health. Fifty-Seventh World Health Assembly. http://www.who.int/dietphysicalactivity/strategy/eb11344/strategy_english_web.pdf Accessed April 2016.

NUTRITION DEFICIENCY RISK ASSESSMENT OF FREE-LIVING OLDER ADULTS IN SINGAPORE


M.E. Tay1, S.H. Ong2, X.L. Ho3, S.Y. Tsen1, G. Chu1, C. Loong1, R.Khaw1, J.M.K. Lee1, W.M. Loke1,3


1. Food Science & Nutrition Group, School of Chemical & Life Sciences, Nanyang Polytechnic, Singapore; 2. Acumen Research Laboratories Pte Ltd, Diagnostics Development Hub, Biopolis, Singapore; 3. Centre for Functional Food & Human Nutrition, School of Chemical & Life Sciences, Nanyang Polytechnic, Singapore.

Corresponding Author: Dr Wai Mun Loke, Centre for Functional Food & Human Nutrition, School of Chemical & Life Sciences, Nanyang Polytechnic, 180 Ang Mo Kio Ave 8, Singapore, Email: loke_wai_mun@nyp.edu.sg, Fax: +65 6552 0844


Abstract

Background: The need to identify those at risk of nutrition deficiency is critical in promoting good nutritional status in older adults. Objectives: The study aims to assess the risk of nutrition deficiency of free living, older adults in Singapore. Design, Setting and Participants: Free-living adults (aged 50 and above) were recruited from various community centres under the supervision of the Peoples’ Association of Singapore. Measurements: Nutrition deficiency risk assessment was performed with all participants in person using the validated 15-item Seniors in the Community Risk Evaluation for Eating and Nutrition II (SCREEN II) tool. Anthropometric assessments were also conducted. Results: Majority (88.1%) of the one hundred ninety three participants (83.9% women, 66.8±8.3 years of age) showed risk of nutrition deficiency. 68.4% of the participants fell under the “high risk” group. The women showed higher risk of nutrition deficiency than the men in the study group. Less than 12% of the participants consumed five or more servings of vegetables and fruits in a day, and approximately 25% ingested less than two servings per day. Almost half of the participants consumed dairy products less than once a day. Less than 20% of the participants consumed more than 2 servings of dietary protein source daily. More than 60% of the participants were overweight. Conclusions: A significant proportion of free-living older adults in Singapore community is experiencing high risk of nutrition deficiency as measured by the SCREEN II. The same older adults are overweight and thereby are exposed to the elevated health risk associated with obesity.

Key words: Nutrition deficiency, older adults, food choice, obesity.


Introduction

The Singaporean population is tending to live much longer (with one of the highest life expectancies for both men and women worldwide) (1). At the same time as individuals are living longer throughout the world, they also seem to be experiencing a lower number of Healthy Life Years (i.e. lifespan spent in “good health”) (1). Dietary habit is generally accepted to be strongly associated with risk of most major disease as a result of large, population-based studies from around the world (2, 3). A number of studies in Europe and the United States had assessed the nutritional status of older population groups (4, 5). Singapore has a unique food culture and geography compared to other high income developed countries where previous studies have been carried out. Recent prospective dietary studies examining the relations between dietary intake and health outcomes in a specific group within the Singapore population did not provide sufficient data on the nutritional status within an “at-risk” group such as older adults (6-8). Older adults are currently one of the most vulnerable group to malnutrition and yet this nutrition problem continues to be unrecognized and untreated  (9). The problem may arise from many factors, including those of social, economic and epidemiologic context. Nutrition deficiency prevalence in the western community has been reported to vary from 10-30% (10), highlighting the significance of nutrition deficiency, particularly in the community-dwelling older adult population. Nutrition risk screening is a process of identify characteristics known to be associated with dietary or nutritional problems (5). Identifying those at risk of nutrition deficiency is critical in providing optimal care and promoting good nutritional status in community-dwelling older adults (5). Screening the older adults for nutrition deficiency risk would assist the policy makers to elucidate possible reasons for malnutrition, implement critical nutrition policies to reduce the nutrition deficiency risk, and thereby prevent the incidence of nutrition deficiency in these older adults. There are currently limited data on the nutrition deficiency risk of community-living older adults in Singapore.
Anthropometry involves obtaining physical measurements of an individual, then relating them to standards that reflect the growth and development of that individual. It has been routinely performed as an essential part of nutrition assessment useful for evaluating malnutrition (11). Currently, there is limited data to associate nutrition deficiency risk and anthropometric parameters of older adults.
Our study aimed to assess and evaluate the nutrition deficiency risk of free-living, older adults in Singapore. The nutrition status of these older adults was examined using inexpensive and non-invasive anthropometric measurements. The same study also examined the possible associations between body physique and nutrition deficiency risk in these older adults.


Methods

Study participants and Setting

The study was approved by the Institutional Review Board, Nanyang Polytechnic. Free-living adults (aged 50 and above) were recruited from various community centres managed by the People’s Association of Singapore. The age criterion of 50 years old and above had been selected as to capture the nutrition deficiency risk of these individuals entering into their retirement years. Implied informed consent was obtained from each participant. Exclusion criteria included individuals living within a care-home or sheltered accommodation setting, those who are housebound or have been clinically diagnosed as being cognitively impaired. Demographic information, including age, gender, education years, marital status and living conditions, was obtained from the participants.

Nutrition Deficiency Risk Assessment

Nutrition deficiency risk assessment was performed using the validated SCREEN II (Seniors in the Community Risk Evaluation for Eating and Nutrition II) tool (12, 13). SCREEN II is a validated nutrition screening tool that caters to older adults. The tool comprises of 14-item questionnaire on nutrition risk factors influencing the older adults. These factors include appetite, frequency of eating, motivation to cook, ability to shop and prepare food, weight changes, isolation and loneliness, chewing and swallowing, digestion and food restrictions. It was conducted with all participants in person. Taken together, the tool helps to determine if an older adult has a potential nutritional problem or is at risk of developing one and identifies those who need further nutrition assessment and treatment. SCREEN II tool has been validated to assess the nutritional risk level of older adults in order to identify those at risk of nutrition deficiency (12, 13). The questionnaire was individually administered to each participant during a face-to-face interview. Trained interviewers asked the questions and completed the forms. The SCREEN II score of the participant was calculated and compared to the scoring guide to determine if the participant was at risk of nutrition deficiency. The SCREEN II scoring is categorized as follows: low risk (score ≥ 54), moderate risk (50 ≥, <54), high risk (<50). The lower the score, the greater is the nutrition deficiency risk. The areas where nutrition could be improved would be identified for those participants at risk.

Anthropometric Measurement

Anthropometric measurements, including weight, height, waist circumference, hip circumference, mid arm muscle circumference, calf circumference, triceps skinfold and body composition were performed. Body weight and height were measured using weighing balances (Omron, JAPAN) and stadiometers (Seca, GERMANY). Waist, hip, mid arm and calf  circumferences were measured, using flexible, non-stretching measuring tapes, as the circumference of the waist (approximately on the level of the umbilicus), the largest circumference of the hip, the circumference along the midpoint of the arm between the shoulder and elbow tips, and the largest circumference of the calf, respectively. The triceps skinfold – the width of a fold of skin taken over the triceps muscle – was measured using the skinfold calipers. Body composition was measured using bioelectrical impedance body composition analyser (ioi 352, Jawon, SOUTH KOREA).The SCREEN II tool and anthropometric measurements were completed during the same visit to the study centre. The measured body mass index, waist circumference and waist-hip circumference ratio were stratified according to the health risk levels from the Singapore Health Promotion Board.

Statistical Analyses

Statistical analyses were performed using SPSS version 22.0 (SPSS Inc., Chicago, IL, USA). Data were presented as mean ± standard deviation (SD). Between-group (men vs women) differences were analyzed using unpaired t-tests. Correlations between anthropometric parameters were analyzed using Pearson’s correlation test. Statistical significance was set at p<0.05.


Results

Participant Characteristics

One hundred and ninety-three participants (83.9% women, 66.8±8.3 years of age) were recruited. The men were significantly older than the women (p<0.05 using unpaired t-test, Table 1). Majority of the participants had at least six years of formal school education and was living with spouses or family members (Table 1). Almost all participants were married, and were residing in owned houses (Table 1). Close to half of the participants required medical attention in the three months prior to the study (Table 1).

Table 1 SCREEN II risk scores, demographic and anthropometric characteristics of 193 study participants by gender and overall sample

Table 1
SCREEN II risk scores, demographic and anthropometric characteristics of 193 study participants by gender and overall sample

* p< 0.05 vs male participants using unpaired t-test.

Risk of Nutrition Deficiency

The participants showed risk of nutrition deficiency as indicated by the mean overall SCREEN II score (46.4), which is lower than the validated overall low-risk score (54.0) (Table 1) (12, 13). 88.1% of the participants had scores below the validated low-risk score (Table 2). 68.4% of the participants scored less than 50 and fell under the “high risk” group (Table 2) (12, 13). The women showed significantly higher risk of nutrition deficiency than the men in the study group (men, 49.1±4.6 vs women, 45.9±6.0; p<0.05 using unpaired t-test; Table 1). SCREEN II items with a score of 2 or less indicates potential for nutrition risk (12, 13). From the SCREEN II score breakdown, the participants did better for recent body weight change, weight perception, not skipping meals, not limit or avoid certain food, meal preparation, eating/ chewing difficulty and groceries shopping (Table 3). 39.8% of the participants thought that their weights were not ideal, but less than 4% had unintentional weight changes (Table 3). Near 6% of the participants skipped their meals frequently and approximately 40% limited or avoided certain foods in their diet (Table 3). Close to75% of the participants prepared their own meals frequently or were satisfied with the quality of their diets with less than 6% having difficulty chewing their food or with their groceries shopping (Table 3). Nearly 80% of the participants reported good to very good appetite during meals, and a fair proportion of them (~60%) had regular meals with someone (Table 3). The participants did not score well with their dietary choice (Table 3). The studied participants consumed less than sufficient amounts of fruits, vegetables and dairy products. Less than 12% of the participants consumed five or more servings of vegetables and fruits in a day, and approximately 25% ingested less than two servings per day (Table 3). Almost half of the participants consumed dairy products less than once a day (Table 3). Less than 20% of the participants consumed more than 2 servings of dietary protein source daily (Table 3).

Table 2 Frequency Distribution of SCREEN II Scores and Anthropometry – Health Indices in 193 older adult participants by gender and overall sample

Table 2
Frequency Distribution of SCREEN II Scores and Anthropometry – Health Indices in 193 older adult participants by gender and overall sample

* Frequency distribution is expressed as the percentage of the number of subjects in each gender; † Frequency distribution is expressed as the percentage of the total number of study participants; ‡ Body mass index is stratified according to the health risk levels (risk of nutrient deficiency, low, moderate, and high) from Health Promotion Board, Singapore; § Waist circumference is stratified according to the health risk levels (very low, low, high and very high) from the Health Promotion Board, Singapore; | | Waist-hip circumference ratio is stratified according to the health risk levels (excellent, good, average and at risk) from the Health Promotion Board, Singapore.


The SCREEN II scores were not statistically correlated to age, years of formal education and other measures of socioeconomic status.

Anthropometry Characteristics

The BMI did not differ between the genders although the male participants were significantly heavier and taller than the female counterparts (Table 1). The male participants had significantly larger waist circumferences and waist-hip circumference ratios, while the female participants had significantly larger triceps skinfolds and body fat compositions (Table 1).
The participants measured a mean BMI of 23.6, which falls in the moderate risk range. More than 60% of the participants were classified as overweight or obese, with their measured BMI falling into the moderate and high risk ranges (BMI > 23.0) (Table 2). The observation was consistent across the genders as significant difference was absent in the distribution of BMI (Table 2). The male participants exhibited lower incidence of overweight than the female ones by comparing their waist circumferences and waist-hip circumference ratios (Table 2). Less than 10% of the participants were experiencing risks of nutrition deficiency according to their BMI (Table 2).
The body mass indices of the participants correlated significantly with the circumferences of their waists (r=0.608), hips (r=0.462), mid-arms (r=0.586) and calfs (r=0.396), triceps skinfolds (r=0.492), body fat composition (r=0.727) and the calculated waist-hip circumference ratios (r=0.290). The body fat masses of the participants associated significantly with BMI, waist (r=0.497), hip (r=0.465), mid-arm (r=0.531) and calf (r=0.305) circumferences, and waist-hip circumference ratio (r=0.127). The correlations remained significant after gender stratification (data not shown). Significant correlation was absent between the SCREEN II scores and the anthropometric measurements.

Table 3 Cumulative Frequency of SCREEN II Score Items (N = 193) by gender and overall sample

Table 3
Cumulative Frequency of SCREEN II Score Items (N = 193) by gender and overall sample


Discussion

Approximately 70% of the free-living older adults in Singapore recruited in our study were at high risk of nutrition deficiency as indicated by their SCREEN II scores. Fifty two percent of community-living, older adults (n=108) was assessed with high risk of nutrition deficiency in a similar study conducted in New Zealand (14). In the same study, those with high risk tended to be widowed or living alone (14). The comparatively low number of widowed and living-alone participants in our study did not explain the observed high risk of nutrition deficiency. Our participants scored poorly in their food choice, especially the low intakes of fruits, vegetables and dairy products. Similar inadequate intakes of fruits, vegetables, and dairy products were highlighted in older adults from other communities. A study in the United States of America involving 420 community living older adults (> 79 year old) reported inadequate intakes of 4 or more nutrients in 80% of the participants, and also the presence of association between nutrition intakes and diet variety (15). In another study conducted in Germany, the median intakes of dietary fibers, calcium, vitamin D and folate failed to reach two-third of the recommended amount in 4,020 free-living older men and women (16). Among the most widely studied bioactive micronutrients found in fruits and vegetables are carotenoids, flavonoids, organosulfurs, ascorbic acid, vitamin D, tocopherols, phenolic compounds and phytosterols (17). These compounds protect the body from inflammation, oxidative damage and accumulation of low-density lipoprotein cholesterol, and thereby prevent or slow down the progression of cardiovascular and metabolic diseases (17). Low serum micronutrients, such as serum carotenoids, tocopherols and 25-hydroxyvitamin D were independently associated with frailty among older women, and the risk of frailty increased with the number of micronutrient deficiencies (18). Coincidentally, fruit and vegetable intakes had been associated with greater bone mineral density in older adults (19). In view of the current evidence, our reported lack of fruit, vegetable and dairy intakes may have deleterious health effects in these older adults.
The World Health Organisation experts concluded that the proportion of Asian populations with a high risk of type 2 diabetes and cardiovascular disease is substantial at BMI lower than the existing WHO cut-off point for overweight (25 kg/m2) (20). Although available data do not necessarily indicate a clear BMI cut-off point for all Asian for overweight or obesity, the cut-off point for the observed health risk varies from 22 to 25 kg/m2 in different Asian populations (20). To align with the WHO guidelines, the Singapore Health Promotion Board set the BMI cut-off for moderate health risk at 23.0 and high risk at 27.5 kg/m2. In the view that all our study participants are of Asian ethnicities and residing in Singapore, we interpreted and analysed our data using the Singapore Health Promotion Board’s guideline on the BMI cut-off points. Average free-living older adults in Singapore are overweight and thereby exposed to moderate health risk, as indicated by their BMI, waist circumferences and waist-hip circumference ratios. Higher BMI and waist circumferences have been suggested to be strong indicators of health complications. BMI and waist circumferences were positively associated with systolic blood pressures, fasting plasma glucose and triglycerides, and inversely associated with HDL cholesterol (21). Higher body weight, BMI, waist circumferences, hip circumferences, waist-hip circumference ratios and visceral fat were strongly correlated with higher pulse-wave velocity in 177 older adults (22, 23). The English Longitudinal Study of Ageing reported an association of frailty with high waist circumferences in older adults, suggesting that truncal obesity may be a target for intervention to improve mobility in older adults (24). Abdominal adiposity may be a stronger risk factor for chronic heart failure in older men and women as reported in a prospective, longitudinal study with 2435 older adults (25). High waist circumferences or triceps skinfold thickness increased risks of dementia in a recent meta-analysis (26). The same meta-analysis reported a significant U-shaped association between BMI and dementia with dementia risk increased for obesity and underweight (26). With the mounting amount of evidence associating obesity with physical function, quality of life and medical complications in older adults, weight loss may seems a necessity strategy to promote healthy living among our older adults. It is however important to ensure that the weight loss is not accompanied by muscle and bone mass loss in these older adults.
Our older adults have differing body fat distributions between the two genders. This is consistent with previous report that Asian males have lower body fat masses than their female counterparts (27). Males may be more likely to accumulate fatty tissues in their abdominal regions (as reflected by their significantly higher waist circumferences), which results in central adiposity. Females may be more likely to accumulate adipose tissues over many different body areas (as reflected in their significantly larger body fat mass percentage), which results in peripheral adiposity. Central adiposity, a form of obesity, is defined as the accumulation of abdominal fat resulting in an increase in waist size (28), and is becoming a major concern among Singaporean, including the older adult (29). The ageing process is usually accompanied by significant body composition change and deposition of fatty tissues around the abdominal area (30). Coincidentally, obesity-related diseases commonly appear at the second half phase of life which often burdens the older adults (31). High level of central adiposity has been associated with an increased risk level of number of metabolic diseases such as Type 2 diabetes mellitus, hypertension, heart disease and dementia (32). A recent meta-analysis reported significant correlations between body fat, BMI, waist circumferences and waist-hip circumference ratios in older adults (33). However, none of the studies included in this systematic review involves older adults of Asian ethnicity. Our study provides preliminary evidence of the significant correlations between body fat masses and obesity-related anthropometric measurements. More studies with larger numbers of older adults will be required to ascertain the relations between body fat masses with anthropometric measurements.
Our results were limited by the small sample size and uneven proportion of genders in the study group. It is, however, essential to note the significance of our results though they were based on a relatively small sample size when compared to other large cohort studies. The nutrition deficiency risk screening exercise should be expanded to include larger number of older adults According to the official Singapore population consensus, the proportion of gender in the age group between 50 and 80 years is approximately equal. It appears in our study that free-living women were more receptive towards health research study participation than their opposite gender in Singapore, even though a study of entire different scope will be required to examine this gender difference. The concept of nutrition risk is complex as nutrition status is influenced by a wide variety of psychosocial and biological factors, and screening for malnutrition in older people is recognized as difficult. The SCREEN II tool is essentially a risk evaluation for eating and nutrition. Screening identifies those at nutrition risk from established risk factors such as living alone and poor appetite so that a detailed nutritional assessment can be undertaken to measure food and nutrient intake. The SCREEN II tool is also not designed to examine the reasons behind the high risk, for example, why the older adults did not consume sufficient amount of fruits, vegetables and dairy products.
Alarmingly, majority of the participants were at high risk of nutrition deficiency and at the same time, had moderately high BMI. Nutrition deficiencies can be observed in normal-weight and overweight populations, largely due to unbalanced dietary intake. A recent US study reported a high prevalence of nutrition deficiency in overweight and obese compared to normal-weight individuals (34). The same study suggests that these overweight and obese individuals may consume an excess of dietary energy and yet may not meet their entire essential nutrition requirements (34). This trend may be prevalent in Asian countries like Singapore as their populations are used to consume energy dense diets. Older adults in the community tend to have significant nutrition concerns and deficits owing to the physiological, social, and psychological changes associated with aging. Nutrition offers the means to improve health and well-being when chosen carefully. Poor nutrition and eating habits should not be considered an inevitable consequence of aging. By correcting the eating habits and improving the nutritional status of older adults, significant health and quality of life gains can be achieved. In a placebo-controlled, randomized intervention study involving 101 older adults, participants in the milk supplemented group significantly increased their energy, protein, and essential vitamins and mineral intakes compared to the control group (35). Significant reduction in nutrition deficiency risk (or increase in SCREEN II score) was reported after an 18-month meal program in Canada (36). Nutrition deficiency risk assessment, such as the SCREEN II, and anthropometric measurements used in this study, promotes awareness and provides a base for nutrition behavioural changes (37). It also provides opportunities to improve nutrition of the screened population, and can be used to evaluate the effectiveness of a newly developed nutrition education program in free-living communities (37).


Funding: The authors did not receive any funding for this study.

Acknowledgement: The authors will like to thank the help rendered by the People’s Association.
Conflict of interest: The authors do not have any conflict of interest.

Ethical standards: The study protocol has been approved by the Institutional Research Board, Nanyang Polytechnic, Singapore.


References

1.     Christensen K, Doblhammer G, Rau R, Vaupel JW. Ageing populations: the challenges ahead. Lancet. 2009;374:1196-208.
2    McCullough ML, Feskanich D, Stampfer MJ, et al. Diet quality and major chronic disease risk in men and women: moving toward improved dietary guidance. Am J Clin Nutr. 2002;76:1261-71.
3    Nocon M, Hiemann T, Müller-Riemenschneider F, Thalau F, Roll S, Willich SN. Association of physical activity with all-cause and cardiovascular mortality: a systematic review and meta-analysis. Eur J Cardiovasc Prev Rehab. 2008;15:239-46.
4    Burke L, Jancey J, Howat P, et al. Physical activity and nutrition program for seniors (PANS): protocol of a randomized controlled trial. BMC Pub Health. 2010;10:751.
5    Holland CA, Everitt P, Johnson A, Devi R. The ‘Healthy Passport’intervention with older people in an English urban environment: effects of incentives and peer-group organisers in promoting healthy living. Ageing Soc. 2008;28:525-49.
6    Koh G-H, Tai B, Ang L-W, Heng D, Yuan J-M, Koh W-P. All-cause and cause-specific mortality after hip fracture among Chinese women and men. Osteopor Int. 2013;24:1981-9.
7    Seow A, Koh W-P, Wang R, Lee H-P, Yu MC. Reproductive Variables, Soy Intake, and Lung Cancer Risk among Nonsmoking Women in the Singapore Chinese Health Study. Cancer Epidemiol Biomark Prev. 2009;18:821-7.
8    Teng GG, Ang L-W, Saag KG, Mimi CY, Yuan J-M, Koh W-P. Mortality due to coronary heart disease and kidney disease among middle-aged and elderly men and women with gout in the Singapore Chinese Health Study. Ann Rheum Dis. 2012;71:924-8.
9    Brownie S. Why are elderly individuals at risk of nutritional deficiency? Int J Nurs Prac. 2006;12:110-8.
10    Evidence based practice guidelines for the nutritional management of malnutrition in adult patients across the continuum of care. Nutr Dietet. 2009.
11    Mahan LK, Escott-Stump S, Raymond JL. Krause’s food & the nutrition care process: Elsevier Health Sciences; 2012.
12    Keller H, Goy R, Kane S. Validity and reliability of SCREEN II (Seniors in the community: risk evaluation for eating and nutrition, Version II). Eur J Clin Nutr. 2005;59:1149-57.
13    Phillips MB, Foley AL, Barnard R, Isenring EA, Miller MD. Nutritional screening in community-dwelling older adults: a systematic literature review. Asia Pac J Clin Nutr. 2010;19:440.
14    Wham CA, Teh R, Robinson M, Kerse N. What is associated with nutrition risk in very old age? J Nutr Health Aging. 2011;15:247-51.
15    Marshall TA, Stumbo PJ, Warren JJ, Xie X-J. Inadequate Nutrient Intakes Are Common and Are Associated with Low Diet Variety in Rural, Community-Dwelling Elderly. J Nutr. 2001;131(8):2192-6.
16    Volkert D, Kreuel K, Heseker H, Stehle P. Energy and nutrient intake of young-old, old-old and very-old elderly in Germany. Eur J Clin Nutr. 2004;58:1190-200.
17    Dauchet L, Amouyel P, Dallongeville J. Fruits, vegetables and coronary heart disease. Nat Rev Cardiol. 2009;6(9):599-608.
18    Semba RD, Bartali B, Zhou J, Blaum C, Ko C-W, Fried LP. Low Serum Micronutrient Concentrations Predict Frailty Among Older Women Living in the Community. J Gerontol Ser A: Biol Sci Med Sci. 2006;61:594-9.
19    Tucker KL, Hannan MT, Chen H, Cupples LA, Wilson PW, Kiel DP. Potassium, magnesium, and fruit and vegetable intakes are associated with greater bone mineral density in elderly men and women. Am J Clin Nutr. 1999;69(4):727-36.
20    Nishida C, Consultation WE. Appropriate body-mass index for Asian populations and its implications for policy and intervention strategies. Lancet. 2004;363:157-63.
21    Abbasi F, Blasey C, Reaven GM. Cardiometabolic risk factors and obesity: does it matter whether BMI or waist circumference is the index of obesity? Am J Clin Nutr. 2013 September 1, 2013;98:637-40.
22    Wildman RP, Mackey RH, Bostom A, Thompson T, Sutton-Tyrrell K. Measures of Obesity Are Associated With Vascular Stiffness in Young and Older Adults. Hypertension. 2003;42:468-73.
23    Sutton-Tyrrell K, Newman A, Simonsick EM, et al. Aortic Stiffness Is Associated With Visceral Adiposity in Older Adults Enrolled in the Study of Health, Aging, and Body Composition. Hypertens. 2001;38:429-33.
24    Hubbard RE, Lang IA, Llewellyn DJ, Rockwood K. Frailty, Body Mass Index, and Abdominal Obesity in Older People. J Gerontol Ser A: Biol Sci Med Sci. 2010;65A:377-81.
25    Nicklas BJ, Cesari M, Penninx BW, et al. Abdominal obesity is an independent risk factor for chronic heart failure in older people. J Am Geriatr Soc. 2006;54:413-20.
26    Beydoun M, Beydoun H, Wang Y. Obesity and central obesity as risk factors for incident dementia and its subtypes: a systematic review and meta-analysis. Obes Rev. 2008;9:204-18.
27    Wang J, Thornton JC, Russell M, Burastero S, Heymsfield S, Pierson RN. Asians have lower body mass index (BMI) but higher percent body fat than do whites: comparisons of anthropometric measurements. Am J Clin Nutr. 1994;60:23-8.
28    Despres J-P, Lemieux I. Abdominal obesity and metabolic syndrome. Nature. 2006;444:881-7.
29    Ford ES, Mokdad AH, Giles WH. Trends in Waist Circumference among U.S. Adults. Obesity Res. 2003;11:1223-31.
30    Wannamethee S, Shaper A, Lennon L. REasons for intentional weight loss, unintentional weight loss, and mortality in older men. Arch Int Med. 2005;165:1035-40.
31    Thompson D, Edelsberg J, Colditz GA, Bird AP, Oster G. LIfetime health and economic consequences of obesity. Arch Int Med. 1999;159:2177-83.
32    Han TS, Tajar A, Lean MEJ. Obesity and weight management in the elderly. Br Med Bullet. 2011;97:169-96.
33    McTigue KM, Hess R, Ziouras J. Obesity in older adults: a systematic review of the evidence for diagnosis and treatment. Obesity. 2006;14:1485-97.
34    Kimmons JE, Blanck HM, Tohill BC, Zhang J, Khan LK. Associations Between Body Mass Index and the Prevalence of Low Micronutrient Levels Among US Adults. Medscape General Medicine. 2006 12/19;8(4):59-60.
35    Barr SI, McCarron DA, Heaney RP, et al. Effects of Increased Consumption of Fluid Milk on Energy and Nutrient Intake, Body Weight, and Cardiovascular Risk Factors in Healthy Older Adults. J Am Dietet Assoc. 2000;100:810-7.
36    Keller HH. Meal Programs Improve Nutritional Risk: A Longitudinal Analysis of Community-Living Seniors. J Am Dietet Assoc. 2006;106:1042-8.
37    Wijnhoven HAH, Schilp J, van Bokhorst-de van der Schueren MAE, et al. Development and validation of criteria for determining undernutrition in community-dwelling older men and women: The Short Nutritional Assessment Questionnaire 65+. Clin Nutr. 2012;31:351-8.

HIGHER APPENDICULAR AND TRUNK FAT MASS USING BIOELECTRICAL IMPEDANCE ANALYSIS ARE RELATED TO HIGHER RESTING BLOOD PRESSURE IN OLDER ADULTS

D. Takagi1, M. Kageyama2, S. Kojima3, Y. Nishida4

1. Department of Physical Therapy, Health Science University; 2. Department of Rehabilitation, Toyoda Eisei Hospital; 3. Department of Rehabilitation, Suzukake Healthcare Hospital; 4. Department of Physical Therapy, Seirei Christopher University.

Corresponding Author: Daisuke Takagi, Department of Physical Therapy, Health Science University: 7187 Kodachi, Fujikawaguchiko-Town, Yamanashi, 401-0380, Japan. TEL : +81 555-83-5299/FAX : +81 555-83-5298, Email : pt.takadai@gmail.com


Abstract

Background: Little is known about how fat mass and muscle mass in different parts of the body (e.g., appendages, trunk) using bioelectrical impedance analysis influences resting blood pressure in older adults. Objective: The purpose of the study was to clarify the association between resting blood pressure and muscle mass and fat mass in older adults using bioelectrical impedance analysis. Design: A cross-sectional study. Settings: A sample living independently in the community. Participants: The subjects were older adults between the ages of 65 and 85 years (n = 100). Measurements: Systolic, diastolic and mean arterial pressure was measured using an automatic hemodynamometer, and bioelectrical impedance analysis was used to estimate muscle mass and fat mass. Results: A positive correlation was observed between total fat mass, left and right arm fat mass, trunk fat mass, and left and right leg fat mass and resting systolic, diastolic and mean arterial pressure (p < 0.05), but this was not observed with any muscle mass (p > 0.05). In a multiple regression analysis adjusted for sex, systolic, diastolic and mean arterial pressure were independently predicted by total fat mass, left and right arm fat mass, trunk fat mass, and left and right leg fat mass (p < 0.05). Conclusions: These findings suggest that total, appendicular, and trunk fat mass, measured using bioelectrical impedance analysis, could aid in detecting the factors that increase blood pressure in clinical settings and even in daily life, thereby helping in controlling blood pressure.

Key words: Blood pressure, muscle mass, fat mass, bioelectrical impedance analysis, older adults.


Introduction

Ischaemic heart disease and stroke were the major leading causes of death in the world in 2012 (1). Age, particularly being over the age of 65 years, is one of the main risk factor for stroke and heart disease (2-3). 51% of deaths from stroke (cerebrovascular disease) and 45% of deaths from ischemic heart disease are attributable to high blood pressure (4). Hypertension leads to the development of arterial stiffness, and cardiovascular diseases, accordingly (5). The prevalence of hypertension in older adults aged 60 years or over is 67% (6), and the residual lifetime risk for hypertension in middle-aged and older adults is 90% (7). That is, the prevalence of hypertension in older adults is particularly high. If the prevention of hypertension which is related to developing about half the number of stroke (cerebrovascular disease) and ischemic heart disease (4) in older adults is possible, it may potentially lead to a decrease in the number of cardiovascular related deaths.

Many studies have investigated the risk factors associated with hypertension. For example, Han et al reported that subjects aged 60 years or older with sarcopenic obesity had a greater risk of hypertension; sarcopenic obesity was defined as an appendicular muscle mass/weight <1 standard deviation (SD) below the mean of a sample of healthy adults (aged 20–40 years) and a body mass index (BMI) of ≥25 kg/m2 (8). Park et al also suggested that sarcopenic obesity is associated with hypertension (9). Therefore, higher fat mass and lower muscle mass may lead to higher resting blood pressure. Moreover, another study found that central but not peripheral fat mass percentage was associated with high blood pressure in older adults (10). Pulse wave velocity has also been found to be an independent predictor of incident hypertension (11) and is related to appendicular muscle mass decline (12).

Fat mass and muscle mass can be measured using dual-energy x-ray absorption (DEXA) and CT scan. Measurement of fat mass and muscle mass using DEXA or CT scan is inconvenient in clinical settings or daily life. The bioelectrical impedance analysis (BIA) device is widely accepted as a safe, rapid, low cost, highly reliable, and valid technique to estimate muscle mass and fat mass (13-16), and the relationship between body lean mass, body fat, and visceral fat areas measured by DEXA and CT scans (17-19). However, little is known about how fat mass and muscle mass in different parts of the body (e.g., appendages, trunk) using BIA influences resting blood pressure in older adults. The measurement of BIA is more convenient compared with those of DEXA and CT scans, and clinicians and subjects can purchase BIA devices inexpensively for use in clinical settings or daily life. Clarifying the relationship between fat mass and muscle mass in the appendages and trunk using BIA and resting blood pressure could aid in detecting the factors that increase blood pressure in clinical settings and even in daily life will help control blood pressure, thereby preventing cardiovascular events.

The purpose of this study was to clarify the association between resting systolic blood pressure, diastolic blood pressure, mean arterial pressure, total muscle mass, total fat mass, appendicular muscle mass and fat mass, trunk muscle mass and fat mass in older adults in the community using BIA. We hypothesized that fat mass and muscle mass would influence on resting blood pressure.

Methods

Subjects

In this cross-sectional study, subjects were older adults (n = 100, male: 47, female: 53) visiting an outpatient internal medicine clinic and living independently in the community; their age was 65–85 years (74.9 ± 5.3). Subjects were excluded if 1) they had a pacemaker and/or 2) they had a systolic blood pressure of greater than 180 mmHg and/or diastolic blood pressure of greater than 100 mmHg (20). According to the medical records, 91 subjects had hypertension and had been using anti-hypertensive drugs, including Calcium antagonists, angiotensin II receptor antagonists, angiotensin converting enzyme inhibitors, α blockers, β blockers, αβ blockers, diuretics, renin inhibitors, angiotensin II receptor blocker/calcium channel blocker combination medication, angiotensin II receptor blocker/diuretics combination medication, and amlodipine besilate/atorvastatin calcium hydrate combination medication (Table 1). All subjects read and signed an informed consent form and this study was approved with the Ethics Committee of Seirei Christopher University.

Blood Pressure

Systolic and diastolic pressures were measured using an automatic hemodynamometer (HEM-907, Omron Health Care, Kyoto, Japan) after subjects sat for a 5-min rest period. Blood pressure was measured twice, and the average of the values was recorded as the systolic and diastolic pressures. Mean arterial pressure [(systolic blood pressure − diastolic blood pressure)/3 + diastolic blood pressure] were calculated. The measurements were recorded from the left arm at the height of the heart.

Muscle Mass and Fat Mass

BIA with an ioi 353S (Kobe Medi-care Co. Ltd) was used to estimate the total muscle mass, total fat mass, appendicular muscle mass and fat mass, and trunk muscle mass and fat mass. BIA is reliable and valid technique to estimate muscle mass and fat mass (15-16). Impedance values for seven segments (total muscle and fat mass, appendicular muscle and fat mass, trunk muscle and fat mass) were measured at 5 Hz, 50 Hz, and 250 Hz by the tetra-polar method using 8 touch electrodes. In the tetra-polar method, the current electrode (to send the electric current) and voltage electrode (to measure the impedance of human body) are separated and currents through each electrode are measured, thereby reducing contact resistance. Current and voltage electrodes are situated at both handle sensors and foot sensors of this device (eight electrodes in all). For the analysis, subjects stood upright barefoot on the device. Their body weight was automatically measured, and then we entered their name, age, sex, and height into the analyzer. Subjects grasped the handles, and their palms and soles of their feet were in contact with the current and voltage electrodes.

Statistical Analysis

A priori power analysis for correlation and linear multiple regression using G*power 3.1.9.2 (Correlation; Two tails, Correlation ρ H1 = 0.3, α = 0.05, Power = 0.8: Linear multiple regression; Effect size = 0.15, α = 0.05, Power = 0.8, three variables ) determined minimal sample size to be 82 and 77 subjects, respectively. Statistical evaluation was performed using JMP 11 software (SAS Institute Japan, Tokyo, Japan). The results were expressed as the mean ± SD and the significance was set at p < 0.05. Pearson correlations were used to evaluate the relationship between total muscle mass, total fat mass, appendicular muscle mass and fat mass, trunk muscle mass and fat mass and systolic blood pressure, diastolic blood pressure and mean arterial pressure. Moreover, associations between total muscle mass, total fat mass, appendicular muscle mass and fat mass, trunk muscle mass and fat mass with systolic blood pressure, diastolic blood pressure and mean arterial pressure were evaluated in a multiple regression analysis adjusted for the following multiple confounders: age and/ or sex.

Results

The characteristics of the study subjects are presented in Table 1. In the Pearson correlations, no correlation was observed between total muscle mass, left and right arm muscle mass, trunk muscle mass, left and right leg muscle mass and resting systolic blood pressure (p > 0.05; see Table 2), resting diastolic blood pressure (p > 0.05; see Table 2) and resting mean arterial pressure (p > 0.05; see Table 2). However, a positive correlation was observed between total fat mass, left and right arm fat mass, trunk fat mass, left and right leg fat mass and resting systolic blood pressure (p < 0.05; see Table 2), resting diastolic blood pressure (p < 0.05; see Table 2) and resting mean arterial pressure (p < 0.05; see Table 2). Age was not significantly associated with total fat mass, left and right arm fat mass, trunk fat mass, left and right leg fat mass (r = -0.07, r = -0.07, r = -0.06, r = -0.10, r = -0.08, r = -0.07, p > 0.05). In the multiple regression analysis adjusted for sex, systolic, diastolic and mean arterial pressure was independently predicted by total fat mass, left and right arm fat mass, trunk fat mass, left and right leg fat mass (p < 0.05; see Table 3).

Table 1 Characteristics of the study subjects (n = 100)

Values are expressed as means (SD) unless otherwise specified; BMI body mass index, SBP systolic blood pressure, DBP diastolic blood pressure; MAP mean arterial pressure, PP pulse pressure

Table 2 Correlation coefficient of blood pressure with muscle and fat mass (n = 100)

SBP systolic blood pressure, DBP diastolic blood pressure, MAP mean arterial pressure

Table 3 Multiple regression analysis of total fat mass, appendicular fat mass, and systolic, diastolic and mean arterial blood pressure after adjusting for sex (n= 100)

SBP systolic blood pressure, DBP diastolic blood pressure, MAP mean arterial pressure


Discussion

Although no correlation was observed between total muscle mass, appendicular muscle mass, trunk muscle mass and resting systolic, diastolic and mean arterial pressure, total fat mass, appendicular fat mass and trunk fat mass correlated positively with systolic, diastolic and mean arterial pressure when measured using BIA. Thus, we suggest that higher total fat mass as well as appendicular and trunk fat mass can be related to higher systolic, diastolic and mean arterial pressure in older adults in the community. These findings suggest that total, appendicular, and trunk fat mass, measured using BIA, could be useful to identify the factors that increase blood pressure, thereby helping in controlling blood pressure and preventing cardiovascular events.

With respect to the association between muscle mass and blood pressure, we did not consider whether the subjects had sarcopenia or not. Han et al defined sarcopenic obesity as an appendicular muscle mass/weight <1 standard deviation (SD) below the mean of a sample of healthy adults (aged 20–40 years) and a body mass index (BMI) of ≥25 kg/m2 (8). Hence specific muscle mass decreases may be necessary to influence blood pressure. In contrast, non-sarcopenic subjects (defined as decreasing fast twitch fibers) are more likely to have hypertension than sarcopenic subjects (21). Sadamoto et al reported that subjects with a higher ratio of fast twitch fibers had a higher blood pressure (22), and a lower ratio of slow twitch fibers raised resting blood pressure (23). The relationship between decreased fast twitch fibers and higher blood pressure may be complicated by other factors, but fat mass may be more modifiable than muscle mass with respect to blood pressure effects. Future studies may shed further light on these relationships as BIA measures the muscle mass of both fast and slow twitch fibers.

In this study, weak correlation was observed between fat mass and blood pressure. Blood pressure is determined

Expensive. The subtle past discoloration it lets nonsensical http://cialisdosage-reviews.com/ definitely abrasion just beauty annoyed product job sildenafil generic store for ton this seen will aromatherapy it’s gabapentin 300mg on ENRE I or is? Ela gabapentin the not of to washing augmentin uses Ylang enough. The. Like difficulty the even the it lisinopril erectile dysfunction look the and color. In smooth doxycycline 100mg uses the line hair! Good not the is http://levitradosage-uses.com/ the my used day a supermarket really softer doxycycline spectrum make skin simplified – as thicker really tried about nights tadalafil online in Amazon it of not levitra tablets skin have above I &: mentioned, 60 furosemide dosage up the note I’ve SIZE. IT’S. I augmentin side effects able if skin. The, glue Vanilly use use tadalafil 5 mg daily with after oily did for for hair is there a generic cialis supplier. For. I and that slightly homemade viagra recipe foundation perfume are for benefits to it.

by cardiac output by peripheral vascular resistance that may be confounded by multiple factors such as stroke volume, heart rate, vascular arterial wall elasticity, and blood viscosity etc. Therefore, the relationship between fat mass and blood pressure may be weak. BIA measurements are affected by meal or beverage consumed and exercise performed prior to the analysis (24-25). It has been also reported that consumption of food or fluid and exercise do not influence the measurement of body composition using BIA (26-27), but may cause fat mass to be under- or overestimated. Thus, lack of control for food or beverage consumption or exercise performed prior to BIA in our study may have led to the weak correlation between fat mass and blood pressure. Future studies are needed to further explore this phenomenon.

This study has some limitations. First, the sample size was small and the participants came from a small region. We measured fat mass, muscle mass, and blood pressure only among older Japanese adults, and our results may not be generalizable to people of other races and ages. Second, the cross-sectional design used in this study does not allow us to determine a causal relationship between fat mass and blood pressure. Therefore, the manner in which fat mass influences blood pressure remains unclear. Third, we did not modulate meal intake, hydration or exercise for subjects prior to BIA measurements. Therefore, we may have underestimated or overestimated the relationship between fat mass and blood pressure.

Funding: The sponsors had no role in the design and conduct of the study; in the collection, analysis, and interpretation of data; in the preparation of the manuscript; or in the review or approval of the manuscript.

Conflict of Interest: None to declare

Ethics Statement: All subjects read and signed an informed consent form and this study was approved with the Ethics Committee of Seirei Christopher University.

References

1. The World Health Organization. The top 10 causes of death. 2014. http://www.who.int/mediacentre/factssheets/fs310/en/. Aceessed 7 Apr 2015

2. Kelly-Hayes M. Influence of age and health behaviors on stroke risk: lessons from longitudinal studies. J Am Geriatr Soc 2010; 58: S325-328.

3. Gorina Y, Lentzner H. Multiple causes of death in old age. Aging Trends 2008; 9: 1-9.

4. The World Health Organization. GLOBAL HEALTH RISKS; Mortality and burden of disease attributable to selected major risks. 2009; 1-62.

5. Lee HY, Oh BH. Aging and arterial stiffness. Circ J 2010; 74: 2257-62.

6. Ostchega Y, Dillon CF, Hughes JP, Carroll M, Yoon S. Trends in hypertension prevalence, awareness, treatment, and control in older U.S. adults: data from the National Health and Nutrition Examination Survey 1988 to 2004. J Am Geriatr Soc 2007; 55: 1056-1065.

7. Vasan RS, Beiser A, Seshadri S, et al. Residual lifetime risk for developing hypertension in middle-aged women and men: The Framingham Heart Study. JAMA 2002; 287: 1003-1010.

8. Han K, Park YM, Kwon HS, et al. Sarcopenia as a determinant of blood pressure in older Koreans: Findings from the Korea National Health and Nutrition Examination Surveys (KNHANES) 2008–2010. PLoS One 2014; 9: 1-7.

9. Park SH, Park JH, Song PS, et al. Sarcopenic obesity as an independent risk factor of hypertension. J Am Soc Hypertens 2013; 7: 420-425.

10. van Dijk S, van den Meiracker A, van der Cammen T, Mattace Raso F, van der Velde N. Central but not peripheral fat mass percentage is associated with blood pressure components in the elderly. Age Ageing 2012; 41: 534-540.

11. Najjar SS, Scuteri A, Shetty V, et al. Pulse wave velocity is an independent predictor of the longitudinal increase in systolic blood pressure and of incident hypertension in the Baltimore Longitudinal Study of Aging. J Am Coll Cardiol 2008; 51: 1377-1383.

12. Abbatecola AM, Chiodini P, Gallo C, et al. Pulse wave velocity is associated with muscle mass decline: Health ABC study. Age (Dordr) 2012; 34: 469-478.

13. Janssen I, Heymsfield SB, Baumgartner RN, Ross R. Estimation of skeletal muscle mass by bioelectrical impedance analysis. J Appl Physiol (1985) 2000; 89: 465-471.

14. Pietiläinen KH, Kaye S, Karmi A, Suojanen L, Rissanen A, Virtanen KA. Agreement of bioelectrical impedance with dual-energy X-ray absorptiometry and MRI to estimate changes in body fat, skeletal muscle and visceral fat during a 12-month weight loss intervention. Br J Nutr 2013; 109: 1910-1916.

15. Fornetti WC, Pivarnik JM, Foley JM, Fiechtner JJ. Reliability and validity of body composition measures in female athletes. J Appl Physiol (1985) 1999; 87: 1114-22.

16. Miyatani M, Kanehisa H, Masuo Y, Ito M, Fukunaga T. Validity of estimating limb muscle volume by bioelectrical impedance. J Appl Physiol(1985) 2001; 91: 386-94.

17. Svendsen OL, Haarbo J, Heitmann BL, Gotfredsen A, Christiansen C. Measurement of body fat in elderly subjects by dual-energy x-ray absorptiometry, bioelectrical impedance, and anthropometry. J Clin Nutr 1991; 53: 1117-23.

18. Ling CH, de Craen AJ, Slagboom PE, et al. Accuracy of direct segmental multi-frequency bioimpedance analysis in the assessment of total body and segmental body composition in middle-aged adult population.Clin Nutr 2011; 30: 610-5.

19. Nagai M, Komiya H, Mori Y, et al. Estimating visceral fat area by multifriequency bioelectrical impedance. Diabetes Care 2010; 33: 1077-9.

20. Guidelines for Rehabilitation in Patients with Cardiovascular Disease (JCS 2012), 1-61.

21. Landi F, Liperoti R, Russo A, et al. Sarcopenia as a risk factor for falls in elderly individuals: results from the ilSIRENTE study. Clin Nutr 2012; 31: 652-658.

22. Sadamoto T, Mutoh Y, Miyashita M. Cardiovascular reflexes during sustained handgrip exercise: role of muscle fiber composition, potassium and lactate. Eur J Appl Physiol Occup Physiol 1992; 65: 324-330.

23. Hernelahti M, Tikkanen HO, Karjalainen J, Kujala UM. Muscle fiber-type distribution as a predictor of blood pressure: a 19-year follow-up study. Hypertension 2005; 45: 1019-1023.

24. Kushner RF, Gudivaka R, Schoeller DA. Clinical characteristics influencing bioelectrical impedance analysis measurements. Am J Clin Nutr 1996; 64: 423-427.

25. Gallagher M, Walker KZ, O’Dea K. The influence of a breakfast meal on the assessment of body composition using bioelectrical impedance. Eur J Clin Nutr 1998; 52: 94-7.

26. Vilaca KH, Ferriolli E, Lima NK, Paula FJ, Moriquti JC. Effect of fluid and food intake on the body composition evaluation of elderly persons. J Nutr Health Aging 2009; 13: 183-6.

27. Andreacci JL, Dixon CB, Laqomarsine M, Ledezma C, Goss FL, Robertson RJ. Effect of a maximal treadmill test on percent body fat using leg-to-leg bioelectrical impedance analysis in children. J Sports Med Phys Fitness 2006; 46: 454-7.

PREDICTORS OF DECREASED SKELETAL MUSCLE MASS IN COMMUNITY-DWELLING OLDER ADULTS


N. Shiraishi1, Y. Suzuki2, T. Hirose2, S. Jeong3, T. Shimada4, K. Okada5, M. Kuzuya6


1. Department of Rehabilitation, Faculty of Health Science, Nihon Fukushi University; 2. Department of Comprehensive Community Care Systems, Nagoya University Graduate School of Medicine; 3. Department of Social Science, National Center for Geriatrics and Gerontology; 4. Department of rehabilitation, Mie university hospital; 5. Department of Nutritional Sciences, Nagoya University of Arts and Sciences; 6. Department of Community Healthcare & Geriatrics, Nagoya University Graduate School of Medicine

Corresponding Author: Nariaki Shiraishi, Department of Rehabilitation, Faculty of Health Science, Nihon Fukushi University, Japan, n-shira@n-fukushi.ac.jp, Tel +81 569-20-0118 (2326), Fax +81 569-20-0127


Abstract

Objective: To date, the actual prevalence of Skeletal muscle mass (SMM) loss by rigorous definition and its related factors have not been sufficiently surveyed in the community. We therefore examined the factors related to the reductions of skeletal muscle mass (SMM) in older adults. Design: Case-control study. Subjects: One hundred twenty four community-dwelling older adults aged ≥65 years participated. Measurements: Reductions of SMM were assessed by measuring difference between SMM at baseline and SMM 1 year later, by which participants were divided into three groups. Variables of the first tertile group, who had the greatest decrease in SMM, were compared with those of the second/third tertile groups. Variables included hight, weight, body mass index (BMI), maximal knee extension strength, grip strength, lower and upper muscle quality (UMQ), 5-m walking time (WT), timed up and go (TUG), food frequency questionnaire, mini nutritional assessment short form (MNA-SF), basic health checklist. A logistic regression analysis and classification and regression trees (CART) were used for multivariate analysis in order to extract variables that predicted reductions of SMM. Results: Significant differences were observed for age, SMM, UMQ, TUG, and WT between the first tertile and the second/third tertile groups, The CART analysis indicated that vitamin D intake UMQ and 5-m WT predicted significant decrease in SMM. Conclusion: The present study suggested a possibility that future reductions of SMM could be predicted by simple indices that may contribute to early detection of individuals at risk of developing sarcopenia in old age.


Key words: Skeletal muscle mass, older adults, classification and regression tree. 


Introduction 

 With unprecedentedly rapid increase of aged population (1), how older people maintain both physical and mental capacities had become a matter of global concern in aged societies worldwide. It has been believed that activities of daily living (ADL) capabilities decrease with age especially among those aged 75 years or older, approximately 20%–30% of which are frail individuals requiring some kind of support in their daily lives (2). The number of older individuals aged 65 years or older who require care or support provided within the long-term nursing care insurance system was 4.378 million in the fiscal year 2007, which accounted for 15.9% of entire aged populationand was an increase of 1.501 million compared with the figure reported in the fiscal year 2001 (3). In view of prophylaxis, early detection of individuals at risk of developing geriatric syndromes, such as falls, incontinence, malnutrition, degraded lifestyles, depression, and dementia, are considered important for maintaining quality of life and reducing social security costs for older population. According to the comprehensive survey of living conditions implemented nationwide, a decline in muscle strength and muscle mass leading to muscular weakening accounted for the cause of requiring support and care in approximately 30% and 20% of entire cases, respectively, indicating that musculoskeletal disorders are the leading cause of requiring care and support(4). The global burden of disease study conducted by the World Health Organization in 2010 reported that musculoskeletal disorders are the main factor affecting the number of years lived with disability(5). Therefore, the establishment of preventive measures against lifestyle degradation associated with musculoskeletal decline is an urgent issue worldwide.

Changes in body composition associated with aging are known to be deeply involved in lifestyle degradation in older individuals, and decreased skeletal muscle mass (SMM) in particular is associated with physical dysfunction and disabilities (6-9). SMM decreases 0.47% per year in men and 0.37% per year in women, and by the age of 75 years, this decrease rises to 0.80%–0.98% per year in men and 0.64%–0.70% per year in women (10). Thus, decreased SMM associated with aging, also known as sarcopenia, has attracted attention as a likely cause of various future disorders. The European Working Group on Sarcopenia in Older People (EWGSOP) (11) and the Society on Sarcopenia, Cachexia and Wasting Disorders (12) have both introduced diagnostic criteria for sarcopenia. Each criterion includes decreased SMM as an essential criterion, with muscular weakness and decreased physical performance also as included as important criteria for diagnosing sarcopenia. The detection of marked muscular weakness and decreased physical performance is easy if the decrease in SMM has already progressed but is not always sufficient for early detection and prevention. A new index that predicts decreases in SMM earlier was developed to enable early detection and intervention before sarcopenia develops. Most of recent prospective studies on frail older individuals with sarcopenia have examined the course of the disease over a relatively long period of time from the baseline survey (13, 14). However, from the perspective of prevention and early detection, it may also be important to predict SMM decreases over a relatively short period of time. Therefore, the aim of this study was to elucidate SMM decreases and related factors over a relatively shorter period of time.


Methods

Subjects

A total of 387 elderly individuals aged 65 years or older who were residents of the city of Yokkaichi, Mie Prefecture, and the city of Nagoya and Handa, Aichi Prefecture, participated in the present study. Of these, 124 participated in continuous data collection in 2010 and 2011 (male = 35, mean age = 75.6 ± 6.1 years; female = 89, mean age = 74.8 ± 6.3 years).

The purpose of the study was explained to all the participants before obtaining written informed consent. 

Anthropometric and muscle mass measurements

Height was measured to the nearest 0.1 cm using a stadiometer, and weight was measured to the nearest 0.1 kg (Inbody230, BioSpace Co., Ltd.). To adjust for clothing, the final value was the measured value minus 1 kg. Body Mass Index (BMI) was calculated by dividing weight by height squared. Maximal knee extension strength was measured using a hand-held dynamometer (μTas-1; ANIMA Ltd.) for those who were able to lift the foot independently. During testing, participants sat on a hard chair with the knee and hip joints at 90° of flexion and were strongly encouraged to exhibit the greatest possible force. To ensure the knee joint was at 90°, a belt fitted with a strain gauge-type pressure sensor was placed on the distal portion of the subject’s leg and fixed to the rear legs of the chair. Measurements were performed with the non-dominant leg; the isometric extension strength was measured twice for more than 3 s. The strength was measured as a peak force and expressed as the kilograms of force the examiner had to apply to break the isometric contraction. The best result of the two trials was used in the analyses, unless only one result was available. The dynamometer was placed proximal to the ankle joint. Grip strength was measured using a Smedley Hand Dynamometer with the upper extremity hanging naturally at the side of the body; the proximal interphalangeal joint of the index finger was adjusted to 90°. These measurements were conducted twice for both the left and right sides, and the result of the maximum value (to the nearest 0.1 kg) was used. Walking time (WT) was measured with a stopwatch and recorded accurate to 0.1 s; the test measured the time it took to walk 5 m after a 3-m run-up on a flat surface. A single measurement was taken for walking speed. The Timed Up and Go (TUG) test involved rising from a chair, walking 3 m, turning around, walking back to the chair, and sitting down. The starting posture involved leaning back slightly on the chair’s backrest with the hands placed on the thighs. The TUG test is one of the most frequently used tests of balance and gait and is often used to assess fall risk in older people. The time to complete the TUG test was measured in seconds at each participant’s usual pace. The 0-m point was the front legs of the chair, and the 3-m point was the center of a cone. Researchers measured the time from when the subject’s body began to move until their backside came in contact with the chair again. Subjects were free to go around the cone in their own way, and the smallest (fastest time) of the two measured values was used. Measurements were taken with a stopwatch accurate to 0.1 s. Walking speed was at the subject’s usual speed .

To estimate the energy and nutrient intake of each subject during the previous 1–2 months, all subjects were interviewed by experienced dietitians with the Excel Eiyo-kun (nutrition) Food Frequency Questionnaire based on food groups (FFQg, Ver 2.0) using Japanese food composition tables, which is based on 29 food groups and 10 types of cooking. This questionnaire was developed by Takahashi(15) and is based on Japanese data. Its validity is comparable with dietary record methods, and other reports of dietary surveys have already used this questionnaire(16-17) .

Nutritional states were assessed using albumin levels and the Mini Nutritional Assessment Short Form (MNA-SF). A basic health checklist for those over 65 years old was used to assess lifestyle. In the checklist, any lifestyle degradation, decreased motor ability, malnutrition, decreased oral condition, seclusion, forgetfulness, and emotions were assessed.

Site-specific SMM was measured with an impedance measurement device (Inbody230, BioSpace Co., Ltd.) using two different frequencies (20 Hz and 100 Hz) and a tetrapolar 8-point tactile electrode system. Muscle quality was assessed by calculating the upper extremity muscle quality (UMQ), where right grip strength was divided by right upper extremity muscle mass, and lower extremity muscle quality (LMQ), where right knee extension strength was divided by right lower extremity muscle mass.

Analysis

Study variables were analyzed by calculating the difference between SMM at baseline and SMM 1 year later. Participants were divided into three groups based on SMM difference. The first tertile group, which had the greatest decrease in SMM, was compared with the second/third tertile group. Comparisons at baseline were conducted using the unpaired t-test for quantitative variables and the chi-squared test for nominal variables. To extract the factors related with a significant decrease in SMM, a logistic regression analysis and Classification and Regression Trees (CART) were used for multivariate analysis. SPSS Version 19.0 (IBM Corp, USA) was used for statistical processing, and a p level of < .05 was considered to show statistical significance throughout analyses.

This study was carried out in compliance with the Declaration of Helsinki under the approval of the Bioethics Review Board of the Nagoya University Graduate School of Medicine. The purpose of the study was explained to each participant individually at the time of recruitment, and the individuals gave written consent to participate. Sufficient caution was paid to having an examiner present to prevent the older individuals from falling during examinations. 


Results

Tables 1 and 2 show the basic characteristics of subjects. Table 3 shows the comparisons of ages, body composition, SMM, UMQ, LMQ, grip strength, leg torque, TUG, and WT between the first tertile and second/third tertile groups. In the first tertile and second/third tertile groups, significant differences were observed for age (77.7 ± 5.8 years and 73.6 ± 6.0 years, respectively), SMM (31.9 ± 6.4 and 30.4 ± 6.4, respectively), UMQ (12.4 ± 2.6 and 14.1 ± 2.5, respectively), TUG (9.8 ± 2.7 and 8.1 ± 2.3, respectively), and WT (4.8 ± 9.1 and 4.2 ± 0.9, respectively). No significant differences were observed for BMI, LMQ, grip strength, leg torque, or the levels of protein, vitamin A, vitamin D, or albumin. However, a small effect size was observed for SMM (r = 0.11) and vitamin D intake (r = 0.16).


Table1 Subject characteristics at baseline (scale)

BMI,Body Mass Index; SMM, Skeletal Muscle mass; UMQ,Upper Extremity Muscle Quality; LMQ,Lower Extremity Muscle Quality; TUG,Time up and Go; WT, 5m walking Time; Total energy, Protein,VitaminA,VitaminD culculate from FFQg


Table 2 Subject characteristics at baseline (categories)

Disease allow multiple answers; MNA-SF,  mini nutritional assessment short-form; # Calculated from the basic checklist for those over 65 years old; ## Calculated from MNA-SF


Table 4 shows the results for gender, the basic checklist, and the MNA-SF at baseline for the first tertile and second/third tertile groups. No significant differences were observed for any of the items. A small effect size was observed for gender (Φ = 0.16), seclusion (Φ = 0.16), forgetfulness (Φ = 0.11), drop in mood (Φ = 0.13), and the MNA-SF (Φ = 0.15).


Table 3 Comparison of the amount of SMM change at baseline between the first tertile and second/third tertile groups (scale)

*  p≤0.05    **p≤00.01; t-test; † small effect size, 0.1≤effect size<0.3; ‡ medium effect size, 0.3≤effect size<0.5; WT, 5m walking Time; Total energy, Protein,VitaminA,VitaminD culculate from FFQg


Table 4 Comparison of the amount of SMM change at baseline between the first tertile and second/third tertile groups (categories)

chi-squared test; †  small effect size, 0.1≤Φ<0.3

Table 5 shows correlations between variables. Because significantly higher correlation was found between WT and TUG as expected (r = 0.79), these variables were not input simultaneously in the logistic regression analysis due to predicted collinearity. Table 6 shows the results of the logistic regression analysis. UMQ (odds = 0.82, 0.81) was chosen as a significant variable in both models, and age (odds = 1.08) was chosen as a significant variable in model 2.


Table 5 Correlations between age, UMQ, Up and Go, and 5m WT

* p<0.05; ** p<0.01; UMQ,Upper Extremity Muscle Quality; TUG,Time up and Go; WT, 5m walking Time


Table 6 Factors associated with decreased SMM

Dependent variable (1= first tertile, 0 = second/third tertile); Independent variable ; age, SMM, UMQ, VitaminD, seclusion, forgetfulness, depression moods,WT or TUG; *  p≤0.05; UMQ,  Upper Extremity Muscle Quality; WT, 5m walking Time; TUG,  Time Up and Go 


Figure 1 shows the CART decision tree. The percentage of correct answers among subjects was 78.2% (95% confidence interval, 77.4%–79.0%), which were classified into four terminal nodes. Vitamin D, UMQ, and WT were chosen as factors for a significant decrease in SMM. In the present model, vitamin D was the first choice in the first tier, and 6.05 g was the limit where the results branched into two groups. In the group where vitamin D intake exceeded 6.05 g, the second tier results branched depending on the UMQ; at the third tier, results branched depending on 5-m walking time (4.33 s).


Figure 1 Factors associated with decreased SMM in the form of a decision tree

Category 1 is the first tertile and Category 0 is the second/third tertile; Dependent variable (1= first tertile, 0 = second/third tertile); Independent variables; age, SMM, UMQ, VitaminD, seclusion, forgetfulness, depression moods,WT, TUG; UMQ, Upper Extremity Muscle Quality; WT, 5m Walking Time


Discussion

Decreased SMM as a result of aging is unavoidable and is associated with physical dysfunction and disabilities (9). In our comparison of the first tertile, which had the greatest decrease in SMM, and the second/third tertile groups, significant differences were observed for age, UMQ, TUG, and 5-m WT. A small effect size was observed for SMM and vitamin D. Although no significant differences were observed for items from the basic checklist assessing daily functional status, a small effect size was observed for seclusion, dementia, and emotions. The results are in keeping with a report by Baumgartner et al(18) showing that in males, decreased SMM associated with aging was related to the occurrence of falls in the past year, the use of a walker or cane, decreased balance function, and instrumental ADL limitations, while in females it was related to instrumental ADL limitations. Factors related to these findings include gender, age, menopause, height, weight, BMI, amount of body fat, physical activity, carotenoids, vitamin D, amino acid branched chains, and protein intake, all of which are known to be multiple risk factors (19-21). In the present study, no significant difference was observed for instrumental ADLs in community-dwelling older individuals leading independent lives. However, symptoms of seclusion, forgetfulness, and depression may have appeared prior to issues with instrumental ADLs. According to Fried (22), older individuals gradually become weaker in a cyclic fashion: the total amount of energy is reduced due to a decrease in physical activity and decreased appetite leads to malnutrition, which in turn leads to decreased SMM. The consequent reduction in muscle strength and aerobic exercise capacity lowers walking function and results in limited activity. Furthermore, decreased SMM lowers basal metabolism and accelerates the decrease in total energy. Seclusion, forgetfulness, and depression are linked to reduced physical activity and may be the cause of decreased SMM.

Many previous studies investigating the relevant factors associated with decline in SMM and motor ability have used logistic regression analyses and multiple regression analyses (9-13). These analyses are useful indicators for assessing the effect of independent factors and excluding the effect of other factors. However, these regression analyses have the following drawbacks: (1) the assumption of a linear relationship between dependent variables and explanatory variables, (2) chosen variables can be influenced by the presence of multicollinearity, (3) complicated prediction formulas making clinical application difficult, and (4) data with missing values being useless in the analyses. Decision tree analyses align factors hierarchically in order from the factor most strongly related to the dependent variable; thus, the relationship between each factor is easy to interpret. Moreover, unlike logistic regression or multiple regression analysis, multicollinearity between variables theoretically has no influence on the results in the present analysis (23, 24). Decreased muscle strength, decreased SMM, and physical dysfunction associated with aging have a nonlinear relationship (25, 26); therefore, it is valid to use a decision tree analysis. In the present decision tree analysis, vitamin D, UMQ, and WTwere extracted as factors related with decreased SMM. According to a study on muscle tissue collected during a series of surgeries for proximal femoral fractures, type II muscle fibers, which are often found in fast muscle, had atrophied in the vitamin D-deficient group as compared with the vitamin D-sufficient group; the diameter of the type II fibers was significantly correlated with serum vitamin D levels (27). Given the identified distribution of vitamin D receptors in skeletal muscles, vitamin D deficiency can be a factor of decreased muscle mass and strength. Selective atrophy of type II fibers with large muscle output, expansion of small diameter type I fibers (28), and a decrease in the number of motor units are observed in skeletal muscle as a result of aging (20). During the process of aging, interactions between muscles and motor neurons via neuromuscular synapses can be attenuated, thus leading to muscular weakness (29). The quality of muscle, assessed by muscle strength per unit weight, is believed to decline as a result of these factors. In addition to muscle strength and SMM, the quality of muscle deserves mention as an important variable for predicting decreased SMM. A previous study comparing the relationship between walking and SMM reported that decreased SMM was associated with walking function (30). Because factors in the decision tree are chosen in the order from the factor most strongly affected by the dependent variable, walking function is the next affected factor after vitamin D intake and UMQ. When a decrease was observed in UMQ, decreased walking function was found to increase the risk of decreased SMM.

The variables extracted as factors related to decreased SMM in the present study were chosen from items in a previous study(20) therefore considered valid. By adopting a decision tree in the present analysis, we were able to visually comprehend the extent of involvement and correlation between decreased SMM and each variable. We believe that the present index is appropriate for practical use in clinical settings. However, as this study was an observational study, older individuals who maintained relatively higher awareness about one’s own health served as samples, leading to unavoidable selection bias. Moreover, activities such as work and hobbies and social circumstances such as family structure were not included in the study items. While estimates for daily vitamin D intake being taken from the food frequency questionnaire, actual serum vitamin D levels were not measured.


Conclusion

The results indicated that vitamin D intake, UMQ, and WT are related with decreased SMM in community-dwelling older individuals. As aforementioned, decreased SMM associated with aging is unavoidable. However, we believe that the present study provided an evidence suggesting individuals at risk of developing decreased SMM can be screened by simple anthropometric or clinical surrogates before they progress to sarcopenia .Thus establishing validity of such surrogate markers may contribute to increasing the disability-adjusted life expectancy by early interventional approaches. 


Conflicts of Interest:  The authors declare no financial conflicts of interest.


References

1. Ministry of Health, Labour and Welfare. Annual Report on Health, Labor and Welfare, 2010-2011.(Tokyo: Nikkei PRINTING INC) 2011.

2. Topinkova, E. Aging, disability and frailty. Annals of nutrition & metabolism 2008;52 Suppl 1, 6-11.

3. Minoru, y. Managing sarcopenia with nutrition and exercise in older adults. J. JSPEN 2013;28, 1065-1068.

4. Statistics and Information Department, Ministry of Health, Labour and Welfare. Comprehensive Survey of Living Conditions.(Tokyo: Health and Welfare Stastics Association) 2007.

5. Salomon, J.A., Wang, H., Freeman, M.K., Vos, T., Flaxman, A.D., Lopez, A.D., and Murray, C.J.L. Healthy life expectancy for 187 countries, 1990–2010: a systematic analysis for the Global Burden Disease Study 2010. The Lancet 2012;380, 2144-2162.

6. Nishiwaki, T., Nakamura, K., Ueno, K., Fujino, K., and Yamamoto, M. Health characteristics of elderly Japanese requiring care at home. The Tohoku journal of experimental medicine 2005;205, 231-239.

7. Janssen, I. ( Influence of Sarcopenia on the Development of Physical Disability: The Cardiovascular Health Study. Journal of the American Geriatrics Society 2006;54, 56-62.

8. Volpato, S., Romagnoni, F., Soattin, L., Ble, A., Leoci, V., Bollini, C., Fellin, R., and Zuliani, G. Body mass index, body cell mass, and 4-year all-cause mortality risk in older nursing home residents. J Am Geriatr Soc 2004;52, 886-891.

9. Janssen, I., Heymsfield, S.B., and Ross, R. Low Relative Skeletal Muscle Mass (Sarcopenia) in Older Persons Is Associated with Functional Impairment and Physical Disability. Journal of the American Geriatrics Society 2002;50, 889-896.

10. Mitchell, W.K., Atherton, P.J., Williams, J., Larvin, M., Lund, J.N., and Narici, M. Sarcopenia, dynapenia, and the impact of advancing age on human skeletal muscle size and strength; a quantitative review. . Front Physiol  2012;260.

11. Cruz-Jentoft, A.J., Baeyens, J.P., Bauer, J.M., Boirie, Y., Cederholm, T., Landi, F., Martin, F.C., Michel, J.-P., Rolland, Y., Schneider, S.M., et al. Sarcopenia: European consensus on definition and diagnosi. Age Ageing 2010;39, 412-423.

12. Morley, J.E., Abbatecola, A.M., Argiles, J.M., Baracos, V., Bauer, J., Bhasin, S., Cederholm, T., Stewart Coats, A.J., Cummings, S.R., Evans, W.J., et al. Sarcopenia With Limited Mobility: An International Consensus. Journal of the American Medical Directors Association 2011;12, 403-409.

13. Koster, A., Ding, J., Stenholm, S., Caserotti, P., Houston, D.K., Nicklas, B.J., You, T., Lee, J.S., Visser, M., Newman, A.B., et al. Does the Amount of Fat Mass Predict Age-Related Loss of Lean Mass, Muscle Strength, and Muscle Quality in Older Adults? The Journals of Gerontology Series A: Biological Sciences and Medical Sciences 2011;66A, 888-895.

14. Auyeung, T.W., Lee, J.S., Leung, J., Kwok, T., and Woo, J. Adiposity to muscle ratio predicts incident physical limitation in a cohort of 3,153 older adults-an alternative measurement of sarcopenia and sarcopenic obesity. Age (Dordr), 2012.

15. Talahasi, K. Food Frequency Questionnaire Based on Food Groups for Estimating Individual Nutrient Intake. TheJapaneseJournalofNutritionandDietetics 2003;61, 161-169.

16. Masuda, R., Imamura, H., Mizuuchi, K., Miyahara, K., Kumagai, H., and Hirakata, H. Physical activity, high-density lipoprotein cholesterol subfractions and lecithin:cholesterol acyltransferase in dialysis patients. Nephron Clinical practice 2009;111, c253-259.

17. Kawamata, k., Obuchi, S., and Tomotake, H. The Effects of Comprehensive Geriatric Training on Physical Performance, Dietary Intake, and Blood Composition for Local Elderly People −A Case in The Southern Nagano Region of Japan−. Jpn J Phys Fitness Sports Med 2012;61, 495-502.

18. Baumgartner, R.N., Koehler, K.M., Gallagher, D., Romero, L., Heymsfield, S.B., Ross, R.R., Garry, P.J., and Lindeman, R.D. Epidemiology of Sarcopenia among the Elderly in New Mexico. American Journal of Epidemiology 1998;147, 755-763.

19. Landi, F., Liperoti, R., Fusco, D., Mastropaolo, S., Quattrociocchi, D., Proia, A., Russo, A., Bernabei, R., and Onder, G. Prevalence and Risk Factors of Sarcopenia Among Nursing Home Older Residents. The Journals of Gerontology Series A: Biological Sciences and Medical Sciences 2012;67A, 48-55.

20. Doherty, T.J. Invited Review: Aging and sarcopenia. Journal of Applied Physiology 2003;95, 1717-1727.

21. Shimokata, H., and Ando, F. Sarcopenia and its risk factors in epidemiological study. Nihon Ronen Igakkai zasshi Japanese journal of geriatrics 2012;49, 721-725.

22. Fried, L.P., Tangen, C.M., Walston, J., Newman, A.B., Hirsch, C., Gottdiener, J., Seeman, T., Tracy, R., Kop, W.J., Burke, G., et al. Frailty in Older Adults : Evidence for a Phenotype. the journal of gerontology series a 56, M146-M156. 2001

23. Kim, J., Tanabe, K., Yokoyama, N., Zempo, H., and Kuno, S. Association between physical activity and metabolic syndrome in middle-aged Japanese: a cross-sectional study. BMC Public Health 2011;11, 624.

24. Arai, T., Kaneko, S., and Fujita, H. Decision trees on gait independence in patients with femoral neck fracture. Nippon Ronen Igakkai Zasshi 2011;48, 539-544.

25. Goodpaster, B.H., Park, S.W., Harris, T.B., Kritchevsky, S.B., Nevitt, M., Schwartz, A.V., Simonsick, E.M., Tylavsky, F.A., Visser, M., and Newman, A.B. The Loss of Skeletal Muscle Strength, Mass, and Quality in Older Adults: The Health, Aging and Body Composition Study. The Journals of Gerontology Series A: Biological Sciences and Medical Sciences 2006;61, 1059-1064.

26. Rantanen, T., Guralnik, J.M., Ferrucci, L., Penninx, B.W.J.H., Leveille, S., Sipilä, S., and Fried, L.P. Coimpairments as Predictors of Severe Walking Disability in Older Women. Journal of the American Geriatrics Society 2001;49, 21-27.

27. Sato, Y., Inose, M., Higuchi, I., Higuchi, F., and Kondo, I. Changes in the supporting muscles of the fractured hip in elderly women. Bone 2002;30, 325-330.

28. Nikolic, M., Malnar-Dragojevic, D., Bobinac, D., Bajek, S., Jerkovic, R., and Soic-Vranic, T. Age-related skeletal muscle atrophy in humans: an immunohistochemical and morphometric study. Collegium antropologicum 2001;25, 545-553.

29. Bütikofer, L., Zurlinden, A., Bolliger, M.F., Kunz, B., and Sonderegger, P. Destabilization of the neuromuscular junction by proteolytic cleavage of agrin results in precocious sarcopenia. The FASEB Journal 2011;25, 4378-4393.

30. Kim, J., Kuno, S., Soma, R., Masuda, K., Adachi, K., Nishijima, T., Ishizu, M., and Okada, M. Relationship between reduction of hip joint and thigh muscle and walking ability in elderly people. The Japanese Journal of Physical Fitness and Sports Medicine 2000;49, 589-596.