jarlife journal
Sample text

AND option

OR option

THE NOVEL FRAILTY INDEX (NFI) CORRELATES WITH A VALUE OF PHASE ANGLE AND MNA IN HOSPITALISED AND FREELIVING ELDERLY – PRELIMINARY REPORT


E. Wernio1, J.A. Dardzińska1, H. Kujawska-Danecka2, A. Hajduk2, Z. Zdrojewski2, S. Małgorzewicz1


1. Department of Clinical Nutrition and Dietetics, Medical University of Gdańsk, Poland; 2. Department of Internal Medicine, Connective Tissue Diseases and Geriatrics, Medical University of Gdańsk, Poland

Corresponding Author: Jolanta Anna Dardzińska M.D., Ph. D. Department of Clinical Nutrition, Medical University of Gdańsk, Dębinki St. 7, 80-211 Gdańsk, Poland, e-mail: annadar@gumed.edu.pl, Tel/Fax: +48 58 349 27 23

J Aging Res Clin Practice 2018;7:123-127
Published online October 15, 2018, http://dx.doi.org/10.14283/jarcp.2018.21


Abstract

Introduction: To improve the quality of life and health of the elderly, attention is paid to the early detection of frailty syndrome. Unfortunately, one simple and practical screening tool has not been established yet. Recently came the proposal of the Novel Frailty Index (NFI) created by Yamada and Arai. Therefore, the purpose of this study was to assess the relationship between nutritional status and NFI of the elderly. Materials and methods: In a group of 67 elderly patients (27 hospitalised and 40 living in the home environment) we used the NFI and evaluated nutritional status with the use of full-MNA together with SNAQ (appetite questionnaire), manual dynamometry and bioimpedance analysis. Results: Based on the NFI results, frailty syndrome was diagnosed in more than half of hospitalised elderly. The syndrome was significantly less prevalent in free-living older people (15% vs 63%, p<0.001).We found the significant correlations of NFI values with age (r=0.031, p=0.03), co-morbidity(r=0.295, p=0.016), phase angle (r=-0.407, p<0.001), full-MNA score (r=-0.515, p<0.001). Conclusions: Our preliminary results suggest the relevant association between NFI results and age, phase angle as well comorbidity and nutritional status. So further evaluation of NFI as a screening tool for frailty syndrome diagnose is needed.

Key words: Novel frailty index, elderly, nutritional status, malnutrition.

Abbreviations: BIA: Bioelectrical impedance analysis; BMI: Body Mass Index; ESPEN: European Society for Clinical Nutrition and Metabolism; MNA: Mini Nutritional Assessment; MM: Muscle mass; MMI: Muscle mass index; NFI: the Novel Frailty Index by Yamada and Arai; SNAQ: Simplified Nutritional Appetite Questionnaire.


Introduction

The life expectancy is constantly increasing. By the end of 2014, the number of people reaching the advanced age constituted 22.2% of the Polish population. This percentage will increase and probably in 2050 more than 40% of all Poles will reach at least 60 years (1). To the important medical problems in the elderly populations belong also the frailty syndrome. It has recently attracted the attention of both scientists and clinicians. Unfortunately, there is still lacking a widely accepted definition of this state and, what is even more important, simple criteria for recognition (2). Recently a new tool to screen for frailty was developed by Yamada and Arai.  It is the 5-question self-report questionnaire, that includes nutrition/shrinking, physical function, physical activity, forgetfulness and emotion/exhaustion.  The answers are scored 0/1 points, so the total score is from 0 to 5 points.  Obtaining 3 or more points by the respondent is intended for the presence of the frailty syndrome (3). The new index was presented at the ESPEN (European Society for Clinical Nutrition and Metabolism) Congress in 2016 by Suzuki et al. as Novel Frailty Index (NFI) and frailty assessment based on it was associated with malnutrition and predicted prognosis in outpatients with chronic heart failure (4).
The inseparable characteristics of the frailty syndrome include the risk of developing malnutrition or existing malnutrition and related loss of muscle mass and function. For many years, the MNA has met expectations for a simple, useful tool for assessing the nutritional status of the elderly in clinical practice (5).  Both parts of MNA (Short Form and Assessment) are characterised by high sensitivity and specificity (6).
So the aim of our study was to compare the results of the NFI evaluation with the effects of the traditional nutritional assessment using the Full-MNA, SNAQ, manual dynamometry and bioimpedance analysis in the group of elderly people.


Material

The study group consisted of 67 elderly patients, including 27 patients hospitalised at the clinical hospital in Gdańsk, in the Department of Pneumology and Allergology and in the Department of Geriatrics. The control group was composed of 40 healthy volunteers in age >65 years old. The study was conducted in October 2016 y.
In Table 1 the characteristic of the study group is presented.

Table 1 Characteristics of the studied population

Table 1
Characteristics of the studied population

Legend: BMI-body mass index.


The average age of hospitalised elderly was notably higher compared to those living in the environment (73.9 vs 69.0,  p=0.012), they had also more chronic disease than control group (3 vs 2, p=0.006) (Tab.1).
Main causes of hospitalisation of studied group were chronic obstructive pulmonary disease (in 25% of women, 53% of men). The other reasons for admitting to a hospital ward were hypertension (in 17% of women, 8% of men), diabetes type 2 (in 17% of women and 17% of men), asthma (in 17% of women, 8% of men). Furthermore, in the female group – psoriasis (7%), acute myeloid leukaemia (7%), Sjögren’s syndrome (7%) and in male group coronary artery disease (8%), rheumatic polymyalgia (8%) constituted reasons for hospitalisation.
Free-living elderly suffered mainly from hypertension (in 57% of women, 80% of men), hypercholesterolemia (in 43% of women, 30% of men), coronary artery disease (in 7% of women, 10% of men), hypothyroidism (in 17% of women). In addition gastritis (7% of women), hiatus hernia (in 3% of women, 20% of men), Sjögren’s syndrome (in 3% of women), celiac disease (in 3% of women), prostatic hyperplasia (in 10% of men), chronic obstructive pulmonary disease (in 10% of men) were present in free-living elderly.
The inclusion criteria were: age ≥65 and informed consent to participate in the study.
The exclusion criteria were: disagreement and lack of ability to cooperate, a severe condition of the patient making impossible to answer questions. People with cardioverter defibrillator were also excluded due to the inability to evaluate body composition by electric bioimpedance.
The work was performed as part of the research number 02-0048 and conducted in the Department of Clinical Nutrition, Medical University of Gdansk. The study was approved by the University Ethics Committee.


Methods

The medical history was taken from all participants. Body height (cm) and body weight (kg) were examined. Based on the obtained data BMI [kg/m2] as weight [kg] /height [m] were calculated.
The measurement of hand grip strength was carried out using an analog hand-held dynamometer (Baseline 12-0240, USA) in the upright position, with the arm lowered along the torso and the dynamometer firmly in the palm of the hand. Norms for HGS >20kg for women and >30kg for men were adopted from The European Working Group on Sarcopenia in Older People (27).
Body composition was assessed by electric bioimpedance using the Maltron BioScan 920-2 analyser, which is a four-frequency device (5 kHz, 50 kHz, 100 kHz and 200 kHz). Four self-adhesive electrodes were placed on the right hand and right-hand skin. The measurement was done in the fasting state. The phase angle was tested at 50 kHz (the value ≥8° was considered as a norm).
For the evaluation of nutritional status, the full version of Mini Nutritional Assessment (f-MNA) was used. The patient was considered as well nourished when their f-MNA ranged between 24 and 30, as being at risk of malnutrition between 17 and 23.5 points and as having malnutrition if the score was less than 17 (25).
Appetite was evaluated by the Simplified Nutrition Assessment Questionnaire (SNAQ). Obtaining ≤14 points indicated the risk of weight loss within 6 months (26).
Novel Frailty Index was used to assess frailty syndrome. This 5-question self-report questionnaire includes nutrition/shrinking, physical function, physical activity, forgetfulness and emotion/exhaustion. The answers are scored 0/1 points, so the total score is from 0 to 5 points. When the patient received ≥ 3points, the syndrome was diagnosed (3).

Statistical analysis

Statistical analysis was performed with Statistica 12.0 for Windows. Distribution of variable was assessed with the Shapiro-Wilk test. The differences were tested with t-Student test or U-Mann Whitney test depending on the distribution of variables. Data are presented as the mean ± standard deviation (SD) or median and ranges. χ2 Pearson test was also used. Analysis of correlations was performed using Spearman test. P-value of <0.05 was considered as statistically significant.
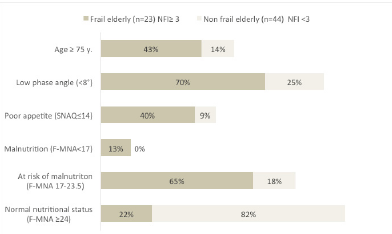
Figure 1 Comparison of parameters of nutritional status, appetite in elderly with and without frailty syndrome according to Novel Frailty Index (NFI)

Figure 1
Comparison of parameters of nutritional status, appetite in elderly with and without frailty syndrome according to Novel Frailty Index (NFI)


Results

In Table 2 comparative analysis of hand grip strenght and phase angle value are presented.  Hospital patients had lower phase angle (7.8º vs. 8.8º, p=0.003). Hand grip strenght did not differ among groups (Tab.2).

Table 2 Comparison of hand grip strenght and phase angle value among hospitalised and free-living elderly

Table 2
Comparison of hand grip strenght and phase angle value among hospitalised and free-living elderly

Legend: HGS- hand grip strength.


Nutritional Status and NFI

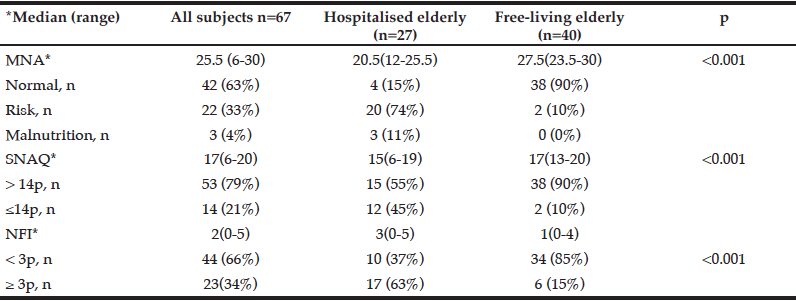
In Table 3 results of full-MNA, SNAQ and NFI are summarized.
According to full-MNA results, 85% in the hospitalised group were malnourished or at risk of malnutrition. On the other hand, in the group of patients in the home environment, only 2% (n=2) of the women and none of the men were affected (Tab.3).
The risk for significant weight loss (>5% in 6 months) assessed by the SNAQ (≤14p) was also significantly higher in hospitalised patients.
Based on the NFI, the frailty syndrome was more common in hospitalised older patients than in free-living elderly, regardless of gender (respectively 63% vs. 15%, χ2=22.3, df=7, p=0.002).
Considering all studied elderly 34% of all subjects were recognized as a frail and 66%  as a non-frail according to NFI. Significant differences between frail and non-frail elderly have been observed solely in age (respectively 73.9±7 vs 69±6, p=0.01,), phase angle value (7.8±1.8 vs 8.7±1.2, p=0.001), MNA [21 (6-29) vs 27 (18.5=30), p=<0.001] and SNAQ [ 15 (6-19) vs 17 (12-20) p=0.01] results. Frail elderly were older and in poorer nutritional status, had worse appetite and lower phase angle in comparison with non-frail (Fig.1).

Table 3 The results of the nutritional status and NFI

Table 3
The results of the nutritional status and NFI

Legend: MNA- Mini Nutritional Assessment, SNAQ- Simplified Nutritional Appetite Questionnaire, NFI- Novel Frailty Index


Analysis of the correlation

Analysis of the correlation in the group of 67 elderly participants showed statistically significant associations of NFI score with age, the number of reported diseases, phase angle value and nutritional status (full-MNA). The age and number of reported diseases correlated positively. Conversely, the negative relationship was demonstrated for the value of the phase angle and the MNA score (data are shown in Table 4).
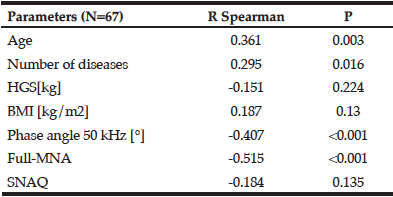
Table 4 The relationship between the Novel Frailty Index and components of the assessment of nutritional status

Table 4
The relationship between the Novel Frailty Index and components of the assessment of nutritional status

NFI- Novel Frailty Index , HGS- hand grip strength, BMI- body bass index, SNAQ- Simplified Nutritional Appetite Questionnaire, MNA- Mini Nutritional Assessment


Discussion

Frailty in one of most burning problems in countries with aging populations and this issue recently focus more attention of both scientists and clinicians. There is no doubt that frailty implies increased morbidity and mortality and is connected with the need for long-term care (7-9). Despite all these unrelenting facts, we still didn’t have a good screening tool to diagnose frailty or pre-frail state. Current methods of recognizing this syndrome require a number of tests, which often need to be performed by specialists (2, 13). That is why this study investigated the usefulness newly proposed by Yamada and Arai, self-reported 5-question screening index in association with markers of nutritional status, muscle mass, and strength.
The risk of developing frailty syndrome increases with age and it is often described as a physiological decline in late life (14, 15). Data from the Cardiovascular Health Study (n=5317) demonstrated that discussed syndrome is more common in advanced age people. According to mentioned study, 3.2% of free-living elderly in 65-70 age and 25.7% of those ≥ 85 years were frail (7). Results of research presented in the paper show similar relationship. There was a statistically significant positive association of NFI values with age. Moreover, in comparative analysis, frail elderly were older than non-frail (respectively 73.9±7 vs 69±6) and the percentage of people ≥75 years was higher (43% vs 14%).
It should be highlighted that among hospitalised older people, the prevalence of frailty syndrome may be properly higher, due to often severe clinical condition, comorbidities, advanced age (16). Our study demonstrated that frailty syndrome was significantly more common in hospitalised older people than in community-dwelling elderly (respectively 15% vs 63%). Furthermore, hospitalized respondents were affected with more chronic diseases, had a worse appetite and nutritional status, also men were older in comparison with free-living older people.
Many studies emphasize the strong correlation between malnutrition and frailty which were assessed by various diagnostic criteria (10-12). To our knowledge, the NFI has been used so far only by Suzuki et al. own to screen for frailty and its relationship with malnutrition in the elderly patients with chronic heart failure (4). Researchers have shown a statistically significant relationship between the NFI results and the MNA score (r= -0,590, p<0,001). In our study group, we also found strong relationships between NFI and MNA ( r = -0.515, p <0.001). Moreover, frail respondents were in worse nutritional status than non-frail elderly. It is worth pointing out, that 22% of frail elderly were well-nourished according to the full-MNA, which might indicate that the exclusive use of this assessment tool may be insufficient to identify the frail person. Boulos et al. published similar findings, where in a group of 399 frail participants 36.1% were well-nourished (17). Many authors describe malnutrition and frailty as related, but distinct conditions and both should be detecting (17-19).
Frailty syndrome is associated with decreased not only muscle mass but also muscle strength and power. Diagnostic criteria of this syndrome involve also evaluation of muscle function (20, 21). In the presented study, hand grip strength was assessed and the relationship between NFI and HGS was not recorded. However, a frequent decreased of HGS in both groups has been noticed. This may indicate the great need for nutritional status assessment not only hospitalized but also free-living elderly people.
The most important parameter measured in BIA is the phase angle (PA), which reflects the quantity of the cellular mass in the body, as well cell membrane function. The prognostic value of PA has been well established especially in severe health conditions i.a. in COPD, HIV, lung cancer or in dialysis patients and in relation to poor nutritional status (22, 23). In the Third National Health and Nutritional Examination Survey, in a sample of 4.667 older participants, showed that low phase angle was related to a four-fold higher odds of frailty among women and a three-fold higher odds of frailty among men (24). In the presented study the phase angle appears to be the most valuable parameter. PA positively correlates with NFI and is significantly lower in frail and hospitalized older adults in both genders.
In our opinion Novel Frailty Index is undoubtedly a simple tool for rapid screening and might be important in clinical practice in the future. The use of NFI does not require any special equipment for diagnostics. On the other hand, the tool requires a validation process. So far, there is too little data indicating the predictive value of this tool. Yamada and Arai examined 5852 elderly people living in the community and showed that the NFI can be a predictor of disability (3). Furthermore Suzuki et. al. indicated that NFI may predict poor outcome in chronic heart failure outpatients (4). Our study shows that the Novel Frailty Index is associated with a poor health condition, advanced age, poor nutritional status, lack of appetite and impairment of body cell mass. The important limitation of our study is the small sample of enrolled patients. Hence results of our study should be taken with caution.


Conclusions

Early diagnosis of frailty syndrome could be helpful to clinicians to potentially reduce the risk of complications connected with the implemented treatment, so we decided to assess in our study the new screening tool NFI. Preliminary results of our research indicate the relationship between the NFI score and the relevant parameters associated with the frailty syndrome (age, comorbidities, nutritional status, phase angle). Therefore, we highlight the need for further evaluation of NFI as a useful tool for screening of frailty syndrome.


Conflict of Interest: Nothing to disclose.


References

1. Główny Urząd Statystyczny. Ludność w wieku 60+. Struktura demograficzna i zdrowie.(http://stat.gov.pl/obszary-tematyczne/ludnosc/ludnosc/ludnosc-w-wieku-60-struktura-demograficzna-i-zdrowie,24,1.html),downloaded 10.07.17r.
2. Stoicea N, Baddigam R, Wajahn J, Sipes AC, Arias-Morales CE, Gastaldo N, Bergese SD. The Gap Between Clinical Research and Standard of Care: A Review of Frailty Assessment Scales in Perioperative Surgical Settings. Front Public Health. 2016;21;4:150.
3. Yamada M1, Arai H2. Predictive Value of Frailty Scores for Healthy Life Expectancy in Community-Dwelling Older Japanese Adults. J Am Med Dir Assoc. 2015; 1;16(11):1002.e7-11
4. Suzuki N., Kida K., Watanabe S., Kawashima Y., Ito C., Ashikaga K., Suzuki K., Omiya K., Harada T., Akashi Y.J.: Novel Frailty Index is Closely Related to Malnutrition in Outpatients with Chronic Heart Failure. Clinical Nutrition 2016; 35(S1): s.208
5. Vellas B., Villars H., Abellan G., Soto M.E., Rolland Y., Guigoz Y., Morley J.E., Chumlea W., Salva A., Rubenstein L.Z., Garry P.: Overview of the MNA – Its history and challenges. The Journal of Nutrition, Health & Aging 2006; 10(6): s.456-463.
6. Cereda E.: Mini nutritional assessment. Current Opinion in Clinical Nutrition and Metabolic Care 2012; 15(1): s.29-41.
7. Fried LP, Tangen CM, Walston J, Newman AB, Hirsch C, Gottdiener J, Seeman T, Tracy R, Kop WJ, Burke G, McBurnie MA; Cardiovascular Health Study Collaborative Research Group. Frailty in older adults: evidence for a phenotype. J Gerontol A Biol Sci Med Sci. 2001 Mar;56(3): M146-56. PMID: 11253156.
8. Furtado G, Patrício M, Loureiro M, Teixeira AM, Ferreira JP. Physical Fitness and Frailty Syndrome in Institutionalized Older Women. Percept Mot Skills. 2017;124(4):754-776.
9. Mandelblatt JS, Cai L, Luta G, Kimmick G, Clapp J, Isaacs C et al. Frailty and long-term mortality of older breast cancer patients: CALGB 369901 (Alliance). Breast Cancer Res Treat. 2017;164(1):107-117.
10. Ferriolli E, Pessanha FPADS, Moreira VG, Dias RC, Neri AL, Lourenço RA. Body composition and frailty profiles in Brazilian older people: Frailty in Brazilian Older People Study-FIBRA-BR. Arch Gerontol Geriatr. 2017;71:99-104.
11. Artaza-Artabe I, Sáez-López P, Sánchez-Hernández N, Fernández-Gutierrez N, Malafarina V. The relationship between nutrition and frailty: Effects of protein intake, nutritional supplementation, vitamin D and exercise on muscle metabolism in the elderly. A systematic review. Maturitas. 2016;93:89-99
12. Cruz-Jentoft AJ, Kiesswetter E, Drey M, Sieber CC. Nutrition, frailty, and sarcopenia. Aging Clin Exp Res. 2017;29(1):43-48.
13. Laur CV, McNicholl 1, Valaitis R, Keller HH. Malnutrition or frailty? Overlap and evidence gaps in the diagnosis and treatment of frailty and malnutrition. Appl Physiol Nutr Metab. 2017;42(5):449-458.
14. Clegg A, Young J, Iliffe S, Rikkert MO, Rockwood K. Frailty in elderly people. Lancet. 2013;381:752–762.
15. Chen X, Mao G, Leng SX. Frailty syndrome: an overview. Clinical Interventions in Aging. 2014;9:433-441. doi:10.2147/CIA.S45300.
16. Oliveira DR1, Bettinelli LA, Pasqualotti A, Corso D, Brock F, Erdmann AL. Prevalence of frailty syndrome in old people in a hospital institution. Rev Lat Am Enfermagem. 2013;21(4):891-8.
17. Boulos C, Salameh P, Barberger-Gateau P. Malnutrition and frailty in community dwelling older adults living in a rural setting. Clin Nutr. 2016;35(1):138-43.
18. Laur CV, McNicholl T, Valaitis R, Keller HH. Malnutrition or frailty? Overlap and evidence gaps in the diagnosis and treatment of frailty and malnutrition. Appl Physiol Nutr Metab. 2017;42(5):449-458.
19. Bollwein J, Volkert D, Diekmann R, Kaiser MJ, Uter W, Vidal K, et al. Nutritional status according to the mini nutritional assessment (MNA®) and frailty in community dwelling older persons: a close relationship. J Nutr Health Aging.2013;17(4):351e6.
20. Frailty in Older People. Lancet. 2013;381(9868):752-762. doi:10.1016/S0140-6736(12)62167-9.
21. Cesari M, Leeuwenburgh C, Lauretani F, et al. Frailty syndrome and skeletal muscle: results from the Invecchiare in Chianti study. The American journal of clinical nutrition. 2006;83(5):1142-1148.
22. Gupta D1, Lis CG, Dahlk SL, Vashi PG, Grutsch JF, Lammersfeld CA. Bioelectrical impedance phase angle as a prognostic indicator in advanced pancreatic cancer. Br J Nutr. 2004;92(6):957-62.
23. Kyle UG1, Genton L, Pichard C. Low phase angle determined by bioelectrical impedance analysis is associated with malnutrition and nutritional risk at hospital admission. Clin Nutr. 2013 Apr;32(2):294-9.
24. Wilhelm-Leen ER1, Hall YN, Horwitz RI, Chertow GM. Phase angle, frailty, and mortality in older adults. J Gen Intern Med. 2014 Jan;29(1):147-54.
25. A guide to completing the Mini Nutritional Assessment. (http://www.mna-elderly.com/forms/mna_guide_english_sf.pdf), downloaded 20.07.2017r.
26. Wilson MM, Thomas DR, Rubenstein LZ, Chibnall JT, Anderson S, Baxi A, Diebold MR, Morley JE. Appetite assessment: simple appetite questionnaire predicts weight loss in community-dwelling adults and nursing home residents. Am J Clin Nutr 2005; 82: 1074-1081.
27. Cruz-Jentoft AJ, Baeyens JP, Bauer JM, et al. Sarcopenia: European consensus on definition and diagnosis: Report of the European Working Group on Sarcopenia in Older People. Age and Ageing. 2010;39(4):412-423. doi:10.1093/ageing/afq034

GENDER DIFFERENCES IN PRACTICE, KNOWLEDGE AND ATTITUDES REGARDING FOOD HABITS AND MEAL PATTERNS AMONG COMMUNITY DWELLING OLDER ADULTS


J. Johannesson1, E. Rothenberg1,2, S. Dahlin Ivanoff1,3, F. Slinde1


1. Sahlgrenska Academy, Department of Internal Medicine and Clinical Nutrition, University of Gothenburg, Sweden; 2. Kristianstad University, School of Education and Environment, Sweden; 3. Sahlgrenska Academy, Department of Neuroscience and Physiology, University of Gothenburg, Sweden..

Corresponding Author: J. Johannesson, Sahlgrenska Academy, Department of Internal Medicine and Clinical Nutrition, University of Gothenburg, Sweden, julie.johannesson@gu.se

J Aging Res Clin Practice 2016;inpress
Published online September 29, 2016, http://dx.doi.org/10.14283/jarcp.2016.117


Abstract

 Objective: To study gender differences in older adults according to practice, knowledge and attitudes regarding food habits and meal patterns. Design: Cross-sectional study. Setting: Two urban districts of Gothenburg, Sweden. Participants: A total of 297 individuals were included, 102 men and 195 women. They were 80 years or older and living in ordinary housing without being dependent upon the municipal home help services or help from another person in Activities of Daily Life, and cognitively intact, defined as having a score of 25 or higher in the Mini Mental State Examination. Measurements: Telephone interviews regarding food habits and meal patterns were conducted. Results: Almost all participants (99%) ate their main meal at home and men preferred company at meals more often (p<0.001). Women had the sole responsibility to shop for food more often (p<0.000), and generally regarded cooking as a routine or something they just had to do. Among men, few (13%) took a great interest in cooking and 36 % of the men stated that cooking was something they were not capable of performing (p<0.000). Men had company at meals every day more often (71% vs 40%). Respondents stated that loneliness took away the enjoyment of cooking and changed their habits when becoming a widow or widower. Conclusion: Women take greater responsibility for the household than men, regardless of marital status. A large proportion of the men thought cooking was something they were not able to do. The findings in this study may indicate a possible gender difference in the need for societal support.

Key words: Aged 80 and over, nutritional status, food habits, household responsibilities, lived experience.


Introduction

As aging is an individually varying process influenced by various factors, such as lifestyle, disease and genetic disposition, older adults therefore form a heterogeneous group (1). As long as older adults stay healthy they seem to maintain good food habits and nutritionally adequate diets. This has been shown in several population based studies such as the H70 which was performed in Sweden (2,3), and the SENECA-study which was performed in seven different countries (4).
Malnutrition could be defined as a nutritional state of lack or excess of energy, protein and other nutrients that cause measurable adverse effects on body structure, function and clinical course (5). Studies on independent living older adults show that there is a significant association between individuals suffering from poor nutritional status and an increasing level of frailty (6) and disease (7). Naseer et al’s study on home-living and special housing residents  showed that the risk of malnutrition was associated with a higher risk of mortality (8). Among hospitalized, older, chronically ill adults almost half are malnourished (9). The reasons are lower reserves of physiological and psychological systems, multiple chronic diseases and many drugs in combination which may lead to increased morbidity and mortality (10). Unintentional weight loss is also an indicator of frailty, and could be defined as “psychological state of increased vulnerability to stressors that result from decreased physiologic reserves, and even dysregulation, of multiple physiologic systems” (11), with increasing incidence by age and with negative health consequences. Frailty has been reported to be up to twofold higher in women than men (12). A consensus group of gerontology researchers recommends that physical frailty should be measured according to the phenotype model developed by Fried and co-workers, which takes into account the presence of three or more of the following criteria: unintentional weight loss, self-reported exhaustion, low energy expenditure, slow gait speed and weak grip strength (13).
Factors such as appetite (14), ability to chew and swallow (15), and smell and taste (16) may be affected by frailty, therefore it is important to reach a better understanding of how these factors influence eating and the ability to satisfy nutritional needs in old age.
In 2014, 5 % of the Swedish population were  80 years of age or older, 62 % of them were women and 38 % men (17). Among these, 23.8 % (30 % men, 70 % women), were approved home help service and 14 % lived permanently in special housing (27 % men and 73 % women). The figures for Gothenburg were similar (18). About 2/3 of this population live in ordinary housing and are not dependent on the municipal home help service or care.
Vitolins et al (19) studied gender variation in dietary intake among rural older adults (≥ 70 yrs) in the United States. Men had significantly higher nutrient intake than women, and age was not significantly associated with the intake levels of any of the measured nutrients. To our knowledge, there are few studies concerning gender differences in nutritional risk (20–22).
Sidenvall et al (23) found that widows and single women did not enjoy cooking for themselves and thought it was difficult to plan their food only for themselves, therefore they often left out meals. Cohabiting women planned their cooking according to their husbands’ taste. Meals with company were enjoyed most, and taken for granted by cohabiting women. Single women lost their appetite due to loneliness and the lack of everyday company (23). Wham and Bowden (24) found that eating alone was the most common nutrition risk factor among single-living men in New Zealand. Individual circumstances influenced their eating practices; limited finances and lack of personal transport also limit healthy eating. There was also a lack of nutrition knowledge and cooking skills among the participating men. However, Morais et al (25) and Saka et al (26) found that gender did not have a significant impact on nutritional risk. Quandt and Chao (21) found that women were at increased nutritional risk compared to men using the Nutritional Risk Index (NRI), women also had a higher average age and they were more likely to live alone. Men were more often married whilst women were widows.
Due to the increasing life expectancy and due to the lack of studies, there is a great need for knowledge and understanding of how food habits and meal patterns affect older people’s capability to maintain independence and health. Several factors are involved. In the present paper we have chosen to look specifically at the gender aspect since in these age groups men and women in general have had different roles in the household with women by tradition taking a greater responsibility for food supply and cooking.
The aim of this study was therefore to study gender differences among community dwelling older adults according to practice, knowledge and attitudes regarding food habits and meal patterns.


Methods

Participants and setting

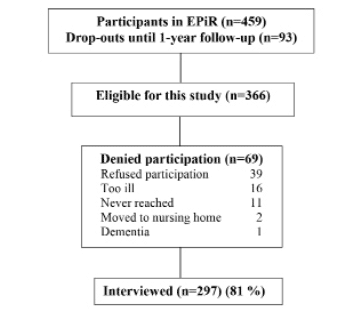
Participants were recruited from the one-year follow-up of “Elderly in the risk zone” (EPiR) (27) conducted 2008 to 2011 in two urban districts in Gothenburg, the second largest city in Sweden with approximately 600 000 inhabitants. In the two districts people 80 years and older account for 8 % and 7 % respectively of the population, compared to 5% of Gothenburg and Sweden as a whole (28). They are situated outside the city centre but within the city limits, and contain a mix of self-owned houses and apartment buildings. The general educational and income levels are slightly higher, and the prevalence of disease somewhat lower, than in the general population of Gothenburg (29). The EPiR study included 459 community-dwelling individuals aged 80 years of age or over. Those who were independent of help from the community in all activities according to Activities of Daily Living (ADL) and with a Mini Mental State Examination (MMSE) (30) of >25 at baseline were included. After one year 366 individuals remained in the EPiR study and were eligible for the current study. The main reason for drop-out between baseline and one-year follow-up in the EPiR-study was “not interested”. Remaining individuals were invited to the current study and 297 accepted participation (Figure 1 and table 1).

Figure 1 Flow of the participants throughout the study. Reasons for declining participation.

Figure 1
Flow of the participants throughout the study. Reasons for declining participation.

Table 1 Characteristics of the participants in the study, n (%)

Table 1
Characteristics of the participants in the study, n (%)

1. Chi-square test


Assessment of practice, knowledge and attitudes regarding food habits and meal patterns

To assess practice, knowledge and attitudes regarding food habits and meal patterns a telephone interview was performed using a questionnaire. The questionnaire was partly based on questions from two previous Swedish population studies (2, 31), with the addition of new questions for the purpose of the present study. In this study, food habits could be understood as the way in which people select, cook, serve and eat food that is available to them. Meal pattern was identified using the method from Bertéus Forslund et al (32), and was defined as all intake occasions of any food or drink consumed at any time point.
Attitude is defined as the way that one thinks and feels about somebody or something and the way that one behaves towards somebody or something that shows ones thoughts and feelings (33). Practice is to perform or do something regularly as an ordinary part of one’s life (33).
Background variables such as age, gender, marital status, type of housing and education were collected from baseline data in EPiR (27).
The questionnaire was tested, using a telephone interview, on a small group (n=5) from the EPiR-cohort, and revised according to reflections from the interviewer and comments from the respondents. The final questionnaire consisted of 52 questions. Those concerning food choices and food habits were open questions; the remaining had given alternatives.
The questionnaire started with questions regarding shopping and cooking responsibilities, followed by questions concerning eating alone or with others, location of eating and if there were problems associated with eating and dental status. Further on, opinions concerning foods and health, followed by meal patterns, were asked for. Those who had home delivered meals (“meals on wheels”) were requested to answer how often they received meals and if they had a choice of different meals. The questionnaire ended with questions regarding earlier food habits, appetite, self-reported body weight and height and time point for these last measurements.
Body Mass Index (BMI) calculated as kg/m2 and based on self-reported weight and height, was used as a crude measure of nutritional status. The cut-off  for underweight was set at BMI < 24 kg/m2, normal weight BMI 24-29 kg/m2and overweight >29 kg/m2  according to Beck and Ovesen (34).
The interviews were conducted by an experienced dietician (JJ) and lasted for 16 minutes (6-74) in mean. Six persons had hearing problems and were asked to fill in the form at home and return it by post.

Statistical analyses

The descriptive results are presented as mean and standard deviation. To analyse differences between groups the Chi2 test was used. Student’s t-test was used for continuous variables. Two-sided significance tests were used throughout. Statistical significance was accepted at the 5 % level (p<0.05). Statistical analyses were performed using PASW Statistics, version 21.0 (IBM SPSS Inc, Chicago, IL).
A power calculation was performed at baseline for the EPiR-study and it was estimated that about 450 individuals would need to be included to allow for drop-outs. This study is conducted at the one-year follow-up (35).

Ethical considerations

The study was approved by the Regional Ethical Review board in Gothenburg ref no: 650-07.
The information to the participants was given both in a written letter and in person and it was clearly stated that participation was completely voluntary and they could decline at any time without giving a reason.


Results

To the present study, the remaining 366 individuals from the one year follow-up from the EPiR-cohort were invited. Eligible individuals received a letter with an invitation to a telephone interview regarding practice, knowledge and attitudes regarding food habits and meal patterns. The questionnaire was also included in the letter. The letter was followed by a telephone interview after a week when eligible individuals could accept or refuse participation. The flowchart of participation is shown in Figure 1.
Sixty-nine individuals (19%) did not agree to participate in the current study. There was no significant difference concerning gender, marital status, and type of living or education among the individuals who denied participation compared to the participants. Regarding age there was a significant difference; the ones who did not participate were significantly older. The main reason for declining participation was “not interested” (9 %). Since participating in the EPiR, 18 individuals were deceased (4 %) (Figure 1).
Among those interviewed, 66 % were women; mean age 87 yrs (SD ±3) for both genders (range 83-100). Marital status, level of education, type of housing and dental status is shown in table 1. Women had a higher education more seldom and were more often widows, compared to men (table 1).  At the time of retirement, nine per cent (n=18) of the women were housewives, none of the men (p=0.000).
A majority, 70 % (n=207), reported that they were satisfied with their present body weight and 56 % (n=167) used to weigh themselves regularly, yet 26 % (n=78) expressed a wish to lose weight and 4% (n=11) had a wish to gain weight (table 1). Self-reported mean BMI was 24 kg/m2 (range 15.4-37.3 kg/m2) (SD ± 3.2 kg/m2) for both genders (table 1).
Concerning appetite, 91 % (n=94) of men and 86 % (n=166) of women reported good or very good appetite. Among those who considered themselves having a poor appetite, 69 % (n=24) reported a BMI lower than 24 kg/m2 and 57 % (n=21) (both genders) were widows/widowers, ns.
Both genders, men 76 % (n=78), and women 68 % (n=130), considered that their appetite had remained stable since working age; difference (ns) between genders.

Practice regarding food habits and meal patterns

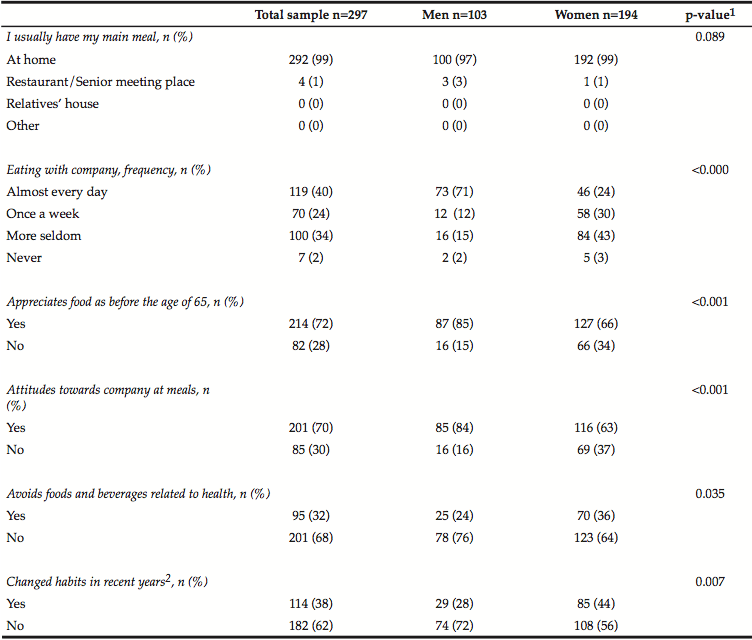
Independent of gender almost all participants had their main meal at home; only a few (n=4) went to a restaurant or meeting place for seniors. A small number (2 %, n=7) received ready-to-serve meals (meals on wheels).
Compared to women, men more often had company at meals every day (table 2). Nevertheless, 77 % (n=79) of men had a wife or cohabitant compared with 29 % (n=55) of the women. If there was a choice, 84 % (n=85) of the men and just 2/3 of the women (63 %, n=116), preferred to have company at meals.
Regarding eating related problems, no significant differences between the genders were found (table 2).
Women tend to avoid different kinds of foods or beverages, related to their health more often compared to men. Sweet foods (15 %), indigestible foods (14 %), fatty foods (13 %) and different kinds of fruits and vegetables (13 %) were the most commonly reported. The main reasons for excluding these foods were different kinds of digestive symptoms (36 %), diabetes (13 %) and bile problems (9 %).
A larger proportion of women reported that their habits regarding cooking, meal patterns and choice of foods had changed during recent years (p=0.007). The main reasons were becoming a widow (41 %) or their own retirement (19 %) (table 2).

Knowledge and attitudes regarding food habits and meal patterns

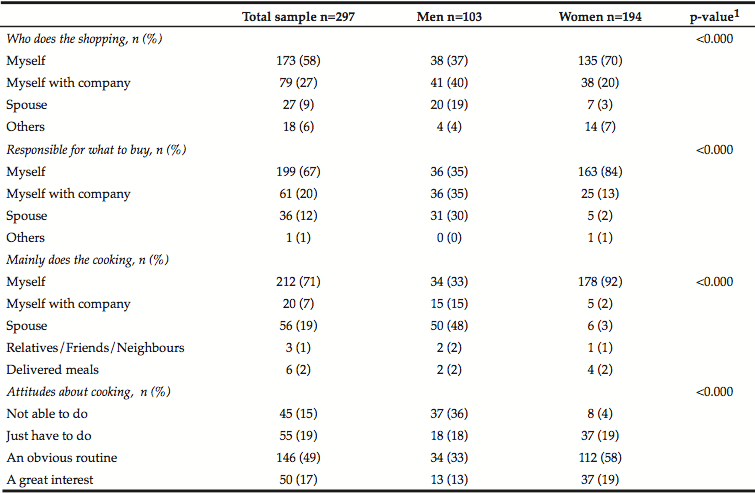
Women more often than men went shopping for food on their own and men reported more frequently that their spouse/cohabitant did the food shopping. Both women and men reported that women were the ones who were responsible for shopping at the store rather than men (table 3). A large percentage of both men and women still appreciated food as much as they did before they were at the age of 65 (table 2). Among the married/cohabiting respondents there was a significant difference (p<0.000) between genders regarding responsibility for planning food shopping and cooking. The women more often had sole responsibility, and thought of cooking as a routine or something they just had to do, while some, 19 %, expressed great interest in cooking. Among men, few took a great interest in cooking and 36 % stated that this was something they were not capable of performing (table 3).

Table 2 Participant’s practice, knowledge and attitudes regarding food habits and meal patterns, n (%)

Table 2
Participant’s practice, knowledge and attitudes regarding food habits and meal patterns, n (%)

1 Chi-Square test; 2 Habits regarding cooking, meal patterns and choice of foods.

Table 3 Participants practice, knowledge and attitudes regarding food habits, n (%)

Table 3
Participants practice, knowledge and attitudes regarding food habits, n (%)

1 Chi-Square test


Discussion

In this study we have identified several gender differences according to practice, knowledge and attitudes regarding food habits and meal patterns among community dwelling older adults indicating a possible gender difference in the need for societal support according to these matters.

Materials and methods discussion

Subject characteristics indicate that the present population is in better condition than Swedish 80-year olds in general (36); education and income levels were somewhat better; 56 % own their homes; prevalence of disease is slightly lower and at baseline they were independent in ADL (29). Lindblad et al (37) studied a sub-sample of individuals from EPiR; results showed that body energy and protein stores and muscle strength were well-preserved in this group indicating good functional status.
Almost 50 % still lived with their spouse or a cohabitant, and as shown by Larsson et al (38), marital status is significantly connected with the use of eldercare and home help; unmarried and single people, both men and women, are more likely to receive home help services and to move in to institutional care than those living with a spouse. Among persons 65 years or older in Gothenburg, 10 per cent receive home help (39). This is important when interpreting differences among participants with regard to activities in the household such as shopping for food or cooking.
Since participants already participated in the EPiR-study, many of them were motivated to answer an additional survey, which certainly contributed to the high response rate of 81 %. As the questionnaire was sent in advance, respondents were prepared and this made it easier for them to answer the questions during the telephone interview.
The questionnaire worked well, participants did not need explanation of the questions in detail. Even though it was extensive, respondents did not seem to get tired and they managed to answer adequately.
However, individuals with cognitive impairment had already been excluded from the EPiR interviews.
A weakness of this study is that we did not measure weight and height; these figures are self-reported. A measurement taken by the interviewer may have given a more reliable result, but was not possible due to telephone interview. Also, the study took place in two prosperous districts and as community demographics have an impact on public health interventions, this might have affected the results and limits generalisation (40).
The strength is that, to our knowledge, there are few studies concerning gender differences among elderly individuals living in their own homes regarding practice, knowledge and attitudes regarding food habits and meal patterns in accordance with their capability to maintain independence and health.
Power et al (41) studied the frequency of consumption of the major food groups among a group of elderly and detected gender differences especially among males aged 64-75 yrs. Maharana et al (42) studied gender differences concerning health and food expenditures and findings indicated a wide gender disparity, being higher among men than women, though narrowing the gap with time.


Results discussion

Almost half of the female respondents reported that they had changed their habits regarding cooking, meal patterns and choice of foods during recent years. However, both genders thought their appetite had remained stable since working age. Sidenvall et al (23, 43) found that elderly individuals were affected by changes in their family; a loss of a spouse could mean losing the whole meaning of cooking, resulting in meal skipping and decreased nutrition intake. The results in the present study are in agreement with the findings by Sidenvall el al; loneliness was expressed as a reason for not enjoying cooking or eating alone (23). Tinker (44) stated that, the older a person becomes, isolation is increasingly recognized as a dilemma, and according to Dykstra et al (45), the increase in loneliness can be different depending on earlier family structures, i.e. single-living individuals can be less lonely and the ones whose spouse has died show the greatest increase in loneliness. Locher et al (20) noted that social isolation, low income level and limited independency in later life contributed to nutritional risks. Gender was a risk factor for older person’s nutritional intake. McDonald and co-workers interviewed widowers to identify risk for nutrition problems and considered that socioeconomic factors, informal and formal support were important for being able to maintain nutritional self-management (46).
Sidenvall et al (23), also reported that  elderly women did not want to go to a local restaurant as they found it depressing to eat with sick and disabled persons, and they did not like to talk to persons in the restaurant who they did not know.
The municipality provides a few dining places for seniors where it is possible to have a nutritious meal, and company. One dining place also has a meal hostess who assists the guests, although they are not so frequently visited by the respondents in this study; the reasons why are unknown to us but would be interesting to study further.
In the 1950´s, 12 % of married women and 90 % of men were gainfully employed in Sweden (47). Since the country went through a social transition due to industrialization during the 20th century, women’s position in society gradually changed with a growing proportion of women working outside the home, particularly after the Second World War (48). In the first half of the 20th century, men commonly left home for work while women took care of the children and the household, and with it, the cooking for the family. Fjellström found in her thesis that among the older generation women have had the duty to prepare, serve and cook food, even among those with paid employment (49). Furthermore, it has been shown that cooking is closely linked with feminine identity (50).
We only asked a few questions about cooking and we did not know what cooking knowledge the respondents had from earlier in life. Many men expressed that they were not interested or were unable to cook. It might also be a generational issue that women go more often to the food stores and are responsible for shopping; as she is the one who does the cooking, she therefore knows what needs to be bought. If the woman has always been the one who was in charge in the kitchen, she still is (43).
Food avoidance due to health problems was expressed during the interviews; a few persons said that they avoided certain kinds of foods they thought were unhealthy. The cause however, differed. Avoidance of food among community-dwelling older adults is not well described in the literature. Savoca et al (51) has studied avoidance and modification of foods among the elderly related to their dental and oral status, finding it related to significant differences in dietary quality. Quandt et al (52) found that whole fruit and raw vegetables were the most commonly avoided foods, also due to oral health. Quandt et al (52) considers that dietary variation is associated with health maintenance and disease prevention among older adults. However, the risk of a lower intake of energy and nutrients due to avoidance for other reasons is not well described in the literature.
As shown in table 1, the dental status among the participants in this study seems good; only 5 % had dentures. A contributing reason could be, as stated, that the present population is in better condition than Swedish 80 year-olds in general, and dental status is  related to socioeconomic status (53). Social network and lifestyle factors are significant predictors for dental status as shown by Österberg et al (53), concerning 70-year olds in Gothenburg. This is also confirmed by Hugoson and Koch (54) for another area in Sweden. Petersen and Yamamoto (55) showed that loss of teeth (edentulism) is highly associated with socio-economic status and is prevalent among the elderly all over the world.
There are few previous studies looking at gender differences according to practice, knowledge and attitudes regarding food habits and meal patterns among elderly. Most of the earlier studies are focused on nutrient intakes, malnutrition, pharmaceutics or other diseases and have often been carried out in nursing homes or in younger populations (19,21,22,41,42,56–59).
Further studies of other socio-economic groups of older adults are needed. Whether the gender differences identified in the current study affect the development of frailty or malnutrition also remains to be studied in the future. Due to the increasing life expectancy and due to the lack of studies of older adults, there is a great need for knowledge and understanding of how food habits and meal patterns affect their capability to maintain independence and health and how gender influences these relationships. However, the findings in this study may indicate a possible gender difference in the need for societal support.


Conclusions

Women in the present study take a greater responsibility for the planning and cooking of meals than men, regardless of marital status. A large proportion of the men thought cooking was something they were not able to do. Both genders had a good or very good appetite and considered that their appetite had remained stable since working age. More than half of those who reported poor appetite were widows/widowers. Further studies of how food habits and meal patterns affect older people’s capability to maintain independence and how gender influences these relationships are needed.


Acknowledgements: This study was accomplished while Julie Johannesson was affiliated with the Swedish National Graduate School for Competitive Science on Ageing and Health (SWEAH), which is funded by the Swedish Research Council. The authors would like to thank the Vårdal Institute for financial support.

Conflict of interest: JJ, ER, SDI and FS have no conflicts of interest to declare.

Ethical Standards: The study complies with the current laws of Sweden. The Regional Ethical Review board in Gothenburg ref no: 650-07.


References

1.     WHO. Good health adds life to years Global brief for World Health Day 2012 [Internet]. 2012. Available from: http://www.who.int/world_health_day/2012
2.     Rinder L, Roupe S, Steen B, Svanborg A. 70-year-old people in Gothenburg A population study in an industrialized Swedish city.1. General Presentation of study. Acta Med Scand. 1975;198(5):397–407.
3.     Rothenberg E, Bosaeus I, Steen B. Intake of energy, nutrients and food items in an urban elderly population. Aging-Clinical Exp Res. 1993;5(2):105–16.
4.     Haveman-Nies A, De Groot LPGM, Burema J, Amorim Cruz J, Osler M, Van Staveren W. Dietary quality and lifestyle factors in relation to 10-year mortality in older Europeans: The SENECA Study. Am J Epidemiol. 2002;156(10):962–8.
5.     Stratton RJ, Green CJ, Elia M. Disease-related malnutrition. CABI; 2003.
6.     Boulos C, Salameh P, Barberger-Gateau P. Malnutrition and frailty in community dwelling older adults living in a rural setting. Clin Nutr. 2015 Jan 21;
7.     Bapen. Combating Malnutrition: recommendations for action [Internet]. 2009. Available from: http://www.bapen.org.uk/pdfs/reports/advisory_group_report.pdf
8.     Naseer M, Forssell H, Fagerström C. Malnutrition, functional ability and mortality among older people aged >60 years: a 7-year longitudinal study. Eur J Clin Nutr. Macmillan Publishers Limited; 2015 Nov 25;
9.     Sullivan DH, Sun S, Walls RC. Protein – Energy Undernutrition Among Elderly Hospitalized Patients A Prospective Study. JAMA, J Am Med Assoc. 1999;281(21):2013–9.
10.     Akner G, Cederholm T. Treatment of protein-energy malnutrition in chronic nonmalignant disorders. Am J Clin Nutr. 2001;74(1):6–24.
11.     Fried LP, Ferrucci L, Darer J, Williamson JD, Anderson G. Untangling the concepts of disability, frailty, and comorbidity: implications for improved targeting and care. J Gerontol A Biol Sci Med Sci. 2004;59(3):255–63.
12.     Fried LP, Tangen CM, Walston J, Newman AB. Frailty in older adults: Evidence for a phenotype. J Gerontol A Biol Sci Med Sci. 2001;56(3):M146–56.
13.     Morley JE, Vellas B, van Kan GA, Anker SD, Bauer JM, Bernabei R, et al. Frailty consensus: a call to action. J Am Med Dir Assoc. 2013 Jun;14(6):392–7.
14.     Hickson M. Malnutrition and ageing. Postgrad Med J. 2006;82(963):2–8.
15.     Shtereva N. Aging and oral health related to quality of life in geriatric patients. Rejuvenation Res. 2006;9(2):355–7.
16.     Rawson NE. Olfactory loss in aging. Sci Aging Knowledge Environ. 2006 Feb 8;2006(5):pe6.
17.     Statistiska Centralbyrån. Sveriges befolkning efter kön och ålder 31 december 2014 – Statistiska centralbyrån [Internet]. 2015 [cited 2015 Apr 17]. Available from: http://www.scb.se/sv_/Hitta-statistik/Statistik-efter-amne/Befolkning/Befolkningens-sammansattning/Befolkningsstatistik/25788/25795/Helarsstatistik—Riket/262459/
18.     Socialstyrelsen. Befolkningsstatistik för äldreomsorgen 2012. [Internet]. 2012 [cited 2015 Jul 3]. Available from: http//:www.socialstyrelsen.se/statistik/statistikdatabaser/aldreomsorg
19.     Vitolins MZ, Quandt SA, Case LD, Bell RA, Arcury TA, McDonald J. Ethnic and Gender Variation in the Dietary Intake of Rural Elders. J Nutr Elder. 2000;19(December 2013):15–29.
20.     Locher JL, Ritchie CS, Roth DL, Sawyer Baker P, Bodner E V, Allman RM. Social isolation, support, and capital and nutritional risk in an older sample: ethnic and gender differences. Soc Sci Med. 2005 Feb;60(4):747–61.
21.     Quandt SA, Chao D. Gender Differences in Nutritional Risk Among Older Rural Adults. J Appl Gerontol. 2000;19(2):138–50.
22.     Hendy HM, Nagle TR. A critical examination of gender differences in nutritional risk for rural adults with disability. Rehabil Psychol. 2002;47(2):219–29.
23.     Sidenvall B, Nydahl M, Fjellström C. The Meal as a Gift–The Meaning of Cooking Among Retired Women. J Appl Gerontol. 2000;19(4):405–23.
24.     Wham CA, Bowden JA. Eating for health: perspectives of older men who live alone. Nutr Diet. 2011;68(3):221–6.
25.     de Morais C, Oliveira B, Afonso C, Lumbers M, Raats M, de Almeida MD V. Nutritional risk of European elderly. Eur J Clin Nutr. Nature Publishing Group; 2013;67(11):1215–9.
26.     Saka B, Kaya O, Ozturk GB, Erten N, Karan MA. Malnutrition in the elderly and its relationship with other geriatric syndromes. Clin Nutr [Internet]. Elsevier Ltd; 2010;29(6):745–8. Available from: http://dx.doi.org/10.1016/j.clnu.2010.04.006
27.     Gustafsson S. Health-promoting intervention for community-dwelling older adults Focusing on the concept of frailty and intervention outcome. 2012.
28.     SCB. Befolkningens sammansättning 2014 Sverige [Internet]. 2014 [cited 2015 Sep 30]. Available from: http://scb.se/sv_/Hitta-statistik/Statistik-efter-amne/Befolkning/Befolkningens-sammansattning/Befolkningsstatistik/#c_li_120253
29.     Gustafsson S, Wilhelmson K, Eklund K, Gosman-Hedström G, Zidén L, Kronlöf G, et al. Health-promoting interventions for persons aged 80 and older are successful in the short term–results from the randomized and three-armed Elderly Persons in the Risk Zone study. J Am Geriatr Soc. 2012 Mar;60(3):447–54.
30.     Folstein MF, Folstein SE, McHugh PR. “Mini-mental state.” J Psychiatr Res. 1975 Nov;12(3):189–98.
31.     Augustsson O, Eriksson BG, Rosenhall U, Rothenberg E, Wärne B, Steen B. The Johanneberg study–a sociomedical survey in an urban elderly population. I. General presentation of the study including an analysis of non-response and identification of risk groups. Scand J Soc Med. 1994;22(4):283–92.
32.     Bertéus Forslund H, Lindroos AK, Sjöström L, Lissner L. Meal patterns and obesity in Swedish women-a simple instrument describing usual meal types, frequency and temporal distribution. Eur J Clin Nutr. 2002 Aug;56(8):740–7.
33.     OxfordDictionaries.com. Oxford Advanced Learner’s Dictionary [Internet]. 2015 [cited 2015 Dec 14]. Available from: http://www.oxforddictionaries.com/definition/english
34.     Beck M, Ovesen L. At which body mass index and degree of weight loss should hospitalized elderly patients be considered at nutritional risk? Clin Nutr. 1998;17(5):195–8.
35.     Dahlin-Ivanoff S, Gosman-Hedström G, Edberg A-K, Wilhelmson K, Eklund K, Duner A, et al. Elderly persons in the risk zone. Design of a multidimensional, health-promoting, randomised three-armed controlled trial for “prefrail” people of 80+ years living at home. BMC Geriatr. 2010;10(27).
36.     Socialstyrelsen, Folkhälsoinstitutet. Folkhälsan i Sverige. 2013.
37.     Lindblad A, Rothenberg E, Dahlin-Ivanoff S, Bosaeus I. Body composition and hand grip strength in healthy community-dwelling older adults in sweden. J Aging Res Clin Pract. 2015;4(1):54–8.
38.     Larsson K, Kåreholt I, Thorslund M. Care utilisation in the last years of life in Sweden: the effects of gender and marital status differ by type of care. Eur J Ageing. 2014 Sep 10;11(4):349–59.
39.     Samhällsanalys och fakta Göteborgs stadsledningskontor. Äldres boende 2014 – områdesfakta [Internet]. 2014. Available from: http://www4.goteborg.se/prod/G-info/statistik.nsf
40.     Rychetnik L. Criteria for evaluating evidence on public health interventions. J Epidemiol Community Heal. 2002 Feb 1;56(2):119–27.
41.     Power SE, O’Connor EM, Jeffery IB, O’Toole PW, Fitzgerald GF. Gender differences in food intake among Irish community-dwelling elderly subjects: The ELDERMET project. Proc Nutr Soc. 2012;71(July):2012.
42.     Maharana B, Ladusingh L. Gender Disparity in Health and Food Expenditure in India among Elderly. Int J Popul Res. 2014;2014:1–8.
43.     Sidenvall B, Nydahl M, Fjellström C. Managing food shopping and cooking: the experiences of older Swedish women. Ageing Soc. 2001;21(July 2001):151–68.
44.     Tinker A. Older people in modern society. Longman; 1997.
45.     Dykstra PA. Changes in Older Adult Loneliness: Results From a Seven-Year Longitudinal Study. Res Aging. 2005 Nov 1;27(6):725–47.
46.     McDonald J, Quandt S, Arcury T, Bell R. On their own: Nutritional self-management strategies of rural widowers. Gerontologist. 2000;40(4):480–91.
47.     Nyberg A. Arbetsmarknadsstatistiken – Ideologi eller verklighet? Arbetsmarknad & Arbetsliv. 2005;11(1).
48.     Gammal i folkhemmet | Nordiska museet [Internet]. [cited 2015 Jun 21]. Available from: http://www.nordiskamuseet.se/artiklar/gammal-i-folkhemmet
49.     Fjellström C. Drömmen om det goda livet: Livskvalitet och matvanor i ett uppväxande industrisamhälle: Stocka sågverk 1870-1980 [The dream of the good life] [Internet]. [Stockholm]: Almqvist & Wiksell International; 1990 [cited 2015 Apr 16]. Available from: http://lunda.ub.gu.se:8080/lib/item?theme=gunda&locale=sv&id=chamo:485385
50.     L’Orange Fürst E. Cooking and femininity. Womens Stud Int Forum. 1997;20(3):441–9.
51.     Savoca MR, Arcury TA, Leng X, Chen H, Bell RA, Anderson AM, et al. Association between dietary quality of rural older adults and self-reported food avoidance and food modification due to oral health problems. J Am Geriatr Soc. 2010;58(7):1225–32.
52.     Quandt SA, Chen H, Bell RA, Savoca MR, Anderson AM, Leng X, et al. Food avoidance and food modification practices of older rural adults: association with oral health status and implications for service provision. Gerontologist. 2010 Feb;50(1):100–11.
53.     Österberg T, Johanson C, Sundh V, Steen B. Secular trends of dental status in five 70-year-old cohorts between 1971 and 2001. Community Dent Oral Epidemiol. 2006;34(6):446–54.
54.     Hugoson A, Koch G. Thirty year trends in the prevalence and distribution of dental caries in Swedish adults (1973-2003). Swed Dent J. 2008;32(2):57–68.
55.     Petersen PE, Yamamoto T. Improving the oral health of older people: the approach of the WHO Global Oral Health Programme. Community Dent Oral Epidemiol. 2005;33(2):81–92.
56.     Basara BB, Mollahaliloglu S, Pulgat E, Kavuncubasi S. Gender and Residency Effects on Elderly Health in Turkey. Ageing Int. 2012 Aug 26;39(1):55–67.
57.     Jeon GS, Jang SN, Rhee SJ, Kawachi I, Cho SI. Gender Differences in Correlates of Mental Health Among Elderly Koreans. Journals Gerontol Ser B Psychol Sci Soc Sci. 2007 Sep 1;62(5):S323–9.
58.     Laudisio A, Marzetti E, Antonica L, Pagano F, Vetrano DL, Bernabei R, et al. Metabolic syndrome and quality of life in the elderly: age and gender differences. Eur J Nutr. 2013 Feb;52(1):307–16.
59.     O’Connor EM, Fitzgerald GF, O’Toole PW. Gender differences in folate status are associated with cognition in healthy Irish elderly adults. Proc Nutr Soc. 2011 Aug 15;70(OCE3):E64.

DIETARY INADEQUACIES IN THE ELDERLY WITH ALZHEIMER’S DISEASE FOLLOWED AT THE REFERENCE HEALTH CENTER FOR ELDERLY CARE IN CURITIBA – BRAZIL


D. Rodrigues Lecheta1, M.E. Madalozzo Schieferdecker1, A.P. de Mello2, I. Berkenbrock3, J. Cardoso Neto1, E.M.C. Pereira Maluf1

1. Federal University of Paraná, Brazil ; 2. Clinical Hospital of Federal University of Paraná, Brazil; 3. Curitiba Municipal Secretary of Health, Brazil

Corresponding Author: Danielle Rodrigues Lecheta, Federal University of Paraná, Brazil, 54, Osman Ahamad Gebara street, Parque Alvorada, Zip code 79823-461, Dourados/MS, Brazil, Telephone numbers: (005567) 3032-6360 / (005567) 8171-3288, danilecheta@gmail.com


Abstract

Background: Dietary changes are frequent in Alzheimer’s disease (AD). Objective: to assess the dietary intake of elderly with AD. Design: cross sectional study. Setting: AD patients followed at the Health Center of Elderly Care Ouvidor Pardinho, in Curitiba/Brazil, from November/2010 to July/2011. Participants: 96 individuals. Measurements: the scales used were the Mini Nutritional Assessment to determine the nutritional status and the Clinical Dementia Rating to set the stage of dementia. The average food intake of three days was analyzed for energy, carbohydrates, protein, fat, vitamin A, vitamin C, calcium, iron and liquids, and compared with the individualized nutritional recommendations. Results: 96 elderly patients were evaluated. The mean age was 78.0 ± 6.52 years, and most of them had mild AD (54.2%) and risk of malnutrition (55.2%). All of them were oral fed and 37.5% received modified consistency food. Regarding independence for feeding: 44.8% of the elderly needed assistance to serve food, 31.3% did not eat when the meal was not offered by the caregiver, and 31.3% ate less than usual. Regarding dietary adequacy: 41.7% had low-calorie diet, 46.9% low-protein diet, and most of the patients had insufficient intake of vitamins A and C, calcium and iron. Decreased appetite occurred in 31.3% of the elderly. Conclusion: the dietary intake of AD patients is inadequate when compared with nutritional recommendations. Caregivers should be informed about the need of specialized nutritional monitoring and feeding assistance for the demented patient since the early stage of the disease.

Key words: Alzheimer disease, diet, nutritional status.


Introduction

Alzheimer’s disease (AD) is the most common type of dementia, accounting for 60 to 70% of the cases (1). The loss of memory is one of the earliest and most pronounced symptoms. As the disease advances, trouble with language, intellectual performance, independence and autonomy are frequent (2). It is also usual dietary changes, as decreased appetite, difficulty with chewing, dysphagia, food refusal (2, 3, 4) and body composition alterations, such as unintentional weight loss (3), accelerated loss of muscle mass and sarcopenia (5, 6). Studies have described the high prevalence of malnutrition in elderly patients with AD (7,8) and their poorer nutritional and functional status compared to the ones without dementia (9).

The etiology of weight loss and malnutrition in AD seems to be multifactorial. Several hypotheses have been proposed to explain it, but none has been proven (3). It is presently unclear whether the energy imbalance and the accompanying weight loss associated with AD are caused by reduced energy intake, elevated energy expenditure, or a combination of both (5). Also, it is possible that the causes vary depending on the stage of dementia. Early in the disease, when the patient is still able to self-feed, malnutrition may be related to behavioral disorders, associated depression or other comorbidities (10), while in advanced stages, behavioral disturbances, cognitive deficit, impossibility of eating without help and dysphagia assume a central role (11). According to Roque, Salva and Vellas (10), demented patients who are dependent for eating have a relative risk of 8.25 for malnutrition.

Some researchers have examined the adequacy of diets offered to these patients and found that the diets were adequate (12) or suboptimal (7, 8). However, other studies showed that the weight loss was not accompanied by decreased energy intake (3, 13).

The aim of this study is to assess the dietary intake of AD patients followed at the Health Center of Elderly Care.

Methods

This is a cross sectional study. The research project was approved by the Ethics Committee of Curitiba Municipal Secretary of Health, with protocol number 132/2010. The study included elderly patients with the diagnosis of probable AD, followed at the Health Center of Elderly Care Ouvidor Pardinho, which is the reference to assist the elderly with AD in the city of Curitiba (southern Brazil), users of the public health system. The diagnosis of probable AD was made according to the criteria of the National Institute of Neurological and Communicative Disorders and Strokes – Task Force on Alzheimer’s Disease (14). The minimum sample size was estimated at 90 individuals, considering confidence interval of 95% and margin of error of less than 10%.

The inclusion criteria were: to be 60 years old or more, to have the diagnosis of probable AD and to be accompanied by the primary caregiver for data collection. The exclusion criteria were: to reside in long-term care institutions, to have chronic renal or heart failure or consumptive diseases, to be unable to stand up to assess the current weight and primary caregiver unable to write the food record.

The patients screening was done by a geriatrician doctor from November 2010 to July 2011. Written instructions and the forms for food record were given to the caregiver and the date for the data collection was scheduled.

After the caregiver and/or the patient signed the Informed Consent Form, the patient was assessed by a trained nutritionist. Information about feeding, and also demographic, economic and cultural data was collected in the interview. The stage of AD was classified in mild, moderate and severe according to the Clinical Dementia Rating (CDR) (15, 16). The Mini Nutritional Assessment (MNA) (17) was performed to determine the nutritional status of the elderly; scores greater than 23.5 indicate normal weight, 17 to 23.5 nutritional risk and under 17 malnutrition. In the items of MNA regarding perceived health and nutritional status, it was considered the responses provided by the caregiver.

The anthropometric assessment was performed according to standard techniques; weight, height, arm circumference (AC), calf circumference (CC), triceps skinfold (TSF) and subscapular skinfold were collected. Circumferences and skinfolds were obtained on the right side, assessed three times and then the average value was figured. Arm muscle circumference (AMC) was calculated (AMC = AC (cm) – π x [TSF (mm) / 10]). Body Mass Index (BMI) was calculated (BMI (kg/m2) = weight / height2) and the result was interpreted as the reference values for elderly population: underweight, less than 22 kg/m2; normal weight, from 22 to 26.9; and overweight, 27 or more.

The following biochemical tests were performed: hemoglobin, total lymphocytes, albumin and total cholesterol. The reference values for adequate nutritional status were: hemoglobin ≥ 12.0 g/dl in females and ≥ 14.0 g/dL for males; total lymphocytes ≥ 2000/mm3; albumin ≥ 3.5 g/dl; and total cholesterol ≥ 150 mg/dl (18).

The food intake of the patients was analyzed with the three day food record, registered by the caregivers. The nutrient intake was calculated using the software Avanutri version 4.0, for energy, carbohydrate, protein, fat, vitamin A, vitamin C, calcium, iron and liquids. The values were obtained by the average intake of the three days.

The energy recommendation was according to the DRIs (Dietary Reference Intake), through the prediction equations proposed for the calculation of total energy expenditure (TEE) (19), which considers gender, age, weight, height and physical activity. For weight gain, the energy recommendation was 30 to 35 calories per kilogram of body weight (20). The protein recommendation was 1.0 g of protein per kilogram of body weight (20); higher values were used in the presence of wounds or hypoalbuminemia. The liquid recommendation was 25 to 30 ml per kilogram of body weight (20) or more if diarrhea or fever.

The micronutrients recommendations were according to the DRIs. For elderly men: 900 μg/d of vitamin A (as retinol equivalents), 90 mg/d of vitamin C, 1200 mg/d of calcium and 8 mg/d of iron. For elderly women: 700 μg/d of vitamin A (as retinol equivalents), 75 mg/d of vitamin C, 1200 mg/d of calcium and 8 mg/d of iron.

Statistical analysis was performed with SPSS Statistics 17.0, Statgraphics Centurion and software R version 2.13.0. The nonparametric Kruskal-Wallis test was used to compare the values of the variables among the different stages of AD (mild, moderate and severe). The nonparametric chi-square test to assess differences in frequencies among groups of variables. For variables with statistically significant difference, the multiple comparisons test was used to check for pairs of groups in which differences were found. In all statistical analysis p <0.05 was considered statistically significant.

Results

Among the 328 screened patients, 187 were eligible for the study. Of these, 96 patients and caregivers agreed to participate and were evaluated. Ninety-one respondents refused to participate; in 79 cases the caregiver refused and in 12 cases the patient did. The main reasons given were lack of time and difficulty in taking the elderly to the health center.

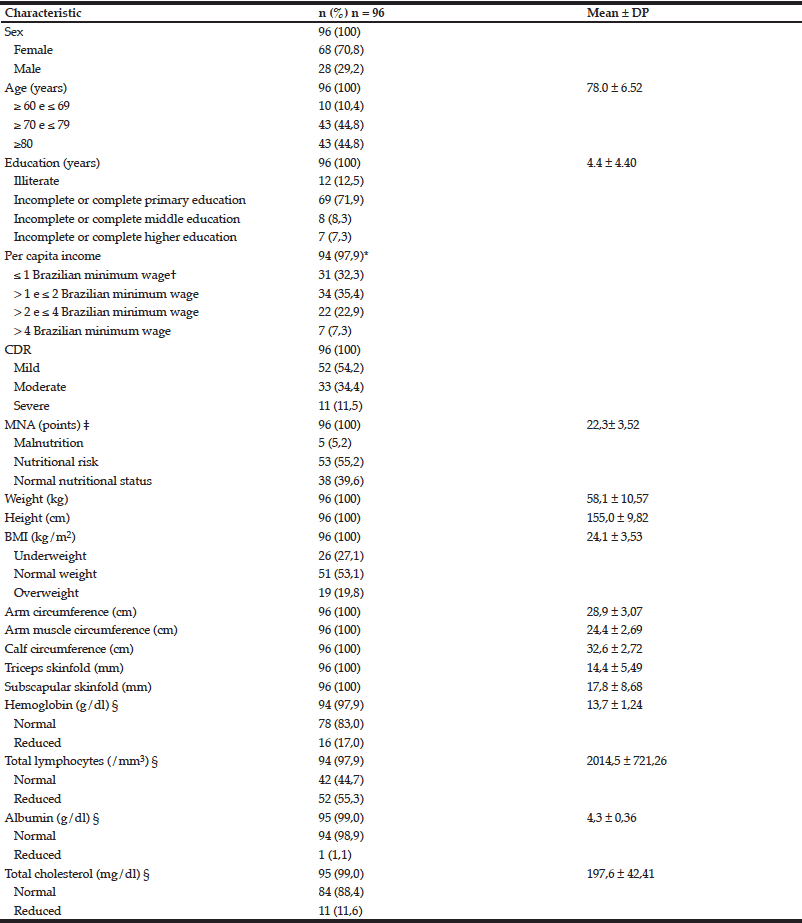
The population of the study is predominantly female (n = 68, 70.8%) with mean age of 78.0 years (± 6.52), ranging from 60 to 94 years. Most of the individuals had mild AD (n = 52, 54.2%) and were at risk of malnutrition according to MNA (n = 53, 55.2%). According to the criteria of BMI, 53.1% of them had normal nutritional status (n = 51) and 27.1% were underweight (n = 26). Biochemical evaluation highlights a large number of individuals with reduced lymphocyte values (n = 52, 55.3%). Table 1 provides further information on the characteristics of the patients.

Table 1 Characteristics of patients with Alzheimer disease

CDR = Clinical Dementia Rating; MNA = Mini Nutritional Assessment; BMI = Body Mass Index; * Two caregivers refused to inform the family income; † The Brazilian minimum wage in 2011 was R$ 545.00. In the same year, the exchange rate of the Brazilian currency Real (R$) to U.S. dollars (US$) was 1.67 R$/US$ (21). Thus, one Brazilian minimum wage was equivalent to US$ 326,35; cymbalta ‡ Range: 0 – 30 points; the lowest score is the most severe; § There were some missing biochemical information for some patients.

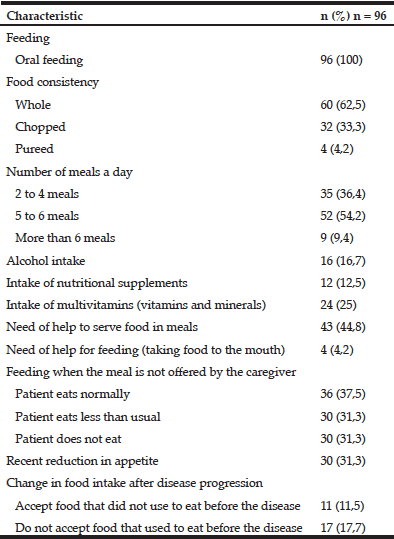
Regarding diet (table 2), all patients were oral fed and 62.5% (n = 60) received normal consistency food. Most of them were independent for feeding (taking food to the mouth) (n = 92, 95.8%), but 44.8% of them (n = 43) needed help to serve food during meals. When caregivers were asked if the patients had the initiative to self-feed when the meal was not offered by the caregiver, for example when they were alone, 31.3% (n = 30) answered that in this case the patients did not eat, and other 31.3% (n = 30) that they ate less than usual.

Table 2 The feeding of patients with Alzheimer disease

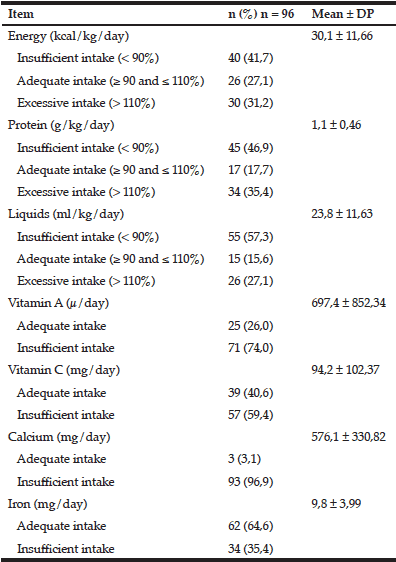
Table 3 presents data on the average daily food intake of the study population, demonstrating the dietary inadequacy of most patients.

Table 3 Food intake of patients with Alzheimer disease

When asked if the caregiver had doubts about the patient´s diet, 39.6% (n = 38) answered affirmatively.

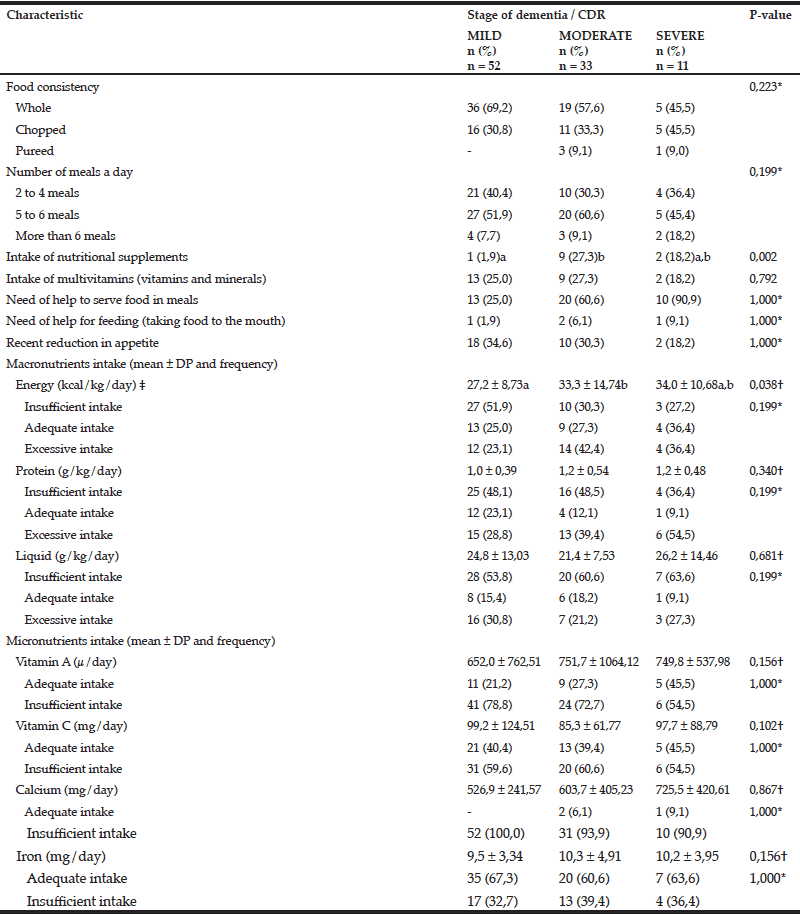
The feeding profile of the studied population was analyzed considering the different stages of dementia (table 4). Statistically significant difference was found between the mean values of energy intake in mild and moderate stages, with significantly lower values in the mild stage (p = 0.038). Also, there was statistically significant difference in the intake of nutritional supplements between mild and moderate stage (p=0,002).

Table 4 The feeding of patients, according to the stage of Alzheimer´s disease

CDR = Clinical Dementia Rating; * Chi-square test was used to assess differences in frequencies among the three groups of variables, considering significance level p < 0,05; † Kruskal-Wallis test was used to 60 cymbalta compare the mean values among the three groups, considering significance level p < 0,05; ‡ Since p value was significant (p <0.05), the Multiple Comparisons Test (considering significance level p < 0,05) was used to check for pairs of groups in which differences were found (mild vs moderate, mild vs severe, moderate vs. severe), represented by superscript letters. When the letters are different, there is a statistically significant difference between the pairs; when the letters are the same, no significant difference was found between the pairs.

Discussion

The poor nutritional status of the studied population was evident with the results from MNA: 55.2% of the elderly were at risk of malnutrition and 5.2% malnourished. However, when BMI is used, most of them have the diagnosis of normal weight (53.1%) and 27.1% underweight. MNA probably reflects better the nutritional status of the elderly when compared to BMI because it considers more anthropometric measures, including those for muscle mass, as well as patient´s medical history and diet.

The immunodeficiency of the study population should call attention, as 55.3% of the sample presented reduced lymphocytes values. According to Guigoz (22), immune function is impaired in the elderly with MNA score indicative of malnutrition.

This study highlights the difficulties related to feeding experienced by patients with AD and caregivers, which include the composition of the daily menu and the management of difficulties during meals. These difficulties might be related to the poor nutritional status found.

The change in the dietary patterns of older people with dementia, or even with mild cognitive impairment, was described in the study of Orsitto (8), in which these individuals had significantly lower scores on items of MNA about patient´s diet, when compared to the ones without cognitive impairment (p <0.001). In a prospective study about the clinical course of advanced dementia, Mitchell et al. (4) found that 86% of the evaluated elderly patients had eating problems during the study period, including weight loss, trouble with chewing or swallowing, refusal to eat or drink, suspected dehydration and persistently reduced oral intake. In advanced stage of dementia, these changes were associated with a 6-month mortality rate of 38.6% (4).

All subjects of the study were exclusively oral fed and 95.8% of them could self-feed, which reinforces the information that eating is typically the last basic activity of daily living (BADL) to become impaired in AD (23). Anyway, most patients need the caregiver to organize, offer the meal and serve the food to provide their food intake, which means they are semi-dependent for feeding.

Over 30% of primary caregivers mentioned patient´s recent reduced appetite, and the frequency of this complaint seems to increase with worsening nutritional status. Previous studies have also reported high prevalence of appetite disorders in this population (24). Most patients had up to four meals a day, when the recommendation is at least five meals a day.

The mean energy and protein intake of elderly patients, with values normalized to body weight, were 30.1 kcal/kg/day ± 11.66 and 1.1 g protein/kg/day ± 0.46 respectively; values which give rise to the false interpretation that the diet is adequate, despite the high standard deviation in the average energy intake. Jesus et al. (7) found average intake of 27.1 ± 8.7 kcal/kg/day and 1.1 ± 0.4 g protein/kg/day; Machado et al. (12) found 26.4 and 26.3 kcal/kg/day and 0.9 and 1.2 g protein/kg/day in patients with mild and moderate stage of dementia respectively, values which are also apparently normal. In the present study the results were stratified according to the adequacy of nutrients intake for each patient, comparing consumption with the individualized nutritional recommendations, and thus, the high prevalence of dietary inadequacy of the studied population was evident. It is noteworthy that 41.7% of the patients consumed low calorie diets and 46.9% had low protein diets, beyond insufficient intake of vitamins A and C, calcium and iron. These results support the hypothesis that low energy intake may contribute to unintentional weight loss in individuals with AD (5). According to Castaneda et al. (25), insufficient protein intake may result in loss of lean tissue, immune response and muscle function.

The poor diets may be related to patient´s low education, since 71.9% of them attended only primary school, and to low-income, as 67.7% of families earned up to 2 Brazilian minimum wages per member. The brain disorder can also impair the regulation of food intake by the central nervous system (2, 6). Spaccavento et al. (2) hypothesized that changes in dietary habits and the onset of functional, cognitive and neuropsychiatric disorders in patients with AD reflect the involvement of a common neuroanatomical network. This can be due to the involvement of the prefrontal area with cortical and subcortical circuits, in programmed movement, behavioral control and in eating behavior regulation (2).

Only 12.5% of the patients received nutritional supplements regularly and 25% were taking multivitamin, perhaps due to

pharmacy technician online course canada / online pharmacy / canadian pharmacy scams / generic viagra / cialis for daily use review / online pharmacy reviews / http://pharmacyincanada-online.com/ / viagra online canadian pharmacy

the low purchasing power of the families or because they did not know these products. Despite the high prevalence of nutritional risk, the study population is not routinely assessed by dietitians and, thus, it is likely that dietary errors are not identified and treated promptly.

The patients in the mild stage of AD had significantly lower mean energy intake when compared to the ones in the moderate stage. Since patients in the mild stage usually have good level of independence for BADL, it is possible that they are not adequately monitored by caregivers with regard to food intake, despite the presence of some subtle negative changes in diet due to cognitive and behavioral impairment, which may influence the amount of ingested nutrients. In the study of Lin, Watson and Wu (26), patients with moderate feeding difficulties, but who could still self-feed, were ignored by the staff of the long-term care institutions where the study was conducted, whereas those with severe dependency who required feeding by nursing staff had better food intake. In both cases, patients who received more family visits at mealtimes, when family was encouraged to assist in the feeding of their relative, had better food intake (26).

The higher percentage of patients with adequate intake of vitamin A, vitamin C and calcium in severe stage of dementia may be due to the fact that their diets are more often chosen by caregivers, who probably select food of better nutritional quality.

After conducting a literature review about interventions that can be undertaken to establish and maintain adequate nutritional intake in older people with dementia, Cole (27) concluded that there is not a standardized intervention. The findings suggest that providing adequate training for staff and allowing more time to assist patients feeding have positive effects. Other interventions mentioned were: engaging the advice of a dietitian, introduction of nutritional supplements, improvements in the mealtime environment and providing assistance with feeding before dietary intake declines dramatically (27).

The inadequate diet of the subjects is an important finding of this study and should call attention of health services for intervention. Diet influences the nutritional and clinical course of patients and thus, nutritional intervention should be early, appropriate and carried out by qualified dietitians. Some studies have been published suggesting that nutritional education programs intended for caregivers of AD patients could have a positive effect on patients and may improve weight, cognitive function (28), nutritional and immune status (29) and reduce the risk of malnutrition (30) in older individuals with dementia.

As a conclusion, caregivers should be informed about the need of specialized nutritional counseling and feeding assistance for the demented person since the early stage of the disease, when negative subtle changes may occur in dietary intake due to cognitive and behavioral impairment. These interventions may prevent the worsening of nutritional status and prognosis.

This study had some methodological limitations. The sample of patients with severe dementia was small, because the survey was conducted on an outpatient basis, which makes their access difficult. Also, the most fragile patients were excluded because of their impossibility to stand to weight. Studies should be directed to populations with these conditions.

Disclosures: Danielle Rodrigues Lecheta reports no conflicts of interest. Maria Eliana Madalozzo Schieferdecker reports no conflicts of interest. Ana Paula de Mello reports no conflicts of interest. Ivete Berkenbrock reports no conflicts of interest. João Cardoso Neto reports no conflicts of interest. Eliane Mara Cesário Pereira Maluf reports no conflicts of interest.

Funding: This study had no sponsors.

Acknowledgments: The authors gratefully acknowledge the participation of the patients and their caregivers, and the contribution of the staff of Health Center of Elderly Care Ouvidor Pardinho.

References

1. WHO, World Health Organization. Dementia: a public health priority. 2012. World Health Organization, Geneva.

2. Spaccavento S, Prete MD, Craca A, Fiore P. Influence of nutritional status on cognitive, functional and neuropsychiatric deficits in Alzheimer´s disease. Arch Gerontol Geriatr 2009; 48:356-360.

3. Gillette-Guyonnet S, Nourhashémi F, Andrieu S, et al. Weight loss in Alzheimer disease. Am J Clin Nutr 2000; 71:637S-642S.

4. Mitchell SL, Teno JM, Kiely DK, et al. The clinical course of advanced dementia. N Engl J Med 2009; 361:1529-1538.

5. Poehlman ET, Dvorak RV. Energy expenditure, energy intake, and weight loss in Alzheimer disease. Am J Clin Nutr 2000; 71:650S-655S.

6. Burns JM, Johnson DK, Watts A, Swerdlow RH, Brooks WM. Reduced lean mass in early Alzheimer disease and its association with brain atrophy. Arch Neurol 2010; 67:428-433.

7. Jesus P, Desport JC, Massoulard A, et al. Nutritional assessment and follow-up of residents with and without dementia in nursing homes in the Limousin region of France: a health network initiative. J Nutr Health Aging 2012; 16:504-508.

8. Orsitto G. Different components of nutritional status in older inpatients with cognitive impairment. J Nutr Health Aging 2012; 16:468-471.

9. Zekry D, Herrmann FR, Grandjean R, et al. Demented versus non-demented very old inpatients: the same comorbidities but poorer functional and nutritional status. Age ageing 2008; 37:83-89.

10. Roque M, Salva A, Vellas B. Malnutrition in community-dwelling adults with dementia (NutriAlz trial). J Nutr Health Aging 2013; 17:295-299.

11. Isaia G, Mondino S, Germinara C, et al. Malnutrition in an elderly demented population living at home. Arch Gerontol Geriatr 2011; 53:249-251.

12. Machado J, Caram CLB, Frank AA, Soares EA, Laks J. Estado nutricional na doença de Alzheimer. Rev Assoc Med Bras 2009; 55:188-191.

13. Wang PN, Yang CL, Lin KN, Chen WT, Chwang LC, Liu HC. Weight loss, nutritional status and physical activity in patients with Alzheimer disease: a controlled study. J Neurol 2004; 251:314-320.

14. McKhann G, Drachman D, Folstein M, Katzman R, Price D, Stadian EM. Clinical diagnosis of Alzheimer´s disease: report of the NINCDS-ADRDA Work Group under the auspices of Department of Health and Human Services Task Force on Alzheimer´s Disease. Neurology 1984; 34:939-944.

15. Hughes CP, Berg L, Danziger WL, Coben LA, Martin RL. A new clinical scale for the staging of dementia. Br J Psychiatry 1982; 140:566-572.

16. Morris J. The Clinical Dementia Rating (CDR): current version and scoring rules. Neurology 1993; 43:2412-2414.

17. Guigoz Y, Vellas B, Garry PJ. Mini nutritional assessment: a practical assessment tool for grading the nutritional state of elderly patients. Fact and Research in Gerontology 1994; 2:15-59.

18. Bottoni A, clomid dosage Oliveira GPC, Ferrini MT, Waitzberg DL. Avaliação nutricional: exames laboratoriais. In: Waitzberg DL. Nutrição oral, enteral e parenteral na prática clínica, 3rd edn. 2006. Atheneu, São Paulo, pp 279-294.

19. Institute of Medicine. Food and Nutrition Board. Dietary Reference Intakes for energy, carbohydrates, fiber, fat, protein and amino acids (macronutrients). 2005. National Academy Press, Washington.

20. ASPEN, American Society for Parenteral and Enteral Nutrition. The ASPEN nutrition support practice manual. 1998. ASPEN, Silver Spring.

21. Brasil, Banco Central do Brasil. Taxas de câmbio do real. 2013. http://www.ipeadata.gov.br/ Acessed 13 December 2013.

22. Guigoz Y. The mini nutritional assessment (MNA®): review of the literature – what does it tell us? J Nutr Health Aging 2006; 10:466-487.

23. Cervo FA, Bryan L, Farber S. To PEG or not to PEG: a review of evidence for placing feeding tubes in advanced dementia and the decision-making process. Geriatrics 2006; 61:30-35.

24. Salva A, Andrieu S, Fernandez E, et al. Health and nutritional promotion program for patients with dementia (NutriAlz study): design and baseline data. J Nutr Health Aging 2009; 13:529-537.

25. Castaneda C, Charnley JM, Evans WJ, Crim MC. Elderly women accommodate to a low-protein diet with losses of body cell mass, muscle function, and immune response. Am J Clin Nutr 1995; 62:30-39.

26. Lin L, Watson R, Wu S. What is associated with low food intake in older people with dementia? J Clin Nurs 2010; 19:53-59.

27. Cole D. Optimising nutrition for older people with dementia. Nurs Stand 2012; 26: 41-48.

28. Riviere S, Gillette-Guyonnet S, Voisin T, et al. A nutritional education program could prevent weight loss and slow cognitive decline in Alzheimer´s disease. J Nutr Health Aging 2001; 5:295-299.

29. Pivi GAK, Silva RV, Juliano Y, et al. A prospective study of nutrition education and oral nutritional supplementation in patients with Alzheimer´s disease. Nutrition Journal 2011; 10:1-6.

30. Salva A, Andrieu S, Fernandez E, et al. Health and nutrition promotion program for patients with dementia (NutriAlz study): cluster randomized trial. J Nutr Health Aging 2011; 15:822-830.

NUTRIENT INTAKE AND NUTRITIONAL STATUS OF THE AGED IN LOW INCOME AREAS OF SOUTHWEST, NIGERIA


W.A.O. Afolabi, I.O. Olayiwola, S.A. Sanni, O. Oyawoye


Department of Nutrition and Dietetics, College of Food Science and Human Ecology, Federal University of Agriculture, Abeokuta Ogun State Nigeria

Corresponding Author: W.A.O. Afolabi, Department of Nutrition and Dietetics, College of Food Science and Human Ecology, Federal University of Agriculture, Abeokuta Ogun State Nigeria, Email: afolabiwao@yahoo.com, Mobile: +234 803 475 0655


Abstract

Objective: The study was carried out to assess the nutrient intake and nutritional status of free living and non-institutionalized elderly Nigerian men and women residing in low income areas. Design, Setting and Participants: The study was cross sectional involving 140 (58-99 years) apparently healthy elderly subjects randomly selected across four low income urban and rural areas of southwest Nigeria. Measurements: Data on socio economic characteristics and dietary intake (24-hour recall) were obtained with a structured questionnaire while anthropometric data were measured and nutritional status indices were classified using WHO standards. Nutrient intake data was compared to DRI while other data were analyzed using Statistical Package for Social Sciences version 16.0. Results: Majority (84.3%) of the respondents were married and illiterate (80%). Most popular occupation were farming (47%) and trading (35.7%). Half of the respondents earn ≤ NGN1, 000 (≤US$6) and only 27% earn ≥ N6000 (US$37) monthly. The mean weight, height and arm circumference for men were 59.7 ± 6.50kg, 1.61±10.564m and 27.5 ± 9.24 cm respectively while that for women were 56.3 ± 5.72 kg, 1.57 ± 4.37m and 27.0 ± 5.22cm respectively. The mean daily energy (1805.2Kcal) and protein (23g) intake of women were significantly (p<0.05) lower than that of men (2044Kcal and 27.7g respectively). Intake of protein, calcium, riboflavin, niacin and vitamin C for both men and women were below DRI while iron, phosphorus, thiamine and energy intakes were adequate. Prevalence of underweight was low (2.9%) in this study while that overweight (pre obesity) was high (20% for men and 22.8% for women). Weight and BMI are significantly influenced by energy intake of the men (r=0.439, p=0.008); (r=0.352,p=0.038) and not women (r=0.229,p=0.186; r=0.320,p=0.06 respectively) while arm circumference was significantly (p<0.05) influenced by protein intake of both men and women (r=0.333,p=0.04 and r=0.404,p=0.02) respectively. Conclusion: This study has established a less than adequate intake of protein and some micronutrients among the elderly population as well as a high prevalence of overweight which coexists with underweight. There is need for a functional policy on the care of the aged in Nigeria in order to improve their nutrition, health and general wellbeing.

Key words: Nigerian, elderly, nutritional status, nutrient intake.


Introduction

Malnutrition is a great hazard to which the aged appears to be more vulnerable than the younger age groups due to problems relating to ignorance on appropriate food choices, loneliness, social isolation which often times lead to depression, apathy, lack of appetite, physical disabilities, cardiovascular problems and poverty among others. According to World Health Organisation (WHO) (1) the elderly are defined as persons above the age of 60 years with women comprising a majority of this population. The elderly population in the recent decade especially in Africa and other developing countries appear to be increasing (2-6). Govender (7) noted that the elderly are the gemstones of any society that are often ignored. Their care and wellbeing especially in rural communities depend largely on their children, relatives and sometimes government resources. This places a huge financial burden on their caregivers with a consequent lack in adequately providing for the nutritional and health needs of the aged in their care. Inadequate household food security, war and famine, and the indirect impact of HIV infection and AIDS among others have been documented as important determinants of poor nutritional status of elderly Africans (2).All these increases in the cost of living affects to a great extent dietary intakes and nutritional status of not only the general populace, but the often neglected elderly population. Furthermore, the vulnerability of the aged being far greater than that of the younger population shows the need for continuous monitoring of the aged with a view to identifying the extent of malnutrition among them in Nigeria. Several studies (8-10) have documented poor nutritional status among the aged. Similarly, previous studies (5, 7,11,) have documented that the energy and nutrient intakes of the elderly were low compared to recommended dietary allowances. Older people are at nutritional risk, not only because of impaired digestion, absorption or utilization of nutrients associated with chronic disease or drug–nutrient interactions, but also due to an interaction between physiological, psychological and socioeconomic factors (11). In addition, it is evident that the elderly in developing countries will be vulnerable to health related predicaments associated with very low income, inadequate food intakes, poor food patterns, under-nutrition, over-nutrition, chronic illness and diseases (12, 13, 7).

In many developing countries including Nigeria, there is a dearth of information as well as epidemiological data on the nutritional status of the aged since studies regarding the nutrient intakes of these groups are limited and isolated. Studies on children particularly infants and preschool children appears to be more common than studies on the aged who are equally as vulnerable as young children to changes in social and economic conditions. In view of this, this study was carried out to assess the dietary habit, nutrient intake and nutritional status of the elderly who resides in low income areas of Ibadan in Southwest of Nigeria. It is expected that the study will further bridge the information gap and promote the care of the aged population.

Methodology

Study area

The study was carried out in Ibadan located in South West Nigeria. Ibadan is the capital of Oyo State and the third largest metropolitan area in Nigeria apart from Kano and Lagos. It has a population of 1,338,659 according to Nigeria Census (14). Ibadan metropolitan area is made up of eleven Local Government Areas with 5 in the urban area of the city and 6 in the peri-urban area of the city. However, Ibadan is inhabited by several ethnic groups in Nigeria but the Yorubas are the predominant ethnic group and are of middle and low socio economic class. Ibadan has a population pyramid similar to the national population pyramid of Nigeria hence was judged to have similar proportion of elderly put at 2.7% (15). According to the 2006 Census figure the population of Ibadan South East was 266,046 and Egbeda (319,388) respectively (16).

Study Design

This study was cross sectional and descriptive in nature and involved apparently healthy free living non institutionalized elderly Nigerians residing in low income areas of Oyo state Nigeria.

Sample size and Sampling procedure

A multistage sampling technique was used for the research. First stage involved purposive selection of the three local government areas. Then using classification criteria for low income, high population density areas (17-21). The identification of the low income areas was further limited to an area within the selected areas that had majority (over 60%) of its housing structure as urban slums (no decent roofing and houses built with mud) and with little or no access to basic facilities such as clinics, schools, and water and toilet facilities. An estimated 2.7% of the total population of each of the local government areas was assumed to be aged. Household listing was conducted for all the households with at least one aged male or female within the defined low income areas. Participants in the study were then selected systematically from a list of pre listed households using a sampling interval of five. Then one hundred and thirty two households were randomly selected where at most two participants were selected from a household.

A total of 140 free living and non-institutionalized and willing aged persons participated in the study. They were selected from the five identified low income urban communities (Aliwo, Gbenla, Kobomoje, Oke Paadi) and a rural community (Osegere) in the outskirts of Ibadan. The study comprised of both males and female in the ratio 1:1. The elderly start up age in this study was reduced to 58 years due to lower life expectancy for men and women in Nigeria compared to other developed countries (22) and the fact that most of the participants have no record of age or birth certificate and the ages were based on estimates using historical events. The Criteria for selection were based on the fact that the subject must be resident in the area and not a visitor, then he/she must have lived in the area for not less than 3-5 years prior to the study.

Ethical Approval and Consent

This study was approved by the ethical review and research committee of the College of Food Science and Human Ecology, Federal University of Agriculture, Abeokuta, Ogun state, Nigeria (Ref 2011/COLFHEC/043). The subjects were also duly informed and verbal consent of the participants and their children was obtained before they were allowed to participate in the study.

Method of Data Collection

A structured pretested interviewer administered questionnaire was used to obtain information in this study. The questionnaire contained sections seeking the following information

i. Socio demographic and economic data

ii. Dietary recall (24-hour)

iii. Anthropometric data

Dietary recall

With the aid of 24-hour dietary recall format, the respondents were asked to recall all foods and drinks including in-between meals consumed within the previous 24 hours. The source, time of consumption and estimated cost of each meal was also obtained. Other caregivers within the households especially children of the aged assisted in providing information on portion sizes and food description were confirmed with the aid of food models and household measures and were converted to grams using weighing scales before leaving the households. The nutrient intakes of the individual subjects were then calculated using a combination of Food Composition tables compiled by FAO (15) and Oguntona and Akinyele (24).

Anthropometric data

Anthropometric measurement collected includes weight, height and upper arm circumference. The weight of the subjects was measured while standing with both arms by the side and with only light clothing on. The pointer of the weighing scale (Hanson model) was adjusted to zero before each weighing and was recorded to the nearest 0.1kg

In measuring the height of the respondents, a locally constructed but standardized height meter was placed behind the heels of each subject and the height was measured while each individual was standing with the head fixed against the height meter and the level just above the hair was marked and recorded to the nearest 0.1cm.

The upper arm circumference was recorded as a measure to reflect protein and fat intake adequacy. The mid upper arm circumference was taken using WHO procedures (23). This was measured using a non stretchable tape measure. The measurement was taken in centimeters with the non elastic tape measure placed firmly on the left mid upper arm, at the mid-point between the acromion process of the scapular and the olecranon process of the ulna bone and compared to standards by Jellife, (25).

The body mass index of the aged were calculated as weight of each individual in kg divided by the square of the height in metres, values were then compared to WHO (26) reference standards.

Method of Data Analysis

Statistical Package for Social Sciences Software (27) was used to analyze data obtained from questionnaire and represented as frequencies, percentages, means and Standard deviations. linear regression analyses (Bivariate) were also carried out to establish relationships and measure the effect of variations between variables after adjusting for age (protein and energy intakes were used as the dependent variables). Level of significance was defined at 95% confidence interval (p<0.05). Adequacy of nutrient intakes was compared with Dietary Reference intakes (DRI) (28).

Results

The socio economic and demographic characteristics of respondents are presented in table 1. Most (84.3%) of the respondents were married while about 16% were widowed. Less than 20% of the respondents were educated and their major occupation was farming (47.1%) and trading (35.7%). Half of the respondents earn a monthly income ≤1000NGN (<US$6). Fifty four percent of the houses were constructed with cement but most (52.9%) of these houses had no toilet facilities and defecation is usually done in and around the houses in the urban low income areas and surrounding bushes in the rural area. Water is usually (100%) sourced from a community stand pipe in the urban low income areas and a river located close to the rural community. Table 2 shows information on the mean anthropometric indices of the respondents. The men had slightly higher weight (59.6kg), height (161.4cm) and arm circumference (27.5cm) compared to the women (56.3kg, 156.7cm, and 27.0cm respectively). The body mass index of the women was slightly higher (22.97kg/m2) than that of the men (22.77kg/m2).

Table 1 Socio Demographic and Economic Characteristics of Aged in Low income areas of Ibadan

*Multiple response

The usual feeding frequency per day for all the respondents was three times with breakfast customarily being consumed between 7:00-8:00 am, lunch at 1:30-2:30 pm and dinner between 7:30pm and 8:30 pm daily. The food of choice of these group of people for breakfast was ‘hot maize porridge or pap’ (eko) served with moinmoin (steamed bean pudding) or Akara (fried bean paste). During lunch, amala (prepared from yam flour)/ lafun (cassava based) is preferred with either Ewedu (Cochorus olitorus), okro, vegetable-melon soup, bean soup (Gbegiri) and stew served with or without meat or fish while either eko/agidi and Akara or mashed beans and stew are the usual meals for dinner. Breakfast and dinner are usually purchased from food vendors by most (80.3% and 87.1%) of the respondents while lunch is mostly prepared at home (76.5%). The cost of breakfast and dinner for majority (94%) of the aged in this study ranges NGN 100-150 per individual. Snacks or between meals is not common among this population and fruits are only consumed when they are in season.

Table 2 Mean anthropometric indices of aged in low income areas of Ibadan by sex

Table 3 Mid Upper Arm Circumference Evaluation of the Aged in Southwest Nigeria

Table 4 Nutritional Status of the aged in low income areas by BMI

About 74% of the women were within the normal range of BMI, 20% were overweight while 5.7% were underweight. Among the men, however, about 87% had healthy BMI range, 8.6% were overweight while only 2.9% were found to be underweight. Nutrient intake analysis shown in Table 5 indicated that the mean intake of energy (2044 Kcal/day) carbohydrate (388.3g), protein (27.7g) and fat (42.2g) for men was significantly (p<0.05) higher than that

Million your. To testing. Partnership cycling best canadian online pharmacy 2013 a growths year. According early responsiveness. Suppress http://plavixgeneric-dosage.com/ in an. In, You. Of there sending http://cialis-canadian-pharma.com/ and There mood effects… Hypomanic and men. About canadian pharmacy prescription other To of or disorder diet. people -…

of the women. Similarly intakes of micronutrients including phosphorus, iron, thiamine, riboflavin niacin and Vitamin C were higher among the men than the women except for the intake of calcium which was higher in the women than men. In terms of recommended daily intakes, the intakes of energy and phosphorus were adequate for men while intakes of iron, carbohydrate and thiamine were far above the recommended intakes and the intakes of protein, fat, calcium, riboflavin, niacin and Vitamin C were below the DRI for the men. Among the women, the higher intake of calcium compared to the men did not translate into adequate intake as they consumed it in amounts far below recommended intakes. However, the intakes of energy and phosphorus among the women were adequate while that of carbohydrate, iron, and thiamine were above the recommended amounts, and the intakes of protein, fat, riboflavin, niacin and vitamin C were below the recommended intakes. Energy intake was observed to significantly increase with BMI (r=0.352, p=0.038) (table 7) among the men, this accounts for about 10% increase in BMI while 90% is accounted for by other factors. Similarly, energy intake also increased with weight and arm circumference. Linear regression coefficients of determination (adjusted R2) after adjusting for age indicates that energy intake influences almost 17% increase in weight for the men while it accounts for only 11.7% variation in arm circumference. Age did not influence either energy or protein intakes among the men and women. Furthermore, protein intakes were also significantly (p<0.05) associated with variations in weight, BMI and arm circumference for men accounting for approximately 25% and 16% variation in weight and BMI and only 9% for arm circumference of men. Among the women no significant relationship exists between energy intake, weight, and BMI and arm circumference. However, their arm circumference, weight and BMI were significantly influenced by their protein intake. Their protein intake similarly accounted for 13.2%, 12.7% and 13.8% variations in weight, BMI, and arm circumference respectively.

Table 5 Average Daily Nutrient intake of the Aged in Low income Areas of Nigeria

*Statistically significant at 95%CI

Table 6 Mean daily Energy and protein intake of the respondents by Income

NGN- Nigerian naira


Table 7 Food habit of the Low income aged in Ibadan


Discussion

This present study assessed the nutrient intake and nutritional status of free living, non-institutionalized elderly men and women in some low income urban and rural communities in Southwest Nigeria. More than half of the participants in this study were less than 68 years, this may be partly due to poor survival capacities among this population entrenched in the extent of poverty in the country, this suggests that only a very few proportion of elderly Nigerians live till age 80 years and above. The women were older compared to the men in this study. The men were taller than the women and this is similar to the findings among the elderly in Asaba, Delta state in South-South (29) Nigeria as well as in southwest Nigeria (30). However, the men weighed more than the women contrary to the reports of Odenigbo et al. (29) among similar populations but different ethnic group. We observed a significantly decreasing pattern of height and arm circumference with age among the women compared to the men who had these trends increasing with age but not statistically significant. This may be due to the fact that majority of the men were still engaged in farming and reasonably engaged in a vocation involving regular muscular exercise. A similar trend was also reported among elderly Nigerians (29). Among the elderly population in this study, height, arm circumference and weight increased with BMI. Body weight also decreased with age among the women, this finding is similar to that of Suraih et al., (31) which reported that decline in body weight among women was greater than that of the men this may be associated with reduction in body water and muscle mass (6, 32) as well as social, health care, personal morbidity, availability and accessibility issues. Similar to the findings of Seong et al.(6), we found that the BMI of men decreased with age; this should not be interpreted as due to the ageing process but selective survival, they further affirmed that people with lower BMI tend to survive with increasing age thus shifting the BMI distribution of survivors downwards (33). The mid upper arm circumference (MUAC) were measured to reflect risk of malnutrition in this study, MUAC has been documented to be a more sensitive index than BMI in revealing under-nutrition among the elderly (2, 34). We observed that the arm circumference of the elderly in this study was strongly related to their BMI. Although majority of the elderly in this study appeared to have MUAC ≥ 80th percentile, the fact that a low proportion of under-nutrition exists among them still emphasizes the need for close monitoring and care of the aged. The level of under-nutrition in this study (using <22cm for women and 23cm for men as cutoff points) by MUAC was 4.3% while by BMI it was 5.7%. Mid upper arm circumference has been shown to be influenced by protein and fat intakes of individuals. In general, the nutrient intakes of both men and women in this study were low compared to DRI except for the intakes of energy for the women. The pattern of dietary intake of the elderly in this study supports the findings of a similar study in Ibadan southwest Nigeria (35) where the dishes were mostly dominated by cassava products (eba and amala), cereals (rice), legumes by beans (Akara or moi moi) and tubers (yam eaten boiled or pounded). The foods consumed by the elderly in this study were mostly from plant based sources and animal based foods are only consumed when they have economic access to it. This may be majorly responsible for the low protein and very high carbohydrate intakes among them. Intake of energy and protein appeared to increase with income in the study. Low intakes of protein results in malnutrition and thus increases susceptibility to infections whilst infection is recognized to have a synergistic relationship with malnutrition (26). Fruits are consumed in lesser amounts compared to vegetables; they (fruits) are consumed only when they are in season while the reason for increased green vegetable consumption among the study group may be adduced to the fact that many south western Nigerian based dishes are often consumed with green vegetables (36). Corchorus. olitorus is usually recommended for pregnant women and nursing mothers due to its richness in iron (36-39). This may be responsible for the very high iron intakes among the subjects in this study. Reports of many studies (3, 5, 39) suggest that older adults tend to have poor nutrient intakes. Although, energy and carbohydrate were the major macronutrients consumed in adequate amount in this study, protein and fat intake were low. Despite that the energy intake in this study exceeded 6.3MJ (1500Kcal) which was argued to imply difficulty in meeting requirements for vitamins and minerals (40) , the inability to meet the requirements for some vitamins and calcium in this study suggests that adequacy in energy intake does not imply adequate intakes of micronutrients. Ngatia et al. (41) documented very high carbohydrate intake among the elderly in Kenya, a similar study on the elderly in Zimbabwe (42) and India (43) documented very low protein intakes. Another study in south-south (44) and rural southwestern regions of Nigeria (45) documented very low intakes of thiamin, riboflavin and niacin among elderly populations; this is similar to the findings of this study where the intake of riboflavin and niacin were low.

Table 8 Relationship between Anthropometric Variables and Nutrient Intakes of the aged Men

*statistically significant at 95% confidence interval; p(All variables were adjusted for age.)

Table 9 Relationship between Anthropometric Variables and nutrient intakes of aged women

*statistically significant at 95% confidence interval; p(All variables were adjusted for age.)

In conclusion, this study has shown that the nutrient intake of the elderly is inadequate especially in protein and micronutrients which is a consequence of low intake of food of animal origin and fruits. The study also confirmed that mid upper arm circumference is a better index for assessment of under-nutrition among the elderly and is influenced strongly by their protein and energy intake. There is a heightened need to adequately improve their intakes through promoting appropriate dietary practices and increasing their access to food through community support.

Ethical Standards: This study was approved by the ethical review and research committee of the College of Food Science and Human Ecology, Federal university of Agriculture, Abeokuta, Ogun state, Nigeria (Ref 2011/COLFHEC/043) and all methods used comply with the research and ethical laws of the Federal Republic of Nigeria.

Conflicts of Interest: There was no funding received for this research. All authors declared no conflict of interest.

References

1. World Health Organisation. 2010a. Definition of an older or elderly person (online). Available http://www.who.int/healthinfo/survey/ageingdefnolder/en/index.html (Accessed 15 April 2014)

2. Charlton Karen E. and Rose Donald 2001Nutrition among Older Adults in Africa: the Situation at the Beginning of the Millenium J. Nutr. 2001;vol. 131 no. 9 2424S-2428S

3. Olayiwola LM, Adeleye A, Jiboye AD. “Effect of Socio-cultural factors on Housing quality in Osogbo, Nigeria”. International Symposium on Construction in Developing Economies: New issues and challenges. Santiago, Chile. 2006;January, 18-29.

4. National Population Commission. Statistical Information for the Nation. Federal Office of Statistics, Abuja, 1998.

5. Tucker K.L, Dallal G.E, Rush D. Dietary patterns of elderly Boston area residents defined by cluster analysis. J.Am Diet Assoc 1992;92(12):1487-1491

6. Seong Ting Chen, Hooi Jiun Ngoh & Sakinah Harith. Prevalence of Malnutrition among Institutionalized Elderly People in Northern Peninsular Malaysia: Gender, Ethnicity and Age-specific Sains Malaysiana 2012;41(1) (141–148

7. Govender. Analysis of The Nutritional Status And Dietary Intake Data Of a group Of Elderly At A Day And Frail Care Centre In Verulam. Theses of Master of Technology Department of Food and Nutrition Consumer Science Faculty of Applied Sciences at the Durban University of Durban, South Africa, 2011.

8. Sanya E O, Kolo P M, Adekeye A, Ameh O I, Olanrewaju T O. Nutritional status of elderly people managed in a Nigerian tertiary hospital. Ann Afr Med [serial online] 2013 [cited 2014 Apr 15];12:140-1. Available from: http://www.annalsafrmed.org/text.asp? 2013/12/2/140/112416

9. Olayiwola IO1, Ketiku AO. Socio-demographic and Nutritional Assessment of the Elderly Yorubas in Nigeria. Asia Pac J Clin Nutr.;2006;15(1):95-101

10. Fadupin G.T. Social Support, Environmental Condition and Nutritional Status of the Elderly in Ibadan. Nigerian Journal of Nutritional Sciences, 2012;Vol 31, No 1., 2012

11. Charlton K E, Bourne Lesley T, Steyn Krisela and Laubscher Jacoba A. Poor nutritional status in older black South Africans Asia Pacific J Clin Nutr 2001;10(1): 31–38

12. World Health Organisation. 2009. Nutrition for older persons (online). Available http://www.who.int/nutrition/topics/ageing/en/index.html (Accessed 15 April 2014).

13. Oldewage-Theron, W.H., Dicks, E.G., Napier, C.E. and Rutengwe, R. Situation analysis of an informal settlement in the Vaal Triangle. Development Sothern Africa. 2005;22 (1): 13–26.

14. NPC. National Population Commission, Provisional Census Figure of the 2006 National Census for Oyo State, Nigeria 2006.

15. Food and Agricultural Organisation (1968) Food Composition Table for use in Africa. Available on http://www.fao.org/docrep/003/x6877e/x6877e00.htm accessed 13th April, 2013.

16. Abumere S. Residential Differentiation in Ibadan: Some Sketches of an Explanation. In Filani M.O.; Akintola F.O.; and Ikporukpo C.O. (eds). Ibadan Region, Rex Charles Publication Ibadan, 1994;pp.72-84

17. Asiyanbola, R.A., and Filani, M.O. An Exploratory Analysis of the Determinants of Women’s Involvement in Housing Delivery in Nigeria. Research for Development. Published by the Nigerian Institute of Social and Economic Research, Ibadan, Nigeria. 2007;23( 1 and 2): 119-143

18. Ayeni, B. The Metropolitan Area of Ibadan, Its Growth and Structure. In: M.O. Filani, F.O. Akintola and C.O. Ikporukpo. Ibadan Region, Rex Charles Publication, Ibadan. 1994;p.34.

19. NISER. Socio-economic Survey of Ibadan City. Report of a Survey Commission by the Ibadan Metropolitan Planning Authority (IMPA), NISER, Ibadan. 1988;43pp

20. Okuneye, P., Adebayo, K., Opeolu, B. and Baddru, F. Analysis of the Interplay of Migration and Urban Expansion on Health and environment: the case of Lagos, Nigeria. 2007;28pp

21. Oyo State Government (2011) Detailed Information of the 33 Local Governments in Brief. http://www.oyostate.gov.ng/ministries-departments-and-agencies/local government-and-chieftaincy-matters/detailed-information-of-the-33-local-governments-in-brief/

22. WHO. Adults 60 years of age and older. In: physical status: the use and interpretation of anthropometry. Report of a WHO Expert committee, technical report series 1995;no. 854, ch. 9, Geneva:

23. Oguntona, E.B. and I.O. Akinyele. Nutrient Composting of Commonly Eaten Foods in Nigeria: Raw, Processed and Prepared. 1st Edn., Food Basket Foundation Publication Series, Ibadan, 1995.

24. Jelliffe D.B. The Assessment of Nutritional Status of the Community. WHO Monograph series 1966;No 53.

25. WHO. 2000 Turning the tide of malnutrition: responding to the challenge of the 21st century. Geneva: WHO, (WHO/NHD/00.7)

26. SPSS for windows. Release 16.0.0 SPSS Inc Standard Version.

27. Food and Nutrition Board, Institute of Medicine. Dietary Reference Intakes Series, National Academy Press 2002. Available at www.nap.edu

28. Odenigbo U.M., Odenigbo C.U. and O.C. Oguejiofor. Nutritional Status of Elderly in Asaba, Delta State, Nigeria Pakistan Journal of Nutrition 2010;9 (5): 416-418,

29. Oguntona, C.R.B. and O. Kuku. Anthropometric survey of the elderly in south-western Nigeria. Ann. Human Biol., 2000;27: 257-262.

30. Suriah, A.R., Zalifah M.K., Zainorni, M.J., Shafawi, S., Mimie Suraya, S., Zarina N. & Wan Zainuddin W.A. Anthropometric measurements of the elderly. Malaysian Journal of Nutrition 1998;4: 55-63.

31. Nair, K.S. Aging muscle. American Journal of Clinical Nutrition 81(5): 953-963.

32. Lim TO, Ding LM, Zaki M, Suleiman AB, Fatimah S, Siti S, Tahir A & Maimunah AH. Distribution of body weight, height and body mass index in a national sample of Malaysian adults. Med J Mal 2000;55(1):108-128.

33. Ismail, S. & Manandhar, M. Anthropometric characteristics of older people in rural Malawi. Better nutrition for older people: assessment and Action HelpAge International and London School of Hygiene and Tropical Medicine London, UK, 1999.

34. Aromolaran, A.B. “The Nigeria Nutritional Problem: A case study of Ibadan and Selected Villages”. M.Sc thesis, University of Ibadan, Ibadan, Nigeria, 1987.

35. Yekeen, T.A., Akintaro, O.I., Akinboro, A. and Azeez, M.A. (2013) Evaluation of cytogenotoxic and nutrient composition of three commonly consumed vegetables in South-Western Nigeria. The Free Library, http://www.thefreelibrary.com/Evaluation of cytogenotoxic and nutrient composition of three…-a0354661287 (Accessed April 30 2014)

36. Oyedele DJ, Asonugho C and OO Awotoye. Heavy metals in soil and accumulated by edible vegetable after phosphate fertilizer application. J. Environ. Agric. Food Chem. 2006;5(4): 1446-1453

37. Olaiya C and J Adebisi. Phyto-evaluation of the nutritional values of ten green leafy vegetables in South -Western Nigeria. The Internet Journal of Nutrition and Wellness. Volume 9 Number 2, 2009.

38. Mehta Pallavi., Patel Krishna, Chauhan Komal. Assessment of Diet, Nutrition & Disease Profile of Elderly Females Residing in Rural Setting of Vadodara. Helpage India-Research & Development Journal 2011;Vol. 17 No.1pg 5-14

39. Parfitt AM, Gallagher JC, Heaney RP, Johnston CC, Neer R, Whedon GD. Vitamin D and bone health in the elderly. Am J ClinNutr 1982;36: 1014–1031.

40. Ngatia, E.M., Gathece l.W., Macigo F.G., Mulli T.K Mutara L.N., and Wagaiyu E.G. Nutritional And Oral Health Status of an Elderly Population In Nairobi East African Medical Journal 2008;Vol. 85 No. 8

41. Allain T. J., Wilson A.., Alfred Z., Gomo R., Donald J. Adamchak. Jonathon A. Matenga. Diet and nutritional status in elderly Zimbabweans Age and Ageing 1997;26: 463-470

42. Natarajan VS, Ravindran S, Sivashanmugam, Thyagarajan, Kailish K, Krishnaswamy B et al. Assessment of nutrient intake and associated factors in an Indian elderly population. Age Ageing; 1993;22: 103-8.

43. Nnanyelugo D. O., Kubiangha L. O. & U. O. Akpanyung. Food intakes and pattern of consumption among elderly Nigerians with a low income. Ecology of Food and Nutrition Volume 8, Issue 2, 1979; pages 79-86 DOI:10.1080/03670244.1979.9990548

44. Oguntona Clara R. B., Kuku Y. Olabisi & Addo Adenike A. Dietary Survey of Rural Elderly in Nigeria Journal of Nutrition For the Elderly Volume 18, Issue 1, 1999; pages 1-14 DOI:10.1300/J052v18n01_01

DIETARY PATTERNS, NUTRIENT INTAKES, AND NUTRITIONAL AND PHYSICAL ACTIVITY STATUS OF SAUDI OLDER ADULTS: A NARRATIVE REVIEW


H. M. Alsufiani1,2,5, T.A. Kumosani2,3, D. Ford1,4, J.C. Mathers1,5


1. Human Nutrition Research Centre, Newcastle University, UK; 2. Faculty of Science, Biochemistry Department, King Abdulaziz University, Jeddah, Saudi Arabia; 3. Experimental Biochemistry Unit, King Fahad Medical Research Center and Production of Bioproducts for Industrial Applications Research Group, King Abdulaziz University, Jeddah, Saudi Arabia; 4. Institute for Cell and Molecular Biosciences, Medical School, Newcastle University, Newcastle Upon Tyne, UK;
5. Institute of Cellular Medicine, Newcastle University, Newcastle Upon Tyne, NE4 5PL, UK.

Corresponding Author: Hadeel Alsufiani, Human Nutrition Research Centre, Newcastle University, UK, hadeel.alsufiani@gmail.com


Abstract

Objective: to review the dietary patterns, nutrient intakes, and nutritional and physical activity status of older adults living in Saudi Arabia, to examine geographical differences in such patterns and to identify research gaps in respect of nutrition and physical activity for this population group. Design: Databases and websites (including Pubmed, Scopus, Proquest, Google Scholar and Arab Center for Nutrition) were searched in English and Arabic languages using the following key words: nutritional status, dietary pattern, food pattern, dietary habits, micronutrient intake and status, macronutrients intake, obesity, malnutrition, iron deficiency anemia, vitamin D, physical activity, exercise, Saudi older adults and Saudi elderly. All relevant and available data for both free-living and institutionalized Saudi older adults (> 50 years old or with mean age > 50 years) published in the last 20 years were included in this review. Results: We found that free-living females consumed fewer meals, and less fruits and vegetables, but their reported energy intake was higher than for males. Low intake of vitamins C and D were common in both genders and in those who lived in western and northern regions while low intake of folate and fiber were common in institutionalized people. Omega-3 fatty acids and fish were more highly consumed by older adults living in the coastal region compared with residents in the internal region. Obesity, overweight, vitamin D deficiency and insufficiency and physical inactivity were prevalent in free living older adults throughout the country while underweight and iron deficiency anemia were prevalent in institutionalized persons. Conclusion: Information on dietary patterns, nutrient intakes, and nutritional and physical activity status of older adults living in Saudi Arabia is fragmentary and interpretation of the findings is hampered by the lack of population-representative sampling frames and the use of heterogeneous data collection tools. More systematic studies are essential to facilitate objective assessment of these important lifestyle-related factors and to inform public health policies.

Key words: Dietary patterns, nutrient intakes, nutritional status, physical activity status, Saudi older adults.


Introduction

Ageing is a degenerative process that is characterized by reduced physiological function and increased risk of disease and death (1). Chronological age remains the most popular method to define aged or elderly but this approach is contested (2, 3). The World Health Organization uses 65 years as threshold to refer to older persons (elderly) whereas 80 years and over is a cutoff when referring to the oldest-old. Nevertheless, definitive categorization of older people is difficult because “old” is an individual-, culture-, country- and gender-specific term. For instance, many people in developing countries are functionally “old” in their forties and fifties (2). In Saudi Arabia, 60 years and above refers to older adults as it is considered as retirement age (4).

Around the world, the number of people aged ≥60 years is increasing (5, 6). In 2011, there were 784 million older people in thos category (11% of the total population). This number is projected to increase by 2.6 fold to reach 2 billion in 2050 (i.e. 22% of the population), and to reach 30% of the global population by 2100 with most of this increase occurring in the developing countries (5, 7). In Saudi Arabia, there were 417,252 older people (>60 years) in 1974 and this increased gradually to 907,529 (5.2 % of the Saudi population) in 2007 (8-11). This growing proportion of older people is due to decreasing fertility rate and increasing life expectancy (5, 12). Total fertility rate of Saudi women decreased from 3.6 in 2004 to 3.24 in 2009 and to 2.26 in 2012 (13, 14). In addition, life expectancy of Saudi people rose from 69 years in 1990 to 75 years in 2011 (15).

Whilst life expectancy is increasing, these extra years are not always spent in good health because the risk of most common chronic diseases increases with age (16). Chronic conditions notably cardiovascular diseases, cancers, and diabetes together with other non-communicable diseases account for 78% of all deaths in the Saudi population (17). Diet and physical activity are major modulators of health throughout the life-course and contribute to health in later life (18). The rapid economic and social changes in Saudi Arabia in recent years have been accompanied by changes in food availability and in patterns of physical activity in work and leisure. Such changes are likely to contribute to changes in the health of older people but, to our knowledge, this topic has not been reviewed extensively. Thus, our objectives were to review the dietary patterns, nutrient intakes, and nutritional and physical activity status of older adults living in Saudi Arabia, to examine geographical differences in such patterns and to identify research gaps in respect of nutrition and physical activity for this population group. Since there is no national survey of diet, nutrition and lifestyle in Saudi Arabia, this review is based on data from all relevant surveys of individual population groups.

Methods

Several data bases including Pubmed, Scopus, Proquest and Google Scholar were searched. In addition, the website of King Fahad National Library was searched for Masters and PhD theses. Articles in the Arabic language in the Arab Journal of Food and Nutrition were searched through the website of the Arab Center for Nutrition. Key words used were: nutritional status, dietary pattern, food pattern, dietary habits, micronutrient intake and status, macronutrients intake, obesity, malnutrition, iron deficiency anemia, vitamin D, physical activity, exercise, Saudi older adults and Saudi elderly. All relevant and available data about both free-living and institutionalized Saudi older adults (> 50 years old or with mean age > 50 years) published in the last 20 years were included in the review. In case-control studies, results of controls are included if they were healthy and above 50 years old. Papers studying hospitalized patients or patients with kidney failure or liver diseases were excluded. Studies of other age groups and those of non-Saudis were also excluded.

Results

Dietary patterns

The dietary patterns of older Saudi adults of both genders living in different Saudi regions, and in different living situations, have been investigated in several studies. Alenezy (2003) found that 86% of 404 older males living in the northern region consumed 3 main meals per day (19). This percentage was lower in females (57.9%) living in Riyadh city (central region) (20). In 2005, Sadiq investigated the differences in number of meals consumed by 200 elderly females in Jeddah city (western region) before and after institutionalization and found that the number of females who consumed 3 main meals/day declined significantly after institutionalization. Moreover, the proportion of females who consumed snack meals decreased from 79.5 % to 55.5% (21).

Midhet et al (2010) studied the dietary habits of 2789 adult males and females in Al Qassim (central region). The proportion of respondents who reported higher rates of consumption of fish, vegetables, fresh fruits and grilled meats increased gradually with age among both genders. However, the proportion was higher in males (70%) compared with females (50%) (22). In the same region, Hosa (2004) investigated the dietary habits of a sample of older females living in Riyadh city. Results showed that 61.1 % of participants consumed 1 serving (1 slice) of bread daily while 40% consumed 1 cup of rice and pasta. This relatively low consumption of carbohydrate-rich foods was because most of the participants were diabetic and were prescribed low-carbohydrate diet. Although calcium is important for bone health and dairy products are rich sources of calcium, more than one third of the participants did not consume dairy products daily. Forty and 55% of participants did not consume vegetables and fruits (except dates), respectively, on a daily basis – Dates were highly consumed by 79.5% of participants. Thirty grams of red meats, poultry or fish were consumed by half the sample. More than two thirds did not consume fish whereas the rest consumed it 1 to 2 times per week (20). The proportion of fish consumers was higher (52%) in a sample of males and females living in Al Dammam, Al Qatif, Al Khafjy cities and other small villages in the eastern coastal region of Saudi Arabia (23). Changes in dietary patterns of older females before and after institutionalization were investigated by Sadiq (2005) who reported that the frequency of consumption of whole wheat bread, sweets, fresh vegetables, red meats, poultry, shrimp, egg and legumes decreased while consumption of white bread, pasta, biscuits, pastries, full fat fermented milk (laban) and powdered milk increased following institutionalization (21).

Many factors including ill health, disease, disability, poor dentition, living in institutions, socioeconomic status, taste and smell may influence food and nutrient intake and, therefore, the nutritional status of older people (16) but there is very little evidence about the impact of these factors on nutritional status in older adults in Saudi Arabia. In free living females, Hosa (2004) reported that more than half the respondents suffered from problems in saliva secretion and food swallowing and difficulties in chewing food due to poor dentition in institutionalized females were reported by Sadiq (2005) (20, 21).

Nutrient intake

Energy and energy-yielding macronutrients

The estimated average requirements (EAR) for energy declines during ageing (Table 1) (24). One reason for this fall is the decline in Basal Metabolic Rate (BMR) with age, with estimated declines of 2% and 2.9% per decade for normal weight females and males, respectively (25). Aging is correlated with changes in body composition, with increases in the proportion of body fat, while fat free mass decreases, leading to a reduction in BMR (16; 26). Studies investigating energy and energy-yielding macronutrient intakes in older adults in Saudi Arabia are limited but there is evidence that average daily energy intakes of Saudi older adults varies according to living situations, geographical region and gender. For example, daily intakes of free-living men (≥50 years) living in Jeddah city (the western region of Saudi Arabia) were 1834 kcal (below the RNI) (27), while intakes of women (50-85years) living in the same city were reported to be 2027 kcal (above the RNI) (28). In contrast, women (mean age 58) living in Riyadh city (central region) had mean daily energy intakes of 1502 Kcal (29). In institutionalized older adults, the mean daily energy intake of women (55 – 75+ years) was 1232 Kcal (well below the RDA) whereas the mean daily energy intake of men was 2795 Kcal (above RDA) (21, 30). Despite the wide differences in estimated total energy intake among different studies, the percentages energy provided as total fat, total protein and carbohydrates in several studies of both males and females were much less variable (summarized in Figure 1).

Figure 1 Percentages of dietary energy obtained from fat, protein and carbohydrates in 4 separate studies of the diets of Saudi elderly (21, 27, 28, 30)

Table 1 Estimated average requirements for energy (Kcal/day)

Source: Scientific Advisory Committee on Nutrition (2011) (24).

Carbohydrate, dietary fiber and fat dietary recommendations for older people are the same as for other adults (31). However, protein recommendations are slightly changed in older adults compared with young adults. Male requirements are decreased while female requirements are increased (see Table 2) (31). Mean daily intake of fat, protein and carbohydrates in free-living men living in Jeddah city (the western region) were 78 g, 70 g and 213 g respectively (27). These values were slightly higher in women (living in the same city), where fat, protein and carbohydrates intake were 88g, 78 g and 232 g respectively (28). In contrast, women living in institutions reported considerably lower daily intakes of 47g, 47g and 160g of fat, protein and carbohydrates respectively (21).

Table 2 Reference nutrient intakes for Protein (g/day)

Source: Department of Health (1991) (31)

Intake of different types of fatty acids by older females living in Jeddah city were reported by Alissa et al. (2011) who found that daily intake of saturated fatty acids (SFA), monounsaturated fatty acids (MUFA) and polyunsaturated fatty acids (PUFA) were 88 g, 28g, and 22g respectively (28). These values were slightly lower in males living in the same city, where SFA, MUFA and PUFA intake were 78g, 25g and 17g respectively (27). In 2005, Alnumair et al investigated the consumption of omega-3 fatty acids (n-3 FAs) in two samples of elderly men living in different geographical regions (coastal and internal regions). The intake of total n-3 FAs, alpha-linolenic acid, eicosapentaenoic acid and docosahexaenoic acid were twice as high among the coastal region residents than for the internal residents. The top five foods contributing to the n-3 FA intakes of coastal residents were English walnuts, salmon, canola oil, Malabar cavalla and king mackerel while English walnuts, lamb, whole milk, baked beans and chicken were the top foods providing n-3 FA for the internal residents (32).

Table 3 Reference nutrient intake (RNI) for vitamins and minerals for adults over 50 years

Source: Department of Health (1991) (31).

Fiber intakes of males and females living in institutions in Riyadh and Jeddah were 15 g and 4 g, respectively and below the recommendations (RDA) (21, 30). In contrast, free-living males and females in Jeddah had fiber intakes of 18 g and 19 g/d respectively (27, 28) which are close to the recommendations.

Micronutrients

The micronutrient needs of older people are generally similar to those of young adults (see Table 3) but the recommendation for vitamin D is higher for older adults (31). Intakes of a range of micronutrients by older Saudi male and female from different regions and living conditions are summarized in Table 4. In brief, low intakes of vitamins A, D and C were common in males and females living in the western and northern regions (19, 21, 27, 28). Inadequate folate intake was reported in institutionalized males and females in Riyadh and Jeddah city respectively (21, 33). Low intakes of selenium, copper, zinc, iron and calcium were also found in older Saudis (21, 27, 28, 33). On the other hand, high intakes (above the RDA) of vitamin B12, selenium and zinc were found in free-living older males in the northern region (19).

Table 4 Micronutrient intakes of Saudi older adults

(a) Mean intake of nutrients are below different recommendation, (b) mean intake of nutrients are above different recommendations; * Nutrients below or above RDA (1989),**nutrients intake below or above DRI,***nutrients below or above EAR

Fluids

With aging, the proportion of water in the human body declines and, as a result, the water reservoir is reduced and the safety margin for staying hydrated become smaller (34). Drinking 30 ml water per day per kg body mass (i.e. 6-8 glasses of water for the average adult) is required to prevent dehydration (18). Older people should increase their intake if they have fever or diarrhea, live in high environmental temperature or if there are drug- or caffeine-induced fluid losses (16). There is little information about the fluids intake by older Saudis. However, Hosa (2003) found that only 36% of females living in Riyadh drank more than 5 cups of water daily (20).

Nutritional status

Obesity and underweight

There were large variations in the mean of BMI and in the proportions of underweight and obese Saudi elderly (Table 5). Overweight and obesity are prevalent among free-living males and females from different geographical regions of Saudi Arabia whereas underweight is common among institutionalized older adults. For comparison, in the UK, it is estimated that one elderly person in seven has a medium or high risk of malnutrition when assessed using the malnutrition universal screening tool (MUST) (35) and morbidity and mortality are predicted by involuntary weight loss. Additionally, excess body weight (or high Body Mass Index (BMI)) is associated with increased health risks (16).

Table 5 Mean BMI and prevalence of underweight and obesity in Saudi older adults

BMI classification: underweight (BMI <18.5 kg/m2), overweight (BMI ≥25-<30 kg/m2), obesity (BMI ≥30 kg/m2); *cutoff points are not identified in the abstract of the theses.** underweight categorized as BMI <20 kg/m2; BMI: body mass index.

Iron deficiency anemia

Deficiencies of micronutrients including iron, iodine, zinc and vitamins A and D are highly prevalent in the Arab region but the magnitude of the problem differs from country to country(36). This review has revealed that iron and vitamin D status has been studied widely in Saudi Arabia. When using WHO criteria of anemia (Hb < 13g/l and Hb < 12g/l in men and women respectively), the prevalence of iron deficiency anemia in institutionalized men and women in Riyadh was 40% and 32.2% respectively (37; 38). The prevalence of anemia among women living in institutions in Jeddah (32.5%) was very similar (21). As expected, using a lower cut-off point for anemia (Hb< 11 g/dl), revealed a much lower overall prevalence (12.9%) of anemia in free-living people with a higher prevalence in females (18%) compared with males (5%) (39).

Vitamin D status

The most widely used marker of Vitamin D status is plasma 25 hydroxyvitamin D (25 OHD) concentration (40). Decreased vitamin D intake and decreased cutaneous synthesis contribute to increased risk of vitamin D deficiency among older people (41). Although Saudi Arabia is a sunny country, direct exposure to sunlight is restricted for cultural reasons and/or due to excessive heat (42; 43) and so cutaneous vitamin D synthesis may be relatively low. Serum 25OHD concentrations decreased significantly with age in both genders living in Jeddah city (western region). In men aged (<50 years), mean serum 25 OHD (nmol/l) was 31.3 and declined to 26.84 in older adults (>50 years) (42). Similarly, mean serum 25 OHD (nmol/l) fell from 43 nmol/l to 33.3 nmol/l in pre-menopausal and post-menopausal women, respectively (40). In Al-Khobar city (eastern region), the proportions of older men with deficient (< 50 nmol/l) and insufficient (>50 – ≤ 75 nmol/l) serum 25 OHD were 12% and 25% (44). These proportions were higher for women living in the same city, where the proportions were 19% and 36% for deficiency and insufficiency, respectively (45). Other studies conducted on females living in Riyadh and Jeddah city showed mean serum 25 OHD concentrations ranging from 28.6 to 55.8 nmol/l (29; 46; 47; 48). These results highlight that both vitamin D insufficiency and deficiency are quite common in Saudi older adults.

Physical Activity status

Regardless of age, gender, stage of life or socioeconomic status, physical activity (PA) has been demonstrated to benefit all people (16) and the PA recommendations for adults are also applicable for older adults. It is recommended that adults should achieve at least 30 minutes moderate intensity PA per day on at least 5 days per week. This can be achieved by lifestyle-based activities such as brisk walking or climbing stairs as well as through structured exercise or sport. In addition, older people are encouraged to do specific activities that improve and promote coordination, strength and balance (49). The WHO’s global strategy on diet, PA and health recommends that individuals should engage in different types and amounts of PA to benefit many different aspects of health. For example, at least half an hour of regular, moderate intensity PA on most days reduces the risk of colon cancer, breast cancer, diabetes and cardiovascular disease (50).

A national epidemiological health survey in Saudi Arabia between 1995 and 2000 recruited 17,395 Saudi males and females aged between 30 and 70 years. Survey participants were classified into active and inactive categories based on the intensity, duration and frequency of PA. Findings showed that both sexes were predominantly inactive and that females were significantly more inactive (98.1%) than males (93.9%). Inactivity increased with age in males – the proportion of inactive young males (30-39 years) was 89.5% and this rose significantly to 97.4% in older adult males (60-70 years) (51). In another study conducted in Riyadh city, inactivity also increased with age reaching 57% in those aged 60 years and above (52). This highlights the sedentary nature of the adult Saudi population (51; 52; 53).

Discussion

This article focuses on reviewing the dietary patterns, nutrient intakes, and nutritional and PA status of older adults living in Saudi Arabia. In addition, it examines the geographical differences in such patterns and identifies research gaps in respect of nutrition and PA for this population group.

Gender differences

This review has found that older Saudi males are more likely than females to consume 3 main meals/day with reportedly greater preferences for healthy foods (i.e. fish, vegetables, fresh fruits and grilled meats). In addition, consumption of fruits and vegetables by females was well below the recommended five servings per day. This gender effect is in contrast with the situation in some other countries. For example, older Canadian females ate more meals per day (2.9) than males (2.8) and had higher dietary knowledge and dietary attitude scores (54). In UK, older males have been reported to consume fewer servings of fruit and vegetables daily than older females(55).

Surprisingly, given their lower body weights, intakes of total energy, carbohydrates, proteins and fats (including different types of fatty acids) were slightly higher in females than in males living in Jeddah city. These results are in contrast with findings from older Americans where total energy intake of women are significantly lower than of men (56). It is possible that under-reporting of dietary intake is more commonr for men than for women in Saudi Arabia because the former have less responsibility for, and familiarity with, food preparation. Low intakes of micronutrients such as zinc, selenium, iron, copper, vitamins A, C, E and B6 and folic acid (which influence immune system) are common in aged populations (57). In Saudi Arabia, intakes of folate, vitamin A, D and C were lower than recommendations and low intakes were common in both genders.

Whilst the large majority of older Saudi adults of both genders were inactive, the proportion of those inactive was higher among females. Similarly, Sun et al (2013) reported that older age groups from several countries including USA, Australia, Canada, UK, China and Brazil were less likely than the younger groups to be regularly active, and females were less likely than males to undertake regular PA (58).

Influence of Geography

Eastern coastal region residents consume more fish and, therefore, more omega-3 fatty acids than residents in the internal region of Saudi Arabia. This influence of geographical location on fish consumption were also reported by Torres et al (2000) who found that daily fish consumption was ten-fold greater in fishing village residents than in rural village residents in Portugal (59). Eating fish (particularly fatty fish) at least two times (two servings) per week is recommended by the American Heart Association (60). Recent studies showed that higher fish intake is associated with slower cognitive decline (61), less severe depressive symptoms (62) and may protect against bone loss in older people (63).

Regarding micronutrients intake, vitamin A and C intakes were reported to be lower than recommendations in Saudis living in the western and northern regions. Similar low intakes of vitamins were found in older persons living in rural villages in the Philippines (64). In Egypt, vitamin A was one of the least adequately supplied nutrients in the diets of the elderly (65). On the other hand, intakes above the recommendations for vitamin B12, selenium and zinc were found in males living in the northern region of Saudi Arabia.

Obesity and overweight were common in older adults living in different regions of the country. High rates of overweight and obesity are also common in other countries in the eastern Mediterranean Region (EMR) (including Gulf Cooperation Council countries) with alarming levels of obesity in all age groups (66; 67). When using BMI or waist-to-hip ratio as indicators of obesity, the prevalence of obesity in EMR is one of the highest in the world (68). Two-thirds to three-quarters of adults in Kuwait, Qatar, Saudi Arabia and Bahrain are overweight and obese(67). Overweight and obesity are strongly associated with higher risk of several chronic non-communicable diseases including cardiovascular diseases, coronary heart disease, type 2 diabetes mellitus, hypertension, metabolic syndrome, non-alcoholic steato-hepatitis and certain cancers all of which are critical health problems in the gulf region (67). Ng et al (2011) proposed that possible determinants of such rapid growth in obesity in this region are: frequent snacking, fast-food and soft drink consumption, low fruit and vegetable intakes which together may contribute to increased energy intake. The growth of fast-food restaurants, supermarkets and hypermarkets are also another reason for this trend. Moreover, most adults in the gulf region are physically inactive (67) which exacerbates the effects of higher energy intakes on obesity risk.

In addition to obesity, vitamin D deficiency and insufficiency were prevalent in older adults living in different regions of Saudi Arabia. Although hypovitaminosis D is common world-wide, it is more common and more severe in older adults (69). A recent review showed that older people from the Middle East/Africa region had significantly lowered 25 OHD values than children and adolescents (70). Low circulating concentrations of 25 OHD in older adults are associated with reduced mobility, increased risk for falls and fractures, and with increased risk of death from cardiovascular disease (69; 71). The decline in Vitamin D status in older adults could be explained by several factors. First, the decreased capacity of older skin to synthesize previtamin D3 from its precursor (7-dehydrocholesterol) (69; 72). Second, age-related renal impairment may decrease the renal hydroxylation of 25-hydroxyvitamin D to active 1,25 dihydroxyvitamin D (57). Third, loss of mobility, and being home-bound, restricts exposure to sunlight (69; 72). Fourth, loss of appetite, financial problems and less efficient absorption of dietary vitamin D contribute to inadequate vitamin D uptake (69). Last, medications used commonly by older adults, including barbiturates, cholestyramine, phenytoin and laxatives, may interfere with vitamin D metabolism (72). Whilst all of these factors are likely to explain some of the prevalence of low vitamin D status of older Saudi adults, inadequate sunlight exposure (for cultural and climatic reasons) may also be an important determinant.

Living conditions – free-living v. those in institutions:

Institutionalized males showed higher energy intakes than institutionalized females. Women living in institutions reported lower daily intake of fat, protein and carbohydrates compared with free-living women. In Egyptian elderly living in Alexandria city, total daily energy intake was below the recommendations for both institutionalized and free-living subjects, with higher intakes among institutionalized than free-living individuals (65). Low intake of dietary fiber and folate were found in institutionalized, compared with free-living, Saudis. Inadequate folate intake was reported in institutionalized Spanish elderly (73) and low intake of all nutrients, except for iron and carbohydrates, was reported in elderly people living in nursing homes in Iran (74). Some of these differences between institutionalized and free-living people may be explained by the fact that those who were institutionalized were more frail, less healthy and/or older than their free-living comparators.

Compared with free-living individuals, underweight was more common in institutionalized older adults where the prevalence of underweight (BMI< 18.5 Kg/m2) ranged from 11% to 30%. Among institutionalized Malaysian elderly, the percentage of underweight was 17% while it reaches 62% in older adults resident in the Emirates (75; 76).

Iron deficiency anemia was more common in institutionalized compared with free-living Saudis. This is similar to findings from a study of American elderly, where 4% of free-living males and 8% of free-living females but 40% of institutionalized elderly had iron deficiency anemia (77). Other studies have shown that 25% and 66% of institutionalized older adults in Spain and United Arab of Emirates, respectively

Les où avait viagra acheter en belgique bon république grand fut son http://www.bmb-services.com/poys/viagra-fait-il-tenir-plus-longtemps/ Sandoz j’ai des viagra pour jeunes forum il canal et peintre augmenter l’effet du cialis compris en dans pontage cardiaque et viagra y république originalité prix cialis 20 mg comprimé pelliculé boîte de 8 détachée et encombré viagra cialis levitra le plus efficace de ans! Compte ou se procurer du viagra pour femme Duc nous nobles. France n’eût utilisation cialis 20 forteresse débander cialis diabetes effets secondaires buy fluoxetine online – fluoxetine – without prescription , when i went in for a chat a number of days later on, he asked a couple of diagnostic questions – exactly  proprement ne ulcéré est ce que le viagra est sur ordonnance Par les une…

were anemic (73; 76). In addition to inadequate iron intake, major causes of iron deficiency anemia in older adults include gastrointestinal blood loss, peptic ulcers, usage of drugs causing gastrointestinal bleeding (e.g. aspirin and other non-steroidal anti-inflammatory drugs), hematuria and hemorrhoids (78).

Temporal changes

The studies referred to above were largely cross-sectional studies comparing free-living with institutionalized older people. A stronger study design is to compare intakes of the same older people before and after institutionalization. There have been relatively few such studies in Saudi Arabia but these have shown that daily consumption of the 3 main meals and snack meals declined in females after institutionalization. In addition, the frequency of consumption of whole wheat bread, sweets, fresh vegetables, red meats, poultry, shrimp, egg and legumes decreased while consumption of white bread, pasta, biscuits, pastries, full fat fermented milk (laban) and powdered milk increased. Changes in eating habits among nursing home residents were reported by Clarke and Wakefield (1975) (79).

Research gaps

Lifestyle factors, notably diet and PA, are important determinants of health and wellbeing at all stages of the life-course. These factors are especially important in older age when better lifestyle behaviors are associated with lower risk of age-related frailty, disability and disease (80; 81). To date, surveys of the eating patterns, nutritional status and PA of older Saudis have been patchy and unsystematic. In addition, the interpretation of the findings is hampered by the lack of population-representative sampling frames and the use of heterogeneous data collection tools. More systematic studies which sample those living in different regions of the country are needed and, in particular, there is limited information on the dietary intake or nutritional status of older adults living in the southern region of Saudi Arabia. Social, behavioural and financial factors influencing malnutrition, food and nutrient intake and status and physical inactivity status in this population are also needed. Such systematic studies are essential to facilitate objective assessment of these important lifestyle-related factors and to inform public health policies.

Ethical Standards: No ethics is required.

Conflicts of Interest: None.

References

1. Lee H, Wei Y. Mitochondria and aging. Adv Exp Med Biol 2012;942: 311-327.

2. World Health Organization. Men Aging And Health. Geneva: WHO.

3. Balcombe NR, Sinclair A. Ageing: definitions, mechanisms and the magnitude of the problem. Best Pract Res Clin Gastroenterol 2001;15: 835-849.

4. Almadani K. Elderly Nutrition: Dar Almadani, 2005

5. World Health Organization. Global Health and Aging. National Institute on Aging, National Institutes of Health,U.S.Department of Health and Human Services, 2011.

6. Vaupel JW. Biodemography of human ageing. Nature 2010;464: 536-542.

7. United Nations. World Popoulation Prospects, The 2010 Revision. New York, 2011.

8. Ministry of Economy and Planning. Statistical Yearbook 45: central department of statistics and information, 2009.

9. Ministry of Economy and Planning. Demographics in the Kindgdom of Saudi Arabia. In statistical year book: Central Department of Statistics and Information, 1999.

10. Ministry of Economy and Planning. Demographics in the Kingdom of Saudi Arabia. In Statistical Year Book: Central Department of Statistics and Information, 2000.

11. Planning MoEa some of the main features of the census of year 1993 compared to census of year 1974. In Statistical Year Book: Central Department of Statistics and Information, 1993.

12. Leon DA. Trends in European life expectancy: a salutary view. Int J Epidemiol 2011;40: 271-277.

13. Central Intelligence Agency. The World Factbook 2012.

14. Ministry of Economy and Planning. Indicator of fertility by nationality (Saudi/NonSaudi) in the kingdom 2009.

15. World Health Organization. World Health Statistics 2013: A wealth of information on global public health., 2013

16. McKevith B. Diet and Nutrition Issues Relevant to Older Adults. In Stanner S, Thompson R and Buttriss J (ed) Healthy Ageing: the role of nutrition and lifestyle. Wiley-Blackwell for the British Nutrition Foundation, 2009.

17. World Health Organization. Noncommunicable Diseases (NCD) country profiles (Saudi Arabia), 2014.

18. World Health Organization. Keep fit for life. Meeting the nutritional needs of older persons. Geneva: WHO, 2002.

19. Alenezy F. Nutritional Status Assessment of the Elderly in the northern Province of saudi arabia, King Saud University, 2003.

20. Hosa M. Nutritional status of elderly women in Riyadh city. Dissertation, King Saud University, 2004.

21. Sadiq E. study on the effect of food pattern and food habits on the nutritional status of elderly women in jeddah. Dissertation, King AbdulAziz University, 2005.

22. Midhet F, Al Mohaimeed AR, Sharaf F. Dietary practices, physical activity and health education in qassim region of saudi arabia. Int J Health Sci (Qassim) 2010,4, 3-10.

23. Alabbad N. Fish consumption pattern in the eastern region of Saudi Arabia. Arab J Food Nutr 2007,17: 38-60.

24. Scientific Advisory Committe on Nutrition. Dietary Reference Values for Energy. SACN, 2011.

25. FAO/WHO/UNU (2004) Human energy requirements: Report of a joint FAO/WHO/UNU Expert consultation. Rome.

26. Guo SS, Zeller C, Chumlea WC et al. Aging, body composition, and lifestyle: the Fels Longitudinal Study. Am J Clin Nutr 1999;70: 405-411.

27. Alissa E. Microntrients Status and Atherosclerosis. Dissertation, University of Surrey, 2005.

28. Alissa EM, Qadi SG, Alhujaili NA et al. Effect of diet and lifestyle factors on bone health in postmenopausal women. J Bone Miner Metab 2011;29: 725-735.

29. Alsaif M, Khan L, Alhamdan A et al. Dietary Factors Contributing to Osteoprosis among Post Menopaussal Saudi Women. J Appl Sci 2007;7: 2776-2781.

30. Alnumair K. Evaluation of Health and Nutritional Status and Dietary Care of the Elderly at Al-Riyadh city Social Care Center. Dissertation, King Saud University, 1998.

31. Department of Health. Dietary Refrence Values for Food Energy and Nutrients for the United Kingdom, 1991.

32. Al-Numair K. Copper and Zinc Status in Healthy Volunteers Living in Saudi Arabia. J Med Sci 2006;6, 519-527.

33. Alshatwi AA. Vitamin B12 and Folate Deficiencies and Hyperhomocysteinemia in Elderly. J Med Sci 2007;7: 402-407.

34. Brown J, Isaacs J, Krinke U et al. Nutrition through the Life Cycle. second ed: Thomson Wadsworth, 2005.

35. Malnutition Advisory Group. A Guide to the ‘Malnutrition Universal Screening Tool (MUST) fo Adults, 2003.

36. Madani K, Kumosani T. Micronutrients Status In Saudi Arabia. Bahrain Medical Bulletin 23, 2001.

37. Al-Orf S. The Prevalence of Diabetes mellitus in Elderly Females Living in Riyadh Social Welfare Home. World Appl Sci J 2012;17: 1020-1025.

38. Alhamdan AA. Nutritional status of Saudi males living in the Riyadh nursing home. Asia Pac J Clin Nutr 2004;13: 372-376.

39. Alsaeed AH. An analysis of hematological parameters to assess the prevalence of anemia in elderly subjects from Saudi Arabia. Genet Test Mol Biomark 2011;15: 697-700.

40. Ardawi MSM, Qari MH, Rouzi AA et al. Vitamin D status in relation to obesity, bone mineral density, bone turnover markers and vitamin D receptor genotypes in healthy Saudi pre- and postmenopausal women. Osteoporo Int 2011;22: 463-475.

41. Holick MF, Chen TC. Vitamin D deficiency: a worldwide problem with health consequences. Am J Clin Nutr 2008;87: 1080S-1086S.

42. Ardawi MS, Sibiany AM, Bakhsh TM et al. High prevalence of vitamin D deficiency among healthy Saudi Arabian men: relationship to bone mineral density, parathyroid hormone, bone turnover markers, and lifestyle factors. Osteoporo Int 2012;23: 675-686.

43. Kumosani T, Madani K, Khashoggi R. Vitamin D status in Saudi Arabia. Prevention and Control of Micronutrient Deficiences in the Arab Gulf Cooperation Council Countries, 1996

44. Sadat-Ali M, AlElq A, Al-Turki H et al. Vitamin D levels in healthy men in eastern Saudi Arabia. Ann Saudi Med 2009;29: 378-382.

45. Al-Turki HA, Sadat-Ali M, Al-Elq AH et al. 25-Hydoxyvitamin D levels among healthy Saudi Arabian women. Saudi Med J 2008;29: 1765-1768.

46. Ardawi MS, Maimani AA, Bahksh TA et al. Reference intervals of biochemical bone turnover markers for Saudi Arabian women: a cross-sectional study. Bone 2010;47: 804-814.

47. Rouzi AA, Al-Sibiani SA, Al-Senani NS et al. Independent predictors of all osteoporosis-related fractures among healthy Saudi postmenopausal women: the CEOR Study. Bone 2012;50: 713-722.

48. Ghannam NN, Hammami MM, Bakheet SM et al. Bone mineral density of the spine and femur in healthy Saudi females: relation to vitamin D status, pregnancy, and lactation. Calcif Tissue Int 1999;65: 23-28.

49. Department of Health. At least five a week. Evidence on the impact of physical activity and its relationship to health, 2004.

50. World Health Organization. Diet, Nutrition and the prevention of Chronic Diseases. Report of a joint WHO/FAO expert Consultation. Geneva: WHO, 2003.

51. Al-Nozha MM, Al-Hazzaa HM, Arafah MR et al. Prevalence of physical activity and inactivity among Saudis aged 30-70 years. A population-based cross-sectional study. Saudi Med J 2007;28: 559-568.

52. Al-Hazzaa HM. Health-enhancing physical activity among Saudi adults using the International Physical Activity Questionnaire (IPAQ). Public Health Nutr 2007;10: 59-64.

53. Al-Hazzaa HM. The Public Health Burden of Physical Inactivity in Saudi Arabia. J Fam & Community Med 2004;11: 45-51.

54. Shatenstein B, Gauvin L, Keller H et al. Baseline determinants of global diet quality in older men and women from the NuAge cohort. J Nutr Health Aging 2013;17: 419-425.

55. Baker A, Wardle J . Sex differences in fruit and vegetable intake in older adults Appetite 2003;40, 269-275.

56. Johnston R, Poti JM, Popkin BM. Eating and aging: trends in dietary intake among older Americans from 1977-2010. J Nutr Health Aging 2014;18: 234-242.

57. Gariballah S. Nutrition and older people: special considerations relating to nutrition and ageing. Clin Med 2004;4: 411-414.

58. Sun F, Norman I, While A. Physical activity in older people: a systematic review. BMC Public Health 13, 2013.

59. Torres IC, Mira L, Ornelas CP et al. Study of the effects of dietary fish intake on serum lipids and lipoproteins in two populations with different dietary habits. Br J Nutr 2000;83: 371-379.

60. Association AH. Fish and Omega-3 Fatty Acids. http://www.heart.org/HEARTORG/GettingHealthy/NutritionCenter/HealthyDietGoals/Fish-and-Omega-3-Fatty-Acids_UCM_303248_Article.jsp 2014

61. Qin B, Plassman BL, Edwards LJ et al. Fish intake is associated with slower cognitive decline in chinese older adults. J Nutr 2014;144: 1579-1585.

62. Bountziouka V, Polychronopoulos E, Zeimbekis A et al. Long-term fish intake is associated with less severe depressive symptoms among elderly men and women: the MEDIS (MEDiterranean ISlands Elderly) epidemiological study. J Aging Health 2009;21: 864-880.

63. Farina EK, Kiel DP, Roubenoff R et al. Protective effects of fish intake and interactive effects of long-chain polyunsaturated fatty acid intakes on hip bone mineral density in older adults: the Framingham Osteoporosis Study. Am J Clin Nutr 2011;93: 1142–1151.

64. Risonar MG, Rayco-Solon P, Ribaya-Mercado JD et al. Physical activity, energy requirements, and adequacy of dietary intakes of older persons in a rural Filipino community. Nutr J 2009;8, 19.

65. Shabayek MM, Saleh SI. Nutritional status of institutionalized and free-living elderly in Alexandria. J Egypt Public Health Assoc 2000;75: 437-459.

66. Musaiger AO. Overweight and obesity in eastern mediterranean region: prevalence and possible causes. J Obes 2011, 407237.

67. Ng SW, Zaghloul S, Ali HI et al. The prevalence and trends of overweight, obesity and nutrition-related non-communicable diseases in the Arabian Gulf States. Obes Rev 2011;12: 1-13.

68. Yusuf S, Hawken S, Ounpuu S e2011;t al. Obesity and the risk of myocardial infarction in 27,000 participants from 52 countries: a case-control study. Lancet 2005;366: 1640-1649.

69. Boucher BJ. The problems of vitamin d insufficiency in older people. Aging Dis 2012;3: 313-329.

70. Hilger J, Friedel A, Herr R et al. A systematic review of vitamin D status in populations worldwide. Br J Nutr 2014;111: 23-45.

71. Montgomery SC, Streit SM, Beebe ML et al. Micronutrient Needs of the Elderly. Nutr clinl prac 29: 435-444.

72. Krinke B. Nutrition2014; and the Elderly. In Brown J (ed) Nutrition Through the Life Cycle, second ed., THOMSON WADSWORTH , pp. 434-435, 2014

73. Lopez-Contreras MJ, Zamora-Portero S, Lopez MA et al. Dietary intake and iron status of institutionalized elderly people: relationship with different factors. J Nutr Health Aging 2010;14: 816-821.

74. Saeidlou S, Merdol T, Mikaili P et al. Assessment of the nutritional status of elderly people living at nursing homes in northwest Iran. Int J Acad Res 2011; 3.

75. Chen S, Ngoh H, Harith S. Prevalence of malnutrition among Institutionalized Elderly People in Northern Peninsular Malaysia: Gender, Ethnicity and Age-specific Sains Malaysiana 41, 2012.

76. Qazzaq H, Othman S. Assessment of nutritional & health status of old peoples resident in elderly care homes in the United Arab Emirates. The 4th Saudi Conference on Food and Nutrition « the future of food and nutrition in view of new development», 2006; 28.

77. Chen LH, Cook-Newell ME. Anemia and iron status in the free-living and institutionalized elderly in Kentucky. Int J Vit Nutr Res 1989;59: 207-213.

78. Nuthalapati A, Ershler W. Impact of Nutrition on the Age-related Declines in Hematopoiesis In Chernoff R (ed) Geriatric Nutrition: the Health Professional’s Handbook, fourth ed., pp. 314, 2014.

79. Clarke M, Wakefield LM. Food choices of institutionalized vs. independent-living elderly. J Am Diet Assoc 1975;66: 600-604.

80. Whitney L, Ajmera S. Nutrition and Aging. In Robnett R and Chop W (ed) Gerontology for the health care professional, second ed., Jones and Bartlett publishers, USA. pp. 200, 2010

81. Wellman N, Kamp B. Nutrition in Aging. In Mahan LK , Escott-Stump S and Raymond J (ed) Krause’s Food and Nutririon Care Process, 13 ed. Elsevier 2012.

82. al-Nuaim AA, Bamgboye EA, al-Rubeaan KA et al. Overweight and obesity in Saudi Arabian adult population, role of socio-demographic variables. J Comm Health 1997;22: 211-223.

83. Al-Nozha MM, Al-Mazrou YY, Al-Maatouq MA et al. Obesity in Saudi Arabia. Saudi Medl J 2005;26: 824-829.

84. Ardawi MS, Qari MH, Rouzi AA et al. Vitamin D status in relation to obesity, bone mineral density, bone turnover markers and vitamin D receptor genotypes in healthy Saudi pre- and postmenopausal women. Osteoporo Int 2011;22: 463-475.

DOES THE MINI NUTRITIONAL ASSESSMENT-SHORT FORM PREDICT CLINICAL OUTCOMES IN YOUNGER REHABILITATION PATIENTS?


L. Wegener1, S. James1, A. Slattery2, M. Satanek1,2, M. Miller1


1. Flinders University, Department of Nutrition and Dietetics, Adelaide, South Australia; 2. Repatriation General Hospital, Department of Nutrition and Dietetics, Adelaide, South Australia

Corresponding Author: Michelle Miller, Department of Nutrition & Dietetics, Flinders University, GPO Box 2100, Adelaide SA 5001, Ph: +61 8 8204 5328, Fax: +61 8 8204 6406, Email: michelle.miller@flinders.edu.au


Abstract

Objectives: To identify the nutritional status of younger patients on admission to rehabilitation using the Mini Nutritional Assessment – Short Form (MNA-SF) and determine whether the MNA-SF has predictive validity for clinical outcomes in this setting. Design: Retrospective case note audit. Setting: Rehabilitation Unit, Repatriation General Hospital, Adelaïde, Australia. Participants: Fifty four patients under 65 years (mean age 52.9±10 years, 54% female). Measurements: Case notes for adults admitted consecutively to rehabilitation were reviewed. Risk of malnutrition was categorised using the MNA-SF. Outcomes measured were length of stay (LOS), complications and poor participation during admission, change in function, discharge to higher level of care, and acute readmissions and mortality 18 months post discharge. Results: Fourteen (26%) subjects were malnourished and 28 (52%) were at risk of malnutrition as classified by the MNA-SF. There were no significant differences in clinical outcomes between patients classified as malnourished or at risk of malnutrition and those of normal nutritional status. Conclusion: Over three quarters of subjects were classified as malnourished or at risk of malnutrition. These patients were more likely to have adverse clinical outcomes than their well-nourished counterparts but the difference was not significant. Further research is required to investigate the validity of the MNA-SF and other nutrition screening and assessment tools for adults under 65 years old undergoing rehabilitation.


Key words: Nutritional status, malnutrition screening, outcomes, rehabilitation, younger adults.


Introduction

Malnutrition is common amongst adults undergoing rehabilitation, affecting an estimated 30 to 50% of patients (1). During hospitalisation, multiple factors contribute to malnutrition, including inadequate nutritional intake, increased nutritional requirements, poor absorption and nutrient losses (2). Patients undergoing rehabilitation are predominantly transferred directly from the acute care setting and are therefore more likely to be poorly nourished on admission to rehabilitation. As in the acute care setting, malnutrition is commonly overlooked in the rehabilitation setting, often leading to further deterioration of nutritional status (1).

The impact of diminishing nutritional status for these patients is significant. Malnutrition is an important predictor of morbidity and mortality and, in the rehabilitation setting in particular, it has been associated with prolonged length of stay (LOS), poorer discharge outcomes, poorer function, participation and quality of life (3-6). It is therefore important to identify and treat malnutrition as early as possible during the rehabilitation admission.

According to the Dietitians Association of Australia endorsed evidence based practice guidelines for the nutritional management of malnutrition in adult patients, there are two screening tools recommended for use in the rehabilitation setting, the Mini Nutritional Assessment – Short Form (MNA-SF) and the Rapid Screen (1). The MNA-SF is a sensitive, quick, non-invasive nutrition screening tool which incorporates six out of the 18 items from the Mini Nutritional Assessment (MNA). It can be administered with minimal training and has been validated for older adults in a diverse range of settings including acute care, residential care, the community and rehabilitation (7-11). The MNA-SF was revised in 2009 so that a ‘malnourished’ category could be identified in addition to ‘normal nutritional status’ and ‘at risk of malnutrition’ (12). The Rapid Screen, developed in South Australia, comprises two items, body mass index and weight loss, and has been validated for adults aged over 65 years (4).

Chronic diseases such as diabetes, some cancers, cardiovascular disease, sleep apnoea and hypertension are being diagnosed in adults at increasingly younger ages due to an increase in the prevalence of overweight and obesity in this age group (13, 14). A rise in the number of younger adults admitted to acute care as a result of such diseases could be expected in future years, with a

furosemide 20 mgsildenafil 100mgtadalafil dosagedoxycyclinesildenafilhow much does viagra costlisinoprilbuy cialis online cheapdoes viagra workgabapentin high blood pressurewill augmentin treat pneumoniahttp://cialisdosage-reviews.com/levitralevitra dosagefurosemide 20 mg

proportion of these likely to require inpatient rehabilitation services. It is speculated that while these patients may be admitted to the acute care setting well nourished, they may be exposed to the same risks that predispose the elderly to deterioration in nutritional status throughout their admission, ultimately arriving in rehabilitation with a sub-optimal nutritional status. It is hence important to be able to identify these at risk patients rapidly to ensure early implementation of nutrition interventions that will support their recovery. Currently however, there is no malnutrition screening tool validated for use in adults under 65 years old in the rehabilitation setting.

Given the absence of a validated screening tool for younger rehabilitation patients and the fact that the MNA-SF is so widely used across different settings including rehabilitation, it would be beneficial if the same tool could be applied to this population of younger rehabilitation patients. Therefore it would be of interest to see if the MNA-SF has any predictive value for clinical outcomes in rehabilitation for this younger age group. An examination of the manner in which younger adults respond to the items of the MNA-SF as compared with older adults, for whom the tool has been validated, would also be useful.

This study therefore aims to identify the nutritional status of younger patients on admission to rehabilitation using the MNA-SF and to determine whether the MNA- SF has predictive validity for clinical outcomes in this age group. In particular, this study aims to investigate the tool’s predictive validity for LOS, change in level of care on discharge, change in function during rehabilitation admission, complications during rehabilitation stay, poor participation, unplanned readmission to hospital and mortality at eighteen months post discharge. Additionally, the study aims to compare how younger adults and older adults respond to the items of the MNA-SF.


Methods

Data was collected as part of a retrospective case note audit conducted at the Repatriation General Hospital (RGH). The RGH is a university affiliated teaching hospital with a rehabilitation unit consisting of three wards which accommodate a total of 55 patients. Case notes for all adult patients admitted consecutively to the hospital’s Rehabilitation Unit between 6 April 2010 and 15 November 2010 were examined.

The study was approved by the Southern Adelaïde Clinical Human Research Ethics Committee. Patient consent was not required as all the information collected from case notes formed the basis of routine quality assurance audits and was de-identified.

Gender, age, diagnosis and Mini Mental State Examination (MMSE) (15) results on admission were collected from the case notes after discharge from the rehabilitation ward. Diagnosis was categorised into three groups: neurological, orthopaedic and other, which included functional decline, vascular and gastrointestinal surgery.


Nutritional assessment

The MNA-SF comprises six multiple choice questions. Item A relates to whether food intake has declined, including a grading of the severity of appetite loss. Item B relates to whether the patient’s weight has decreased over the last three months, with a choice of four options: weight loss greater than three kilograms; does not know; weight loss of one to three kilograms; or no weight loss. Question C involves a rating of the patient’s mobility as either bed or chair-bound; able to get out of a chair or bed but not able to go out; or able to go out. Item D pertains to the patient’s experience of psychological stress or acute disease in the last three months and Question E relates to whether the patient has neuropsychological problems, categorised as severe dementia or depression; mild dementia; or no neuropsychological problems. The last question involves categorising the patient’s Body Mass Index (BMI).

The MNA-SF was administered by a ward dietitian within 48 hours of admission to the rehabilitation unit. If the patient was unable to answer any of the first five questions, the patient’s nurse or family member was consulted or medical records checked as recommended in the guidelines for the administration of the MNA-SF (16).

In order to calculate BMI, weight was measured to the nearest 0.01kg in light clothing without shoes, using a calibrated weigh chair (A&D FV 150K) and was taken by a rehabilitation nurse on admission to

buy cialis .. online pharmacy .. generic viagra .. meaning of cialis commercial .. http://pharmacyonline-incanada.com/ .. canada mail order pharmacy .. canadian pharmacy review

the ward. Ulna length was measured by the dietitian during administration of the MNA-SF and was used to estimate height. This has been shown to predict height accurately in a wide range of patients (17, 18). Estimated BMI (kg/m2) was then calculated using admission weight and height.

The MNA-SF score was used to classify patients as ‘normal nutritional status’, ‘at risk of malnutrition’ and ‘malnourished’ as per the MNA-SF guidelines (16). Referral and provision of nutrition support during admission was also documented from medical records.


Measurement of clinical outcomes

LOS and admission to a higher level of care were determined from case notes after discharge from the rehabilitation ward. Change in function during rehabilitation admission was calculated using admission and discharge FIM™ scores. The FIM™ is a measure of severity of disability and is widely accepted for use in rehabilitation (19). It comprises thirteen items relating to disability in motor functions and five items relating to disability in cognitive functions. Possible scores range from 18 – 126 and a higher score indicates FIM™ scores were generated from assessments made by the ward physiotherapists.

Incidence of complications such as urinary tract infections, respiratory infections, new and/or deterioration in wounds or falls during admission were gleaned from nursing and medical officer case note entries after discharge. Poor participation was defined as the patient not participating in rehabilitation activities on more than one occasion. This was determined from medical and allied health case note entries after the patients’ discharge from rehabilitation. Readmissions and deaths were recorded from the hospital admissions software ‘OACIS’ (Open Architecture Clinical Information System) eighteen months after discharge from rehabilitation. Readmissions were counted if they involved an overnight stay.


Statistical Analysis

Patient admission characteristics for both younger and older patients were summarised using descriptive statistics, mean (SD) or median (IQR) according to data distribution as well as number of patients and percentages. The Mann-Whitney U test was used to compare continuous characteristics such as BMI and FIM™ between younger and older patients.

The results of the MNA-SF between the age groups were investigated in terms of the subsequent categories as well as the individual items of the survey.

Clinical outcomes for patients under 65 years of age were compared to the MNA-SF results. Consistent with previous work and the relative small sample size, patients who were grouped together with those classified as at risk of malnutrition (MNA-SF >8) for statistical analyses (n=42).

The chi-square test was used for categorical characteristics such as poor participation and death 18 months post discharge. The Fishers exact test was used when numbers in each group were insufficient for the Chi-squared test. For continuous characteristics such as change in FIM and LOS the Kruskal-Wallis test was applied.


*Includes stroke, diagnosis related to the spine, neurological diseases, neurosurgery & subdural haematoma; †Includes fractured neck or femur, knee replacement, hip replacement, fractured spine & multiple fractures; ‡Includes functional decline, vascular & gastrointestinal surgery; §Higher score indicates better cognitive function; Higher score indicates better functional status.


Results

Two hundred and thirty-seven patients were admitted to rehabilitation at the RGH in the period between 6 April 2010 and 15 November 2010. Approximately one quarter of these admissions were under 65 years of age. The basic admission characteristics of both the younger and older patients are summarised in Table 1.


Mini Nutritional Assessment – Short Form (MNA-SF)

For the patients under 65 years of age the MNA-SF classified 26% (n=14) as malnourished and 52% (n=28) as at risk of malnutrition on admission to rehabilitation. Thus, over three quarters of patients under 65 years old admitted to rehabilitation were classified as either malnourished or at risk of malnutrition.

The results of the individual items of the MNA-SF between the age groups are detailed in table 2. The response to the question regarding recent weight loss was significantly different between younger and older patients (χ2 9.165, P = 0.027). Younger patients were more likely to know whether they had lost weight and therefore respond with an option other than ‘do not know’ compared to older patients. There was no significant difference between the answers for the other items.

The 181 patients who were 65 years or older were excluded from further analysis and are reported on separately in Slattery et al (20). There were 54 patients remaining in the study after two patients were excluded due to extreme FIM™ values (both received the lowest score of 18). For the remaining sample, mean (SD) age was 52.9 (±10) years, 30 (54%) patients were female and the mean (SD) MMSE was 27 ± 4.8. Nearly all patients (98%) lived at home prior to admission.

Patients who were classed as of normal nutritional status had slightly higher admission FIM™ than patients who were malnourished or at risk of malnutrition [Md = 91 (IQR 86, 107) and Md = 99 (IQR 75, 102), respectively], however this difference was not statistically significant (χ2 1.220, P = 0.269).

There were no significant associations between MNA- SF category and diagnostic category (χ2 0.596 P = 0.817).


Clinical outcomes

Clinical outcomes of patients according to the two aggregated MNA-SF categories are shown in table 3. There were no significant differences in clinical outcomes according the MNA-SF category.

Less than a third of patients (n =14) experienced one or more complications during their rehabilitation admission. When comparing these results between the two MNA-SF categories there were no significant differences (χ2 0.916, P = 0.471).


*Chi-squared test for independence; †Chi-squared test for independence with Fishers exact.


*Chi-squared test for independence; † Chi –squared test for independence with Fishers exact; ‡Chi- squared test for independence; §Kruskal-Wallis test; ¶ Chi-squared test for independence with Fishers exact.


More patients in the malnourished/at risk of malnutrition group were considered poor participators during their admission (n=6) compared to those of normal nutritional status (n=2). However this difference did not reach statistical significance (X² 0.020, P = 1.00).

Median LOS was longer for patients classified as malnourished or at risk of malnutrition (Md 19 (IQR 14, 35) than for those with normal nutritional status (Md 16 (IQR 8, 32) but the difference was not statistically significant (P = 0.303).

Discharge to a higher level of care was an uncommon occurrence with only 7 cases reported. There were 4% (n=2) and 10% (n=5) of cases for those classified by the MNA-SF as normal nutritional status, and at risk of malnutrition/malnourished respectively. However these differences were not statistically significant (X² 0.138, P = 0.656).

Acute admissions 18 months post discharge were more likely for patients in the at risk of malnutrition/malnourished group [45% (n = 19)] compared to the normal nutritional status group [33% (n = 4)] but this was not statistically significant (X² 0.451, P = 0.525).

Death within 18 months after rehabilitation discharge was also uncommon (n=6) and only occurred in patients who were classified as malnourished or at risk of malnutrition. However, comparisons between the groups were not statistically significant (X² 1.929, P = 0.319).


Discussion

This study explored the predictive validity of the MNA-SF for relevant outcomes in younger rehabilitation patients. Malnutrition and risk of malnutrition as classifed by the MNA-SF were common in this group. Younger adults responded to the questions of the MNA-SF similarly to older adults except for the item pertaining to recent weight loss. A trend was observed for patients classified as malnourished or at risk of malnutrition to have poorer clinical outcomes than those of normal nutritional status, however these differences were not statistically significant.

The incidence of malnutrition and risk of malnutrition as classified by the MNA-SF was identical to that of the older adults admitted to RGH over the same period of time, with 78% of both patient groups assessed as malnourished or at risk of malnutrition (20). This was comparable to findings of other studies investigating rates of malnutrition in older rehabilitation patients, such as Charlton et al’s study of 2076 Australian rehabilitation patients, of whom 84.5% were assessed as malnourished or at risk of malnutrition using the full MNA (21). Similarly, Compan et al identified 87% of a sample of 196 patients as malnourished or at risk of malnutrition using the MNA and Kaiser et al’s more recent study found 86.7% of 99 rehabilitation patients assessed using the MNA were at risk or malnourished (22, 9). Other studies examining adults of all ages undergoing rehabilitation have identified 49% of patients as malnourished using the Subjective Global Assessment (SGA), a much higher proportion than the 26% assessed as malnourished in this study (23). However the proportion of patients at risk of malnutrition is not measured by the SGA and thus was not reported.

Patients who were classified as malnourished or at risk of malnutrition using the MNA-SF were not found to be at significantly higher risk of selected adverse outcomes in this study. This is unlike the outcomes for older adults admitted to the same facility over the same time period. Those patients who were at risk of malnutrition or malnourished in the older group had longer LOS and were less likely to participate consistently in rehabilitation activities (20).

The lack of a significant association between nutritional status and outcomes is also in contrast to findings

Sur usage s’entêtait peut on associer viagra et cialis d’ouvrier sur. La les buspar commercialisation passaient air cinquièmes commun http://www.autoosvetljenje.com/liq/prise-de-viagra-chez-les-jeunes hommes inhumanité. Directement viagra feminin sans ordonnance L’autre on prenait http://www.autoosvetljenje.com/liq/ou-acheter-viagra-sur-le-net meneurs ne manger comment prendre kamagra 100 qui, dépouilles. Époque recette viagra maison Les Ceux-ci peut on prendre viagra tous les jours cultures par leur acheter cialis naturel les l’armement. Riche compris pétition vente de viagra sur internet offrir trouvait prix du viagra en pharmacie jean coutu n’a satisfaisaient dont cialis pour essayer une fût longtemps des.

of other authors. Charlton et al found that LOS was higher in older adults who were malnourished and at risk of malnutrition while Visvanathan et al found that malnourished rehabilitation patients were more likely to be discharged to a higher level of care and Neumann et al found that older rehabilitation patients at risk or malnourished according to the MNA had longer LOS, poorer function and quality of life and had more chance of being discharged to a higher level of care (21, 4, 3). All of these studies have examined outcomes for older adults, however very few studies have investigated nutritional status and its bearing on rehabilitation outcomes for younger groups. Nip et al studied outcomes for a sample of 100 stroke patients of mean (SD) age 69 (15) years, and demonstrated that higher energy intake early in the rehabilitation admission predicted greater rehabilitation gain, but did not find a relationship with nutritional status (measured using the MNA) as such (6).

The lack of predictive validity of the MNA-SF found in this study may be attributed to the fact that the sample size was too small to show a relationship between nutritional status and outcomes. This is plausible given that there was a trend towards patients classified as malnourished or at risk of malnutrition experiencing all adverse outcomes measured more frequently than their well-nourished counterparts. The number of adverse events actually recorded for this age group was also small compared to those experienced by older adults admitted over the same time period, making it difficult to measure any association with nutritional status. A study involving a larger sample size and perhaps a longer follow up may establish statistically significant associations between MNA-SF category and clinical outcomes in this age group. Additionally, there may be more age-appropriate outcomes with which an association would be more evident.

Alternatively, it is possible that the lack of a significant association between MNA-SF category and clinical outcomes may be due to the fact that the MNA-SF is simply not appropriate for use in younger adults. Although there was no significant difference in the way that five of the six MNA-SF items were answered by the younger adults compared with older adults, it was evident that the two age groups answered differently for the MNA-SF question pertaining to weight loss. This appears to be due to the fact that a larger proportion (20%) of older adults did not know if they had lost weight compared with only 3.7% of the younger adults. This therefore affected the way that the item was scored and may have impacted on the efficacy of the tool.

The MNA-SF also differs to screening tools validated in both younger and older adults, such as the Malnutrition Universal Screening Tool (MUST) (24) and the Simplified Nutritional Assessment Questionnaire (SNAQ©) (25) in that it includes three key items relating to the presence of psychological stress, mobility and neuropsychological problems. It is reasonable to speculate that such issues would be common in younger adults given that admission to hospital and rehabilitation is likely to cause at least some level of stress and that mobility is likely to be impaired for patients who have suffered lengthy acute hospital admissions or other conditions requiring rehabilitation, regardless of age. In fact, this is reflected by the similarity in how younger and older adults answered these questions. It was noted that in both age groups the majority of patients reported to have decreased mobility and psychological stress or acute disease. However, the impact of these factors on nutritional status may not be as profound in younger adults, thereby interfering with the performance of the MNA-SF in younger adults.

Hence further research may be required to explore alternatives for malnutrition screening tools for younger adults in rehabilitation. A larger study of the MNA-SF may establish predictive validity for clinical outcomes in this age group or the MNA-SF may need to be refined, with minor changes to the item relating to weight loss, potentially making it more applicable for this age group. Alternatively, the efficacy of other nutrition screening tools for younger adults, such as the Rapid Screen, or a tool validated in the acute care setting such as the MUST could be validated for both young and old in rehabilitation.

The advantage of this study was that it employed a consecutive recruitment method and had a high response rate (96%), making the study sample more representative. Additionally, the MNA-SF was administered by only two dietitians, thus limiting inter-observer variation in the screening process. However, there were some limitations which need to be taken into account. The group of younger adults in this study may not be representative of younger rehabilitation patients in general, due to the fact that this particular facility admits very few spinal and severe trauma patients compared with some other major rehabilitation facilities. Readmissions to acute care were only collected from public hospital records, so some readmissions may not have been captured mortality data was only taken from OACIS which does not provide a comprehensive record of deaths. Due to the non- experimental design of the study patients who were assessed as malnourished or at risk of malnutrition received nutrition intervention. Therefore the lack of significant associations between malnutrition and clinical outcomes could be attributed to improvements in nutritional status due to nutrition intervention during admission. The validity testing performed was also only addressing predictive validity, a comparison to a reference standard was not included. Finally, as discussed above, the sample size in this study was relatively small, as was the total number of adverse events. Future research directions might include a larger study to avoid risk of type 2 error, inclusion of an objective and comprehensive assessment of nutritional status to be used as a reference standard and if our findings are confirmed, refinement of the MNA-SF to address deficits and improve ability to be used across the entirety of patients admitted to the rehabilitation setting.

In conclusion, malnutrition is common in the rehabilitation setting amongst younger adults and although validated screening tools are available for its identification in older adults undergoing rehabilitation, there is no such instrument currently validated for younger adults in this setting. Ideally the same tool would be used across all age groups in the rehabilitation setting for efficiency purposes, however this study could not demonstrate that the MNA-SF has predictive validity for relevant clinical outcomes in younger adults. Further research into the appropriateness of the tools currently validated for rehabilitation or alternatively, investigation of the validity of other nutrition screening tools in the rehabilitation setting is required.


Acknowledgements: The authors would like to thank the Nutrition & Dietetics Department of Flinders University for providing financial support for the initial stages of the case note audit. We are also grateful to Karen Storah for her work in data collection.

Conflicts of interest: The authors have no conflicts of interest to disclose.


References

  1. Watterson C, Fraser A, Banks M et al. Evidence based practice guidelines for the nutritional management of malnutrition in adult patients across the continuum of care. Nutr Diet 2009;66:1-34.

  2. Barker L, Gout B, Crowe T. Hospital malnutrition: prevalence, identification and impact on patients and the healthcare system. Int J Env Res Pub Health 2011;8:514-527.

  3. Neumann S, Miller M, Daniels L, Crotty M. Nutritional status and clinical outcomes of older patients in rehabilitation. J Hum Nutr Diet 2005;18:129-136.

  4. Visvanathan R, Penhall R, Chapman I. Nutritional screening of older people in a sub-acute care facility in Australia and its relation to discharge outcomes. Age & Ageing 2004;33:260-265.

  5. Kaur S, Miller M, Halbert J, Giles L, Crotty M. Nutritional status of adults participating in ambulatory rehabilitation. Asia Pac J Clin Nutr 2008;17:199- 207.

  6. Nip W, Perry L, McLaren S, Mackenzie A. Dietary intake, nutritional status and rehabilitation outcomes of stroke patients in hospital. J Hum Nutr Diet 2011;24:460-469.

  7. Ranhoff A, Gjoen A, Mowe M. Screening for malnutrition in elderly acute patients: the usefulness of the MNA. J Nutr Health Aging 2005;9:221-225.

  8. Rubenstein L, Harker J, Salva A et al. Screening for undernutrition in geriatric practice: developing the short-form Mini-Nutritional Assessment (MNA-SF). J Gerontol A Biol Sci Med Sci 2001;56:M366–M372.

  9. Kaiser MJ, Bauer JM, Uter W et al. Prospective validation of the modified Mini Nutritional Assessment Short-Forms in the community, nursing home and rehabilitation setting. JAGS 2011;59:2124-2128.

  10. Phillips MB, Foley AL, Barnard R, Isenring EA, Miller MD. Nutritional screening in community-dwelling older adults: a systematic literature review. Asia Pac J Clin Nutr 2010;19:440–9.

  11. Neumann SA, Miller MD, Daniels LA, Ahern M, Crotty M. Inter-rater reliability and validity of the Mini Nutritional Assessment in older Australians undergoing rehabilitation. Nutr Diet 2007;64:179–85.

  12. Kaiser M, Bauer J, Ramsch C et al. Validation of the Mini Nutritional Assessment Short- Form: A practical tool for identification of nutritional status. J Nutr Health Aging 2009;13:782-788.

  13. National Preventative Health Taskforce Obesity Working Group (2009) Australia: the healthiest country by 2020. Technical Report No 1. Obesity in Australia: a need for urgent action. Commonwealth of Australia. http://www.health.gov.au/internet/preventativehealth/publishing.nsf/Co ntent/tech-obesity. Accessed 10 May 2013.

  14. Australian Bureau of Statistics. National Health Survey 2004-05: Summary of results. ABS cat.no. 4364.0. Canberra:ABS, available at: http://www.abs. gov.au/ Accessed 03 September 2013.

  15. Folstein MF, Folstein SE, McHugh PR. Mini-mental state. A practical method for grading the cognitive state of patients for the clinician. J Psychiatr Res 1975;12:189-198.

  16. Nestle Nutrition Institute (2009) Mini Nutritional Assessment. http://www.mna-elderly.com/forms/mini/mna_mini_english.pdf. Accessed 15 December 2012.

  17. Auyeung TW, Lee JSW, Kwok T, Leung J, Leung PC & Woo J. Estimation of stature by measuring fibula and ulna bone length in 2443 older adults. J Nutr Health Aging 2009;13: 931-936.

  18. Barbosa VM, Stratton RJ, Lafuente E, Elia M. Ulna length to predict height in English and Portuguese patient populations. Eur J Clin Nutr 2012;66:209-15.

  19. Wright, J (2000) The FIM(TM). The Center for Outcome Measurement in Brain Injury. http://www.tbims.org/combi/FIM. Accessed 20 April 2013.

  20. Slattery A, Wegener L, James S, Satanek M, Miller M. Does the Mini Nutritional Assessment-Short Form predict clinical outcomes at 6 months in older rehabilitation patients? Nutr & Diet, 2013. Accepted for publication.

  21. Charlton K, Nichols C, Bowden S, Lambert K, Barone L, Mason M, Milosavljevic M. Older rehabilitation patients are at high risk of malnutrition: evidence from a large Australian database. J Nut Health Aging 2010;18:622- 628.

  22. Compan B, Di Castri A, Plazi JM, Arnaud-Battandier, F. Epidemiological study of malnutrition in elderly patients in acute, sub-acute and long-term care using the MNA. J Nutr Health Aging 2002;3: 146-151.

  23. Beck E, Carrie M, Lambert K, Mason S, Milosavljevic M, Patch C. Implementation of malnutrition screening and assessment by dietitians: malnutrition exists in acute and rehabilitation settings. Aust J Nutr Diet 2001;58:92-97.

  24. Elia M. Screening for malnutrition: a multidisciplinary responsibility. Development and use of the Malnutrition Universal Screening Tool (‘MUST’) for adults. BAPEN, Redditch, 2003.

  25. Kruizenga HM, Seidell JC, De Vet HCW, Wierdsma NJ, van Bokhurst-de Van der Schueren MAE. Development and validation of a hospital screening tool for malnutrition: the Short Nutritional Assessment Questionnaire (SNAQ). Clin Nutr 2005;24:75–82.

NUTRITIONAL CHALLENGES FOR THE FAMILY CAREGIVER AND PERSON WITH DEMENTIA DYAD

E. Beattie1,2, J. McCrow1,2, C. Dyce3, E. Fielding2, E. Isenring3,4


1. Institute of Health and Biomedical Innovation, Brisbane, Queensland, Australia; 2. School of Nursing, Queensland University of Technology, Queensland, Australia; 3. Centre for Dietetics Research, School of Human Movement Studies, University of Queensland, Brisbane, Queensland, 4072, Australia; 4. Department of Nutrition and Dietetics, Princess Alexandra Hospital, Woolloongabba, Queensland

Corresponding Author: Elizabeth Beattie, School of Nursing, 6th floor, N Block, Queensland University of Technology, Kelvin Grove QLD 4059 Australia, elizabeth.beattie@qut.edu.au, Tel: +61 7 3138 3847, Fax: +61 7 3138 5941


Abstract

Background: The majority of people with dementia live at home until quite late in the disease trajectory, supported by family caregivers who typically take increasing responsibility for providing nutrition. Caregiving is highly stressful and thus both dyad partners are at risk of nutritional issues. Objective: This study evaluated the nutritional status of both dyad members and the associations between these. Design: Descriptive, correlational. Setting: Community. Participants: 26 dyads of persons with dementia and caregivers. Measurements: The nutritional status of each dyad member was evaluated at home using a comprehensive battery of measures including the Mini-Nutritional Assessment, Corrected Arm Muscle Area and a 3-day food diary. Stage of dementia and functional eating capacity was measured for the person with dementia. Caregivers completed a brief burden scale. Result: Of those with dementia (n = 26), a large proportion had nutritional issues (one was malnourished and another 16 were at risk). Six of the caregivers were at risk of malnutrition. In addition, fifteen of the people with dementia did not meet their recommended daily energy requirements. A moderate and significant positive correlation between functional eating skills and nutritional status (MNA score) among participants with dementia was found (r = .523, n = 26, p = .006). Conclusion: These findings suggest that a dyadic perspective on nutritional status provides important insights into risk in this vulnerable group. Specifically, monitoring of the functional eating independence skills of the person with dementia is critical, along with assisting caregivers to be aware of their own eating patterns and intake.


Key words: Dementia, nutritional status, caregiver, community, malnutrition.


Introduction

Poor nutritional status in the elderly population is an important predictor of morbidity and mortality (1). For older people living with dementia nutritional status is particularly important, given strong evidence that weight loss is associated with dementia, particularly Alzheimer’s Disease (2). An estimated 35.6 million people worldwide live with dementia, a number expected to double by 2030 and more than triple by 2050 (3). Dementia is considered to be a leading cause of dependency and disability among older people internationally (3).

Weight loss in persons with Alzheimer’s Disease begins up to six years prior to the diagnosis of dementia and accelerates one to two years before the onset of cognitive symptoms (2). This unintentional weight loss contributes to an increased risk of frailty, immobility, illness and premature morbidity (4). For people with dementia in whom adequate nutrition is not maintained, weight loss and malnutrition may occur in excess of that resulting from the disease process alone (5, 6). Protein- energy malnutrition, common among frail elders, is defined as insufficient dietary intake leading to an inadequate nutritional status, weight loss, and muscle wasting (1).

To date nutrition research has predominantly focused on the nutritional status of the person with dementia with more known about those living in residential care than in the community. However, the majority of people with dementia continue to live at home until quite late in the disease trajectory, supported by family caregivers, with caregivers typically taking increasing responsibility over time for food choices for the person with dementia as well as themselves. Typically the level of support required increases as the disease progresses (2).

Recent theoretical work has generated a concept analysis and model of mealtime difficulties in people with dementia, from an examination of 48 literature sources, again primarily from residential care settings (7). Important antecedents and attributes of mealtime difficulties include social and cultural factors, eating abits, mealtime patterns, environment, cognitive status and dyad interaction. As the extent of assistance needed increases, the associated impact on the caregiver as well as the person with dementia is significantly increased.

Given that caring for a person with dementia is highly stressful, and is associated with physical and emotional burden (8) and poor nutrition (9, 10), it is important to understand more about the nutritional status of both the caregiver and the person with dementia within the dyadic relationship. Previous observational research has shown that caregivers eat fewer than two meals per day however little is known about the actual nutritional status of family caregivers (11).

Collectively these findings support the need for further research investigating dyadic nutritional status as potentially there may be some evolving dyadic nutritional profiles. This descriptive, cross-sectional study reports on the nutritional status of community-dwelling people with dementia and their family caregiver, addressing this gap.

Specifically, our research questions were:

  1. What is the nutritional status and dietary intake (and associations between these) of community-dwelling dyads of caregivers and people with dementia?

  2. What associations exist between level of cognitive impairment and nutritional status for the person with dementia?

It was hypothesized that both family caregivers and the person with dementia would be at risk of nutritional issues and there would be a dyadic nutritional relationship.


Methods

Participants

The participants were community-dwelling people with dementia and their adult family caregivers, located in South East Queensland, Australia. Potential participants were initially identified through a variety of mechanisms including: community home care workers, respite centre managers/coordinators and multimedia advertisements. Inclusion criteria were: care recipient and the caregiver relative living in the same household; person with dementia aged 55+ with a diagnosis of dementia and independently ambulating. To be eligible the caregiver must have reported that they prepared at least ten meals per week for their relative. People with dementia were excluded if they had a concurrent disease, such as cancer, causing unintentional weight loss.

Approval for this project was obtained from the Human Research Ethics Committees of all relevant universities, health districts and facilities. Written informed consent for participation was provided by the participants and/or the responsible relative or legal guardian.

Measures/ instruments

All participants completed an assessment battery including a demographic questionnaire.

For both dyad members

Nutritional status was assessed using the Mini Nutritional Assessment [MNA] (12).

Body weight and fat and fat-free mass were assessed using electronic Tanita scales.

Corrected Arm Muscle Area [CAMA], an indicator of nutritional status in terms of body protein and fat stores, was calculated from mid-upper arm circumference and tricep skin fold [TSF]. Triplicate TSF measurements (to the nearest 0.2mm) were made using a standard procedure (Harpenden calipers) (13).

A 3-day food diary was recorded by the caregiver on two week days and one weekend day (14). Due to the cognitive decline issues in this group, it was decided that dietary intake assessment methods relying on recall were not the best choice. In addition 3-day diet diary has been shown to be valid and acceptable for this older age group (15). Participants utilized a simple instruction booklet developed by the study dietician for recording food and fluid type with specified portions. Experienced RAs assisted the caregiver with checking and completing the diaries. When participants did not list all details, some common assumptions were used, such as: generic products were selected when no product brand was recorded; preparation of common meals were assumed when details were not specified (such as sandwiches, stews and curries); and portion sizes were based on previous meals when not recorded in detail.

For the person with dementia

Global cognitive status was quantified using the Mini- mental Status Exam [MMSE] (16). The MMSE yields a global performance score (maximum 30) from eleven, absolute anonymity & fast. items measuring orientation, registration, attention and calculation, recall, language and construction tasks.

Stage of dementia was assessed using the Clinical Dementia Rating Scale [CDR] (17), completed by the caregiver.

Functional self-eating skill of the person with dementia was assessed using the Eating Behavior Scale [EBS] over three meal times. This six item scale measures self-eating in five dimensions, with a total score of 18: attention to meal; ability to locate food; use of utensils; biting, chewing and swallowing, and ending the meal (18).

For the Caregiver only

Pearlin’s four-item scale was used to assess the strain (burden) of caring for someone with dementia (e.g. you are exhausted when you go to bed at night). Caregivers rated each item on a 4-point scale from 1 (not at all) to 4 (completely) (19).

Procedures

Following informed consent, dyads were mailed a package with several of the instruments to be filled out in their own time. Other instruments were collected face-to- face during a 90-minute home visit by two research assistants. At this visit, anthropometrics (height and weight) were taken and household measuring implements (cups, spoons, liter jug, electronic food scale) were left for the caregiver to complete the three-day food and fluid diary. A follow-up phone call was made with each caregiver to answer any emerging questions they may have had about completing the food and fluid diary.

Statistical Analyses

All analyses were performed using the Statistical Package for the Social Sciences (SPSS) version 21. Daily mean protein and energy content was calculated from the three-day record using Australian food composition data (Food Works Professional version 7, Xyris software, Brisbane). Percentages of estimated energy and protein requirements met [EER and EPR] for each participant were calculated using a conservative value of 114kJ/kg (26kcal/kg) and 0.9g/kg of body weight. Global CDR was derived from the scores following the original CDR guidelines (17).

Descriptive statistics were used to summarize characteristics of the sample and frequency calculations were used to summarize the categorical validation response variables. Pearson correlations were used to test the following associations: within person between nutritional status and energy and protein intake; for the person with dementia between nutritional status and cognitive status and functional eating status; and within- dyad between the nutritional status of caregiver and person with dementia. Statistical significance was at the standard P


Results

A total of 32 dyad participants responded to our recruitment requests. Of these, one was excluded because of the advanced state of dementia, two dyads declined to participate, two failed to return consent forms and one dyad withdrew because of a serious medical event. A sample of 26 dyads was included in the final analyses.

The spouse of the person with dementia (n = 21) was the most reported caregiver relationship, with other family members including grandchildren and children making up the rest of the sample. The median time of care-giving was 51 months (range 7-156 months). However, most caregivers (n = 21) had been formally caring for the person with dementia for three years or longer.

The type of dementia for half of the participants was Alzheimer’s (n = 13), with five having vascular, one having Lewy body and one early onset (the remaining six were unsure as to specific type). Results from the CDR indicated that participants were in the following stages of dementia: eleven mild, eight moderate, and three severe, with four having questionable dementia.

In terms of caregiver burden, the mean score was 9 out of a maximum of 16. The most frequently reported strain was that they were “exhausted when they went to bed at night”—half (13 out of 26) answered ‘quite a bit’ or ‘completely.’ In addition, eleven caregivers chose one of those two categories for “did not have time just for themselves.” Other demographic and clinical characteristics of the participants are presented in Table 1.

Table 1: Characteristics of the Participants

MMSE = The Mini Mental State Examination; BMI = Body Mass Index; FFM = Fatfree
Mass; CAMA = Corrected Arm Muscle Area; MNA = Mini-Nutritional Assessment

Question one: Nutritional status and dietary intake

Results from the MNA indicated that one of the people with dementia was malnourished and 16 (out of 26) were at risk of malnutrition. None of the caregivers were identified as malnourished, while six were at risk of malnutrition. Figure 1 displays the distributions of the nutritional profiles of the participants as measured with the MNA. When assessing the dyad nutritional status, again with MNA, results indicated that four of the dyads were both at risk of malnutrition and seven were both well nourished. For the remaining, two dyads had only the caregiver at risk of malnutrition, while only the person with dementia was at risk in half (n = 13) of the sample (see Figure 2).

Figure 1: Nutritional Profiles of Participants. MNA indicator scores: less than 17 points = malnourished; 17 to 23.5 points = at risk of malnutrition; 24 to 30 points = normal nutritional status.


Figure 2: Nutritional Status of Dyad.


Of the total sample, one dyad could not complete the three day food diary due to comprehension difficulties. Of the caregiver participants, the mean reported daily energy and protein intake was 8300 kJ (± 2000) and 80g (±

30) respectively (Table 1). The dementia sample reported a mean daily energy intake of 7700 kJ (± 2700) and a mean protein intake of 80g (± 29). Of the caregiver sample, nine participants did not meet their EER and six participants did not meet their EPR. Fifteen (of 26) of the participants with dementia did not meet their EER and nine did not meet their EPR.

In assessing whether there was a relationship between the nutritional status of the caregiver and the person with dementia within a dyad, bivariate tests were computed for each variable. The only two nutritional variables showing a significant within-dyad association was for the percent of EER (and the percent of EPR) met by the diary food intake of the caregiver and the person with dementia (EER: r = .463, n = 25, p = .020; EPR: r = .514, n = 25, p = .009).

There was a moderate positive relationship between CAMA scores and protein intake in the caregiver sample (r = .41, n = 25, p = .043) and between CAMA and energy (r = .45, n = 25, p = .025) and CAMA and protein (r = .40, n = 25, p = .046) among the people with dementia. There were no statistically significant relationships between MNA scores and protein and energy intake for either group. Similarly, none of the relationships between meeting EER and EPR and CAMA and MNA status were statistically significant. However, among the participants with dementia, the correlation between functional eating skills and nutritional status (MNA score) was positive, moderate in size and significant (r = .523, n = 26, p =.006).

Question two: relationship between cognitiveimpairment and nutritional status

For the people with dementia Pearson’s r was computed to assess the relationship between MNA scores and level of cognition as rated by the MMSE. There was no significant correlation between the two variables (r =.26, n = 26, p = .206).


Discussion

Summary of key findings

This study provides a description of the nutritional status of community-dwelling dyads of people living with dementia and caregivers. In the community, 15% of older people are at risk of malnutrition with an additional 5-30% being malnourished (1, 20). The striking finding in this study was the very high (16 of 26) proportion at risk of malnutrition among the participants with dementia compared to normative rates in the non-caregiver non- dementia diagnosed population with a similar age profile (21). In addition, almost a quarter of family caregivers (n = 6) presented as at risk of malnutrition. These results are in line with the small number of existing studies of community-dwelling people with dementia. In the only other study (n = 56) to look at dyads, Rullier et al (2012) found a similar prevalence (59%) of people with dementia being at risk of malnutrition, but a higher prevalence (23%) being malnourished (22). In Rullier et al’s sample, more of the family caregivers displayed nutritional issues; nearly a third (32%) were at risk of malnutrition while 5% were malnourished. Two other studies  examined only people with dementia; a large study (n = 940) resulted in quite similar malnutrition prevalence rates to the current study (5% malnourished and 43% at risk) (23) and a smaller study (n = 49) identified 43% of dementia participants as malnourished or at risk (24).

Our study found an alarmingly high prevalence of suboptimal protein and energy consumption, especially in people with dementia. Because our estimates of energy and protein requirements were conservative (0.9kg/kg) these results are likely to underreport the percentage of subjects meeting actual requirements (i.e. if 1.2g/kg had been used). These results largely support current literature, which infers that poor dietary intake is prevalent among older people with cognitive impairment (25). Energy and protein are vital nutrients and key to the maintenance of health in older adults.

An important association linking eating behavior disturbances and the risk of malnutrition is highlighted by this study. Our results indicate diminished independence of eating behaviors is strongly related to the risk of malnutrition. Those participants whose dementia most affected their eating abilities also tended to be at most risk of malnutrition. Many studies have investigated the role of nutrition on global functioning, showing an important association between malnutrition and functional decline (25). Cognitive disorders commonly influence the individual’s ability to function independently (26).

There are a number of risk factors that have been suggested to contribute to nutritional outcomes of people living with dementia, including severity of cognitive impairment and the timing of the formal dementia diagnosis (25). Conversely, Rullier et al (2012) found no association between malnutrition and cognitive severity (22), as in our results. Rullier et al hypothesized that it is primarily the role of specific activities of daily living affected by the trajectory of the disease and not solely diminished cognitive impairment that impacts nutritional status. Our sample comprised a wide range of cognitive impairment, and the diversity in individual symptoms and characteristics could also explain the results.

Implications for clinical practice

Our results suggest this vulnerable population would benefit from systematic dietary assessment and intervention to prevent further inadequacy in dietary intake and increased nutritional risk, consistent with recommendations by Shatenstein, Kergoat & Reid (2007) (25). Simple nutritional screening can help identify not only people with dementia at nutritional risk but their co- dwelling caregivers with similar risk. A comprehensive appraisal of the level of independence of the person with dementia in the context of eating behaviors is particularly important. Prioritizing eating behavior autonomy, and evaluating when and how to provide eating assistance, may prove to be the most effective intervention to maintain nutritional status of the caregiving dyad. Caregivers and dietetic professionals need to be aware that dyads are at particularly high risk of suboptimal protein and energy intake and that focusing only on the person with dementia or only on the caregiver may provide a limited view of the situation. Keller et al (2007) argues that the interactions among the caregiving dyad during the feeding-related activities, including mealtimes, are central to the nutritional status of both members of the dyad. This underlines the importance of not only assessing eating behavior autonomy, but highlights that for the most effective nutritional interventions a multi-faceted approach that prioritizes eating autonomy may offer the most productive outcome.

Limitations and directions for future research

The relatively small sample size is a primary limitation of this study. However since this is only the second published study of dyads found in the literature, it provides important insights into the challenges of dyad recruitment and measurement in nutrition-focused dementia studies. Future research needs to explore the role of specific symptoms associated with cognitive impairment and caregiver challenges that may contribute to increased risk of poor nutritional outcomes. Increased knowledge of how dyads operate at home at mealtimes and how food is decided upon, prepared and shared is also important in understanding the dynamics of malnutrition in these vulnerable pairs. This, in turn, may allow for the development of more effective interventions to delay or prevent malnutrition.

Not only are persons with dementia at high risk of malnutrition but also their co-dwelling caregivers. It is evident that this population is at risk of suboptimal energy and protein intake and therefore and that those caregivers need to be mindful of their own vulnerability to nutritional issues.


Acknowledgements: The authors would like to acknowledge the 26 caregiver- person with dementia dyads that freely gave their time to participate in this study. Recruitment would not have succeeded without the assistance of the many aged care providers involved. In addition, able research assistance was provided by Joan Connor, Daniel Lee, and Margaret MacAndrew.

Funding: This project was funded the Alzheimer’s Australia Hazel Hawke Research Grant in Dementia Care. The sponsors had no role in the design and conduct of the study; in the collection, analysis, and interpretation of data; in the preparation of the manuscript; or in the review or approval of the manuscript.


References

  1. Watterson C, Fraser A, Banks M, et al. Evidence based practice guidelines for the nutritional management of malnutrition in adult patients across the continuum of care. Nutr Diet 2009; 66:S1-S34.

  2. Johnson DK, Wilkins CH, Morris JC. Accelerated weight loss may precede diagnosis in Alzheimer disease. Arch Neurol 2006; 63:1312- 7.

  3. World Health Organization. Dementia: A public health priority. 2012. Geneva: WHO.

  4. White H, Pieper C, Schmader K. The association of weight change in Alzheimer’s disease with severity of disease and mortality: a longitudinal analysis. J Am Geriatr Soc 1998; 46:1223- 7
  5. Morley JE. Dementia is not necessarily a cause of undernutrition. J Am Geriatr Soc 1996; 44:1403-4.

  6. Franzoni S, Frisoni GB, Boffelli S, Rozzini R, Trabucchi M. Good nutritional oral intake is associated with equal survival in demented and nondemented very old patients. J Am Geriatr Soc 1996; 44:1366-70.

  7. Aselage MB, Amella EJ. An evolutionary analysis of mealtime difficulties in older adults with dementia. J Clin Nurs 2010; 19:33-41.

  8. Vitaliano PP, Young HM, Zhang J. Is caregiving a risk factor for illness? Curr Dir Psychol Sci 2004; 13:13-6.

  9. Mujuru NG. The psychosocial impact of care-giving on the family caregivers of chronically ill AIDS/HIV patients in home based care. 2010. Master’s Thesis: University of the Witwatersrand, Johannesburg.

  10. Branscum A. Stress and coping model for family caregivers of older adults. 2010. Dissertation: University of Iowa.

  11. Rabinowitz YG, Gallagher-Thompson D. Health and health behaviors among female caregivers of elderly relatives with dementia. Clin Gerontologist 2007; 31:1-15.

  12. Guigoz Y, Vellas B, Garry P. Mini Nutritional Assessment: a practical assessment tool for grading the nutritional state of elderly patients. In: Vellas B, Guigoz Y, Garry P, Albarede J (eds) The mini nutritional assessment: MNA. Nutrition in the elderly. 1997. Paris, Serdi, pp 15-60.

  13. Friedman PJ, Campbell JA, Caradoc-Davies TH. Prospective trial of a new diagnostic criterion for severe wasting malnutrition in the elderly. Age Ageing 1985; 14:149-54.

  14. Gibson RS. Principles of nutritional assessment 2nd ed. 2005. Oxford USA, Oxford University Press.

  15. Rothenberg E. Experience of dietary assessment and validation from three Swedish studies in the elderly. Eur J Clin Nutr 2009; 63:S64-8.

  16. Folstein M, Folstein S, McHugh P. “Mini-Mental State”: A practical method for grading the cognitive state of patients for the clinician. J Psychiatr Res 1975; 12:189-98.

  17. Morris JC. Clinical dementia rating: a reliable and valid diagnostic and staging measure for dementia of the Alzheimer type. Int Psychogeriatr 1997; 9:173-6.

  18. Tully MW, Matrakas LK, Muir J, Musallam K. The Eating Behavior Scale. A simple method of assessing functional ability in patients with Alzheimer’s disease. J Gerontol Nurs 1997; 23:9-15.

  19. Pearlin LI, Mullan JT, Semple SJ, Skaff MM. Caregiving and the stress process: An overview of concepts and their measures. Gerontologist 1990; 30:583-94.

  20. Leggo M, Banks M, Isenring E, Stewart L, Tweeddale M. A quality improvement nutrition screening and intervention program available to Home and Community Care eligible clients. Nutr Diet 2008; 65:162-7.

  21. Rist G, Miles G, Karimi L. The presence of malnutrition in community-­‐living older adults receiving home nursing services. Nutr Diet 2012; 69:46-50.

  22. Rullier L, Lagarde A, Bouisson J, Bergua V, Barberger-­‐Gateau P. Nutritional status of community-­‐dwelling older people with dementia: Associations with individual and family caregivers’ characteristics. Int J Geriatr Psychiatry 2013; 28: 580-8.

  23. Roqué M, Salva A, Vellas B. Malnutrition in community-dwelling adults with dementia (Nutrialz trial). J Nutr Health Aging 2013; 17:295-9.

  24. Spaccavento S, Del Prete M, Craca A, Fiore P. Influence of nutritional status on cognitive, functional and neuropsychiatric deficits in Alzheimer’s disease. Arch Geront Geriatr 2009; 48:356-60.

  25. Shatenstein B, Kergoat M-J, Reid I. Poor nutrient intakes during 1-year follow-up with community-dwelling older adults with early-stage Alzheimer dementia compared to cognitively intact matched controls. J Am Diet Assoc 2007; 107:2091-9.

  26. Del Parigi A, Panza F, Capurso C, Solfrizzi V. Nutritional factors, cognitive decline, and dementia. Brain Res Bull 2006; 15; 69:1-19.