jarlife journal
Sample text

AND option

OR option

DENTITION AND MALNUTRITION RISK IN COMMUNITYDWELLING OLDER ADULTS


R. Zelig1,2, L. Byham-Gray1, S.R. Singer2, E.R. Hoskin3, A. Fleisch Marcus1, G. Verdino1, D.R. Radler1,2, R. Touger-Decker1,2


1. School of Health Professions’ Department of Nutritional Sciences at Rutgers University; 2. School of Dental Medicine, Department of Diagnostic Sciences, at Rutgers University; 3. School of Dental Medicine, Department of Restorative Dentistry, at Rutgers University

Corresponding Author: Rena Zelig, DCN, RDN, CDE, CSG, 65 Bergen Street #157, Newark, NJ 07107, (973)-972-5956, zeligre@shp.rutgers.edu

J Aging Res Clin Practice 2018;7:107-114
Published onlineAugust 7, 2018, http://dx.doi.org/10.14283/jarcp.2018.19


Abstract

Background and Objective: Older adults are at risk for both impaired oral health and suboptimal nutritional status. The objective of this study was to explore the relationships between malnutrition risk and missing teeth in community-dwelling older adults. Design: This was a retrospective cross-sectional analysis of data obtained from the electronic health records of 107 patients aged 65 and older who attended an urban northeast US dental school clinic between June 1, 2015 and July 15, 2016. Odontograms and radiographs were used to identify teeth numbers and locations; malnutrition risk was calculated using the Self-Mini Nutritional Assessment (Self-MNA). Relationships between numbers of teeth and malnutrition risk were assessed using bivariate logistic regression. Results: Participants (N=107) were 72.6 years (SD=5.6) of age; 50.5% were female. Mean Self-MNA score was 12.3 (SD=2.0) reflective of normal nutrition status; 20.6% were at risk for malnutrition, 4.7% were malnourished. Greater than 87% were partially or completely edentulous. Those with 10-19 teeth had lower Self-MNA scores (mean=11.6, SD=2.5) than those with 0-9 teeth (mean=12.7, SD=1.3) or 20 or more teeth (mean=12.6, SD=1.8) and had an increased risk for malnutrition (OR=2.5, p=0.076). Conclusion: The majority of this sample of older adults were partially edentulous and of normal nutritional status. Those with 10-19 teeth were more likely to be at risk for malnutrition. Further studies are needed to examine relationships between tooth loss and malnutrition risk and the impact of impaired dentition on the eating experience in a larger sample and to inform clinical practice.

Key words: Nutrition, Nutrition Assessment), MNA, Self-MNA, malnutrition, dentition, tooth loss, elderly.


Introduction

The relationships between nutrition and oral health are synergistic. The mouth is the entry way for food and fluid intake. If its integrity is impaired, the functional ability of an individual to consume an adequate diet may be adversely impacted. Older adults are a vulnerable population at high risk for both impaired oral health and malnutrition (1-4). Petersen (1) et al reported that 30% of older adults ages 65-74 globally were completely edentulous and many more were missing some of their natural teeth. Data from the United States (US) National Health and Nutrition Examination Survey (NHANES) 2011–2012, revealed that approximately 13% of those aged 65–74 and 26% of those aged 75 and over were edentulous (2).
Tooth loss may affect the ability of an individual to consume an adequate diet (5-9). Prior research has demonstrated relationships between nutritional status, nutrient intake, oral health and diet quality (5-9). The number and distribution of teeth impact masticatory function. Large population studies (5-9) have found that partial and complete edentulism are associated with changes in food and nutrient intake in older adults including decreased consumption of fruit, vegetables, dietary fiber, calcium, iron, and other vitamins.  Independent of its cause, inadequate intake in older adults leads to weight loss, malnutrition, and ultimately increased morbidity and mortality (10, 11).
The etiology of malnutrition in older adults is multifaceted and may be related to physiological and psychological changes that contribute to variable food and nutrient intake (12-14). Kaiser and colleagues (3) pooled analyses from multinational studies which used the Mini Nutritional Assessment (MNA) to evaluate malnutrition prevalence and risk and reported that 22.8% of the older adults studied were malnourished and 46.2% were at risk for malnutrition. Huhmann et al (4) explored malnutrition risk in community dwelling older adults using the Self-MNA , a validated self-administered version of the MNA and found that 27% of subjects were malnourished, 38% were at risk of malnutrition, and 35% had normal nutrition status (4).
A systematic review by Zelig et al (15) exploring the associations between missing teeth and nutritional status (determined by MNA score) in community dwelling older adults revealed conflicting findings. Significant associations were found in five of eight studies between missing teeth (16-18) or the use of dental prostheses (19, 20) and malnutrition risk. MNA scores were significantly lower in those with fewer teeth/limited occlusion as compared to those with more teeth and/or more posterior occluding teeth pairs.  However, other researchers did not report significant associations between occlusal status (21) or dental status (22) and MNA score.
Similarly, Toniazzo et al (23) systematically explored associations between malnutrition risk assessed by MNA or Subjective Global Assessment (SGA), and oral health status in elders and found that individuals with or at risk for malnutrition had significantly fewer teeth than those with normal nutritional status (23). However, similar to Zelig et al, a significant relationship between edentulism and malnutrition risk was not consistently identified.
Given the heterogeneity of the findings in this area (15, 23), the aim of this study was to explore the associations between nutritional status (as defined by the Self-MNA) and dentition status (missing teeth and edentulism with and without denture replacement) in older adults (=>65 years old) who came to the Rutgers School of Dental Medicine (RSDM) clinics in Newark, New Jersey (NJ), between June 1, 2015 and July 15, 2016.  Analyses from the NHANES surveys conducted from 1999-2010 have consistently shown that partial and complete edentulism are more common in females, in persons who are Black or Hispanic, and in those who are of a lower socio-economic status (24, 25). The population of patients treated at the RSDM provided a convenience sample of vulnerable individuals at high risk for impaired dentition status and malnutrition given their racial diversity and low socio-economic status (24-26). We hypothesized that Self-MNA scores will be significantly lower in those with fewer teeth/limited occlusion as compared to those with more teeth and/or more posterior occluding teeth pairs (15, 23).


Materials and Methods

Sample Design and Sample Selection

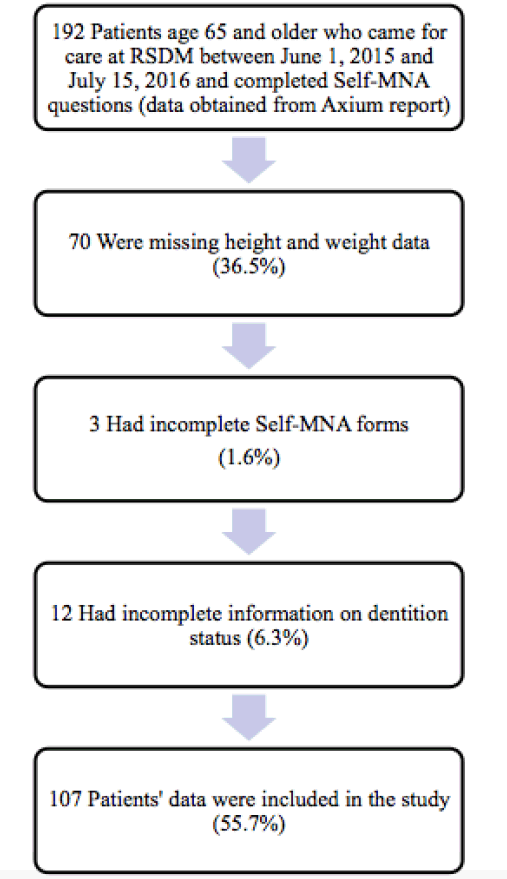
This was a retrospective cross-sectional analysis of data obtained from the electronic health records (EHR), (Axium, EXAN, Vancouver, BC, Canada) of patients who attended the RSDM clinic in Newark, NJ between June 1, 2015 and July 15, 2016. The EHR report contained select data provided by patients (n=192) during initial screening which included demographic characteristics, medical and dental history, and Self-MNA data. Patients were excluded (n=85) if they were younger than 65 years, height and/or weight were not available in the dental record, Self-MNA data were incomplete, and/or the number and location of teeth could not be accurately mined from the EHR. This study was approved by the Rutgers University Biomedical and Health Sciences Institutional Review Board.

Assessment of Nutritional Status

Data regarding nutritional status were obtained from the EHR using patient responses to the Self-MNA tool (Nestle Nutrition, available at http://www.mna-elderly.com/forms/Self_MNA_English_Imperial.pdf).
The original 18-item Mini Nutritional Assessment (MNA) was developed and validated in 1994 by Nestle Nutrition to detect risk for malnutrition in adults aged 65 and older (27).  A condensed version of the MNA, the Mini Nutritional Assessment Short Form (MNA-SF), containing only six questions, was validated to further facilitate rapid nutritional screening in older adults, as it takes only three to five minutes to administer and retains the diagnostic accuracy of the full MNA (28, 29). In 2013, the Self-Administered MNA (Self-MNA) was adapted from the MNA-SF and validated by Huhmann et al (4) to allow the patient to provide a self-assessment of their nutritional status (4). The Self-MNA requires that the patient or their caregiver complete the assessment prior to their appointment with the healthcare provider; it can then be reviewed with the healthcare provider to identify risk factors for malnutrition (4). The Self-MNA contains six questions which address recent changes in intake and weight, mobility, recent stress, illness, dementia and sadness, as well as body mass index (BMI). A score of 0-7 is considered malnourished, 8-11 is at risk of malnutrition and 12-14 reflects normal nutritional status (4).

Assessment of Dentition Status

Number and location of teeth were mined from the EHR using patient digital radiography and odontogram data. A research assistant, trained and calibrated with a prosthodontist, recorded tooth numbers as either “present” or “missing”. If the tooth surface had been restored with a permanent crown, implant, or fixed bridge the tooth was reported as “present.” The four third molars/wisdom teeth were not included as they are not consistently present in all individuals. The presence and location of these permanent natural or restored tooth surfaces was also used to categorize the number of anterior and posterior occluding pairs of teeth (AOP and POP, respectively), defined as the “presence of a natural (or restored permanent) tooth on the maxilla and corresponding mandible, excluding remaining roots or root caps (page 316)” (30). Number of natural or restored teeth was categorized in a manner similar to prior research into those with 0-9 teeth, 10-19 teeth and 20 or more teeth (17, 31, 32).

Data Analysis

All statistical analyses were conducted using the Statistical Package for Social Sciences (version 22.0, SPSS Inc., Chicago, IL). A sample size of 85 was determined to be needed to establish if a correlation existed between the number of remaining teeth and Self-MNA score, based on a two-tailed test with an a priori alpha of p≤0.05 and 80% power to detect  an small-moderate effect of at least 0.3 (33). Statistical significance was set at p<0.05.
Descriptive statistics were used to summarize all of the study variables. To test the hypothesis that Self-MNA scores will be significantly lower in those with fewer teeth / limited occlusion as compared to those with more teeth and/or more posterior occluding teeth pairs, Spearman’s Correlation Coefficient was used. Associations between categorical variables were evaluated using the chi-squared test; non-parametric Mann-Whitney and Kruskal-Wallis tests were used to compare groups. Simple logistic regression was used to assess the odds of being at risk for malnutrition or malnourished related to number of teeth present. To determine potential confounding by demographic characteristics, bivariate analyses were conducted in accordance to age, gender, race and ethnicity as well as prior medical history.


Results

Characteristics of the study sample

Records from 107 community dwelling older adults who came for care to the RSDM clinics in Newark, NJ between June 1, 2015 and July 15, 2016 were included in the analyses (Figure 1). Their mean age was 72.6 years (SD=5.6) with a range of 65-91 years. Table 1 describes demographic and clinical characteristics of participants.
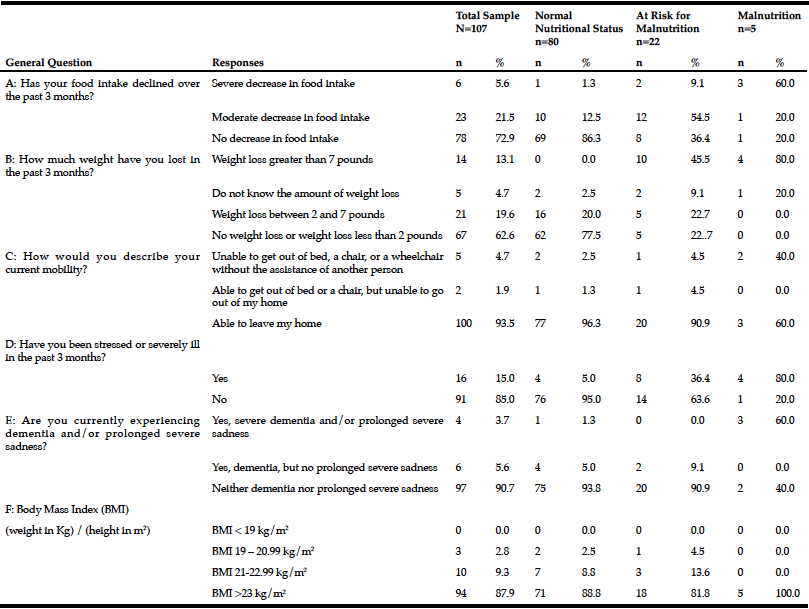
The mean Self-MNA score of this sample was 12.3 (SD=2.0) reflective of normal nutrition status. Twenty percent (20.6%, n=22) were at risk for malnutrition and 4.7% (n=5) were malnourished according to their Self-MNA responses. A moderate to severe decrease in food intake was reported by 27.1% (n=29) of the patients; 32.7% (n=35) indicated a weight loss of two or more pounds in the past three months (Table 2). Of those who reported a weight loss of more than seven pounds in three months (n=14), all were either at risk for malnutrition (n=10) or malnourished (n=4).
Of the five who were categorized as having malnutrition; 80% (n=4) reported a severe or moderate decrease in food intake, a weight loss greater than seven pounds in three months, and that they had been stressed or severely ill in the past three months; 60% (n=3) of these also had positive responses for severe dementia and/or prolonged sadness; 40% (n=2) were unable to get out of bed or a chair without assistance.
Using the Centers of Disease Control and Prevention (34) (CDC) BMI categories, 21.5% (n=23) were in the normal weight range, 43.0% (n=46) were overweight and 35.5% (n=38) were obese. All those whose Self-MNA score reflected malnutrition (n=5) were obese (mean BMI = 31.6, SD =4.5) with higher BMI values than those who had a normal nutritional status (mean BMI = 29.0, SD=5.0) or who were at risk for malnutrition (mean BMI = 27.6, SD=4.7).


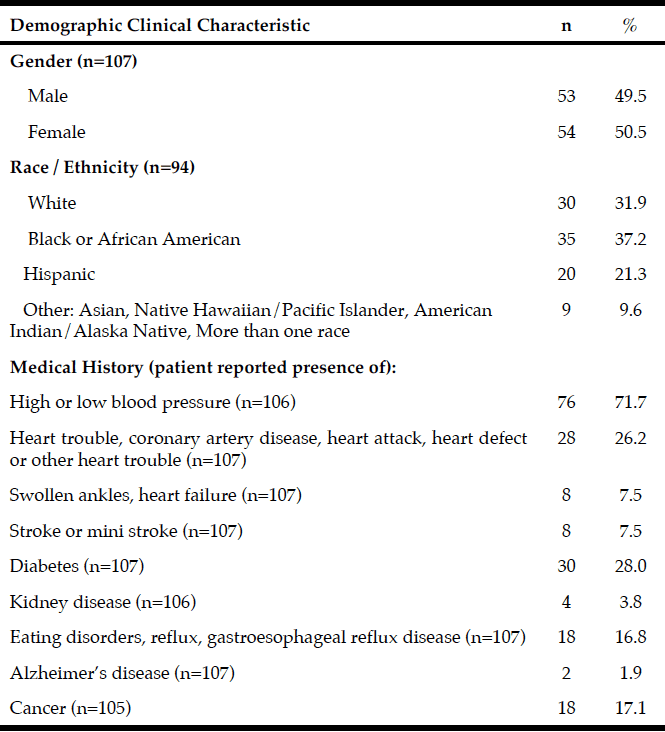
Table 1 Select demographic and clinical characteristics of the study sample (N=107)

Table 1
Select demographic and clinical characteristics of the study sample (N=107)

Note: Sample size for each question varied as participants were able to choose to not answer questions on the registration forms.

Table 2 Responses to Self-MNA questions by nutritional status category (N=107)

Table 2
Responses to Self-MNA questions by nutritional status category (N=107)


The majority of participants were partially edentulous (n=94, 87.8%); 4.7% (n=5) were completely edentulous and 7.5% (n=8) were fully dentate. Fifty-one (47.7%) had at least 20 teeth, 29.9% (n=32) had 10-19 teeth and 22.4% (n=24) had 0-9 teeth. Approximately one-third (35.5%, n=38) of the sample had no posterior occlusion and 7.5% (n=8) had complete posterior occlusion; approximately one quarter (26.2%, n=28) had no anterior occlusion and 43.0% (n=46) had complete anterior occlusion.
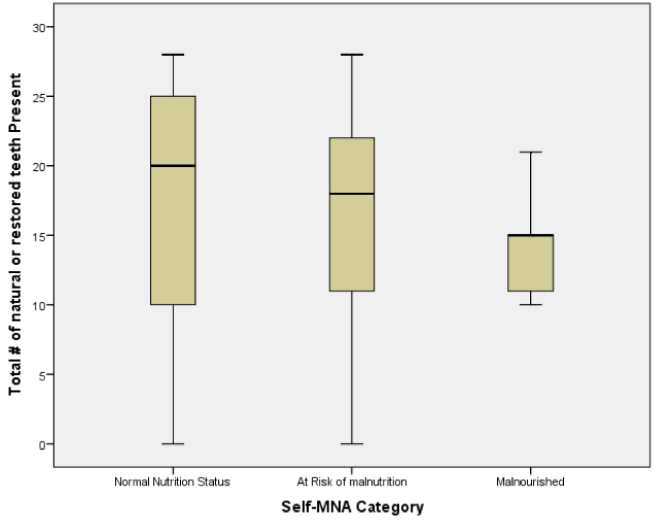
The mean number of natural or restored teeth decreased from 17.4 among those with normal nutritional status to 14.4 among those classified as having malnutrition; however, these differences were not statistically significant (p=0.656). Median values of teeth declined in a similar pattern, from 20 among those with normal nutritional status to 18 among those at risk for malnutrition and 15 among those categorized as having malnutrition (Figure 2).


Figure 1 Flow chart of study sample

Figure 1
Flow chart of study sample


Figure 2 Boxplot of number of natural or restored teeth by nutritional status category (N=107)

Figure 2
Boxplot of number of natural or restored teeth by nutritional status category (N=107)


Analyses of the relationships between dental and occlusal status and Self-MNA Score revealed no linear relationships between the Self-MNA score and the number of natural teeth (r=0.104, p=0.285), posterior occluding pairs (POP) of teeth (r=0.173, p=0.074) or anterior occluding pairs (AOP) of teeth (r=0.049, p=0.619).   Although mean differences were not significant (Kruskal-Wallis, p=0.116), those with 10-19 teeth had lower Self-MNA scores (mean=11.6, SD=2.5) than those with 0-9 teeth (mean=12.7, SD=1.3) or 20 or more teeth (mean=12.6, SD=1.8) (Figure 3). When MNA Score was dichotomized into those who were at risk for malnutrition or malnourished (25.2%, n=27) compared to those with normal nutritional status (74.8%, n=80), those with 10-19 teeth had 2.5 times the odds of being at risk for malnutrition/malnourished than those with 20 or more teeth (OR=2.5, p=0.076). Bivariate analyses yielded no statistically significant confounding effects of age, gender, race/ethnicity or medical history.
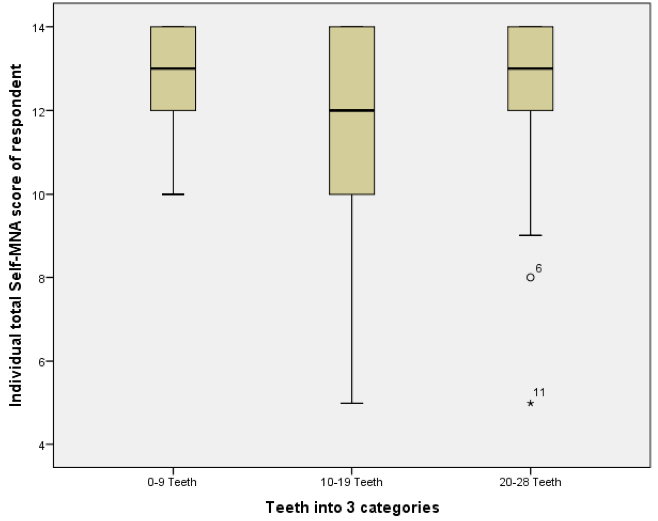
Figure 3 Boxplot of Self-MNA scores among those with different categories of natural or restored teeth (N=107)

Figure 3
Boxplot of Self-MNA scores among those with different categories of natural or restored teeth (N=107)


Discussion

The aim of this study was to explore the associations between nutritional status and dentition status among older adults who presented for care at the RSDM clinics in Newark, NJ.  The study hypothesis that Self-MNA scores will be significantly lower in those with fewer teeth / limited occlusion as compared to those with more teeth and/or more posterior occluding teeth pairs was not supported as a significant direct relationship between Self-MNA score and number of natural or restored teeth was not found.
The majority of the sample had some degree of tooth loss (87.8% partially edentulous; 4.7% completely edentulous). Although not statistically significant, there was a trend whereby the mean number of natural or restored teeth decreased from 17.4 in those with normal nutritional status to 14.4 in those classified as having malnutrition, suggesting a link between having fewer teeth and an increased risk of malnutrition. Those with 10-19 teeth had lower Self-MNA scores than those with 0-9 teeth or 20 or more teeth and, among those with 10-19 teeth the odds of being at risk for malnutrition/malnourished were 2.5 times those with 20 or more teeth. Interestingly, the patients with malnutrition had 10-19 teeth; none were fully dentate or fully edentulous.   Furuta et al (17) also noted a similar trend whereby those with 10-19 teeth had the lowest MNA-SF scores as compared to those with 0-9 teeth or greater than 20 teeth. While not significant, this finding suggests that those who are missing one third to two thirds of their natural teeth may be most at risk for becoming malnourished.
In contrast to our findings, Kikutani et al (16), Starr et al (18), and Furuta et al (17), reported significant associations between MNA scores and number of missing teeth whereby MNA scores were significantly lower in those with fewer teeth / limited occlusion as compared to those with more teeth and/or more posterior occluding teeth pairs of teeth. Kikutani et al found that individuals with more missing teeth and inadequate occlusion were more likely to be at risk for malnutrition, and those with functionally inadequate occlusion and no dentures had a 3.189 fold greater malnutrition risk than those with natural dentition and adequate function (16). Similarly, Starr et al demonstrated that individuals who were completely edentulous had significantly lower MNA scores than those who were partially or completely dentate (p = 0.028) (18). In bivariate models, Furuta et al found that those with 0-19 teeth had lower MNA scores than those with 20 or more teeth (p = 0.041), however, in a multivariate path analysis, no direct relationship was noted between oral health status and MNA score (17).
While the results of the current study showed similar trends they did not reach the level of statistical significance reported by others. Possible explanations for the variation in results lie in the differences in the populations studied. The subjects in our study were all patients of an urban northeast US dental school clinic in Newark, NJ, and were younger than participants in other studies (16-18). The combined 25% prevalence of malnutrition and risk for malnutrition was relatively lower than the 13.3% malnourished and additional 51.7% at risk for malnutrition reported by Kikutani et al (16), and 14.0% malnourished / 55.2% at risk of malnutrition reported by Furuta et al (17). Participants in the current study had more teeth (mean of 17.0 ±8.5 compared to 8.6 +/- 9.9) (17) and were less likely to be edentulous then those studied by Furuta et al (17). In contrast, the population studied by Starr et al represented healthy older adults who were free of medical conditions and medications at baseline, and as a whole had relatively high MNA scores with a mean of 8.0 or greater out of a maximum score of 9 using their version of the MNA tool (18).
Our findings are consistent with preceding studies, which were unable to find statistically significant relationships between number of teeth (35), occlusal status (21) or dental status (22) and MNA score. Systematic reviews of the evidence (15, 23), have similarly found much conflicting results due in part to the heterogeneity of the studies comparing these variables. Nutritional status and dentition status can be assessed in a variety of ways.  Varying clinical and demographic characteristics of the populations sampled such as age, health status and country of origin add to the complexity of this area of research.
Natural dentition and adequate function are important to maintain nutritional status. Missing teeth and inadequate occlusion affect masticatory function and can result in a decline in overall quality and quantity of intake (5-9) and/or replacement of difficult to chew foods with softer foods that may be more calorically dense and/or nutrient poor which could lead to changes in weight and overall nutritional status (36, 37). Further studies that address diet quality and quantity are necessary to better understand these relationships and guide implications for practice.

Strengths and Limitations

Although the study sample was adequately powered and representative of the population of older adults who attend the RSDM clinic, the majority were overweight/obese and of normal nutrition status. The findings are limited to a single institution and not generalizable to other community dwelling dental settings. Given the retrospective design of this study, a cause and effect relationship between variables could not be established.   Risk for malnutrition may be better assessed using a tool such as the MNA-SF, which considers oral health factors specifically when looking at inadequate intake.
Strengths include data collection over a 13-month timespan to assure an adequate sample size, the availability of all of the data in the EHR, and the verification of dentition status by a research assistant, who was trained and calibrated with a prosthodontist, using digital radiography and the patient’s odontogram. The subjective nature of all self-reported data, including all demographic characteristics, height, weight, and Self-MNA data is a potential limitation. Although the Self-MNA is a validated tool to assess malnutrition prevalence and risk, it lacks the details found in the MNA-SF  that prompts the healthcare professionals to assess the etiology behind a decline in food intake such as loss of appetite, digestive problems, chewing or swallowing difficulties (4).


Conclusion

The findings of this study did not support relationships between the number of natural or restored teeth and Self-MNA score in this sample of community dwelling older adults. Although not statistically significant, the mean number of natural or restored teeth declined as nutritional status declined, which may be clinically relevant. Those classified as having malnutrition had higher rates of weight loss, decreased intake and more frequently reported dementia and/or depression, and severe illnesses than those with a normal nutritional status. Similarly, those classified as being at risk of malnutrition were more likely to experience weight loss and a moderate decline in intake than those who were classified as being of normal nutritional status.

Implications for Research

Our findings add to the heterogeneity of research outcomes in this area. The conflicting findings between studies is in part due to the use of different measures of nutrition and dental status as well as variations in demographic characteristics. Further research with larger samples, in different populations of community dwelling older adults with varying health conditions is needed to better understand the associations between nutrition and oral health and increase the generalizability of results. Prospective studies to determine and compare changes in nutritional status over time with changes in dentition and denture usage can help to determine cause and effect. Qualitative research aimed at understanding how impaired dentition affects intake, the eating experience and overall nutritional status can also help to shed light on these relationships, and can provide the necessary data upon which to develop practice based interventions and guidelines for this vulnerable population.  Although the Self-MNA has been validated as a self-administered tool to determine malnutrition prevalence and risk in community dwelling older adults, research in this area may benefit from using the MNA-SF, which is administered by a healthcare professional as older adults may require more clarification of questions to elicit more accurate results. The MNA-SF also includes a question related to decline in intake attributed to chewing or swallowing difficulties.

Implications for Practice

The dental clinic setting may be an ideal location to perform nutritional status screenings. As reported by Greenberg et al, both oral healthcare professionals and patients were receptive to screening for various medical conditions at the time of a dental visit (38, 39). This could be expanded to include nutritional status screening to identify patients at risk for malnutrition who may not regularly attend visits with a primary care provider. The results of the current study revealed that over 25% of the sample of older adults in this research who came for care at the RSDM clinic had malnutrition or were at risk for malnutrition. Based on these results and previous studies that estimated the prevalence of malnutrition to be over one third in older adults (3, 4), the use of nutritional screening tools by oral healthcare professionals could help to provide timely referrals to primary care physicians or Registered Dietitian Nutritionists for these individuals. Referrals to community assistance programs (such as Meals on Wheels) could also be made as appropriate to prevent decline in nutrition status.


Ethical standards: This study was approved by the Rutgers University Biomedical and Health Sciences Institutional Review Board.

Funding agency: Sackler Institute for Nutritional Sciences. PI Rena Zelig received an early career investigator’s grant from the Sackler Institute for Nutrition Sciences for a project entitled “Exploring the Associations between Dentition Status, Nutritional Status, and the Eating Experience in Older Adults – A Mixed Methods Study.” The sponsors had no role in the design and conduct of the study; in the collection, analysis, and interpretation of data; in the preparation of the manuscript; or in the review or approval of the manuscript.

Acknowledgements: Funding for this project was provided by the Sackler Institute for Nutritional Sciences of the New York Academy of Sciences. The authors wish to acknowledge Dr. Michael Conte and the Office of Clinical Affairs and the Information Technology Department at the Rutgers School of Dental Medicine, Newark, NJ as well as Steven Britton, DMD, and Veronica Jones, MPH, Research Assistants for their help with this study.

Conflict of Interest Disclosure: All authors report that they have no conflicts of interest to disclose related to this research and manuscript.


References

1.    Petersen PE, Kandelman D, Arpin S, Ogawa H. Global oral health of older people–call for public health action. Community Dent Health 2010;27(4 Suppl 2):257-67
2.     Dye BA, Thornton-Evans G, Li X, Iafolla TJ. Dental Caries and Tooth Loss in Adults in the United States, 2011–2012. NCHS data brief, no 197. Hyattsville, MD. National Center for Health Statistics. 2015. Available at:
https://www.cdc.gov/nchs/data/databriefs/db197.pdf. Accessed January 12, 2018.
3.     Kaiser MJ, Bauer JM, Ramsch C, et al. Frequency of malnutrition in older adults: a multinational perspective using the mini nutritional assessment. J Am Geriatr Soc  2010;58(9):1734-8 doi: 10.1111/j.1532-5415.2010.03016.
4.     Huhmann MB, Perez V, Alexander DD, Thomas DR. A self-completed nutrition screening tool for community-dwelling older adults with high reliability: a comparison study. J Nutr Health Aging 2013;17(4):339-44 doi: 10.1007/s12603-013-0015-x
5.     Sahyoun NR, Lin CL, Krall E. Nutritional status of the older adult is associated with dentition status. J Am Diet Assoc 2003;103(1):61-6 doi: 10.1053/jada.2003.50003
6.     Sheiham A, Steele J. Does the condition of the mouth and teeth affect the ability to eat certain foods, nutrient and dietary intake and nutritional status amongst older people? Public Health Nutr 2001;4(3):797-803
7.     Zhu Y, Hollis JH. Tooth loss and its association with dietary intake and diet quality in American adults. J Dent 2014;42(11):1428-35 doi: 10.1016/j.jdent.2014.08.012
8.     Iwasaki M, Taylor GW, Manz MC, et al. Oral health status: relationship to nutrient and food intake among 80-year-old Japanese adults. Community Dent Oral Epidemiol 2014;42(5):441-50
9.     Ervin RB, Dye BA. Number of natural and prosthetic teeth impact nutrient intakes of older adults in the United States. Gerodontology 2012;29(2):e693-702 doi: 10.1111/j.1741-2358.2011.00546.x
10.     Zajacova A, Ailshire J. Body Mass Trajectories and Mortality Among Older Adults: A Joint Growth Mixture-Discrete-Time Survival Analysis. Gerontologist 2013 doi: 10.1093/geront/gns164
11.     Lundin H, Saaf M, Strender LE, Mollasaraie HA, Salminen H. Mini nutritional assessment and 10-year mortality in free-living elderly women: a prospective cohort study with 10-year follow-up. Eur J Clin Nutr 2012;66(9):1050-3 doi: 10.1038/ejcn.2012.100
12.     Lorenzo-Lopez L, Maseda A, de Labra C, Regueiro-Folgueira L, Rodriguez-Villamil JL, Millan-Calenti JC. Nutritional determinants of frailty in older adults: A systematic review. BMC Geriatr 2017;17(1):108 doi: 10.1186/s12877-017-0496-2
13.     Favaro-Moreira NC, Krausch-Hofmann S, Matthys C, et al. Risk Factors for Malnutrition in Older Adults: A Systematic Review of the Literature Based on Longitudinal Data. Adv Nutr 2016;7(3):507-22 doi: 10.3945/an.115.011254
14.     van der Pols-Vijlbrief R, Wijnhoven HA, Schaap LA, Terwee CB, Visser M. Determinants of protein-energy malnutrition in community-dwelling older adults: a systematic review of observational studies. Ageing Res Rev 2014;18:112-31 doi: 10.1016/j.arr.2014.09.001
15.     Zelig R, Touger-Decker R, Chung  M, Byham-Gray L. Associations between Tooth Loss, with or without Dental Prostheses, and Malnutrition Risk in  Older Adults: A Systematic Review. Top Clin Nutr 2016;31(3):232-47
16.     Kikutani T, Yoshida M, Enoki H, et al. Relationship between nutrition status and dental occlusion in community-dwelling frail elderly people. Geriatr Gerontol Intl 2013;13(1):50-4 doi: 10.1111/j.1447-0594.2012.00855.x
17.     Furuta M, Komiya-Nonaka M, Akifusa S, et al. Interrelationship of oral health status, swallowing function, nutritional status, and cognitive ability with activities of daily living in Japanese elderly people receiving home care services due to physical disabilities. Community Dent Oral Epidemiol 2013;41(2):173-81 doi: 10.1111/cdoe.12000
18.     Starr JMH, R. J.;Macintyre, S.;Deary, I. J.;Whalley, L. J. Predictors and correlates of edentulism in the healthy old people in Edinburgh (HOPE) study. Gerodontology 2008;25(4):199-204
19.     Cousson PY, Bessadet M, Nicolas E, Veyrune JL, Lesourd B, Lassauzay C. Nutritional status, dietary intake and oral quality of life in elderly complete denture wearers. Gerodontology 2012;29(2):e685-92 doi: 10.1111/j.1741-2358.2011.00545.x
20.     McKenna G, Allen PF, Flynn A, et al. Impact of tooth replacement strategies on the nutritional status of partially-dentate elders. Gerodontology 2012;29(2):e883-90 doi: 10.1111/j.1741-2358.2011.00579.x
21.     Soini H, Routasalo P, Lauri S, Ainamo A. Oral and nutritional status in frail elderly. Spec Care Dent 2003;23(6):209-15
22.     Soini H, Routasalo P, Lagstrom H. Nutritional status in cognitively intact older people receiving home care services–a pilot study. J Nutr Health Aging 2005;9(4):249-53
23.     Toniazzo MP, Amorim PS, Muniz FW, Weidlich P. Relationship of nutritional status and oral health in elderly: Systematic review with meta-analysis. Clin Nutr 2017 doi: 10.1016/j.clnu.2017.03.014
24.     Dye BA, Li X, Thornton-Evans G. Oral Health Disparities as Determined by Selected Healthy People 2020 Oral Health Objectives for the United States, 2009–2010. NCHS data brief: US Department of Health and Human Services, Centers for Disease Control and Prevention, National Center for Health Statistics, 2012.
25.     National Institutes of Health. National Institute of Dental and Craniofacial Research. Tooth Loss in Seniors (Age 65 and Over). Tooth Loss in Seniors (Age 65 and Over)  March 11, 2014. Available at: https://www.nidcr.nih.gov/DataStatistics/FindDataByTopic/ToothLoss/ToothLossSeniors65andOlder.htm. Accessed January 12, 2018.
26.     Bureau USC. QuickFacts. Newark city, New Jersey. Available at: https://www.census.gov/quickfacts/table/PST045215/3451000,34. Accessed January 12, 2018.
27.     Guigoz Y, Vellas B. The Mini Nutritional Assessment (MNA) for grading the nutritional state of elderly patients: presentation of the MNA, history and validation. Nestle Nutrition workshop series. Nestle Nutr Workshop Ser Clin Perform Programme 1999;1:3-11; discussion 11-2.
28.     Rubenstein LZ, Harker JO, Salva A, Guigoz Y, Vellas B. Screening for undernutrition in geriatric practice: developing the short-form mini-nutritional assessment (MNA-SF). J Gerontol A Biol Sci Med Sci 2001;56(6):M366-72
29.     Kaiser MJ, Bauer JM, Ramsch C, et al. Validation of the Mini Nutritional Assessment short-form (MNA-SF): a practical tool for identification of nutritional status. J Nutr Health Aging 2009;13(9):782-8
30.     Yoshida M, Kikutani T, Yoshikawa M, Tsuga K, Kimura M, Akagawa Y. Correlation between dental and nutritional status in community-dwelling elderly Japanese. Geriatr Gerontol Intl 2011;11(3):315-9 doi: 10.1111/j.1447-0594.2010.00688.x
31.     Ostberg AL, Nyholm M, Gullberg B, Rastam L, Lindblad U. Tooth loss and obesity in a defined Swedish population. Scand J Public Health 2009;37(4):427-33
32.     Syrjala AMY, P.;Hartikainen, S.;Sulkava, R.;Knuuttila, M. Number of teeth and selected cardiovascular risk factors among elderly people. Gerodontology 2010;27(3):189-92
33.     Portney L, Watkins M. Foundations of Clinical Research, Applications to Practice. 3 ed. Upper Saddle River, NJ: Pearson Education, Inc, 2009.
34.     Centers for Disease Control and Prevention. Healthy Weight. Secondary Healthy Weight. Available at: http://www.cdc.gov/healthyweight/assessing/bmi/adult_bmi/index.html. Accessed January 12, 2018.
35.     Lopez-Jornet P, Saura-Perez M, Llevat-Espinosa N. Effect of oral health dental state and risk of malnutrition in elderly people. Geriatr Gerontol Int 2013;13(1):43-49 doi: 10.1111/j.1447-0594.2012.00853.x
36.     Musacchio EP, E.;Binotto, P.;Sartori, L.;Silva-Netto, F.;Zambon, S.;Manzato, E.;Corti, M. C.;Baggio, G.;Crepaldi, G. Tooth loss in the elderly and its association with nutritional status, socio-economic and lifestyle factors. Acta Odontol Scand 2007;65(2):78-86
37.     Ikebe KM, K.;Morii, K.;Nokubi, T.;Ettinger, R. L. The relationship between oral function and body mass index among independently living older Japanese people. Int J Prosthodont 2006;19(6):539-46
38.     Greenberg BL, Glick M, Frantsve-Hawley J, Kantor ML. Dentists’ attitudes toward chairside screening for medical conditions. J Am Dent Assoc 2010;141(1):52-62
39.     Greenberg BL, Kantor ML, Jiang SS, Glick M. Patients’ attitudes toward screening for medical conditions in a dental setting. J Public Health Dent 2012;72(1):28-35 doi: 10.1111/j.1752-7325.2011.00280.x

BASELINE FINDINGS OF CARENUTRITION INTERVENTION (RCT) AMONG OLDER CAREGIVERS – RISK OF MALNUTRITION AND INSUFFICIENT PROTEIN INTAKE


S. Kunvik1,2, R. Valve2, K. Salminen1, M. Salonoja1, M.H. Suominen3


1. The Social Services and Healthcare Centre of Pori, Finland; 2. Department of Food and Environmental Sciences, University of Helsinki, Finland; 3. Unit of Primary Health Care, Helsinki University Central Hospital, Finland.

Corresponding Author: Susanna Kunvik, The Social Services and Healthcare Centre of Pori, Finland and Department of Food and Environmental Sciences, University of Helsinki, Finland, susanna.kunvik@gmail.com

J Aging Res Clin Practice 2017;6:117-123
Published online May 18, 2017, http://dx.doi.org/10.14283/jarcp.2017.13


Abstract

Objectives: Older caregivers are vulnerable to nutritional problems, but only a few studies have examined their nutrition. The purpose of this study was to determine the associations between nutritional status and nutrient intake among older caregivers. Design: Cross-sectional analysis of baseline data from the CareNutrition randomized controlled trial (RCT). Setting: Community-dwelling caregivers from the Western part of Finland in two different clusters. Participants: A total of 79 caregivers aged ≥65 with normal cognition were recruited for the study, all of whom had officially approved caregiver status by The Social Insurance Institution of Finland. Measurement: Nutritional status was assessed by the Mini Nutritional Assessment (MNA), nutrient intake by a three-day food diary, nutrition-related blood markers by laboratory tests, cognition by the Mini Mental State Examination (MMSE), and other baseline characteristics were also evaluated using validated methods. Results: The majority of the caregivers (79.7%) had a good nutritional status (MNA points >23.5), 19% were at risk of malnutrition (MNA points 17-23.5) and one person (1.3%) already suffered from malnutrition (MNA points <17). The female caregivers were at a higher risk of malnutrition than the males (26.5% vs. 6.7%, p=0.026). Depressive symptoms and medication were associated with decreased nutritional status, and good health-related quality of life with better nutritional status. Mean protein intake was 1.0 g/kg IBW/d and 79.7% of the caregivers (77.6% female, 83.3% male) did not consume the recommended protein intake of 1.2 g/kg IBW/d. Their intake of dietary fibre, folate and vitamin D was also insufficient. Conclusion: Every fifth caregiver was at risk of malnutrition. The females were at a higher risk than the males. Most of the caregivers had insufficient protein intakes. These findings confirm the importance of investigating the nutritional status of older caregivers and indicate a need for preventive nutritional guidance.

Key words: Caregiver, nutrition, nutrient intake.


Introduction

The world’s population is ageing, and as a consequence, the number of older people with disabilities and chronic diseases who need support and assistance will increase (1). Informal caregivers provide valuable services to people with long-term care needs. Europe has approximately 100–125 million caregivers (2). In Finland, about 350 000 caregivers help their relatives or loved ones, and in 2013, roughly 42 500 caregivers received support for informal care from their municipality. Half of these caregivers are ≥65 years old, and every fourth ≥75 years old. More than half are female and the majority take care of their spouses (3, 4).
Informal care is extremely important in the context of an ageing population, the increasing pressures on public finances, and rising life expectancy at older ages (5). Concern has been mounting about the health and welfare of people who provide informal care for family or friends with chronic illnesses. Older caregivers are often under a heavy burden and suffer from health problems themselves (6). They are at an increased risk of stress, depression and other health complications that can increase the risk of nutritional problems (7-10). Many factors increase this risk among older caregivers because ageing is accompanied by numerous cognitive, psychological and social factors, which may expose older people to inadequate nutrition and poorer well-being (11).
Studies have found the prevalence of malnutrition in community-dwelling older people to be 1%–5%, and one in four to be at risk of malnutrition (12, 13). Among older caregivers, the prevalence of malnutrition is around 5%, and about 16%–32% of caregivers are at risk of malnutrition (14, 15).  Intake of protein is also low (<1 g/kg/d) among older caregivers (16). Insufficient protein intake may contribute to age-related loss of lean muscle mass, which can in turn lead to impaired physical function (17). This can weaken caregivers’ ability to cope with everyday tasks and the provision of care. To maintain bone mass, muscle mass, and strength, protein intake should be 1.2–1.5 g protein/kg/d (18).
Relatively few studies have assessed the levels of nutritional risk and nutrient intake among community caregivers. Thus, our study aims to examine older (≥65 y) caregivers’ nutritional status and nutrient intake.


Methods

Setting

This cross-sectional study is part of a randomized controlled intervention trial, CareNutrition, which explores the effectiveness of tailored nutritional counselling on protein intake and wellbeing among older caregivers (≥65 y) and people (≥50 y) receiving care. In this cross-sectional study, we focus on older caregivers. The study was approved by the Ethics Committee of the Hospital District of Southwest Finland. Informed consent was obtained from the participants. The trial was registered and described at the Australian New Zealand Clinical Trials Registry, Trial Id: ACTRN12615001254583.

Participants

Caregivers were recruited for the study during nurses’ appointments, by inviting them to attend a caregivers’ well-being and health screening. These screenings were organized in two clusters; Autumn 2015 and Spring 2016. We invited two groups of caregivers; those who received care allowance from the Services for Disabled People (caregivers ≥65 years) and those who received care allowance from the Services for Older People (caregiver ≥40 years, informal carer ≥3 years). These criteria were decided before this study began, and were based on the recommendations of the Finnish Ministry of Social Affairs and Health. All caregivers had a caregiver status officially approved by The Social Insurance Institution of Finland.
If a caregiver showed an interest in the study during the health screening, a nutritionist made a home visit during which they provided oral and written information about the study. Informed consent was obtained from the caregiver if they fulfilled the inclusion criteria (all criteria had to be fulfilled), which were: age of ≥65 during the study year, informed consent, an officially confirmed caregiver status, living at home, and normal cognition (geriatric assessment MMSE points ≤25, if assessment was needed). If the caregiver participated in the study, the data from the nurse’s appointment were used as baseline measurements.
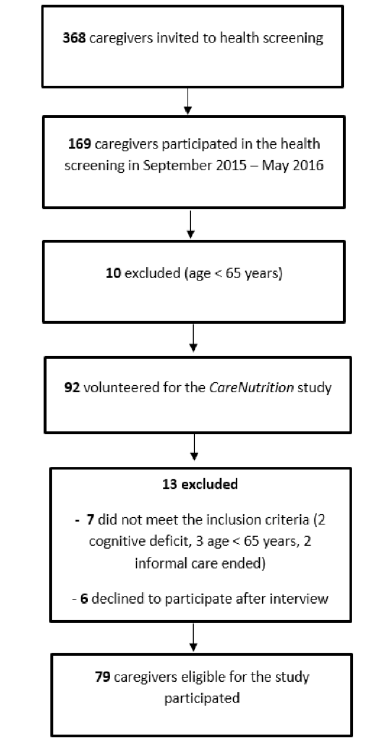
In autumn 2015 and spring 2016, we sent an invitation to a health screening to 368 caregivers, of whom 169 agreed to attend (Figure 1). During the health screening, 92 participants expressed interest in participating in the study. Ten were too young to participate. During the nutritionist’s first visit, a further 13 caregivers were excluded from the study for not meeting the inclusion criteria or declining to participate after the interview. A total of 79 caregivers aged ≥65 were recruited for the study.

Figure 1 Flow chart of participant enrolment

Figure 1
Flow chart of participant enrolment


Measurements

Baseline measurements were taken during two different appointments; the nurse’s health screening and the nutritionist’s home visit. The nurse’s appointment was at the health care centre, with a trained nurse, and included several assessments. Cognition was measured by the MMSE (19), activities of daily living (ADL) by the Katz index (20), instrumental activities of daily living (IADL) by the Lawton-Brody questionnaire (21),  lower extremity muscle strength by the Five Times Sit to Stand Test (22), depression by the Geriatric Depression Scale (GDS-15) (23), medication by an open question, and harmful alcohol use (alcohol consumption, drinking behaviours, and alcohol-related problems) by the Alcohol Use Disorders Identification Test (AUDIT) (24). An experienced geriatrician reviewed the health screening papers. After the nurse’s appointment, a nutritionist made a home visit. Nutritional status was assessed by the MNA (25), health-related quality of life (HRQoL) by the 15D measure (26), and both-hand grip strength (27) using a Jamar Hydraulic Hand Dynamometer (Jamar Bolingbrook IL 60440-4989). The hand-grip strength of each hand was measured two or three times and the best result from the dominating hand was taken as the result. Nutrient intake was assessed via the three-day food diaries that caregivers returned by mail after the nutritionist’s home visit. We analysed the food diaries using the Finnish National Food Composition Database, Fineli. Ideal bodyweight (IBW) was used to calculate protein intake/kg IBW/d. If the caregivers’ body mass index (BMI) was between 20 kg/m2 and 30 kg/m2, we used the actual BMI. If BMI was under 20 kg/m2, it was adjusted to 20 and if above 30 kg/m2, it was adjusted to 30. Nutrition-related laboratory tests of plasma 25(OH)D vitamin, complete blood count (haemoglobin reported), plasma albumin, and serum prealbumin were conducted in the Satakunta Central Hospital laboratory (SataDiag, Finnish Accreditation Service, standards SFS-EN ISO/IEC 17025:2005, SFS-EN ISO 15189:2013) after the nutritionist’s visit. Haemoglobin was assessed using a photometric system; serum 25(OH)D vitamin levels using a immunoluminometric system (Advia Centaur) that measures both ergocalciferol and cholecalciferol 25-hydroxylated metabolites; plasma albumin using a photometric (bromocrerol purple method) system; and serum prealbumin using a photometric, immunochemical system. Use of vitamin D supplement was assessed via a questionnaire and the food diaries.

Statistics

The results are presented as means with standard deviation (SD) or as percentages. Statistical differences between groups were determined by T-tests, the Mann Whitney U-test, the Chi Square test or Fisher´s exact test, whichever was appropriate. Associations were analysed by linear regression models (the Enter method) adjusted for age and BMI, and the results are presented as standardized beta coefficients (β). P-values less than 0.05 were considered statistically significant. Statistical analyses were carried out using SPSS version 22.0 (SPSS, Inc., Chicago, IL).


Results

Baseline characteristics

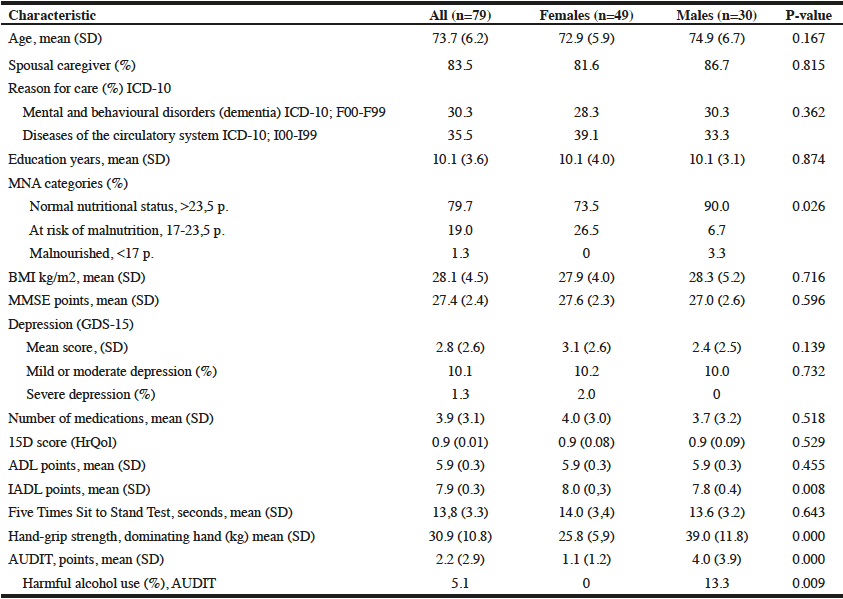
In 2015–2016, 79 older (≥65 y) home-dwelling caregivers – 49 females and 30 males – participated in the study (Table 1). The participation rate was 49.7% of all the 159 caregivers aged ≥65 who attended the health screening. The caregivers’ mean age was 73.7 years, and most of them cared for their spouses. They had good cognition (mean MMSE score 27.4) and had good physical functioning according to their ADL and IADL scores. The mean time in the Five Times Sit to Stand Test was 13.8 seconds.  The mean hand-grip strength of the dominating hand was 25.8 kg among the females and 39.0 kg among the males. Most of the caregivers were of normal weight (Mean BMI 28 kg/m2). The mean number of medications was 3.9. Their HRQoL was good (15D score 0.9). According to GDS-15, one in ten (10.1%) suffered from mild or moderate depression. The AUDIT results showed that none of the female caregivers had hazardous alcohol use, but 13.3% (n=4) of the males scored >8 AUDIT points, indicating harmful patterns of alcohol consumption, drinking behaviours or alcohol-related problems.

Table 1 Caregivers' baseline characteristics and nutritional status (MNA)

Table 1
Caregivers’ baseline characteristics and nutritional status (MNA)

Differences between the characteristics of the females and males were tested using the Chi Square test or Fisher´s exact test when appropriate, for categorical variables; the Mann Whitney U-test for non-normally distributed continuous variables and Student’s T-test for normally distributed continuous variables;SD= standard deviation; ICD-10 =International statistical classification of diseases and related health problems (28); MNA= Mini Nutritional Assessment (25); BMI= Body Mass Index: recommended BMI for older people 24–29 kg/m2 (29); MMSE= Minimental State Examination: 24–30 normal cognition, 18.24 mild dementia, 10–18 average dementia, 0-10 severe dementia (19); GDS-15= Geriatric Depression Scale: 0–5 points no depression, 6–10 points mild or moderate depression, 11–15 points severe depression (30); 15D-square= Health-related quality of life square: 0= poor quality of life and 1= good quality of life (26); ADL= Activities of Daily living: 0–6 points, higher score indicating better functioning (20); IADL= Instrumental Activities of Daily Living: 0–8 points, higher score indicating better functioning  (21); AUDIT= Alcohol Use Disorders Identification Test: total scores of 8 or more are indicators of hazardous and harmful alcohol use, as well as possible alcohol dependence (24)

Nutritional status

Most of the caregivers (79.7%) had a good nutritional status (MNA points >23.5), 19% were at risk of malnutrition (MNA points 17–23.5) and one person (1.3%) already suffered from malnutrition (MNA points <17). The female caregivers were more likely to be at risk of malnutrition than the males (26.5% vs. 6.7%, p=0.026). The MNA test showed that the females suffered more psychological stress or acute illnesses than the males, but the difference was not quite statistically significant (p=0.056). Among the females, energy intake was associated with nutritional status, but the result was just above statistical significance (p=0.056). Energy intake was higher (1707 kcal/d vs. 1418 kcal/d) among the females who were at risk of malnutrition (MNA <23.5 points).
Nutritional status was negatively associated with depression symptoms (GDS-15, p=0.000, β= -0.487): a higher GDS-15 score indicated a lower MNA score. The number of medications was negatively associated with nutritional status (p=0.000, β= -0.452). The association between good HRQoL and nutritional status (15D score, p=0.026, β=0.336) was positive.

Nutrient intakes

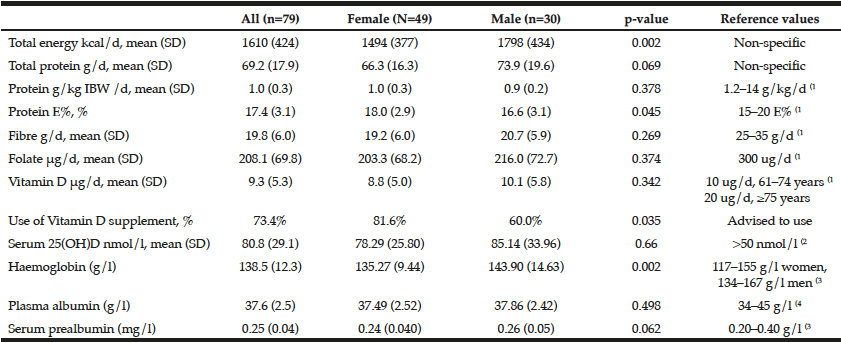
The caregivers’ mean energy intake was 1610 kcal/d (Table 2.). A total of 46.8% had an energy intake of under 1500 kcal/d; 26.7% of the males and 59.2% of the females. The males had a higher energy intake than the females (1798 kcal vs. 1494 kcal, p=0.002). Mean protein intake was 69.2 g/d. Although the males had a higher energy intake, they had less protein calculated as energy (E%) than the females (16.6 E% vs. 18.0 E%, p=0.045). Among the male caregivers, a higher total AUDIT score was associated with lower protein intake g/kg IBW/d (p=0.012, β= -0.454). Greater hand-grip strength was associated with a higher protein intake among the males (p=0.031, β=0.433)

Table 2 Baseline results of caregivers’ nutrient intakes, vitamin D supplement use and nutrition-related laboratory tests

Table 2
Baseline results of caregivers’ nutrient intakes, vitamin D supplement use and nutrition-related laboratory tests

Differences between the characteristics of the females and the males were tested using the Chi Square test or Fisher’s exact test when appropriate for categorical variables, the Mann Whitney U-test for non-normally distributed continuous variables, and Student’s T-test for normally distributed continuous variables. The numbers are presented in means with standard deviation (SD) or percentages. Ideal bodyweight was used to calculate protein intake/ kg/d. If caregivers’ BMI was between 20 and 30 kg/m2, actual BMI was used. If BMI was under 20 kg/m2, it was adjusted to 20, and if above 30 kg/m2, it was adjusted to 30; 1) (31); 2) (32); 3) (33); 4) (34)


For ideal bodyweight (BMI 20–30 kg/m2), the mean protein intake was calculated as 1.0 g/kg IBW/d. A total of 79.7% of the caregivers did not consume the recommended protein intake of 1.2 /kg IBW/d; females 77.6% and male 83.3%.
Dietary fibre (mean 19.8 g), folate (mean 208.1 ug/d) and vitamin D (mean 9.3 ug/d) intake was insufficient. A total of 83.5% did not consume the recommended daily intake of dietary fibre, folate (94.9%) or vitamin D (67.1%).

Laboratory tests

The caregivers’ mean serum 25(OH)D levels were 80.8 nmol/l.  A total of 73.4% took a vitamin D supplement. The females were more likely to use supplements than the males (81.6 % vs. 60.0%, p=0.035). The use of a vitamin D supplement was related to serum 25(OH) D levels, as the mean vitamin D status was higher among the caregivers who took a supplement (84.7 nmol/l vs. 69.7 nmol/l, p=0.035). Mean haemoglobin was 138 g/l, plasma albumin 37.6 g/l, and serum prealbumin 0.25 mg/l. The males had higher blood haemoglobin than the females (p=0.002). Haemoglobin levels were positively associated with nutritional status (p=0.031, beta=0.259).


Discussion

In this study, most of the older (≥65 y) caregivers had a good nutritional status, according to the MNA. However, every fifth was at risk of malnutrition, and this risk was more likely among the females. Depressive symptoms and medication were associated with decreased nutritional status, and good HRQoL with better nutritional status. The food diaries showed that most of the caregivers had an insufficient protein intake. Intakes of dietary fibre, folate and vitamin D were also low. Among the males, a higher AUDIT score was associated with a lower protein intake, and greater hand-grip strength with a higher protein intake.
The prevalence of nutritional risk among caregivers in this study is in line with that of previous studies,  which have found 16%–30% of older caregivers to be at risk of malnutrition (14, 35). This result is interesting, since although the physical performance of the caregivers in our study was good (IADL, ADL), every fifth caregiver was still at risk of malnutrition. Ageing is also accompanied by many cognitive, psychological, and social factors, which may expose older people to inadequate nutrition (11). In this study, depressive symptoms and medication were associated with decreased nutritional status. This result is expected, as depression is believed to be the most common cause of nutritional problems among older people, and the use of medication can affect nutritional status in many ways (36).  Caregivers’ good HRQoL was associated with better nutritional status. Previous studies have also found a relationship between HRQoL and the risk of malnutrition (37). Caregivers are greatly exposed to depression and poor mental health, which can increase the risk of inadequate nutrition (8, 9, 38).
The MNA revealed that the female caregivers were more likely to be at risk of malnutrition than the males, as has been found in other studies examining nutrition among older people (39, 40). In this study, the result is not explained by a lower energy intake among the females, because the energy intake of females who were at risk of malnutrition was higher. The MNA showed that the females had more psychological stress or acute illnesses than the males, but the differences were not quite statistically significant. The results still indicate, however, that these gender differences may be explained by psychological factors. Only a few studies have investigated the nutritional status of older caregivers, which indicates the need for further research and more systematic assessments.
In this study, the caregivers’ protein intake was lower (1.0 g/kg IBW/d) than is recommended in Finland; 1.2–1.4 g/kg/d (31). Approximately 80% of the caregivers did not consume the recommended intake of 1.2 g/kg/d, which is a concern. The male caregivers consumed less protein than the female caregivers when calculated as energy, but their protein E% was still in line with the recommendations in Finland; 15–20 E% (31).  Adequate protein intake is known to play an important role in the immune system, bone mass density, muscle function, strength, and the management of sarcopenia (17, 41, 42). It is estimated that an intake of 1,2 to 1.6 g/kg BW/d may be required for older people to preserve muscle mass (18, 43). In this study, greater hand-grip strength was associated with a higher protein intake. Adequate protein intake is important for older caregivers, since they need to stay in relatively good physical shape to be able to take care of another person. Increasing protein intake may help maintain muscle strength and help prevent mobility impairment (44). There is a need for preventive nutritional guidance that specifically focuses on increasing the protein intake of older caregivers.
Among the males, a higher AUDIT score was associated with a lower protein intake. AUDIT is a screening tool for alcohol consumption, drinking behaviour, and alcohol-related problems (24). Our result was analysed using the overall AUDIT score, which may not be the proper way to use this test, as the result is usually classified into different risk categories.  Moreover, the moderate alcohol consumption in this population meant that we were unable to obtain the same result when alcohol consumption was categorized as 0–7 and >8 AUDIT points. However, the result is still interesting, because it is known that alcohol consumption is related to eating habits (45). Harmful alcohol consumption among older people may accompany nutritional problems, as it replaces the consumption of foods with superior nutritional value (46).
The caregivers had a poor intake of folate and dietary fibre, as found in previous studies among older caregivers (16). These findings indicate a low intake of fruits, vegetables and whole grain products. Stress can affect eating habits and may be shown in the consumption of vegetables. A study by Shaffer et al. (47) found that cancer-related stress was associated with a low consumption of vegetables among cancer-patients and their caregivers. Nutritional guidance can help increase the use of products rich in fibre and vitamins (48). The average vitamin D intake from food was below the recommended level. Still, the caregivers’ mean plasma 25-OH-vitamin D levels were good (80.8 nmol/l) in comparison to the results from the UK National Diet and Nutrition Survey 2008–2012, in which the year-round mean plasma 25(OH)D concentration was 42.5 nmol/l among >65-year-old females (49). The use of vitamin D supplements was related to higher plasma 25-OH-vitamin D levels, which highlights the clinical value of vitamin D supplements among the older population.
The strength of our study is that it provides information regarding the nutritional status and nutrient intake of older caregivers, information that is generally lacking. We used validated methods to assess their nutritional status. The MNA has been validated for older adults (25, 50) and has been used in large populations (51). We also obtained information on caregivers’ nutrient intakes and 25(OH)D levels, which are not usually reported.
Nevertheless, our study has some potential limitations. Due to its cross-sectional nature, causal relationships cannot be drawn from the results. Because of the specifity of our recruitment, the number of participants was small and the study population was selected. This weakens the generalizability of our results to other older caregivers. Selection bias is also possible because the participants were in good physical shape and were keen to participate. This may indicate that they were more health conscious than the average elderly population, and the study results may be more optimistic than in reality. The study population consisted of both females and males, which improved the sample. Some other limitations are related to the measurements. Nutrient intake was studied using three-day food diaries, which can affect the results through over- or under-reporting. This time may not be long enough to show the actual food intake over a longer period. However, we performed check calls to confirm the amounts and types of foods consumed, and it is still noteworthy that the participants had fairly stable food habits, as older people usually do.
Nutritional well-being is a fundamental component of health, physical functioning and quality of life (52). Older caregivers have shown to be prone to malnutrition (16) so they need special support for their nutritional wellbeing.


Conclusion

Our results showed that most of the older (≥65 y) caregivers had good nutritional status, but that one in five was still at risk of malnutrition, especially among the females. Depressive symptoms and medication were associated with decreased nutritional status, and good HRQoL with better nutritional status.  A total of 79.7% of the caregivers had a lower protein intake than that recommended. The intake of dietary fibre, folate and vitamin D were also low. Among the males, a greater AUDIT score was associated with a lower protein intake, and greater hand-grip strength with a higher protein intake. These results highlight the need for systematic nutritional assessment among older caregivers and the importance of preventive nutritional guidance. Further studies are required to obtain more information about older caregivers’ nutritional statuses and nutrient intake.


Funding/Support: This study received funding from the National Institute for Health and Welfare (THL) in Finland. The funders played no role in the design, analysis or interpretation of the data or in writing, reporting or deciding whether to submit this article for publication. The authors are independent researchers and are not associated with the funders.

Conflict of interest: The authors declare that they have no conflicts of interest directly relevant to this report. However, Dr Suominen reports co-operating professionally with Nutricia Medical and Verman.

Ethical standards: The Ethics Committee of the Hospital District of Southwest Finland approved the study and participants provided written informed consent.


References

1.    Torres MJ, Dorigny B, Kuhn M, Berr C, Barberger-Gateau P, Letenneur L Nutritional status in community-dwelling elderly in France in urban and rural areas. PLoS One 2014;9:e105137. doi: 10.1371/journal.pone.0105137.
2.    European Foundation for the Improvement of Living and Working Conditions, 2009. Second European Quality of Life Survey. Overview. Luxembourg: Office for Official Publications of the European Communities. http://www.eurofound.europa.eu/pubdocs/2009/02/en/2/EF0902EN.pdf. Accessed 26 January 2017.
3.    Finnish Ministry of Social Affairs and Health, 2014. National informal care development programme, final report. https://www.julkari.fi/bitstream/handle/10024/116146/URN_ISBN_978-952-00-3483-2.pdf?sequence=1. Accessed 26 January 2017.
4.    The Central Association of Carers in Finland, 2015. Am I a Carer? First-Hand Guide to Informal Care. https://www.omaishoitajat.fi/sites/omaishoitaja.asiakas.fi/files/ensiopas_EN_low_3.pdf. Accessed 26 January 2017.
5.    Robards J, Vlachantoni A, Evandrou M, Falkingham J. Informal caring in England and Wales–Stability and transition between 2001 and 2011. Adv Life Course Res 2015;24:21-33. doi: 10.1016/j.alcr.2015.04.003.
6.    Doran T, Drever F, Whitehead M. Health of young and elderly informal carers. BMJ 2003;327:1388. doi: 10.1136/bmj.327.7428.1388.
7.    Schulz R, Martire LM. Family caregiving of persons with dementia: prevalence, health effects, and support strategies. Am J Geriatr Psychiatry 2004;12:240-249.
8.    Sorensen S, Pinquart M, Duberstein P. How effective are interventions with caregivers? An updated meta-analysis. Gerontologist 2002;42:356-372.
9.    Aggarwal B, Liao M, Christian A, Mosca L. Influence of caregiving on lifestyle and psychosocial risk factors among family members of patients hospitalized with cardiovascular disease. J Gen Intern Med 2009;24:93-98. doi: 10.1007/s11606-008-0852-1.
10.    Alzheimer’s Disease International, 2010. World Alzheimer Report. The global economic impact of dementia. http://www.alz.co.uk/research/files/WorldAlzheimerReport2010.pdf. Accessed 6 January 2017.
11.    Suominen MH et al. Working Group Report, State Nutrition Council, Nutrition Recommendations for Elderly.  Edita Prima, Helsinki 2010
12.    Guigoz Y, Lauque S, Vellas BJ. Identifying the elderly at risk for malnutrition. The Mini Nutritional Assessment. Clin Geriatr Med 2002;18:737-757.
13.    Guigoz Y. The Mini Nutritional Assessment (MNA) review of the literature–What does it tell us? J Nutr Health Aging 2006;10:466-85; discussion 485-7.
14.    Suominen MH, Puranen T, Jyväkorpi S. Ravitsemus muistisairaan kodissa. Loppuraportti. Suomen Muistiasiantuntijat ry 2013.
15.    Rullier L, Lagarde A, Bouisson J, Bergua V, Torres M, Barberger-Gateau P. Psychosocial correlates of nutritional status of family caregivers of persons with dementia. Int Psychogeriatr 2014;26:105-113. doi: 10.1017/S1041610213001579.
16.    Puranen T. Intervening nutrition among community-dwelling individuals with Alzheimer’s disease and their spouses. University of Helsinki, Faculty of Medicine, 2015.
17.    Wolfe RR. The role of dietary protein in optimizing muscle mass, function and health outcomes in older individuals. Br J Nutr 2012;108 Suppl 2:S88-93. doi: 10.1017/S0007114512002590.
18.    Pedersen AN, Cederholm T. Health effects of protein intake in healthy elderly populations: a systematic literature review. Food Nutr Res 2014;58:10.3402/fnr.v58.23364. doi: 10.3402/fnr.v58.23364.
19.    Folstein MF, Folstein SE, McHugh PR.  “Mini-mental state”. A practical method for grading the cognitive state of patients for the clinician. J Psychiatr Res 1975;12:189-198. doi: 0022-3956(75)90026-6.
20.    Katz S, Ford AB, Moskowitz RW, Jackson BA, Jaffe MW. Studies of Illness in the Aged. the Index of Adl: a Standardized Measure of Biological and Psychosocial Function. JAMA 1963;185:914-919
21.    Lawton MP, Brody EM. Assessment of older people: self-maintaining and instrumental activities of daily living. Gerontologist 1969;9:179-186
22.    Bohannon RW. Reference values for the five-repetition sit-to-stand test: a descriptive meta-analysis of data from elders. Percept Mot Skills 2006;103:215-222. doi: 10.2466/pms.103.1.215-222.
23.    Yesavage JA, Brink TL, Rose TL, Lum O, Huang V, Adey M, Leirer VO. Development and validation of a geriatric depression screening scale. J Psychiatr Res 1983;17:37-49
24.    Saunders JB, Aasland OG, Babor TF, de la Fuente JR, Grant M.  Development of the Alcohol Use Disorders Identification Test (AUDIT): WHO Collaborative Project on Early Detection of Persons with Harmful Alcohol Consumption–II. Addiction 1993;88:791-804
25.    Vellas B, Guigoz Y, Garry PJ, Nourhashemi F, Bennahum D, Lauque S, Albarede JL . The Mini Nutritional Assessment (MNA) and its use in grading the nutritional state of elderly patients. Nutrition 1999;15:116-122. doi: S0899-9007(98)00171-3.
26.    Sintonen H. The 15D instrument of health-related quality of life: properties and applications. Ann Med 2001;33:328-336
27.    Roberts HC, Denison HJ, Martin HJ, Patel HP, Syddall H, Cooper C, Sayer AA. A review of the measurement of grip strength in clinical and epidemiological studies: towards a standardised approach. Age Ageing 2011;40:423-429. doi: 10.1093/ageing/afr051.
28.    World Health Organization, 2016. International statistical classification of diseases and related health problems. Available: http://apps.who.int/classifications/icd10/browse/Content/statichtml/ICD10Volume2_en_2016.pdf?ua=1&ua=1. Accessed 14 February 2017
29.    Beck AM, Ovesen L. At which body mass index and degree of weight loss should hospitalized elderly patients be considered at nutritional risk? Clin Nutr 1998;17:195-198. doi: S0261-5614(98)80058-7.
30.    Friedman B, Heisel MJ, Delavan RL. Psychometric properties of the 15-item geriatric depression scale in functionally impaired, cognitively intact, community-dwelling elderly primary care patients. J Am Geriatr Soc 2005;53:1570-1576. doi: JGS53461.
31.    Finnish Nutrition Recommendations.  National Nutrition Council. Health from food – The Finnish Dietary Guidelines, 2014.
32.    Nordic Council of Ministers, Nordic Council of Minister, 2012. Nordic Nutrition Recommendations http://dx.doi.org/10.6027/Nord2014-002.
33.    Satakunta Central Hospital laboratory Satadiag, 2017. Research manual. Satahttp://webohjekirja.mylabservices.fi/SataDiag/?fp=1. Assessed 7.2.2017.
34.    Rustad P, Felding P, Franzson L, Kairisto V, Lahti A, Martensson A, Hyltoft Petersen P, Simonsson P, Steensland H, Uldall A. The Nordic Reference Interval Project 2000: recommended reference intervals for 25 common biochemical properties. Scand J Clin Lab Invest 2004;64:271-284. doi: 10.1080/00365510410006324.
35.    Rullier L, Lagarde A, Bouisson J, Bergua V, Barberger-Gateau P. Nutritional status of community-dwelling older people with dementia: associations with individual and family caregivers’ characteristics. Int J Geriatr Psychiatry 2013;28:580-588. doi: 10.1002/gps.3862.
36.    John BK, Bullock M, Brenner L, McGaw C, Scolapio JS.  Nutrition in the elderly. Frequently asked questions. Am J Gastroenterol 2013;108:1252-66; quiz 1267. doi: 10.1038/ajg.2013.125.
37.    Jimenez-Redondo S, Beltran de Miguel B, Gavidia Banegas J, Guzman Mercedes L, Gomez-Pavon J, Cuadrado Vives C. Influence of nutritional status on health-related quality of life of non-institutionalized older people. J Nutr Health Aging 2014;18:359-364. doi: 10.1007/s12603-013-0416-x.
38.    Hiel L, Beenackers MA, Renders CM, Robroek SJ, Burdorf A, Croezen S. Providing personal informal care to older European adults: should we care about the caregivers’ health? Prev Med 2015;70:64-68. doi: 10.1016/j.ypmed.2014.10.028.
39.    Cuervo M, Garcia A, Ansorena D, Sanchez-Villegas A, Martinez-Gonzalez M, Astiasaran I, Martinez J. Nutritional assessment interpretation on 22,007 Spanish community-dwelling elders through the Mini Nutritional Assessment test. Public Health Nutr 2009;12:82-90. doi: 10.1017/S136898000800195X.
40.    Wham CA, McLean C, Teh R, Moyes S, Peri K, Kerse N. The BRIGHT Trial: what are the factors associated with nutrition risk? J Nutr Health Aging 2014;18:692-697. doi: 10.1007/s12603-014-0032-4.
41.    Morley JE, Argiles JM, Evans WJ, Bhasin S, Cella D, Deutz NE, Doehner W, Fearon KC, Ferrucci L, Hellerstein MK et al. Nutritional recommendations for the management of sarcopenia. J Am Med Dir Assoc 2010;11:391-396. doi: 10.1016/j.jamda.2010.04.014.
42.    Bauer J, Biolo G, Cederholm T, Cesari M, Cruz-Jentoft AJ, Morley JE, Phillips S, Sieber C, Stehle P, Teta D et al. Evidence-based recommendations for optimal dietary protein intake in older people: a position paper from the PROT-AGE Study Group. J Am Med Dir Assoc 2013;14:542-559. doi: 10.1016/j.jamda.2013.05.021.
43.    Lancha AH,Jr, Zanella R,Jr, Tanabe SG, Andriamihaja M, Blachier F. Dietary protein supplementation in the elderly for limiting muscle mass loss. Amino Acids 2017;49:33-47. doi: 10.1007/s00726-016-2355-4.
44.    McLean RR, Mangano KM, Hannan MT, Kiel DP, Sahni S. Dietary Protein Intake Is Protective Against Loss of Grip Strength Among Older Adults in the Framingham Offspring Cohort. J Gerontol A Biol Sci Med Sci 2016;71:356-361. doi: 10.1093/gerona/glv184.
45.    Kesse E, Clavel-Chapelon F, Slimani N, van Liere M, E3N Group. Do eating habits differ according to alcohol consumption? Results of a study of the French cohort of the European Prospective Investigation into Cancer and Nutrition (E3N-EPIC). Am J Clin Nutr 2001;74:322-327.
46.    Satre DD, Sterling SA, Mackin RS, Weisner C.  Patterns of alcohol and drug use among depressed older adults seeking outpatient psychiatric services. Am J Geriatr Psychiatry 2011;19:695-703. doi: 10.1097/JGP.0b013e3181f17f0a.
47.    Shaffer KM, Kim Y, Llabre MM, Carver CS. Dyadic associations between cancer-related stress and fruit and vegetable consumption among colorectal cancer patients and their family caregivers. J Behav Med 2016;39:75-84. doi: 10.1007/s10865-015-9665-y.
48.    Jyväkorpi S et al. Nutrition education and cooking classes improve diet quality, nutrient intake, and psychological well-being of home-dwelling older people—a pilot study.” J Aging Res Clin 2014;3:120-124
49.    Bates B, Lennox A, Prentice A, et al, 2014. London: Public Health England, Food Standards Agency National Diet and Nutrition Survey Results from Years 1, 2, 3 and 4 (combined) of the Rolling Programme (2008/2009–2011/2012)
50.    Vellas B, Villars H, Abellan G, Soto ME, Rolland Y, Guigoz Y, Morley JE, Chumlea W, Salva A, Rubenstein LZ et al. Overview of the MNA–Its history and challenges. J Nutr Health Aging 2006;10:456-63; discussion 463-5
51.    Kaiser MJ, Bauer JM, Ramsch C, Uter W, Guigoz Y, Cederholm T, Thomas DR, Anthony PS, Charlton KE, Maggio M et al. Frequency of malnutrition in older adults: a multinational perspective using the mini nutritional assessment. J Am Geriatr Soc 2010;58:1734-1738. doi: 10.1111/j.1532-5415.2010.03016.x.
52.    Phillips MB, Foley AL, Barnard R, Isenring EA, Miller MD. Nutritional screening in community-dwelling older adults: a systematic literature review. Asia Pac J Clin Nutr 2010;19:440-449

HEALTH-FUNCTION INDICATORS FOR THE PREDICTION OF ELDERLY FRAILTY


I-C. Lee1, Y.-H. Chiu1, I-N. Lee1, C.-Y.Lee2


1. Department of Healthcare Administration and Medical Informatics, Kaohsiung Medical University, Kaohsiung, Taiwan; 2. Department of Family Medicine, Kaohsiung Medical University Chung-Ho, Memorial Hospital, Kaohsiung, Taiwan.

Corresponding Author: I-Nong Lee, Department of Healthcare Administration and Medical Informatics, Kaohsiung Medical University, 100, Shih-Chuan 1st Road, Kaohsiung 807, Taiwan (R.O.C.). Email: leei@kmu.edu.tw, TEL: 886-7-3121101 ext.2648, FAX: 886-7-313-7487

J Aging Res Clin Practice 2017;6:88-93
Published online May 4, 2017, http://dx.doi.org/10.14283/jarcp.2017.8


Abstract

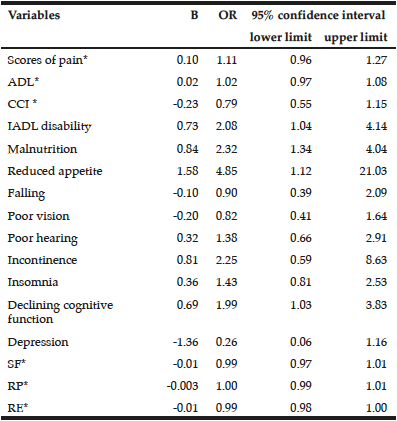
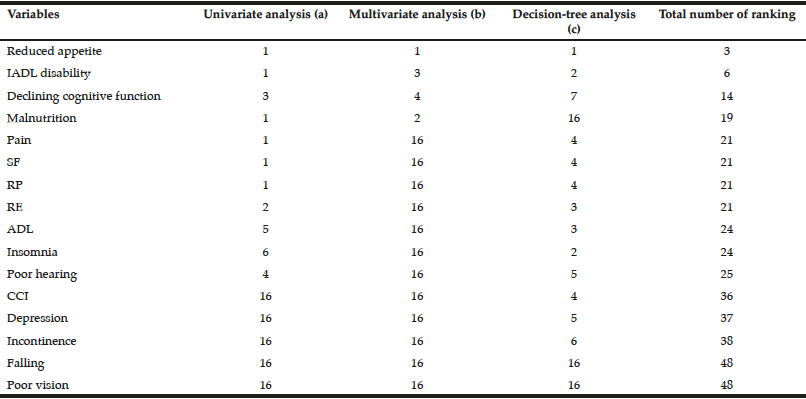
Objectives: It is crucially worth noticing of how to assess elderly frailty in recent years. This study explores 16 common indicators of health function to investigate the relationship between these indicators and frailty. It ranks the indicators as reference for frailty assessments. Design: Cross-sectional study. Setting: Regional frailty study. Participants : The sample comprised 597 elderly people who residence in the community. Measurements: This study commenced in 2012. By June 2014, 597 people aged over 65 years participated in this study. With the permission of the subjects, the trained interviewer conducted a face-to-face survey and measured the subjects’ walking speed and the strength of their grip. The statistical methods were t-test, Chi-square, logistic regression analysis and the decision tree. Results: In this study, there is 31.7% of elderly demonstrating the symptoms of frailty.  Of the health-function indicators, the relationship between decreased appetite and frailty is the strongest, followed by IADL disability, declining cognitive function, malnutrition and pain. Poor eyesight and falling do not show a significant relationship to frailty. Conclusion: Among 16 health-function indicators, the association between nutritional problems and frailty in elderly people is the most significant. Future assessments of frailty should consider the importance of health-function indicators in order to enhance the scope. Screening at-risk elderly people for potential frailty will enable proper health-care planning to achieve the goal of healthy ageing.

Key words: Decision tree , elderly, frailty, health-function, nutrition.


Introduction

The rapid growth of the elderly population has become the trend in many countries in the world. In 2012, there is 11% of total population aged over 65 years in Taiwan, with the Aging Index of 76.2% [AI = (population aged over 65 years/population aged under 14 years)x100]. For now, Taiwan could be considered as having the fastest aging speed of population in the world. In the future, the elderly will become the most important group in Taiwan. According to data from the Ministry of Health and Welfare (2012),11% of people in Taiwan were 65 years or older; however, their medical expenditure was 35%.Further, during the past ten years, the consumption of medical resources increased to 121%. With an increase in the number of elderly people, the health of the elderly becomes an extremely important issue.
Recently, more and more attention has been put on the association of frailty and health of elderly. Pel-littel et al. (2009) suggested that when the elderly have health-related or other problems, it might only require one sudden breakdown to precipitate more severe situations (1). Elderly people who have health problems can be called frail. Their general functioning and health might deteriorate rapidly in a short period of time, affecting their ability to be independent and autonomous. According to Palmer (1999) , physically frail elderly people were a high risk for function degeneration and the necessity of long-term care (2). Elderly frailty is associated with function degeneration, decreased quality of life and increased utilization of medical resources (3, 4). Further, many studies have indicated that frailty is related to diabetes, cardiovascular disease and dementia [(5, 6). Unlike clinical diseases which are based on standard indicators, definitions and measurement tools for frailty are not consistent. There are several tools to measure frailty. For instance, Rockwood et al.(2005) proposed 70 clinical symptoms related to diseases; the total number of symptoms present indicates the degree frailty (7). Fried et al.(2001) introduced five indicators: unintentional weight loss, weak grip, weakness, slowness and limited physical activity; a person displaying three of these indicators would be considered to be frail. Most international studies measure frailty according to the indicators proposed by Fried (2001) (8).
However, these indicators might not be globally suitable to use in all countries. For instance, an unintentional ten-pound weight loss in the past year is considered to be a symptom of frailty. In Asia, elderly people are generally thin and have little body fat; therefore, a ten-pound loss of weight would be considered to be serious (9). Despite of Fried’s five indicators, there is no other diagnosis indicators of frailty have been commonly accepted and standardized. Thus, whether any other health function indicators may use to early detect the frailty remains unknown and is worth to clarify. Therefore, the aims of this study are the following: (1) to investigate the genotype of elderly frailty in Taiwan; (2) to collate current common health-related or functional scales, such as assessments of insomnia or nutrition, in order to investigate the relationship between health-function indicators and frailty and develop indicators of frailty.


Materials and Methods

This study commenced in 2012. By June 2014, 597 people aged over 65 years participated in this study. Due to the constraints of limited funds and manpower, only one administrative district of Kaohsiung City was selected. The researcher selected the places where the elderly tended to congregate for activities. With the permission of the subjects, the trained interviewer conducted a face-to-face survey and measured the subjects’ walking speed and the strength of their grip. This study was approved by the Institutional Review Board of Kaohsiung Medical University Chung-Ho Memorial Hospital (KMUH-IRB-20120196). The study design, methodological procedure and administrative protocol were carried out in accordance with the ethical approved guidelines. Informed consent was obtained from all subjects prior to data collection.
The research tool used was a structured questionnaire designed by the research team. The questionnaire included not only questions asking basic information, but also questions that investigated current common health functions or scales. Based on the aims of the research, statistical analysis was conducted on some items of the questionnaire. The analytical variables are given below:
(1) Demographic characteristics: age, gender, location and educational level.
(2) Frailty: The indicators of frailty use in this study have been modified from the indicators proposed by Fried et al. (2001), and in hence, these modified indicators for the indication of frailty have good validity as well (10). We assessed frailty according to unintentional weight loss, fatigue, weakness and walking speed. A positive response to “unintentional weight loss in the past three months” and “exhaustion in the past three months”, meant the subjects have symptoms of unintentional weight loss and fatigue. Weakness was assessed by grip strength. Since males and females have different levels of grip strength, the researcher divided the subjects into two groups. Follow the standard set by Fried (2001), in each group, the 20% of subjects with the weakest grip were designated as having weakness. To measure walking speed, the most common way used is the time taken for the subjects to walk three meters. Since height is related to walking speed, the subjects were divided into either a tall group or a short group, according to their height. Refers to Fried’s standard, in each group, the 20% of subjects with the slowest walking speed were designated as being slow walkers.
In the Fried’s definition, a person displaying three of these five indicators would be categorized as “frail” person. Meanwhile, a person displaying one or two of these five indicators would be categorized as “pre-frail” person. There are four indicators used to assess frailty in this study. In this study, the subjects who displayed two or more symptoms of frailty were considered to be “frail” and also apparently demonstrated less healthy in general, whereas those with one or no symptom were considered to be “normal” (10).
(3)Health function: there are 16 health-function indicators consist of three aspects of health status in physical, mental and social domains. Indicators are pain, Activities of Daily Life(ADL), Charlson score(CCI), Instrumental Activities of Daily Life(IADL), malnutrition, reduced appetite, falling, poor vision, poor hearing, incontinence, insomnia, declining cognitive function, depression, role functioning-physical (RP), role functioning-emotional (RE) and social functioning (SF) on the MOS 36-Item Short-Form General Health Survey Measures (SF-36) developed by Ware et al. (1992) indicates participative capacity in social activities (11). Please refer to the Table 1 for the detail descriptions of all items and scoring information of subdomains.
In order to clarify which indicators can be used to predict frailty, univariate
analysis, multivariate analysis and decision trees were performed to assess the importance of health function indicators (i.e., independent variable) on the prediction of frailty (i.e., dependent variable). SPSS (Statistical Product and Service Solutions)19.0 was applied to run the univariate analysis (i.e., t-test, chi-square test), and multivariate analysis (i.e., logistic regression). J48 decision trees running on the Weka3.5 data mining software were applied to identify important health-function variables related to frailty (12). All the significance tests and classification results of each variable were ranked and compared separately with individual methods. There will be prioritized and ranked when the statistic results reach the significant level (P<0.05). Based on the ranking of degree of significance (P value), in the results of the univariate analysis, 1 means the significance is the highest (P<0.001). Based on the ranking of OR(odds ratio) value, in the results of the multivariate analysis, 1 means the highest OR value. In decision-tree analysis, ranking is according to the level-order that variable displays on decision tree (i.e., 1 means the variable that displays on the first level of decision tree). A lower ranked variable indicates a stronger relationship with frailty. The rank of 16 will be noted to the indicator when the statistic results do not reach the significant level (P>0.05). In sum of these three numbers of ranking, the indicator with the smaller sum was considered to be more important on the prediction of frailty. This multiple-analysis approach was used to decrease inconsistencies as a result of the analysis methods and data.


Results

According to the genotype of frailty in this study, fatigue was the most common symptom of frailty, with 74.2% of the subjects reporting that they experienced fatigue. This is followed by slow walking (22.6%), weakness (19.1%) and unintentional weight loss (12.7%).Considering the subjects’ performance in these four indicators, 31.7% of elderly people fell into the frail group. Compared with the normal group, those in the frail group are, on average, older (78.2 years) and have a lower level of education. Most are illiterate or went no further than elementary school (19% and 51.3%). Frailty is not significantly associated with gender and place of birth.

Table 1 The 16 health-function indicators and their definition

Table 1
The 16 health-function indicators and their definition

ADL﹕Activities of Daily Life; CCI﹕Charlson score; IADL﹕Instrumental Activities of Daily Life; RP﹕role functioning-physical; RE ﹕role functioning-emotional; SF﹕social functioning


Using univariate analysis, this study explored the relationship between frailty and health-function indicators. The results (Table 2) show that CCI, falling, reduced vision, incontinence and depression and not significantly associated with frailty. The other 11 health-function indicators are related to frailty. Subjects who fall into the frail group have an inferior outcome of health-function indicators. Based on the logistic regression model (Table 3), after adjusting the demographic characteristics, the researcher included all health-function indicators in the model for calculation. It was demonstrated that the evidence of frailty would be more likely if elderly people presented IADL disability, malnutrition, reduced appetite or declining cognitive function. For instance, those with a reduced appetite during the previous three month have a 4.85 higher probability of becoming frail compared to those with a normal appetite.

Table 2 Frailty and health-function indicators

Table 2
Frailty and health-function indicators

a: Analytical result of t-test; b: Analytical result of Chi-square


Using univariate analysis, multivariate analysis and a decision tree, this study reviewed degrees of the relationship between 16 health-function indicators and frailty. According to the results shown in Table 4, the relationship between reduced appetite and frailty is the highest. The total ranking figure is three. This means that when using different statistical methods, the ranking of the indicator is always the first. After reduced appetite, IADL disability, declining cognitive function, malnutrition and pain are the next most important indicators. In these three analyses, the sum of indicator ranking (falling and poor vision) is 48 which indicate that their relationship with frailty is the weakest.

Table 3 The logistic regression model of frailty

Table 3
The logistic regression model of frailty

Data of demographics were adjusted; *It is a continuity variable. Reference groups of other variables refer to those with normal IADL and without the problems of nutrition, reduced appetite, falling, poor vision, poor hearing, incontinence, insomnia, declining cognitive function and depression


Table 4 Importance ranking of 16 health-function indicators to predict frailty

Table 4
Importance ranking of 16 health-function indicators to predict frailty

(a) Based on the ranking of degree of significance (P value) in the results of the univariate analysis, 1 means the significance is the highest (P<0.001); (b) Referred to the ranking of OR value from the model of logistic regression; (c) Ranking is according to the indicators display order from decision tree; Note: In the previous three statistical methods, when indicators do not show statistical significance (P<0.05), we indicate the ranking by “16”. The lower the cumulative ranking number, the more important the indicators!


Discussion

According to the study, the percentage of people with symptoms of frailty represent a broad range (4% to 80%) (13-15). As people grow older, the presence of symptoms of frailty will increase. Elderly people who live in communities show fewer symptoms than people who receive out-patient treatment or who live in institutions. The subjects used in this study were elderly people in a community of whom 31.7% displayed symptoms of frailty. This is higher than the figures from other studies. Most foreign literature adopts Fried’s five indicators and divides elderly people into groups of normal, pre-frail and frail. This study selected four indicators and allocated subjects into either a normal group or a frail group. Therefore, the group consisting of frail people may include those who are diagnosed as being pre-frail, thus increasing the percentage of being frailty. However, by the dividing the subjects into these two groups, we can recognize that those people identified as being frail are “less healthy” than those in the normal group.

The 16 health function indicators used in this study are commonly used to assess the health of the elderly. According to the findings in this study, most of the indicators are associated with frailty which are consistent with the literature. When elderly people experience loss of appetite and consequent malnutrition, the probability of them being frail will be higher (15, 16). People who have been identified as being frail show higher scores on pain measurements, indicating that they experience more pain than normal people (6). The ability to manage daily activities is included in ADL and IADL. The results show that frail people are significantly affected in these two indicators (5, 17, 18). Many frail older people experience insomnia or declining cognitive function (19, 20). As well as the physical and psychological parameters, social participative capacity (RP, RE and SF) is significantly related to frailty. Frail elderly people have lower scores in three indicators, compared with the normal group (21, 22). Although this study demonstrates that CCI, incontinence, depression, falling and reduced vision are less significantly related to frailness, some research associates these indicators with frailty. Those who are frail have higher scores of CCI, compared with the normal group. This means that frail people tend to get ill more often and that their illnesses are more serious than those in the normal group (14). In comparison with the normal group, the elderly in the frail group display a greater probability of having health problems, falling, reduced vision or hearing, incontinence, and depression (5, 18, 23-24).
As well as investigating the relationship between health functions and frailty by means of different statistical analysis methods, this study explored the importance of health-function indicators to predict frailty. According to the results, when elderly people have experienced a reduction in appetite in the past three months, the probability of them becoming frail significantly increases. In addition, when the elderly are malnourished, the probability of frailness is not low; this is fourth on the importance ranking. Therefore, the relationship between nutrition, appetite and frailty is the highest. Malnutrition in the elderly is extremely common, which significantly influences their overall health (25-27). This is due to the slowing down of physical functionality, affecting the person’s chewing, swallowing, digesting, and absorption capabilities (25). As well as this, there can be a lack of motivation in preparing meals (26, 27). However, elderly people or their family members usually do not pay attention to their low appetite or malnutrition. Initially, they might show symptoms of frailty such as feeling exhausted, having weakness and walking slowly. If they continue to neglect these symptoms, more serious and complicated health problems could develop. According to the importance ranking of 16 health-function indicators shown in Table 4, IADL disability and declining cognitive function fall in the top two and three. Likewise, elderly people with IADL disability and declining cognitive function might not feel unwell (in the same way as those who are malnourished and have decreased appetite) and do not seek medical assistance. In the long term, deterioration of health may occur (28).
Two of the indicators –low vision and falling in the past three months –have the weakest relationship with frailty. This may be due to a more severe health condition caused by falls, such as a fracture and the inability to be independent (29). In such instances, they seek doctors’ help. After the intervention of professional medical care, the negative impact on health will be lower; therefore, the relationship with symptoms of frailty will tend to be low.
Although vision and hearing are both sensory capacities, their relationship with frailty is significantly different. The result of this study shows that poor hearing is more strongly associated with frailty than poor sight, but that poor sight is more significant in respect of daily activities. When the elderly are inconvenienced by their poor sight, they will immediately go to see the doctor to improve their sight. In this case, the impact on health will be controlled before the reduced vision impacts the person’s frailty. Declining hearing in the elderly might not be noticed immediately. However, ignoring this symptom for too long a period without intervention can lead to more health-related problems. For instance, with difficulties in hearing, an elderly person can misunderstand the information about health education, leading to physical discomfort (30).


Conclusions

In conclusion, although frailty is not an illness, it does demonstrate symptoms that could be considered to be a lack of good health. This study adopts 16 common health-function indicators and analyzes the relationship between all the indicators and frailty. Indicators which are more associated with frailty tend to have less of an impact on elderly people’s daily activities or do not cause harm. Take the problems of nutrition (i.e., no appetite, malnutrition) as example, elderly people will not go to the doctor immediately or seek intervention from medical care services. Thus, in the long term, the effect of poor health function will very likely lead to health problems. Compared with illness, symptoms of frailty can be considered to be a warning of potential health problems but the symptoms are usually not noticed by elderly people or their relatives. However, from the perspective of prevention, screening frail elderly people in advance of the development of health problems and providing proper health care intervention will help accomplish the goal of “healthy ageing”. Regarding the measurement of frailty, according to the importance ranking of health-function indicators in this study, as well as the indicators proposed by Fried, we include reduced appetite, nutrition, IADL, cognitive function, pain and participation in social activities. These indicators can enhance the scope of the assessment of frailty and increase the precision of an assessment for screening high-risk elderly people. When frailty is identified, proper health care can be planned. Hopefully this screening can reduce the probability of elderly people becoming disabled or bed-ridden and enhance their quality of life in their old age.


Acknowledgements: Sincere appreciation will be given to all individuals who participate in this study.

Ethical Standards: This study was approved by the Institutional Review Board of Kaohsiung Medical University Chung-Ho Memorial Hospital (KMUH-IRB-20120196). The study design, methodological procedure and administrative protocol were carried out in accordance with the ethical approved guidelines. Informed consent was obtained from all subjects prior to data collection. All datasets on which the conclusions of the manuscript presented in the main paper.

Conflict of interest: The authors declare no conflict of interest.


References

1.    Pel-Littel RE, Schuurmans MJ, Emmelot-Vonk MH, Verhaar HJ. Frailty: defining and measuring of a concept. J Nutr Health Aging. 2009;13: 390-394.
2.     Palmer RM : Acute care. In: Hazzard WR, Blass JP, Ettinger WH Jr, eds, Principles  of Geriatric Medicine and Gerontology. 4th ed. New York: McGraw-Hill, 1999: 482-492.
3.     Ensrud KE, Ewing SK, Taylor BC, Fink HA, Cawthon PM, Stone KL et al. Comparison of 2 frailty indexes for prediction of falls, disability, fractures, and death in older women. Arch Intern Med. 2008; 68: 382-389.
4.     Rochat S, Cumming RG, Blyth F, Creasey H, Handelsman D, Le Couteur DG et al. Frailty and use of health and community services by community-dwelling older men: the Concord Health and Ageing in Men Project. Age Ageing. 2010; 39: 228-233.
5.     Mello Ade C, Engstrom EM, Alves LC. Health-related and socio-demographic factors associated with frailty in the elderly: a systematic literature review. Cad Saude Publica. 2014; 30: 1143-1168.
6.     Morley JE, Kim MJ, Haren MT, Kevorkian R, Banks WA. Frailty and the aging male. Aging Male. 2005; 8: 135-140.
7.     Rockwood K, Song X, MacKnight C, Bergman H, Hogan DB, McDowell I et al. A global clinical measure of fitness and frailty in elderly people. CMAJ. 2005; 73: 489-495.
8.     Fried LP, Tangen CM, Walston J, Newman AB, Hirsch C, Gottdiener J et al. Cardiovascular Health Study Collaborative Research Group. Frailty in older  adults: evidence for a phenotype. J Gerontol A BiolSci Med Sci. 2001; 6: M146-M156.
9.     Shih-Ping Chen, Li-Ning Peng , Ming-Hsien Lin , Hsiu-Yun Lai , Shinn-Jang Hwang, Liang-Kung Chen. Evaluating probability of cancer among older people with unexplained, unintentional weight loss. Arch Gerontol Geriatr. 2010; 50: S27-S29.
10.     IC Lee, YH Chiu, CY Lee. Exploration of the importance of geriatric frailty on health-related quality of life . Psychogeriatrics. 2016; DOI: 10.1111/psyg.12179.
11.     Ware JE , Sherbourne CD. The MOS 36-ltem short-form health survey (SF-36): I. Conceptual framework and item selection. Med Care. 1992; 30: 473-483.
12.     Witten IH, Frank E. Data Mining: Practical machine learning tools and techniques: Morgan Kaufmann. 2011; 11: 454.
13.     Gale CR, Cooper C, Aihie Sayer A. Prevalence of frailty and disability: findings from the English Longitudinal Study of Ageing. Age Ageing. 2015; 44: 162-165.
14.     Kanwar A, Singh M, Lennon R, Ghanta K, McNallan SM, Roger VL. Frailty and health-related quality of life among residents of long-term care facilit-ies. J Aging Health. 2013; 25: 792-802.
15.     Serra-Prat M, Mans E, Palomera E, Clavé P. Gastrointestinal peptides, gastrointestinal motility, and anorexia of aging in frail elderly persons. Neurogastroenterol Motil. 2013; 25: 291-e245.
16.     Semba RD, Bartali B, Zhou J, Blaum C, Ko CW, Fried LP. Low serum micronutrient concentrations predict frailty among older women living in the community.  J Gerontol A Biol Sci Med Sci. 2006; 61: 594-599.
17.     Avila-Funes JA, Helmer C, Amieva H Avila-Funes JA, Helmer C, Amieva H, Barberger-Gateau P et al. Frailty among community-dwelling elderly people in France: the three-city study. J Gerontol A Biol Sci Med Sci. 2008; 63: 1089-1096.
18.     Sousa AC, Dias RC, Maciel ÁC, Guerra RO. Frailty syndrome and associated factors in community-dwelling elderly in Northeast Brazil. Arch Gerontol Geriatr. 2012; 54: e95-e101.
19.     Ensrud KE, Blackwell TL, Redline S, Ancoli-Israel S, Paudel ML, Cawthon PM et al. Sleep disturbances and frailty status in older community-dwelling men. J Am Geriatr Soc. 2009; 57: 2085-2093.
20.     Nishiguchi S, Yamada M, Fukutani N,Adachi D, Tashiro Y, Hotta T et al. Differential Association of Frailty With Cognitive Decline and Sarcopenia in Community-Dwelling Older Adults. J Am Med Dir Assoc. 2015; 16: 120-124.
21.     Lin CC, Li CI, Chang CK, Liu CS, Lin CH, Meng NH et al. Reduced health-related quality of life in elders with frailty: a cross-sectional study of community-dwelling elders in Taiwan. PLoS One. 2011; 6: e21841.
22.     Masel MC, Graham JE, Reistetter TA, Markides KS, Ottenbacher KJ. Frailty and health related quality of life in older Mexican Americans. Health Qual Life Outcomes. 2009; 7: 70.
23.     Klein BE, Klein R, Knudtson MD, Lee KE. Relationship of measures of frailty to visual function: the Beaver Dam Eye Study. Trans Am Ophthalmol Soc. 2003; 101: 191-199.
24.     Makizako H, Shimada H, Doi T, Yoshida D, Anan Y, Tsutsumimoto K et al. Physical Frailty Predicts Incident Depressive Symptoms in Elderly People: Prospective Findings From the ObuStudy of Health Promotion for the Elderly. J Am Med Dir Assoc. 2015; 16: 194-9.
25.     Poisson P, Laffond T, Campos S, Dupuis V, Bourdel-Marchasson I. Relationships between oral health, dysphagia and undernutrition in hospitalized elderly  patients. Gerodontology. 2014. doi: 10.1111/ger.12123.
26.     Pereira GF, Bulik CM, Weaver MA, Holland WC, Platts-Mills TF. Malnutrition Among Cognitively Intact, Noncritically Ill Older Adults in the Emergency Department. Ann Emerg Med. 2015; 65: 85-91.
27.     Montejano Lozoya AR, Ferrer Diego RM, Clemente Marín G, Martínez-Alzamora N, Sanjuan Quiles A, Ferrer Ferrándiz E. Nutrition-related risk factors in autonomous non-institutionalized adult elderly people. Nutr Hosp. 2014; 30: 858-869.
28.     d’Orsi E, Xavier AJ, Steptoe A, de Oliveira C, Ramos LR, Orrell M et al. Socioeconomic and lifestyle factors related to instrumental activity of daily living dynamics: results from the English Longitudinal Study of Ageing. J Am Geriatr Soc. 2014; 62: 1630-1639.
29.     Butt DA, Mamdani M, Austin PC, Tu K, Gomes T, Glazier RH. The risk of falls on initiation of antihypertensive drugs in the elderly. Osteoporos Int. 2013; 24: 2649-2657.
30.     Diao M, Sun J, Jiang T, Tian F, Jia Z, Liu Y et al. Comparison between self-reported hearing and measured hearing thresholds of the elderly in China. Ear Hear. 2014; 35: e228-e232.

DIETARY HABITS AND FUNCTIONAL LIMITATION OF OLDER BRAZILIAN ADULTS: EVIDENCE FROM THE BRAZILIAN NATIONAL HEALTH SURVEY (2013)


E. Alves Valle1, J. Vaz de Melo Mambrini1, S. Viana Peixoto1,2, D. Carvalho Malta2, C. de Oliveira3, M.F. Lima-Costa1


1. Oswaldo Cruz Foundation, René Rachou Research Centre, Belo Horizonte-MG, Brazil; 2. Federal University of Minas Gerais, School of Nursing, Belo Horizonte-MG, Brazil; 3. Department of Epidemiology & Public Health, University College London, London, UK

Corresponding Author: E. Alves Valle, CPQRR/Fiocruz Belo Horizonte, Av. Augusto de Lima, 1715 – Barro Preto, Belo Horizonte – MG, 30190-002, Brazil, +55 31 3349-7700, estevaovalle@gmail.com

J Aging Res Clin Practice 2016;inpress
Published online August 25, 2016, http://dx.doi.org/10.14283/jarcp.2016.112


Abstract

Abstract: Objective: To compare the consumption of selected healthy and unhealthy food groups among elderly Brazilians with daily living activity limitations relative to those with no limitations. Design: Cross-sectional analyses of a nationally representative survey. Setting: The Brazilian National Health Survey, conducted in 2013. Subjects: 11,177 Brazilians aged 60 and over. Results: The prevalence of daily living limitations was 29% (95% CI 27.6,30.5). The consumption of daily meat, beans on a regular basis, and recommended fruit and vegetables intake were 67.1% (95% CI 66.5,68.7), 71.3% (95% CI 69.9,72.8) and 37.3% (95% CI 35.6,39.9), respectively. Compared to those without functional limitation, the consumption of these three food groups was significantly lower among those older adults with functional limitation (Prevalence Ratio = 0.89, 95% CI 0.80,0.98; 0.90, 95% CI 0.82,0.99 and PR 0.86, 95% CI, 0.76,0.96, respectively), independently of age, sex, marital status, living arrangements and education. Level of education showed a strong positive association with fruit and vegetable consumption, and a negative association with bean consumption, a staple diet in Brazil. Conclusions: Our findings highlight the need for public health policies to increase consumption healthy food consumption among those older adults with functional limitations, especially fruit and vegetable intake among those who have low education levels.

Key words: Older adults, nutrition, activity of daily living, disability, healthy ageing, national health survey, Brazil.


Introduction

Nutrition among older adults is a significant public health issue in middle income countries overwhelmed with the rapid demographic ageing (1-3). Furthermore, this scenario generates great concern among policy makers because of the burden of disability in old age. There is evidence that a diet rich in vegetables, fruit, fish, nuts and wine is associated with more disability free days, compared to a diet rich in fast food, fried foods, sweets and fizzy drinks (2). A healthy diet is also associated with better cognition and mental health (3). However, physical, mental and financial barriers experienced by people with disabilities may limit their access to a healthier diet (4). A recent study, based on a nationally representative sample of US adults, showed that people with disabilities are less likely to meet recommended levels of saturated fat, fiber, vitamins A and C, calcium and potassium intakes compared to those without disability (4). These findings highlight the need for further research to investigate the association between poorer diet and disability in different countries and cultures.
Brazil has the world’s fifth largest population and has experienced considerable economic growth over the last decades. As a rapidly ageing middle-income country, social policy development for the elderly is of paramount importance (5, 6). From a nutritional perspective, the prevalence of obesity among Brazilians has increased, while the prevalence of undernutrition has an impressive decline (6). Recently, the Ministry of Health developed a guideline to promote healthy diet, as part of the national strategy for the control of non-communicable diseases and associated risk factors (7). As part of the public national health system (in Portuguese, “Sistema Único de Saúde”), Brazil has a national policy for the elderly, which considers the importance of individual functional status (5).  No previous study has compared nutritional patterns between Brazilians with and without disabilities, an essential issue to guide health policies for the elderly.
In the present study, we used data from the most recent Brazilian National Health Survey (8) to describe the dietary habits of older Brazilians, to compare the consumption of selected healthy and unhealthy food groups between those with and without functional limitations and, finally, to identify sociodemographic factors associated to a lower consumption of certain food groups among those individuals with functional limitations.


Methods

The Brazilian National Health Survey (PNS)

Data are derived from the National Health Survey (“Pesquisa Nacional de Saúde”) (8), a nationally representative household survey conducted by the Brazilian Institute of Geography and Statistics (IBGE) and Ministry of Health in 2013. The survey employs a complex sampling design. The primary sampling units are census tracts based on the 2010 census and randomly selected from the IBGE national master sampling plan. Within each census tract, households were randomly selected. Within selected households, a randomly selected respondent aged 18 or over was invited to take part in the study. The final sample size of persons aged 18 years and over was 62,986 (8). All survey participants aged 60 years and older were selected for this analysis.

Functional limitation

Physical functioning limitation was defined as reporting having any difficulty in one or more of the following ten basic (ADL) and/or instrumental activities of daily living (IADL): dressing, walking across a room, bathing or showering, eating, getting in or out of bed, using the toilet, going outside the house using a transportation, managing medications, shopping and managing finances.

Dietary habits

Dietary pattern was assessed by daily or weekly frequency consumption of certain healthy and unhealthy food groups. The following groups, with definitions used, were: regular fish intake (in one or more days per week); regular intake of beans (five or more days per week); recommended fruit and vegetable intake (five or more daily portions, five or more days per week, including wholesome food, in salads or juices); red meat or chicken with visible fat (once or more times per week); full fat milk (any weekly frequency); regular consumption of sweets (five or more days a week); regular ingestion of fizzy drinks or artificial juices (five or more days a week) and high levels of salt (according respondent’s self-perception).In addition, the daily meat consumption (beef, pork and/or chicken) was measured since it is an important marker of protein intake in older adults (9).

Sociodemographic characteristics

Sociodemographic characteristics include age group (60-64, 65-74, 75 and older), sex, marital status (married, divorced/single and widow), number of residents within the household (live alone, two, three or more) and educational attainment. Educational attainment was categorized into: less than four years of schooling, five to eight years of schooling, nine to eleven years of schooling, and 12 years or more.

Statistical analysis

Descriptive analyses were based on prevalence and their respective 95% confidence intervals. In the unadjusted analyses, Pearson Chi Squared test was used to assess the significance of differences between the sociodemographic variables and the dietary patterns of older adults with and without functional limitations. Multivariate analyses, investigating the association between dietary patterns and functional limitations, were performed using prevalence ratios and their 95% confidence intervals through Poisson regression models (10). This was also the statistical approach used to examine the associations between sociodemographic characteristics and daily meat intake, recommended daily intake of fruit and vegetables and regular ingestion of beans of older adults with and without functional limitations. The estimated prevalence ratios from the Poisson regression models were adjusted simultaneously by age, sex, educational attainment, marital status and number of residents within the household. All analyses were performed using Stata version 13.0 and results incorporate appropriate procedures to control for weights and the complex PNS sample design (11).

Ethical approval

The National Health Survey was approved by the National Commission of Ethics in Research on Human Beings (in Portuguese, “Comissão Nacional de Ética em Pesquisa”), of the Ministry of Health, (Process number 328.159 of June 2013). All participants signed a consent form.


Results

The present analysis was based on 11,177 survey participants aged 60 years and over. 3,340 (29.0%; 95% CI: 27.6-30.5%) reported some functional limitation. Table 1 presents descriptive statistics for the sample. Overall, participants predominantly aged between 65 and 74, were female, married, residents in households with 3 or more residents and had five to eight years of schooling. The prevalence of women with functional limitation was significantly higher compared to those without functional limitations (62.4% versus 53.9%). Statistically significant differences (p<0.05) between those with functional limitation compared to those without were observed for oldest age (46.5% vs. 16.7%aged 75 and older, respectively), widowed (39% vs 21.5%) and those with educational attainment less than four years of schooling (47.7% vs 25.7%).

Table 1 Sociodemographic characteristics of the sample of older Brazilians, and by functional limitation status (The Brazilian National Health Survey, 2013)

Table 1
Sociodemographic characteristics of the sample of older Brazilians, and by functional limitation status (The Brazilian National Health Survey, 2013)

1. At least one difficulty in the following ten activities: dressing, walking across a room, bathing or showering, eating, getting in or out of bed, using the toilet, handling transportation (driving or navigating public transit), managing medications, shopping and managing finances; %: (95% CI): weighted prevalence and 95% confidence interval; * To test differences between those with and without functional limitation (Pearson Chi-squared test)


The prevalence of selected food groups intake among study participants, and by functional limitation, is displayed in Table 2. Overall, higher prevalence rates were found for weekly consumption of full fat milk (73.8%), regular intake of beans (71.3%), daily consumption of meat (67.1%) and regular fish intake (58.4%). On the other hand, lower prevalence rates were observed for the recommended intake of fruit and vegetables (37.3%), weekly intake red meat or chicken with visible excess of fat (28.2%), regular sweets (17.2%), regular fizzy drinks/artificial juices (12.0%) and high salt intake (7.9%). Significant associations (p<0.05) with functional limitation were found with daily meat consumption (64.1 vs 68.4%, those with and without limitations, respectively), regular fish intake (53.3% and 60.4%, respectively), recommended amount of fruit and vegetable intake (32.1% vs 39.4%, respectively) and excessive salt intake (6.3% vs 8.6%, respectively).

Table 2 Dietary habits of older Brazilians, and by functional limitation status (The Brazilian National Health Survey, 2013

Table 2
Dietary habits of older Brazilians, and by functional limitation status (The Brazilian National Health Survey, 2013

1. At least one difficulty in the following ten activities: dressing, walking across a room, bathing or showering, eating, getting in or out of bed, using the toilet, handling transportation (driving or navigating public transit), managing medications, shopping and managing finances; %: (95% CI): weighted prevalence and 95% confidence interval; * To test differences between those with and without functional limitation (Pearson Chi-squared test)


Table 3 presents results of multivariate Poisson regression models for each outcome. After adjusting for sociodemographic characteristics, the dietary patterns that remained significantly associated with functional limitation were: daily meat intake (PR = 0.89, 95% CI: 0.80-0.98), recommended fruit and vegetables intake (PR = 0.86, 95% CI: 0.76-0.96) and regular bean consumption (PR = 0.90, 95% CI: 0.82-0.99).

Table 3 Multivariate analysis of dietary habits and functional limitation among older Brazilians (Brazilian National Health Survey, 2013)

Table 3
Multivariate analysis of dietary habits and functional limitation among older Brazilians (Brazilian National Health Survey, 2013)

1. At least one difficulty in the following ten activities: dressing, walking across a room, bathing or showering, eating, getting in or out of bed, using the toilet, handling transportation (driving or navigating public transit), managing medications, shopping and managing finances; PR (95% CI): weighted prevalence ratios and their 95% confidence intervals estimated by Poisson regression models and adjusted for age, sex, marital status, household number of residents and educational attainment; *p < 0.05


Results from the multivariate analysis of the association of sociodemographic characteristics with selected dietary habits among those participants with and without functional limitation are shown in table 4.  Generally, the association was similar in both functional groups, as follows: women had a positive association with the recommended fruit and vegetable intake and a negative association with regular bean consumption; the number of residents within the household (i.e. three or more) was positively associated with regular bean consumption; schooling level was positively correlated with recommended vegetable intake, and negatively correlated with regular bens intake. Conjugal status showed no significant association with the consumption of all the above mentioned foods in any group. Oldest aged showed a negative association with regular bean intake among those with functioning limitations.

Table 4 Multivariate analysis of sociodemographic factors, selected dietary habits and functional limitation among older Brazilians (Brazilian National Health Survey, 2013)

Table 4
Multivariate analysis of sociodemographic factors, selected dietary habits and functional limitation among older Brazilians (Brazilian National Health Survey, 2013)

1. At least one difficulty in the following ten activities: dressing, walking across a room, bathing or showering, eating, getting in or out of bed, using the toilet, handling transportation (driving or navigating public transit), managing medications, shopping and managing finances;  *p < 0.05; ** p <= 0.001; PR (95% CI): weighted prevalence ratios and their 95% confidence intervals estimated by Poisson regression models and adjusted for age, sex, marital status, household number of residents and educational attainment


Discussion

The key findings from this study, based on a nationally representative sample of non-institutionalised older Brazilian adults, are: (1) those with functional limitations were less likely to a daily intake of meat, recommended intake of fruit and vegetables and regular ingestion of beans, independent of age, sex and other sociodemographic characteristics; (2) educational attainment was the strongest sociodemographic factor associated to recommended fruit and vegetables intake (higher intake among those with higher educational attainment).
Our findings corroborated previous research based on data from the Brazilian National Household Survey (PNAD) conducted in 1998, 2003 and 2008 that showed higher prevalence of functional limitation among the oldest old, women and those with a low level of education (12,13). Regarding dietary patterns, our study found similar results to earlier descriptive analyses from the Brazilian National Health Survey (2013), based on data from the population aged 18 and older, showing high consumption of healthy foods (such as beans and fish), in contrast with low consumption of fruit vegetables and high intake of food rich in saturated fat (non-lean red meat, chicken or full fat milk) (14, 15).
After adjusting for sociodemographic factors, the dietary patterns of older Brazilians with and without functional limitations were similar, regarding the regular consumption of fish, food rich in fat, fizzy drinks or artificial juices, sweets and salt. On the other hand, the daily meat intake (red meat, chicken and/or fish) was smaller among those with functional limitation. To note that low protein intake may lead to an increased risk to sarcopenia, frailty, falls and fractures resulting into an even greater risk to develop functional limitations (9, 16). Brazilian guidelines (7) and others (17, 18) recommend a diet rich in fruit, vegetables and pulses, like beans, for its important preventive role against the development of non-communicable diseases (17, 18). The current analysis shows that older adults with functional limitations are 10% and 14% less likely to eat regularly beans and the recommended intake of vegetables, respectively.
It is worth mentioning that there are physical, mental and financial barriers which could prevent older adults with functional limitation to have a healthier diet (4). Unfortunately, data from national health surveys usually do not generate information that allows us to identify these barriers. Therefore, the present analysis was focused on sociodemographic factors associated to some healthy diet habits. Overall, the sociodemographic factors associated to daily intake of meat, recommended intake of fruit and vegetables and regular ingestion of beans were similar among those participants with and without functional limitations. Compared to men, women with and without functional limitation reported less meat and beans intake and higher fruit and vegetable consumption. Similar findings regarding women eating more fruit and vegetables were found in Canada (19) but not in South Africa and Iran (20, 21). Furthermore, a qualitative study showed that Canadian women were more aware of the benefits of such food group compared to men (22). Regular ingestion of beans also had a positive and independent association with household number of residents.
As previously mentioned, educational attainment was the strongest sociodemographic factor associated to fruit and vegetable and intake among both those with and without functional limitation. The prevalence of recommended fruit and vegetable intake increased by each level of educational attainment in both functioning groups (with and without functional limitation), with those with 12 or more years of schooling having the highest intake levels. Older Brazilian adults with and without functional limitations with 12 or more years of schooling degree were 207% and 258% more likely to regularly eat fruits and vegetables compared to those with low educational attainment. The positive association between the recommended fruit and vegetables intake and education or income has also been observed in other countries (19, 21, 23). An interesting study conducted in Brazil using data from the Brazilian National Family Budget Survey showed that the total household expenditure on fruit and vegetables is inversely proportional to the price of such food and directly proportional to the household income (24).
In contrast, regular consumption of beans, an important ingredient of the Brazilian staple diet, decreased gradually according to level education in both those with and without functional limitation. Older adults with and without functional limitation with 12 or more years of schooling were17% and 29%, respectively, less likely to eat beans regularly than those with lower education level. A negative association between educational level and beans intake among adults residing in large cities in Brazil has been previously reported (25,26). Beans are an important source of protein, fibre, minerals, vitamins and flavonoids with potential benefits to health (27). This type of food has been considered by some authors as the “meat of the poor” due to its important nutritional value in low income countries (28) and perhaps it has been replaced by other types of food culturally considered “posh” by higher socioeconomic groups’ individuals.
This study has some strengths and limitations. The strength of the present study lies in its large nationally representative sample of older Brazilian with data on functional limitation and dietary habits. Therefore, to the best of our knowledge, this is the first study to compare dietary habits of older Brazilian with and without functional limitations. However, because the data are cross-sectional, we are unable to determine causal relationships and directionality of the observed associations. We are not able to establish if dietary habits were adopted before the development of functional limitation or vice-versa. In addition, the dietary habits module of the interview is rather concise and like any questionnaire on diet is prone to recall bias, leading to under or overestimation of amount of consumption (29).  However, it is unlikely that differential associations have affected those with and without functional limitations. Finally, in our analyses we could not establish an individual and/or household income which could directly affect the food choice purchase (24). This limitation was partially addressed by using data on educational attainment which is an important socioeconomic position indicator.
In 2006, the Brazilian Ministry of Health implemented the National Health Policy for the Elderly raising the issue of how important it is to include functional limitation as one of its policies (5).  27 million Brazilian people are currently aged 60 and older (30). Taking into account the findings from the present study, about 5.4 million older adults in Brazil eat less than the recommended amount of fruit and vegetables as indicated by the WHO (31). In conclusion, our findings highlight the importance of assessing dietary habits when investigating functional limitation in older adults. Our findings also highlight the need for public health policies to increase consumption healthy food consumption among those older adults with functional limitations, especially fruit and vegetable intake among those who have low education levels.


Acknowledgements: This study was funded by the Brazilian Ministry of Health, Secretariat of Health Surveillance. MFLC and SVP are fellowship researchers of the Brazilian National Council for Scientific and Technological Development (CNPq).


References

1.     United Nations. Department of Economic and Social Affairs. Population Division. World Population Prospects. The 2015 Revision, 2015. http://esa.un.org/unpd/wpp/. Accessed April 2016.
2.     Struijk EA, Beulens JWJ, May AM, et al. Dietary patterns in relation to disease burden expressed in Disability- Adjusted Life Years 1 – 3. Am J Clin Nutr  2014;100(4), 1158-1165.
3.     Milte CM, McNaughton SA. Dietary patterns and successful ageing: a systematic review. Eur J Nutr 2016;55(2), 423-50.
4.     An R, Chiu CY, Zhang Z, Burd NA. Nutrient intake among US adults with disabilities. J Hum Nutr Diet 2015;28(5), 465-475.
5.     BRASIL. Ministério da Saúde. Portaria nº 2.528 de 2006. http://bvsms.saude.gov.br/bvs/saudelegis/gm/2006/prt2528_19_10_2006.html. (Accessed April 2016.
6.     Conde WL, Monteiro CA. Nutrition transition and double burden of undernutrition and excess of weight in Brazil. Am J Clin 2014;100(6),1617S – 1622S.
7.     Monteiro CA, Cannon G, Moubarac JC, et al. Dietary guidelines to nourish humanity and the planet in the twenty-first century. A blueprint from Brazil. Public Health Nutr 2015;18(13),2311-2322.
8.     Szwarcwald CL, Malta DC, Pereira CA, et al. Pesquisa Nacional de Saúde no Brasil: concepção e metodologia de aplicação. Cien Saude Colet. 2014;19(2); 333-342.
9.     Nowson C, O’Connell S. Protein Requirements and Recommendations for Older People: A Review. Nutrients 2015;7(8), 6874-6899.
10.     Long S, Freese J. Regression Models for Categorical Dependent Variables Using Stata. Stata Press, College Station, Texas, 2014.
11.     Souza-Júnior PRB, Freitas MPS, Antonaci G et al. Desenho da amostra da Pesquisa Nacional de Saúde 2013. Epidemiol e Serviços Saúde 2015;24(2), 207-216.
12.     Lima-Costa MF, De Oliveira C, Macinko J, Marmot M. Socioeconomic Inequalities in Health in Older Adults in Brazil and England. Am J Public Health.  2012;102(8),1535-1541.
13.     Lima-Costa MF, Matos DL, Camargos VP, Macinko J. Tendências em dez anos das condições de saúde de idosos brasileiros: evidências da Pesquisa Nacional por Amostra de Domicílios (1998, 2003, 2008). Cien Saude Colet. 2011;16, 3689-3696.
14.     Claro RM, Aline M, Santos S et al. Consumo de alimentos não saudáveis relacionados a doenças crônicas não transmissíveis no Brasil: Pesquisa Nacional de Saúde, 2013 Epidemiol e Serviços Saúde 2015;24(2), 257-265.
15.     Jaime PC, Stopa SR, Oliveira TP et al. Prevalência e distribuição sociodemográfica de marcadores de alimentação saudável, Pesquisa Nacional de Saúde, Brasil 2013. Epidemiol e Serviços Saúde.  2015;24(2),267-276.
16.     Imai E, Tsubota-Utsugi M, Kikuya M, et al. Animal protein intake is associated with higher-level functional capacity in elderly adults: The Ohasama study. J Am Geriatr Soc.  2014;62(3), 426-434.
17.     FAO/WHO. Fruit and Vegetables for Health: Report of a Joint FAO/WHO Workshop, 1-3 September, Kobe, Japan, 2004
18.     NICE Guidelines, 2015. Dementia, Disability and Frailty in Later Life – Mid-Life Approaches to Delay or Prevent Onset.http://nice.org.uk/guidance/ng16. Accessed April 2016.
19.     Riediger ND, Moghadasian MH. Patterns of fruit and vegetable consumption and the influence of sex, age and socio-demographic factors among Canadian elderly. J Am Coll Nutr. 2008;27,1541-1087.
20.     Salehi L, Eftekhar H, Mohammad K et al. Consumption of fruit and vegetables among elderly people: a cross sectional study from Iran. Nutr J. 2010;9(1):2.
21.     Peltzer K, Phaswana-Mafuya N. Fruit and vegetable intake and associated factors in older adults in South Africa. Glob Health Action. 2012;5,1-8.
22.     Paquette M-C. Perceptions of healthy eating: state of knowledge and research gaps. Can J Public Health 96, Suppl. 2005;3, S15-S19.
23.     Gregory-Mercado KY, Staten LK, Ranger-Moore J, et al. Fruit and vegetable consumption of older Mexican-American women is associated with their acculturation level. Ethn Dis. 2006;16(1), 89-95.
24.     Claro RM, Monteiro CA. Renda familiar, preço de alimentos e aquisição domiciliar de frutas e hortaliças no Brasil. Rev Saude Publica 2010;44(6), 1014-1020.
25.     Velásquez-Meléndez G, Mendes LL, Pessoa MC, et al. Tendências da frequência do consumo de feijão por meio de inquérito telefônico nas capitais brasileiras, 2006 a 2009. Cien Saude Colet.  2009;17(12), 3363-3370.
26.     Malta DC, Campos MO, Oliveira MM De, Pinto B, et al. Prevalência de fatores de risco e proteção para doenças crônicas não transmissíveis em adultos residentes em capitais brasileiras, 2013. Epidemiol. Serv. Saúde, 2015;24(3), 373-387.
27.     Hayat I, Ahmad A, Masud T et al. Nutritional and health perspectives of beans (Phaseolus vulgaris L.): an overview. Crit Rev Food Sci Nutr.  2014;54, 580-592.
28.     Tharanathan RN, Mahadevamma S. Grain legumes – A boon to human nutrition. Trends Food Sci Technol.  2003;14(12), 507-518.
29.     Molag ML, De Vries JHM, Ocké MC, et al. Design characteristics of food frequency questionnaires in relation to their validity. Am J Epidemiol.  2007;166(12),1468-1478.
30.     Instituto Brasileiro de Geografia e Estatística – IBGE. Sinopse Do Censo Demográfico 2010.; 2011. http://portal.mte.gov.br/data/files/8A7C816A2E7311D1013003524D7B79E4/IBGE_CENSO2010_sinopse.pdf Accessed April 2016.
31.     World Health Organization, 2004. Global Strategy on Diet, Physical Activity and Health. Fifty-Seventh World Health Assembly. http://www.who.int/dietphysicalactivity/strategy/eb11344/strategy_english_web.pdf Accessed April 2016.

EVALUATING THE POTENTIAL BENEFITS OF CUCUMBERS FOR IMPROVED HEALTH AND SKIN CARE


H. Murad, M.A. Nyc


Corresponding Author: Howard Murad, M.D. 2121 Park Place, 1st Floor, El Segundo, CA 90245, Phone: 310.726.3340, E-mail: drmurad@murad.com


Abstract

Epidemiological and nutritional studies indicate that cucumbers, a fruit in the cucurbitaceae family, have numerous benefits internally, externally and even emotionally. As a food, cucumbers offer superior hydration, as they are about 95% water. They have been used for decades for their anti-inflammatory benefits on skin, soothing properties for digestion, and other therapeutic uses. The following contribution offers an overview of cucumbers, specifically, their use to augment cellular water and address common conditions (i.e.: skin discoloration and aging, cardiovascular and cancerous diseases, bone health, inflammation, and connective tissue disorders).

Key words: Skin care, nutraceuticals, cucumbers, water, nutrition, anti-aging.


Introduction

The importance of diet on health has been well-documented; deficiencies in key vitamins and minerals can result in serious developmental and metabolic problems. Undoubtedly, the phrase “you are what you eat” has some merit to it: the better you eat, the better you look and feel. Additionally, eating healthy and nutritious foods boosts immune responses and helps fight infections as well as free radicals.
With so many nutritional requirements to take into account, finding the right natural food sources to meet our body’s needs can seem like a daunting task. Each month there are new recommendations or food trends regarding eggs, meat, fat, or even water consumption. Suffice to say, ongoing research of the benefits of foods is needed, and one fruit, which deserves more consideration is the cucumber.
Cucumbers, which are fruits and not vegetables, have long been associated with the spa world and topical skin treatment (1,2). Peering through beauty magazines, will no doubt offer several photos of models basking in relaxation with their eye cucumber slices. These pictures are not exclusively based on marketing the idea of luxurious relaxation and soothing spa treatments. Aside from their cooling effect on skin, cucumber slices offer many benefits to the eyes and surrounding tissues through their hydrating properties, which work to reduce dehydration, their high levels of vitamin K that help reduce dark circles, and the lignans they contain for reducing inflammation (3). Additionally, cucumbers have been used to treat wrinkles and sunburns and have been used as a moisturizer and skin brightener by inhibiting tyrosinase (4). The benefits of cucumbers are not just relegated to topical treatment. In fact, abundant research has shown what can happen when the fruit is consumed.


Background

Cucumbers, which are related to melons, such as watermelon, cantaloupe and honeydew, are a relatively low-calorie food at just about 15 calories per cup, and are about 95% water. They contain high levels of lignans, vitamin K, cucurbitacins and their derivatives (triterpenoids), flavonoids (apigenin, luteolin, quercetin, and kaempferol), antioxidants such as beta carotene and vitamin C, and B vitamins, among other trace elements and minerals (5, 6). With such a high level of water content and the added bonus of naturally-occuring nutrients and trace minerals, cucumbers could be great supplements to drinking water or even serve as an alternative to consuming sports drinks. In fact, the best way to replenish the body and quench thirst is by consuming water through foods (7). This seems somewhat counter-intuitive since we have consistently been taught to drink water. However, choosing foods with high water content offers the cells in our bodies the much-needed hydration they require for basic everyday functioning as well as the vital nutrients to repair and fortify their membranes (8). What has been gleaned from scientific literature is that certain phytochemicals, such as the triterpenes that cucumber contains, may offer important cytoprotective capabilities, among other benefits, that may preserve cutaneous barrier function and cellular immunity (9, 10). Simply put, cucumbers don’t solely hydrate, they provide added elements that your body needs to fortify and regenerate itself. In fact, researchers identified that cucumbers contain Rutin and ascorbic acid oxidase, which function as free radical scavengers, just one mechanistic property that helps to protect against skin damage (11). Furthermore, some research has indicated that cucumbers have known photoprotective activities and provide an SPF value of 0.2 by itself (12). More recent investigations also concluded that topical creams with cucumber extract showed pronounced decrease in melanin and skin sebum, resulting in skin whitening and anti-acne effects.13 Just how the cucumber does this is not clearly understood, but additional investigations into their uses and components can help us understand the mechanisms at work.

Cucumber uses in medicine

An abundance of research has concentrated on sustainable botanical ingredients as components in neutraceuticals and cosmeceuticals (3, 14, 15). However, currently there is renewed interest in ethnobotany, and in researching through clinical trials the scientific basis behind cultural and indigenous uses of plants for medicinal uses. The results of these trials have many times stimulated new avenues in research on plants, vegetables and fruit ingredients and their possible uses within topical or supplement products. Along those lines, cucumber folk medicine includes treatment of diarrhea, gonorrhea, diabetes, hypertension and it has been used to detoxify, as an anti-inflammatory, serum lipids regulator, antioxidant, and analgesic (16). While some of these uses remain unproven, there is accumulating research confirming cucumber’s phytochemicals as potential chemopreventive and anticancer agents (17-19).
Cellular dehydration, aging, damage and deterioration are human inevitabilities. Much scientific research has been devoted to decoding cellular processes to unlock methods that would halt, stave off or even transform natural, chronological aging(20, 21). The conclusions of these studies have offered new thoughts. Seemingly, the premise that, «Before there was medicine, there was food,» comes to mind with a review of the current data on functional botanicals. Indeed, some of the most exciting clinical findings on phytochemicals have produced new knowledge on how to address old problems, such as with botanicals and photoaging reactive oxygen species, or with cardiovascular disease and cancer (22-25).
Cucumbers can and have been used in numerous ways to help augment the diet and hydrate the body, but a more thorough review of the plant’s key nutrients and phytochemicals is warranted to offer practical ideas on the fruit’s use for cell fortification and to target specific damage whether external, internal or even the result of emotional stress.

Cyto-pathophysiology

Stress is a threat that is commonly recognized to have a deleterious effect on our health and well-being. Chronic stress resulting from environmental sources or cultural stress can lead to,cell-deteriorating processes such as inflammation and oxidative stress (26). The result of these processes is an overproduction of reactive oxygen species (ROS) and compromised cellular integrity, as ROS-compromised membranes weaken and allow vital, hydrating intracellular water (ICW) to evacuate into the extracellular matrix (27) Additional research is needed to examine this process in more detail, but theoretically, as inflammation accumulates, it signals cytokines and growth factors to allow matrix matalloproteinases (MMPs) to proliferate, which initiates collagen and elastin breakdown—leading to and a major contributor of chronological aging. In patients with compromised tissues (i.e.: dehydrated cells), this process occurs more rapidly as cytology has shown that when cells and connective tissues deteriorate, disorders, diseases and death occur. One study illustrates this process clearly as it shows that the elderly, especially if diseased, display reduced ICW (28). Knowing this, it is conceivable that decreased ICW may cause patients to be more vulnerable to the damaging effects of certain toxins, stress levels, cancers, etc. Addressing water loss and inflammation with cucumber consumption could be an effective way to lower stress and fight against the aging process.

Cucumber in an Alkaline Diet

As a rule of thumb: the more alkaline the diet, the better. High acid foods can cause cell dehydration and can enhance cellular oxidation and impair immunity. The most hydrating foods are those packed with the highest levels of nutrients and are beneficial to cell health. In general, this includes foods that are anti-inflammatory and as low acid to alkaline-forming as possible. Cucumber is one of the most alkaline foods and because of its triterpenes, it may work well to regulate diseases that involve the immune system (9).
Most low acid to alkaline fruits and vegetables are also anti-inflammatory, like cucumber (29). Cucumber counteracts acidic pH within the body and specifically in the kidneys, which are tasked with keeping blood pH within normal levels. Over time, blood pH naturally becomes more acidic as kidney functions decline with age. Normal blood pH is between 7.35 and 7.45. When the body is forced to constantly regulate blood pH, this overdrive may cause muscle wasting, bone weakening, hypertension, stroke, cardiovascular disease, and memory and cognition morbidity and mortality from chronic diseases. Because of the antioxidants and minerals it contains, cucumber combats all of these situations.
A three-year study showed that an alkaline diet can indeed reduce the speed of muscle wasting that naturally occurs with aging (30). Research also suggests that an alkaline diet can assist with chemotherapy treatments, making the treatments more effective. This is the case with cucumber, which contains lignans that are being studied for treating estrogen-related cancers within the body (31-33). While there are no studies that directly show an alkaline diet to prevent cancer, research is ongoing.
In sum, within an alkaline diet, cucumber may assist cells and connective tissue in retaining water as it works synergistically to enhance systemic, brain, and bone health. Additionally, cucumber may provide the support needed for enhanced enzymatic function, intracellularly, to prevent degradation of tissues and slow cell aging. Presumably, an abundance of alkaline cellular reserves buffers the depletion that occurs when the body constantly readjusts to maintain proper pH and minimize cellular acidity.

Conclusion

Cucumbers are literally one of the most versatile fruits as it can be used topically, internally and also for mood stability when modulating stress. Early research shows that its phytochemicals may provide cancer drug-enhancing activity while it staves off cardiovascular disease. In addition to its soothing properties and digestive benefits, cucumbers fortify cells so they may retain hydrated and work at the highest levels, and may slow age-related cellular deteriorations. Because of its known therapeutic value, more study on cucumber is warranted, which will likely open even more scientific avenues of study and discussion.


Conflict of interest: The authors declare no conflicts of interest.

Ethical standard: The study was approved by the New England Institutional Review Board.


References

1. Griere M A. Modern Herb. Tigers Books International London, 1st Ed. 1992;1: 239-241.
2. James AD. The Green Pharmacy. Rodale Press Emmaus, Pennsylvania, 1997;pp. 394-459.
3. Lopes, L., Speretta F., Bentley M. Enhancement of skin penetration of vitamin K using monoolein-based liquid crystalline systems. European Journal of Pharmaceutical Sciences. 2007; 32(3):209-215.
4. Hooda, R. Antiwrinkle herbal drugs. Journal of Pharmacognosy and Phytochemistry. 2015; 4(4): 277-281.
5. Mukherjee, P. K., et al. Phytochemical and therapeutic potential of cucumber. Fitoterapia. 2013; 84:227-236.
6. The World’s Healthiest Foods. Whfoods.org. Cucumbers. Retrieved from http://www.whfoods.com/genpage.php?tname=foodspice&dbid=42.
7. Murad H, Lange D. The Murad Method. New York: Macmillan, 2003.
8. Murad, H. Inclusive Health: A Professional Compendium. 1st ed. El Segundo, CA: American Academy of Esthetics, 2009.
9. Rios JL. Effects of triterpenes on the immune system. J Ethnopharmacol. 2010; 128(1):1-14.
10. Murad, H. Skin Immunity, The Next Generation of Skin. Les Nouvelles Esthetiques & Spa. 2008; 7:130-136.
11. Katiyar, S., Saify, K., Singh, S, and Rai, M. Botanical study of skin lightening agents. International Journal of Pharmacognosy. 2014; 1(4): 243-249.
12. Suryawanshi, R.K. et al. Towards an understanding of bacterial metabolites prodigiosin and violacein and their potential for use in commercial sunscreens. International Journal of Cosmetic Science. 2015; 37: 98-107.
13. Akhtar, N. et al. Exploring cucumber extract for skin rejuvenation. African Journal of Biotechnology. 2011. 10(7): 1206-1216.
14. Murad H, Tabibian M. The effect of an oral supplement containing glucosamine, aminoacids, mineral, and antioxidants on cutaneous aging. J Dermatol Treat. 2001; 12:47-51.
15. Baliga M S and Katiyar S K. Chemoprevention of photocarcinogenesis by selected dietary botanicals. Photochem Photobiol Sci. 2006; 5:243-53.
16. Abu-Reidah I, Arráez-Román D, Quirantes-Piné R, Fernández-Arroyo S,Segura-Carretero A, Fernández-Gutiérrez A. HPLC–ESI-Q-TOF-MS for a comprehensive characterization of bioactive phenolic compounds in cucumber whole fruit extract. Food Research International. 2012; 46:108-117.
17. Lee DH, Iwanski GB, and Thoennissen NH. Cucurbitacin: ancient compound shedding new light on cancer treatment. Scientific World Journal. 2010; 10:413-8.
18. Rios JL, Recio MC, Escandell JM, et al. Inhibition of transcription factors by plant-derived compounds and their implications in inflammation and cancer. Curr Pharm Des. 2009; 15(11):1212-37.
19. Thoennissen NH, Iwanski GB and Doan NB. Cucurbitacin b induces apoptosis by inhibition of the JAK/STAT pathway and potentiates antiproliferative effects of gemcitabine on pancreatic cancer cells. Cancer Res. 2009; 69(14):5876-84.
20. Murad H. Thoughts on the Process of Aging. Cosmet Dermatol. 2009; 22 (2).
21. Nagy IZs. The frustrating decades of biological aging theories and the hopes for the future. Anti-Aging Bulletin. 2003; 4(16):22-31.
22. Scalbert A, Williamson G. Dietary intake and bioavailability of polyphenols. J. Nutr. 2000; 130:2073S-2085.
23. Murad H, Jankicevic J. Dietary supplementation as a nutrition intervention strategy to increase intracellular water and phase angle. Orlando, FL. American College of Nutrition 48th Annual Meeting and Conference, 2007.
24. Murad H, Shellow W. Pomegranate extract both orally ingested and topically applied to augment the SPF of sunscreens. Cosmetic Dermatology. 2001;10.
25. Talalay P, Fahey J W, Healy Z R, Wehage S L, Benedict A L, Min C, Dinkova-Kostova A T. Sulforaphane mobilizes cellular defenses that protect skin against damage by UV radiation. PNAS. 2007; 104:17500-17505.
26. Murad, H. Conquering cultural stress: the ultimate guide to anti-aging and happiness. Wisdom Waters Press: Jan 7, 2015.
27. Nagy IZs. The membrane hypothesis of aging. Boca Raton, FL, CRC Press, 1994: 3-10.
28. Ritz P. Chronic cellular dehydration. J Gerontol. 2001; 56A(6): 349-352.
29. Schwalfenberg GK. The alkaline diet: is there evidence that an alkaline ph diet benefits health? J Environ and Public Health. 2012; 2012:727630.
30. Dawson-Hughes B, Harris SS, and Ceglia L. Alkaline diets favor lean tissue mass in older adults. American Journal of Clinical Nutrition. 2008; 87(3):662-665.
31. Webb AL, McCullough ML. Dietary lignans: potential role in cancer prevention. Nutr Cancer. 2005;51(2):117-31.
32. Touillaud, Marina S., et al. Dietary lignan intake and postmenopausal breast cancer risk by estrogen and progesterone receptor status. Journal of the National Cancer Institute. 2007; 99(6):475-486.
33. McCann, Susan E., et al. Risk of human ovarian cancer is related to dietary intake of selected nutrients, phytochemicals and food groups. The Journal of nutrition. 2003; 133(6):1937-42.

OLDER ADULTS’ ATTITUDES TO FOOD AND NUTRITION: A QUALITATIVE STUDY


J.E. Winter, S.A. McNaughton, C.A. Nowson


Centre for Physical Activity and Nutrition, School of Exercise and Nutrition Sciences, Deakin University, Burwood, Victoria, Australia

Corresponding Author: J. E. Winter, Centre for Physical Activity and Nutrition, School of Exercise and Nutrition Sciences, Deakin University, Burwood, Victoria, Australia, jane.winter1@au.nestle.com


Abstract

 Objective: To explore the factors that influence food choices of older adults and identify potential sources of dietary advice. Design: A qualitative research design using semi-structured, one on one interviews. Setting: A general medical practice in Victoria, Australia. Participants: Twelve community dwelling adults aged 75 to 89 (mean 82.8 ± 4.4) years, 92% living alone and 92% female. Measurements: Interview questions addressed usual daily food pattern, shopping routines, appetite, importance of diet and potential sources of dietary advice or assistance. Results: Thematic analysis identified key themes influencing food choices were maintaining independence; value of nutrition; childhood patterns; and health factors. Dietary restrictions and concerns with weight gain were expressed, and although these were managed independently, the GP was identified as the first source of information if required. Conclusion: This sample of older adults placed high value on eating well as they age, however a number followed self-imposed dietary restrictions which have the potential to compromise their nutritional status as dietary requirements change. Further research is needed into how to communicate changing nutritional needs to this group.

Key words: Elderly, attitudes, nutrition, interviews.


Introduction

Older adults are at risk of under-nutrition due to normal physiological changes combined with alterations in food choice, food access and health conditions (1, 2). Nutritional studies have shown that older adults tend towards consuming a lower energy intake (3), smaller meals, slower eating and reduced physical activity (4). Australian data indicate that adults aged over 70 years consume less energy than younger adults and are less likely to meet requirements for protein, riboflavin and vitamin B6 (5).
Factors that impact on food choice and meal patterns have reported to include social isolation (6), presence of chronic disease resulting in dietary restrictions (7), and difficulties with activities of daily living (ADLs) (8, 9). Changes to food intake and the consequent impact on nutritional status can result in increased risk of frailty and reduced functional capabilities (10, 11).
Prevalence of malnutrition or nutritional risk amongst older adults in the community has been reported at between 16% and 43% (12, 13). Although it is recognised that early identification of nutritional issues is important in preventing nutritional decline, (14) older adults can be resistant to dietary interventions. For example, studies in community-based seniors in Australia has shown low uptake of dietetic referrals and resistance to a home delivered meal intervention (15, 16), however it is not clear what sources of information older adults do use, if any, to make decisions regarding diet or food choice.
General practitioners (GPs) and other primary health staff  such as nurses, have been identified as preferred providers of nutritional care providing trustworthy and personalised care (17), however a study of older adults aged 75 years and over suggested  some scepticism about dietary advice provided by GPs (18).
This qualitative study aimed to build on current understanding of food choices of community living older adults and explore potential acceptable sources of nutritional advice and support.


Methods

Participants were community dwelling adults aged 75 years or older who had a health assessment (“75+ health assessment”) within the previous three months and were recruited from a general medical practice in Victoria, Australia. The 75+ health assessment is an annual government funded health assessment offered to adults aged 75 years or older. Sixty patients who had most recently attended the practice in May 2014 were sent a letter from the practice inviting them to participate in the study.
One on one, semi-structured interviews were conducted by an experienced dietitian (JW). Qualitative inquiry was used as it is well placed to answer complex questions about food behaviours by investigating how and why individuals act in certain ways (19). Open-ended questions were developed using an inquiry logic that reflected the study aims (Table 1). Interview questions addressed usual daily food pattern, shopping routines, appetite, perceived importance of diet and potential sources of dietary advice. Information was also collected on age, living situation, weight, and height. The Mini Nutritional Assessment (MNA®-SF), a validated nutritional screening tool for adults aged 65 years and older, was used to determine nutritional risk of the participants. The MNA®-SF comprises six questions about food intake, weight loss, mobility, recent acute illness, cognitive function and body mass index (BMI).The study protocol was approved by Faculty of Health Human Ethics Advisory Group on behalf of the Deakin University Human Research Advisory Committee (HEAG-H 48_2014). All participants provided written informed consent.

Table 1 Interview questions and inquiry logic

Table 1
Interview questions and inquiry logic


Interviews were audio-recorded and transcribed verbatim. Notes were also taken during the interview and compared with the transcripts.  Thematic content analysis was used to categorise and codify the interview transcripts (20, 21). An inductive thematic analysis was used to identify emergent themes from the data, coding it without trying to fit it into a pre-existing frame (21). Transcripts were read through several times and notes made on general themes and related categories of data. Interviews and analyses were conducted by a single investigator, and a second researcher coded 25% of the transcripts to verify the coding. Any differences were discussed until agreement was reached. The transcripts were imported into NVIVO 9 (QSR International Pty Ltd), coded according to the initial notes and then categories were collapsed to generate themes for each of the four areas of interest: dietary patterns; influences on food choices; dietary changes with ageing; and sources of dietary advice.


Results

Of the 60 people invited to participate in the study, 16 contacted the surgery to arrange an interview time. Four later withdrew due to illness (three) or confusion over appointment times (one). Twelve interviews were included in the analysis, at which point data saturation was considered to be reached with no new concepts emerging. Eleven interviews were conducted in a private room at the medical practice, one was conducted at the participant’s home at their request. The average interview duration was 33 minutes.
The age of the participants ranged from 75 to 89 years (mean 82.8 ± 4.4 years). Eleven participants were female (92%), and 11 (92%) lived alone. Three participants (25%) were classified as being at risk of malnutrition according to the MNA®-SF, all three had suffered acute illness or psychological stress within the previous three months, however all reported that the issues had, or were resolving. No participants were classified as malnourished.
Overall participants felt that they had good, healthy diets and that nutrition was important to their overall health and well-being.
“Very important [diet].  I think particularly when you live on your own, you can get in to really bad habits….but oh yes, it’s fundamental isn’t it?  It’s very important.” (Female #11, 75yrs)
“I cook every day.  I don’t eat junk food.  I don’t like it.” (Female #2, 83years)
Key themes identified in the analysis are described below under the topics of dietary patterns, food choices, age related change and dietary advice.

Dietary Patterns

The usual dietary pattern described involved three meals per day, with skipping meals a rare occurrence. As nearly all participants lived alone, most meals were eaten alone in their own homes. Eating out occasions were rare, but more commonly involved meeting friends for ‘coffee’ or having a cup of tea or coffee, with or without a snack when at the shops.

Routine

Days tended to be fairly structured with similar meal times each day. There was usually a standard time that participants arose each morning and meals were then organised according to the activities of the day. When describing their meals, it was common to qualify their statements with “every day” or “always”. Sometimes these routines reflected long-standing habits.
“I’ve been doing it for a long time, same old routine so I can’t change it” (Female #5, 86years)
“I still got used to when I worked in the factory 12 o’clock it must be lunch.” (Male #4, 86yrs)

Food Preparation

As the majority of respondents were female, they had been responsible for food preparation for most of their adult lives, and continued to cook for themselves even when they were living alone. All reported consuming at least one hot meal each day, but often cooked sufficient quantity to last for a few days.
“I’m all for cooking up, you know, larger quantities like that.  If I cook a couple of cutlets I’ll cook say four, it’s two for one night, and an alternate night you have the other two.” (Female #7, 86years)
Despite a desire to prepare their own food, many had started using packaged frozen foods from the supermarket or at least having some in the freezer in case they didn’t feel like cooking or had unexpected guests.
“Well, sometimes, I always keep a couple of supermarket, McCain meals in the freezer, in case I’m sick and I can’t be bothered by the… I heat up one of those.” (Female #9, 89 years)

Influences on food choices

Independence and positive attitude

Participants expressed pride in their ability to remain independent and self-sufficient in all facets of their lives, including shopping and preparing food. They felt that staying active either at home, within their family or with social groups was an important factor in their general health.  Even when faced with health issues, they felt that ‘just getting on with it’ was important.
“I can’t do very much.  I try, but… and I keep trying til I’m exhausted.” (Female #10, 86 years)
“actually, sometimes I think, when you’ve got a bit of responsibility, it makes you get up and get going. You can’t say, ‘Oh, I’ll just sit in all day today’.” (Female #8, 78 years).

Value of eating well

Diet and nutrition was considered to be important to their overall health, and therefore participants felt it was worth the effort to continue with food preparation.
“I still prepare and cook my own meals…..But, I eat well. I’m a healthy eater.” (Female #9, 89 years)
It was acknowledged that it could be easy to slip into bad habits such as missing meals but the value they placed on diet, prevented this. They often felt that they were doing better than others of their age who appeared to place a lower value on their own well-being.
“always good meals, you know?  Yeah, I think it is, because some people say, ‘oh, we never cook, eat sandwich’. I don’t like that.” (Female #2, 83 years)
“But she [friend] tells me what she’s eating, and she’s not eating like I am eating, and you know sometimes, “Oh, I couldn’t be bothered making a meal,” I would never be like that.” (Female #1, 84 years)

Childhood patterns

Participants talked about their current food patterns as similar to those they were brought up on and that their parents provided for them. Some food choices were unchanged over many years. The provision of regular ‘good’ meals as children appeared to set the standard for dietary practices over the course of their adult life.
“well, we were brought up to, on a farm. And my mum and, and dad always made sure we were well fed. And you know we just eat the same. Meat and three veg.” (Female #9, 89 years)

Health Conditions

Food choices were commonly restricted or influenced by health conditions or previous dietary advice. Six of the female participants were conscious of their weight and did restrict food intake to try and reduce their weight. In some instances, this was even in the presence of recent weight loss due to illness or emotional distress.
“I have lost a bit of weight in the last six months, which is part of this [illness] but this is more my natural weight” (Female #7, 86 years)
Specific foods were often chosen to meet the perceived personal dietary needs or restrictions of participants. Food restrictions included full fat dairy products, artificial preservatives, lactose, fructose and artificial sweeteners. These choices appeared to be self-imposed with little guidance from any health care professionals.

Changes with age

Inevitability

Changes associated with age were seen as inevitable and something to be accepted and managed. Participants associated changes to their food intake or nutritional requirements with advancing age with either social factors (e.g. loss of a partner) or physiological changes. The social change was most commonly the adjustment to living alone and cooking for one, which impacted on quantity of food consumed. There was also recognition that a reduced appetite was associated with lower activity levels and that keeping physically active could improve appetite.
“And the fact that you live on your own and you’re not cooking.  My husband had an enormous appetite, and of course you know you’re cooking for two, and you sit down and you’re talking, you do eat more.” (Female #7, 86 years)
Physiological changes included alterations in taste, appetite or metabolic changes resulting in smaller food portions consumed. Although participants often reported that their appetite was good, it was generally felt that it had declined with age.
“We’ve cut down ….. we used to have a piece of steak you know oh it’d be bigger than that but we, now we would only have half a scotch fillet each.” (Female #2, 83 years)

Dietary advice or assistance

GP first point of contact

Most participants identified their general practitioner (GP) as the first point of contact if they had any dietary concerns. They trusted the doctor to tell them if there was any need to alter their diet and to answer any questions they had. Two participants felt that their doctor would refer them to a dietitian if required. Family, friends and the media were also sources of dietary information.
In terms of receiving assistance with services such as home delivered meals (only one participant was occasionally using a home delivered meal service), they were considered a possibility but the preference was to have home prepared meals. There was a focus on consuming fresh or home-made meals.
“But any food that had to have been cooked and frozen and then delivered, it’s just not like fresh food.” (Female #8, 78 years)


Discussion

This study aimed to build on our understanding of what influences food choices and dietary patterns of adults over 75 years of age in Australia. We found that participants placed a high value on eating well and their food choices were driven by childhood eating patterns, and their specific health conditions which frequently resulted in self-imposed dietary restrictions. Age related changes were seen as inevitable and could be divided into physiological changes such as reduced appetite or social changes such as living alone. The first option for seeking dietary advice was the GP, and while services such as home delivered meals were considered acceptable, freshly prepared meals were the preferred option.
The participants in this study were living independently with very few support services, and the majority were still able to drive. Although all but one were living alone they placed a high value on continuing to eat well and preparing meals for themselves. Vesnaver and colleagues described a model of ‘dietary resilience’ based on interviews with 30 Canadian adults aged between 73 and 87 years (22). One of the features of dietary resilience was prioritizing eating well, enabling individuals to adapt and overcome dietary obstacles. This notion of resilience is consistent with the themes we identified of independence and value of eating well where, despite being faced with challenges, food intake was maintained.
Routine and childhood meal patterns were contributing factors to current dietary practices and this has also been identified in other older populations. A study of Scottish adults aged 75 years and older used 24 hour food recall in conjunction with interviews to understand dietary beliefs and practices (18). They found routine was seen as an important way of overcoming fluctuations in appetite, and the establishment of dietary beliefs and habits in childhood carried over into old age.
The issue of weight management and dietary restriction is an important area to explore further. We found that management of weight was a common area of concern for participants, as it had been a main focus of their diet during adulthood. However, in older adults, a higher BMI is associated with lower mortality (23), and weight change is associated with greater mortality (24).In addition to weight concerns, a number of other dietary restrictions had been adopted without any specific guidance, including reduced fat, reduced lactose, reduced fructose and avoidance of certain additives. Dietary restrictions in older people are considered to have an unfavourable benefit / risk ratio with the potential to result in deficiencies and contribute to under-nutrition (7, 25). Further investigation is required to determine whether these restrictive practices have an impact on nutritional adequacy in this population.
Age-related changes impacting on food intake such as reduced appetite, social isolation, altered capacity to shop and prepare food have been well described in the literature (26). Although the participants in this study did identify changes in appetite, reduced serve sizes, and issues associated with living alone and cooking for one they tended to downplay these factors and felt that they were inevitable part of aging that weren’t impacting on their overall nutritional intake. Ramic and colleagues have shown that living alone for older adults was associated with reduced nutrient intake, reduced BMI and greater nutritional risk, however those living alone were also more financially compromised (27). Participants in our study were generally unconcerned with changes to appetite or portion sizes and appeared unaware of any specific changes to their nutritional requirements with age (such as needing additional protein or calcium). It may be that nutrition messages for older adults need to address how to meet their needs in the face of changing dietary patterns in order to maintain optimal health.
The clearest source of dietary advice, if required, was identified as the GP consistent with other studies which have identified GPs as a trusted source of information (17, 28). In Australia, there are no guidelines on managing nutritional issues for older adults, particularly the frail elderly and therefore GPs may not be fully informed on the specific requirements of this population and unable to provide appropriate guidance.
Our study has limitations in that the sample was predominantly women who were generally well and independent. They exhibited traits of ‘dietary resilience’ but further exploration of the issues with a male population would provide additional insights. Literature suggests that older men living alone tend to have poorer cooking skills, associated with a poorer quality diet (29, 30) and may be more affected by changes to living situation.  A recent literature review suggests that there may be gender differences in the impact of living alone on food intake, with men more likely to show undesirable intakes (31). It would also be useful to compare our findings with a malnourished, frailer population to understand the influences on their food choices.
This sample of older adults placed high value on eating well as they age, however a number continued with dietary restrictions which have the potential to compromise their nutrition as dietary requirements change. Further research is needed into how to communicate changing nutritional needs to this group and to determine whether primary care staff are equipped to provide appropriate nutrition information.


Acknowledgements: The authors would like to thank Kate Wingrove for her invaluable assistance in coding a sample of the interviews. We would also like to thank the staff at the medical centre for their role in recruiting participants, co-ordinating interview times and providing interview facilities. And finally, we would like to thank the participants for their willingness to provide their time for the project.

Conflict of interest: Ms Winter reports other from Nestle Health Science (employee of the company), outside the submitted work. Dr. McNaughton has nothing to disclose. Dr. Nowson reports grants from Nestle Health Science, grants and personal fees from Meat and Livestock Australia, personal fees from Dairy Health Nutrition Consortium outside the submitted work and is a member of AWASH and WASH (Australian Division of World Action on Salt and Health) but does not receive any financial support from these organisations..

Ethical Standards: Study protocol approved by Deakin University Human Research Advisory Committee.


References

1.     Donini LM, Scardella P, Piombo L, et al. Malnutrition in elderly: social and economic determinants. J Nutr Health Aging 2013;17:9-15.
2.    Morley JE. Anorexia of aging: physiologic and pathologic. Am J Clin Nutr 1997;66:760-73.
3.    de Groot CPGM, van Staveren WA. Undernutrition in the European SENECA studies. Clin Geriatr Med 2002;18:699.
4.    De Castro JM. Age-related changes in spontaneous food intake and hunger in humans. Appetite. 1993;21:255-72.
5.    Australian Bureau Statistics. Australian Health Survey 2011-2013. Available from: http://www.abs.gov.au/australianhealthsurvey. Accessed 23 August, 2015
6.    Vesnaver E, Keller HH. Social influences and eating behavior in later life: a review. J Nutr Gerontol Geriatr 2011;30:2-23.
7.    Darmon P, Kaiser MJ, Bauer JM, Sieber CC, Pichard C. Restrictive diets in the elderly: Never say never again? Clin Nutr 2010;29:170-4.
8.    Anyanwu UO, Sharkey JR, Jackson RT, Sahyoun NR. Home food environment of older adults transitioning from hospital to home. J Nutr Gerontol Geriatr 2011;30:105-21.
9.    Sharkey JR. Nutrition risk screening: the interrelationship of food insecurity, food intake, and unintentional weight change among homebound elders. J Nutr Elderly. 2004;24:19-34.
10.    Odlund Olin A, Koochek A, Ljungqvist O, Cederholm T. Nutritional status, well-being and functional ability in frail elderly service flat residents. Eur J Clin Nutr. 2004;59:263-70.
11.    Bartali B, Frongillo E, Bandinelli S, et al. Low nutrient intake is an essential component of frailty in older persons. J GerontolSeries A: Biolog Med Sci 2006;61:589.
12.    Winter J, Flanagan D, McNaughton SA, Nowson C. Nutrition screening of older people in a community general practice, using the MNA-SF. J Nutr Health Aging. 2013;17:322-5.
13.    Rist G, Miles G, Karimi L. The presence of malnutrition in community-living older adults receiving home nursing services. Nutr Diet. 2012;69:46-50.
14.    Flanagan D, Fisher T, Murray M, Visvanathan R, Charlton K, Thesing C, et al. Managing undernutrition in the elderly – prevention is better than cure. Aust Fam Physician. 2012;41:695-9.
15.    Leggo M, Banks M, Isenring E, Stewart L, Tweeddale M. A quality improvement nutrition screening and intervention program available to Home and Community Care eligible clients. Nutr Diet 2008;65:162-7.
16.    Charlton KE, Walton K, Moon L, Smith K, McMahon AT, Ralph F, et al. «It could probably help someone else but not me»: a feasibility study of a snack programme offered to meals on wheels clients. J Nutr Health Aging. 2013;17:364-9.
17.    Ball L, Desbrow B, Leveritt M. An exploration of individuals’ preferences for nutrition care from Australian primary care health professionals. Aust J Prim Health. 2014;20:113-20.
18.    McKie L, MacInnes A, Hendry J, Donald S, Peace H. The food consumption patterns and perceptions of dietary advice of older people. J Hum Nutr Diet 2000;13:173-83.
19.    Swift JA, Tischler V. Qualitative research in nutrition and dietetics: getting started. J Hum Nutr Diet 2010;23:559-66.
20.    Burnard P. A method of analysing interview transcripts in qualitative research. Nurse Educ Today. 1991;11:461-6.
21.    Braun V, Clarke V. Using thematic analysis in psychology. Qual Res Psychol. 2006;3:77-101.
22.    Vesnaver E, Keller HH, Payette H, Shatenstein B. Dietary resilience as described by older community-dwelling adults from the NuAge study «if there is a will -there is a way!». Appetite 2012;58:730-8.
23.    Winter JE, MacInnis RJ, Wattanapenpaiboon N, Nowson CA. BMI and all-cause mortality in older adults: a meta-analysis. Am J Clin Nutr 2014;99:875-90.
24.    Somes GW, Kritchevsky SB, Shorr RI, Pahor M, Applegate WB. Body mass index, weight change, and death in older adults: the systolic hypertension in the elderly program. Am J Epidemiol 2002;156:132-8.
25.    Zeanandin G, Molato O, Le Duff F, Guérin O, Hébuterne X, Schneider SM. Impact of restrictive diets on the risk of undernutrition in a free-living elderly population. ClinNutr 2012;31(1):69-73.
26.    de Boer A, Ter Horst GJ, Lorist MM. Physiological and psychosocial age-related changes associated with reduced food intake in older persons. Ageing Res Rev. 2013;12(1):316-28.
27.    Ramic E, Pranjic N, Batic-Mujanovic O, Karic E, Alibasic E, Alic A. The effect of loneliness on malnutrition in elderly population. Medicinski Arhiv. 2011;65(2):92-5.
28.    Cash T, Desbrow B, Leveritt M, Ball L. Utilization and preference of nutrition information sources in Australia. Health Expectations: An International Journal Of Public Participation In Health Care And Health Policy. 2014.
29.    Hughes G, Bennett KM, Hetherington MM. Old and alone: barriers to healthy eating in older men living on their own. Appetite. 2004;43(3):269-76.
30.    Charlton KE. The nutrient intake of elderly men living alone and their attitudes towards nutrition education. Abbreviate title to J Hum Nutr Diet. 1997;10(6):343-52.
31.    Hanna KL, Collins PF. Relationship between living alone and food and nutrient intake. Nutr Rev 2015;73(9):594-611.
Products/3235.0~2012~Main+Features~Main+Features?OpenDocument. Accessed 9 August 2014
26.    Deary, IJ, Corley, J, Gow, AJ et al (2009) Age-associated cognitive decline. Br Med Bull, 92: 135-152
27.    Miller, KJ, Parsons, TD, Whybrow, PC, et al (2006) Memory improvement with treatment of hypothyroidism. Intern J Neuroscience, 116: 895-906
28.    Folstein, M, Folstein, F and McHugh, P (1975) “Mini-Mental State”. A practical method for Grading the Cognitive State of Patients for the Clinician. Journal of Psychiatric Research 12: 189-198
29.    Ohashi T, Yamaki M, Pandav C, Karmarkar M and Irie M (2000) Simple microplate method for determination of urinary iodine. Clinical Chemistry 46:529-536
30.    Tan, LM, Charlton KE, Tan, ZY, Ma, G, Batterham, M (2012) Validity and reproducibility of an iodine-specific food frequency questionnaire to estimate dietary iodine intake in older Australians. Nutrition and Dietetics 70: 71-78.
31.    Guigoz Y, Vellas B, Garry P.(1996) Assessing the nutritional status of the older person: the Mini Nutritional Assessment as part of the geriatric evaluation. Nutr Rev 54: S59-S65.
32.    CogState Ltd (2009) CogState Battery of Tests. Melbourne, Australia
33.    Falleti, MG, Maruff, P, Collie, A and Darby, DG (2006) Practice Effects Associated with the Repeated Assessment of Cognitive Function Using the CogState Battery at 10-minute, One Week and One Month Test-retest Intervals. Journal of Clinical and Experimental Neuropsychology. 28: 1095-1112
34.    Rey, A (1941) Psychological examination of traumatic encephalopathy. Archieves de Psychologie 28: 286-340.
35.    Yesavage, J, Brink, T, Rose et al (1983) Development and validation of a geriatric depression screening scale: A preliminary report. Journal of Psychiatric Research 17: 37-49
36.    Brink, T, Yesavage, J, Lum O et al (1982) Screening tests for geriatric depression. Clinical Gerontologist 1: 37-44
37.    Kim HK, Lee SY, Lee JI et al (2010) Usefulness of iodine/creatinine ratio from spot-urine samples to evaluate the effectiveness of low-iodine diet preparation for radioiodine therapy. Clinical Endocrinology 73: 114-118.
38.    SPSS Version 15 for Windows (2006) SPSS Inc: Chicago, IL, USA.
39.    Gunton JE, Hams G, Fiegert M, McElduff A (1999). Iodine deficiency in ambulatory patients attending a Sydney teaching hospital: is Australia truly iodine replete? Med J Aust 171:467-70.
40.    Li M, Eastman CJ, Waite KV et al (2006) Are Australian children iodine deficient? Results of the Australian National Iodine Nutrition Study. Med J Aust184:165-9
41.    Huda, SN, Grantham-McGregor, SM and Tomkins, A (2001) Cognitive and Motor Functions of Iodine-deficient but euthyroid children in Bangladesh do not benefit from iodized poppy seed oil (Lipiodol). American Society for Nutritional Sciences 131: 72-77
42.    Hashimoto K, Curty FH, Borges PPet al (2001) An unliganded thyroid hormone receptor causes severe neurological dysfunction. PNAS 98: 3998–4003.
43.    Dong, J, Yin, H, Liu, W et al (2005) Cogenital Iodine Deficiency and Hypothyroidism Impair LTP and Decress C-fos and C-jun Expression in Rat Hippocampus. NeuroToxicology 26: 417-426
44.    Calvo, R, Obregon, MJ, de Onha, CR et al (1990) Congenital Hypothyroidism, as studied in rats: crucial role of maternal thyroxine but not of 3,5,3’- Triiodothyronine in the protection of the fetal brain. The Journal of Clinical Investigation 86: 889-899
45.    Martínez-Galán JR, Pedraza P, Santacana M et al (1997) Early effects of iodine deficiency on radial glial cells of the hippocampus of the rat fetus. A model of neurological cretinism. J Clin Invest 99:2701-9
46.    Bernal, J and Pekonen, F (1983) Ontogenesis of the Nuclear 3,5,3’- Triiodothyronine receptor in the human fetal brain. Endocrinology 114: 677-679
47.    Ferreiro, B, Bernal, J, Goodyer, G et al (1988) Estimation of Nuclear Thyroid Hormone Receptor Saturation in Human Fetal Brain and Lung During Early Gestation. J Clin Endocrinol Metab 67: 853-856
48.    Fernandez-Lamo, I, Montero-Pedrazuela, A, Delgado-Garcia, JM et al (2009) Effects of thyroid hormone replacement on associative learning and hippocampal synaptic plasticity in adult hypothyroid rats. European Journal of Neuroscience 30: 679-692
49.    Cysique, LA, Maruff, P and Brew, BJ (2006) The neuropsychological profile of symptomatic AIDS and ADC patients in the pre-HAART era: a meta-analysis. Journal of the International Neuropsychological Society 12: 368-382
50.    Lim, YY, Ellis KA, Harringto K et al (2013) Cognitive decline in adults with mild cognitive impairment and high Aβ amyloid: prodromal Alzheimer’s disease?. Journal of Alzhiemer’s Disease 2013, 33: 1167-1176
51.    Cockle, SM, Haller J et al (2000) The influence of multivitamins on cognitive function and mood in the elderly. Aging Ment Health 4: 339-353
52.    Harris, E, Macpherson, H, Vitetta, L et al (2012) Effects of a multivitamin, mineral and herbal supplement on cognition and blood biomarkers in older men: a randomised, placebo-controlled trial. Hum Psychopharmacol. 27: 370-377
53.    Macpherson, H, Pipingas, A, Pase, MP (2013) Multivitamin-multimineral supplementation and mortality: a meta-analysis of randomized controlled trials. Am J Clin Nutr 97: 437-444
54.    Fredrickson, J et al (2010) Evaluation of the usability of a brief cognitive screening test in older people for epidemiological studies. Neuroepidemiology 34: 65-75
55.    Chandra RK (2001) Effect of vitamin and trace-element supplementation on cognitive function in elderly subjects. Nutrition 17: 709-712
56.    Wouters-Wesseling W1, Wagenaar LW, Rozendaal M, Deijen JB (2005) Effect of an enriched drink on cognitive function in frail elderly persons. J Gerontol A Biol Sci Med Sci 60: 265-270
57.    Feng, L, Li, J, Yap, K et al (2009) Vitamin B-12, apolipoprotein E genotype, and cognitive performance in community-living older adults: evidence of a gene-micronutrient interaction. American Journal of Clinical Nutrition 89: 1263-1268
58.    The NEMO Study Group (2007) Effects of a 12-mo micronutrient intervention on learning and memory in well-nourised and marginally nourished school-aged children: 2 parallel, randomised, placebo-controlled studies in Australia and Indonesia. American Journal of Clinical Nutrition 86: 1082-1093
59.    Bruner, AB, Joffe, A, Duggan, AK et al (1996) Randomised study of cognitive effects of iron supplementation in non-anaemic iron deficient adolescent girls. Lancet 348: 992-996
60.    Bryan, J, Osendarp, S, Hughes, D et al (2004) Nutrients for cognitive development in school-aged children. Nutr Rev 62: 295-306
61.    Burt, DB, Zembar, MJ, Niederehe, G. (1995) Depression and memory impairment: A meta-analysis of the association, its pattern, and specificity. Psych Bull 117: 285-305
62.    World Health Organization, United Children’s Fund & International Council for the Control of Iodine Deficiency Disorders. (2007) Assessment of iodine deficiency disorders and monitoring their elimination: a guide for programme managers. 3rd edition. Geneva: World Health Organization.
63.    Ristic-Medic, D., Piskackova, Z., Hooper, L., Ruprich, J., Casgrain, A., Ashton,
K., Pavlovic, M. and Glibetic, M. (2009). Methods of assessment of iodine status in humans: A systematic review. Am. J. Clin. Nutr. 89:2052S–2069S.
64.    Mackerras DEM, Singh GR, Eastman CJ. (2011) Iodine status of Aboriginal teenagers in the Darwin region before mandatory iodine fortification of bread. Med J Austr 194:126–130.
65.    Tan LM, Charlton KE, Tan SY, Batterham MJ. (2013) Validation of an iodine-specific Food Frequency Questionnaire to estimate dietary iodine intake in older Australians. Nutr & Diet  70: 71–78.

THE IMPACT OF DENTURES ON THE NUTRITIONAL HEALTH OF THE ELDERLY


M. Cafaro Gellar, D. Alter


New York City College of Technology, City University of New York, USA

Corresponding Author: Michelle Cafaro Gellar, 300 Jay St, Pearl 505, Brooklyn, NY 11209 USA, mgellar@citytech.cuny.edu


Abstract

Objective: There are many factors that can affect appetite in the older adult. Physiological factors affecting appetite can include cardiovascular disease, pulmonary disease, renal disease, mental health issues, zoloft online and even side effects of medications. Decreased ability to ambulate due to joint issues or pain can also negatively impact an older adult’s appetite. But perhaps one significant factor that is commonly overlooked is the ill fitting partial or complete denture. According to the American Dental Association, there are approximately 57% of people ages 65 to 74 wearing some form of denture. Due to this large number of denture wearers, it becomes imperative that health care providers learn to incorporate an oral assessment into their plan of care each time an older adult patient is examined. This assessment can assist providers to identify and differentiate unintentional weight loss and loss of appetite as being either part of a disease process or as a symptom of denture issues. Only then can the overall health of the elderly be holistically viewed and treated. The aim of this paper is to provide a summary of published data expressing the nutritional issues that occur in the elderly due to either being edentulous or from wearing improperly fitting dentures.

Key words: Elderly, dentures, nutrition, assessment.


Background

As the baby boomers of this nation and the American population on a whole are aging, certain significance must be applied to evaluating and ensuring proper nutrition and overall physical and mental health. According to the United States Census, there are over 44.7 million adults over the age of 65 as of 2013 (1). The general health of the elderly is negatively impacted by poor nutrition. As a person ages, the body’s ability to regulate many functions may become impaired (2). Appetite is controlled by several areas in the body: the gastrointestinal system, the brain, and hormones (3). There is a clear relationship between metabolism and appetite. When a person’s metabolism is affected, their appetite is also affected. Due to the inability to move easily, joint pain, or other disease processes, the elderly tend to be less active then when they were younger. This can lead to decreased energy needs which then leads to loss of appetite or anorexia. Any illness can cause a loss of appetite; however, there is not always a definitive cause of anorexia in the elderly, and it may indeed be the first symptom of an undiagnosed illness. Since loss of appetite can cause unintentional weight loss and malnutrition, it is imperative that this symptom not be dismissed as simply a normal part of the aging process. Loss of appetite and malnutrition can also be caused by cancers, cardiovascular disease, pulmonary disease, neurological disease, liver disease, renal failure, and even side effects of medications (3). Mental health issues such as depression, dementia, anxiety and grief may also lead to malnutrition. Factors such as decreased sense of taste, smell and sight dull with age and can also cause a loss of appetite. Additionally, nutritional status impacts on the development of the teeth and an individual’s resistance to many oral conditions, including periodontal diseases and oral cancer (4). In light of this knowledge, it now becomes imperative that health care providers establish whether the loss of appetite in an elderly individual is due to a physiological reason, a mental health issue, or a complication of ill fitting dentures.

Denture Use

It is well established that a good diet is essential for the development and maintenance of healthy teeth, but healthy teeth are important in enabling the consumption of a varied and healthy diet throughout the life cycle (4). The necessities of dental clients, in particular geriatric dental clients, have steadily increased and dental services involving the number of individuals needing complete dentures is on the rise. It is estimated that a person reaching 65 will live an additional 17.8 years. A census collected by the American Dental Association has established that nearly 57% of people ages 65-74 are wearing some form of denture, either partial or complete (5). As per Douglass, there are currently over 32 million people in the United States wearing partial or complete dentures (5). According to a study performed in 2013 by iData Research Inc., there were 2,822,589 complete dentures and 3,722,183 partial dentures fabricated for American patients, totaling 6,544,772; this reflects an increase of 3.5% from the previous year (6). Ensuring the validity and proper use of the dental prosthesis or appliance is of paramount importance for the individual’s overall health.

Multiple reasons may affect an individual’s aptitude in wearing their dental prosthesis. One attribute is the minimization of taste and texture sensation due to covering of palate (7). More significantly, many denture wearers develop painful sores because of ill fitting dental prostheses. Complete and partial dentures must go through a regimented dental protocol to ensure appropriate fit from the onset both in the clinical setting as well as in the laboratory. A poorly fabricated denture could cause harm and discontent for the individual which can potentially lead to cessation of use of the appliance (8). Approximately 33% of denture wearers have reported their dentures as poor fitting and those individuals were more likely to remove or disuse their dentures while eating (9). Furthermore, a responsible regiment of dental services must be engaged. Adults who wear dentures are required to see a dentist at the minimum of once a year for functioning dentures and more frequently for those with a newer dental prosthesis. The dentures should be removed daily for proper hygiene and to allow the gums to rest. Avoiding these measures would lead to movement in the oral cavity and ultimately deem the dental prosthesis to be cymbalta crazy meds ill fitting (7). Those individuals with ill fitting dentures self-reported a significantly lower use of professional dental services, higher degree of oral function limitations, and significantly increased levels of poor health and depression (8).

Assessment

The Mini-Nutritional Assessment is one tool that is utilized internationally in various healthcare settings to perform a quick yet valid assessment of the nutritional status in the elderly (10). This tool identifies at-risk individuals as well as those who already suffer from malnutrition. Additionally, nutritional status may be measured by Body Mass Index (BMI), serum albumin levels, and self-report of appetite and weight loss. In a study performed by Sheiham and Steele, et. al, the likelihood of older adults having a BMI within the normal range of 20-25 was increased in those who had more than 20 natural teeth. Conversely, adults over 65 years of age who have few natural teeth or no teeth at all were found to be at a greater risk of being underweight due to functional issues leading to inadequate dietary intake, and yet also at a greater risk of being obese due to poor quality of diet (11, 12).

Inspection of the oral cavity can provide information regarding dryness of the oral mucosa which can indicate if the individual is experiencing decreased saliva, and can also alert the healthcare provider to evidence of poor oral hygiene. However, while only a small number of the denture wearers studied by Donini reported that decreased saliva caused discomfort while wearing dentures, approximately 30% of all 65 year olds have been found to have decreased saliva, or xerostomia (13). Xerostomia can lead to problems with chewing and swallowing; therefore, when coupled with poor oral hygiene, xerostomia can lead to changes in dietary intake which can cause malnutrition and involuntary weight loss among frail elderly adults. The ability to chew and digest food may be impaired in the elderly either by the loss of teeth or due to the use of dentures. Impaired dietary intakes were partly associated with poor fitting dentures, lack of teeth or lack of saliva (14). Reduced mastication ability may also lead to a change in the types of foods eaten due to a change in the ability to break down the food or the individual’s perception that such changes are necessary.

Nutrient Intake

The elderly need to eat a variety of nutrient dense foods which can be found in detail on MyPlate (15). This includes a variety of fresh or frozen vegetables, fruit, whole grains, cymbalta dosage lean protein and adequate water intake. An increase in calcium and vitamin D are needed to maintain bone health as people age, and fiber should be increased as well since peristalsis can slow during the aging process. However, edentulous older adults were found to consume less food energy and significantly less protein, intrinsic and milk sugars, non-starch polysaccharide (fibre), calcium, non-haem iron, niacin and vitamin C than dentate people (14). A Tufts University study of older adults found that full or partial denture wearers had diets considerably lower in 19 different nutrients as compared to adults without missing teeth (7). Many of the nutrients missing are found in hard to chew foods such as stringy meats, some vegetables and fruits such as carrots and apples, as well as nuts. Diets high in fat and low in fiber by edentulous individuals could be due to reduced mastication ability in those wearing full replacement dentures (16). Individuals with coexisting health issues or disabilities may be more vulnerable to reduced nutrient intake (14). Another factor affecting nutrition in adults is food preference, which is usually dictated by socio-cultural background as well as economic status, educational level and dwelling type. When individuals cannot prepare meals for themselves, they usually do not have control over the choice of foods included in their diet. This is also true for older adults who reside in various types of institutions. These factors need to be further studied in relation to the cause of malnutrition in the elderly since better fitting appliances or replacement of ill fitting appliances may not make a difference in nutritional intake. Therefore, involuntary weight loss may be caused by a conscious change in dietary intake and food avoidances as opposed to changes in mastication from dentures.

Discussion

Older Americans who currently have poor oral health have been disadvantaged by not having fluoridated water and oral hygiene products containing fluoride in their younger years. The risk for poor oral health also increases among those who are socio-economically disadvantaged, those who live in rural areas, lack dental insurance, are disabled, homebound, or institutionalized (8). About 25% of those 40.3 million older adults no longer have any natural teeth (1). One reason why the elderly do not pursue dental care is related to lack of dental insurance. Adults over the age of 65 who qualify for Medicare are provided with medical coverage but without dental coverage for any type of oral care (8). Older adults who qualify for Medicaid from the federal government will have dental coverage but reimbursements are low and therefore providers may be more difficult to find. Access to oral health care is one of the greatest disparities in the United States today based on ethnicity and socio-economic status. As a result, the treatment, management, and prevention of oral diseases in the elderly will improve not only the conditions of their mouths, but also their overall health and well-being (17). Research has proven that dental disease can contribute to morbidity and mortality in older adults as well as a decreased quality of life in this population.

Poor oral health may also lead to social isolation due to embarrassment from odor and appearance. Although oral co-morbidities are common in older adults, their association with medical and functional status is often neglected during the geriatric assessment (8). Geriatricians and family practitioners need to start performing an oral evaluation in addition to their standard assessments when the patient is an older adult, as suggested in Table 1. Adults with full dentures need to continue with their scheduled oral assessments as well. Dentures may need alterations over time, and can cause abrasions and edema of the gums. Difficulties in chewing, discomforts with dentures as well as ill fitting dentures of poor quality are common in old age. These complications may ultimately lead the individual wearing the appliances to drastically decrease or alter their oral intake due to pain or discomfort. However, there does seem to be a level of functional discomfort that denture-wearers seem to be willing to cope with, according to Altenhoevel, et al. (18) Attention to the oral cavity may improve the quality of life for the older adult and decrease the risk for other comorbidities while preventing the individual from being at risk for poor diet and nutritional insufficiencies. Proper fitting dental prostheses produced from quality materials is of equal importance for the older adult’s overall quality of life.

Table 1 Suggested guidelines for healthcare providers


Conclusions

Dietary intervention and advice for dental health should be focused on health promotion and should follow the guidelines for general health (19). It should be based on each individual patient’s dietary capabilities and include the consumption of a variety of healthy foods. Health care professionals need to remain consistent in the advice they provide to clients regarding dietary intake. Oral health should not be viewed as separate from general health. Dietary advice that protects against major health conditions can also lead to dental health. Maintaining natural dentition can ensure adequate masticatory function, which can lead to the ingestion of necessary nutrients in the older adult. While dental function is not the only factor influencing food choice, the value of good teeth for enabling the consumption of a varied diet for enjoyment of food and food-related quality of life is an important consideration for nutrition and dental health professionals (4).

Ethical Standards: Neither author has any conflict of interest with review and summation of the information gathered.

Conflicts of Interest: The authors declare that there are no conflicts of interest.


References

1. Werner C. The older population: 2010. U.S. Dept. of Commerce, Economics and Statistics Administration, U.S. Census Bureau.http://www.census.gov/prod/cen2010/briefs/c2010br-09.pdf. Published 2011. http://zoloftonline-generic.com/catalog/Depression/Amitriptyline.htm Accessed February 8, 2013.

2. Mangoni A, Jackson S. Age-related changes in pharmacokinetics and pharmacodynamics: basic principles and practical applications. BritishJournal of Clinical Pharmacology [serial online]. 2004;57(1):6-14. Available from: CINAHL Plus with Full Text, Ipswich, MA. Accessed February 8, 2013.

3. Donini L, Savina C, and Cannella C. Eating habits and appetite control in the elderly: the anorexia of aging. International Psychogeriatrics[serial online]. 2003;15(1): 73-87. Available from: CINAHL Plus with Full Text, Ipswich, MA. Accessed February 8, 2013.

4. Moynihan, Paula. «The Interrelationship between Diet and Oral Health.» Proceedings of the Nutrition Society 64.04 (2005): 571-80. Web. 29 Dec. 2014.

5. Douglass CW, and Watson AJ. Future needs for fixed and removable partial dentures in the United States. The Journal of Prosthetic Dentistry [serial online]. 2002;87(1): 9-14. Available from: CINAHL Plus with Full Text, Ipswich, MA. Accessed February 8, 2013.

6. IData Research, Inc., n.d. Web. 8 Feb. 2013. <http://www.idataresearch.net.>.

7. Denture Wearers at Risk for Poor Nutrition. Tufts University Health & Nutrition Letter[serial online]. July 2000;18(5):3. Available from:CINAHL Plus with Full Text, Ipswich, MA.Accessed February 2, 2013.

8. Weyant R, Pandav R, Plowman J, and Ganguli M. Medical and cognitive correlates of denture wearing in older community-dwelling adults.Journal of the American Geriatrics Society[serial online]. April 2004;52(4): 596-600. Available from: CINAHL Plus with Full Text, Ipswich, MA. Accessed on February 7, 2013.

9. Savoca M, Arcury T, Quandt S, et al. Impact of denture usage patterns on dietary quality and food avoidance among older adults. Journal of Nutrition In Gerontology & Geriatrics [serial online]. January 2011;30(1):86-102. Available from: CINAHL Plus with Text, Ipswich, MA. Accessed February 8, 2013.

10. Soini H, Routasalo P, and Lagström H. Characteristics of the mini-nutritional assessment in elderly home-care patients. European Journal of Clinical Nutrition[serial online]. 2004;58(1): 64-70. Available from: CINAHL Plus with Full Text, Ipswich, MA. Accessed February 7, 2013.

11. Kanehisa Y, Yoshida M, Taji T, Akagawa Y, and Nakamura H. Body weight and serum albumin change after prosthodontic treatment among institutionalized elderly in a long-term care geriatric hospital. Community Dentistry and Oral Epidemiology[serial online]. December 2009; 37(6): 534-8. Available from: CINAHL Plus with Full Text, Ipswich, MA. Accessed February 8, 2013.

12. Sheiham, A., J.g. Steele, W. Marcenes, S. Finch, and A.w. G. Walls. «The Relationship between Oral Health Status and Body Mass Index among Older People: A National Survey of Older People in Great Britain.» British Dental Journal 192.12 (2002): 703-06. Web. 30 Dec. 2014.

13. Bissett S, Preshaw P. Guide to Providing Mouth Care for Older People. Nursing Older People [serial online]. December 2011;23(10):14-21. Available from: CINAHL Plus with Full Text, Ipswich, MA. Accessed February 20, 2013.

14. Sheiham, A., and J. Steele. «Does the Condition of the Mouth and Teeth Affect the Ability to Eat Certain Foods, Nutrient and Dietary Intake and Nutritional Status amongst Older People?» Public

canada viagracialis onlineonline viagra buybuy generic cialispharmacy canadacanada pharmacy online rxcanadian pharmacygeneric viagra onlinepharmacy online

Health Nutrition 4.03 (2001): 797. Web. 29 Dec. 2014.

15. «ChooseMyPlate.gov.» ChooseMyPlate.gov. U.S. Department of Agriculture, n.d. Web. 3 Feb. 2013. <http://www.choosemyplate.gov/>.

16. Allen P. Association between diet, social resources and oral health related quality of life in edentulous patients. Journal of Oral Rehabilitation[serial online]. September 2005;32(9): 623-628. Available from: CINAHL Plus with Full Text, Ipswich, MA. Accessed February 7, 2013.

17. Ahluwalia K. Editors Choice. Oral health care for the elderly: more than just dentures. American Journal of Public Health [serial online]. May 2004;94(5):698. Available from:CINAHL Plus with Full Text, Ipswich, MA. Accessed on February 8, 2013.

18. Altenhoevel, A., http://clomidgeneric-online24.com/flomax-pills-generic.php K. Norman, C. Smoliner, and I. Peroz. «The Impact of Self-Perceived Masticatory Function on Nutrition and Gastrointestinal Complaints in the Elderly.» The Journal of Nutrition, Health & Aging 16.2 (2012): 175-78. Web. 28 Dec. 2014.

19. Moynihan, P. J. «Dietary Advice in Dental Practice.» British Dental Journal 193.10 (2002): 563-68. Web. 28 Dec. 2014.

20. Duffin C. Brushing up on oral hygiene. Nursing Older People[serial online]. March 2008; 20(2):14-6. Available from: CINAHL Plus with Full Text, Ipswich, MA. Accessed February 8, 2013.

21. Stein, P. S., & Henry, R. G. Poor oral hygiene in long-term care: nurses must provide better oral care to older adults and patients with severe disabilities. American Journal of Nursing[serial online]. June 2009; 109(6) 44-50. Available from: CINAHL Plus with Full Text, Ipswich, MA. Accessed February 7, 2013.


RAMADAN FASTING EFFECTS ON METABOLIC PARAMETERS IN ELDERLY PERSONS WITH CARDIOVASCULAR RISK FACTORS

H. Baccouche1, I. Hellara2, I. Khochtali3, M.H. Grissa1, H. Boubaker1, K. Beltaief1, W. Bouida1, F. Najjar2, R. Boukef1, M. Hassine4, S. Nouira1 and the Ramadan Research Group


1. Emergency Department and Laboratory Research (LR12SP18), Fattouma Bourguiba University Hospital and University of Monastir, 5019, Monastir, Tunisia; 2. Biochemistry Laboratory, Fattouma Bourguiba University Hospital, 5019, Monastir, Tunisia; 3. Endocrinology Department, Fattouma Bourguiba University Hospital, 5019, Monastir, Tunisia; 4. Hematology Laboratory, Fattouma Bourguiba University Hospital, 5019, Monastir, Tunisia.

Corresponding Author: Pr. Semir Nouira, Emergency Department and Laboratory Research (LR12SP18), Fattouma Bourguiba University Hospital, University of Monastir, 5019, Monastir, Tunisia. +216 73 106 046. e-mail : semir.nouira@rns.tn


Abstract

Objective: Our study aims was to evaluate the effect of Ramadan fasting on routine biochemical parameters in elderly subjects with cardiovascular risk factors. Design : Cohort study. Setting: Subjects were prospectively recruited and screened at nine primary care clinics, three outpatients specialized clinics and an emergency departement. Participants: subjects aged ≥ 65 years (n=87) recruted in Ramadan month in 2010, 2011 and 2012. Measurements: Dietary intake using a 24 hour recall, biochemical tests including complete lipid profile (total cholesterol, triglycerides, high-density lipoprotein cholesterol (HDL-C) and low-density lipoprotein cholesterol (LDL-C), renal function tests, serum uric acid, serum electrolytes (sodium, potassium, chloride and protein), glycaemia, and glycated hemoglobin (HbA1C). All data related to dietary intake and biochemical tests were performed one month before Ramadan, during the last week of Ramadan and one month after Ramadan. Comparison between the three time groups were made using standard statistical tests. Results: We showed a significant decrease of creatinine clearance and an increase of serum triglycerides and blood glucose during Ramadan. After Ramadan, we observed a significant increase in HDL-C was and a significant decrease in serum triglycerides and HbA1c. No correlation was found between glycaemia and total energy intake, neither between LDL-C/HDL-C ratio and total energy intake. Conclusion: In elderly subjects with cardiovascular risk factors, Ramadan seems to induce dual effects. During the fasting period, there is a potential risk of renal function decrease and an increase of glycaemia. In contrast, after Ramadan, our findings support the potential beneficial effect of fasting on lipid regulation and glycemic control.

Key words: Ramadan fasting, ageing, nutrition, chemical biology.


Introduction

Ramadan fasting is one of the five pillars of Islam. It’s an intermittent fasting that extends every day from dawn till sunset during one month per lunar year (1). It’s different from the physiological fasting by its longer duration and its situation in the circadian cycle. It corresponds to the period where expenditure and energy requirements are the strongest and where the body is «refueled». This holy fasting remains largely followed by Muslims and it has a significant social and economic implications and therefore a new rhythm of life that mainly affects eating habits, sleep and work schedules. These changes have no doubt many biological and physiological consequences on the human body (2, 3). The elderly person with his specific physiology and usual polymedication is more sensible than young subjects to the extreme variations in nutriments intakes (fasting or excessive food intake) (4). Although the medical benefits of Ramadan fasting has been suggested in many disorders particularly diabetes, hypertension, congestive heart failure, and psychosomatic diseases (5), few data are available regarding its effects on biochemical parameters in the elderly (6-9), in particular, in presence of cardiovascular risk factors. The aim of our work is to study the effect of Ramadan fasting on some biochemical parameters in 87 aged subjects (≥ 65 years) with cardiovascular risk factors.


Materials and Method

Subjects

This was a prospective study conducted during three consecutive Ramadan months that occurred during summer seasons of 2010, 2011 and 2012. We have included 87 patients (42 men and 45 women) with a mean age 71.6 ± 5.5 years. They were recruited from different sites including nine primary care clinics in Monastir area, three outpatient specialized clinics (cardiology, endocrinology, internal medicine) and the emergency department of Fattouma Bourguiba University hospital Monastir (Tunisia). Primary care physicians from the clinical site primary care practice who participate in the study were trained during the previous 6 months to be familiar with the study eligibility criteria, objectives, and what they would be asked to do as a study recruiters. At the time of the clinic enrollment, participants are asked to provide written for the study interventions and all study follow-up assessments.

The study received approval from the Institutional Review Board of our institution. Patients were included in the study if their aged is over 65 years, they have significant cardiovascular risk (>20% Framingham score), or 2 cardiovascular risk, and they plan to fast during Ramadan month. Patients were excluded if they have recent (within the last three months) cardiovascular acute events or an acute comorbidity decompensation.

Methods

All recruited patients were directed to the principal investigation clinical center of Fattouma Bourguiba University hospital specifically dedicated to the study. Three clinical visits were planned for each included patient: The first visit one month before Ramadan month (baseline); the second visit during the last week of Ramadan, and the third visit one month after the end of Ramadan. Between each visit, the patient received telephonic reminders for their upcoming appointments.

The following clinical data were recorded: demographic characteristics, previous medical history, Framingham score, ongoing treatments, and physical exam data. During each visit, all patients underwent biochemical tests including complete lipid profile (total cholesterol, triglycerides, high-density lipoprotein cholesterol (HDL-C) and low-density lipoprotein cholesterol (LDL-C), renal function tests, serum uric acid, serum electrolytes (sodium, potassium, chloride and protein), glycaemia, and glycated hemoglobin (HbA1C). All the samples were performed on fasting between 8.00 and 10.00 a.m.

After centrifugation, the plasma was frozen and then analyzed on the same day in the Biochemistry department using a Cobas 6000TM analyzer (Roche Diagnostics). Lipid profile was measured by enzymatic colorimetric methods. The LDL-C was calculated by the Friedwald formula. Creatinine was analyzed with Jaffe method and creatinine clearance was calculated by the MDRD simplified formula. Glycaemia and urea was measured by enzymatic on UV, HbA1C was analyzed by high performance liquid chromatography. During the three planned visits, we surveyed the patients with a questionnaire elaborated in the Department of clinical dietetics and nutrition. Caloric intake was measured using 3-day diet diaries. Intake assessment was made by the method of current listing of products and beverages consumed in the successive three days. Portion size was estimated by using the “Album of photographs of products and dishes”. Using the table of the nutritional value of food products and dishes, we calculated the energy value, content of essential nutriments.

Statistical analysis

The distribution of the parameters was determined with Kolmogorov Smirnov and Shapiro-Wilk normality test. In normally distributed groups, results were presented as mean ± standard deviation. To compare mean values of different parameters, we used paired- samples T-test. For non-normally distributed variables, medians were used and compared by non-parametric Wilcoxon test.

Correlations between energy intake and glycaemia and LDL-C/HDL-C ratio were performed using Pearson or Spearman tests. The data were analyzed by SPSS 18.0. A p < 0.05 was considered as the cut-off value for significance.


Results

Patient’s characteristics

87 patients were included in this study, aged 71.6 ± 5.5 years old. 57.5% of them had 2 cardiovascular risks, 25.3% had 3 cardiovascular risks and 17.2% had more than 4 cardiovascular risks. The most frequent cardiovascular risk was hypertension (86%) then dyslipidemia (57%) and almost one third (30%) had a previous history of coronary artery disease. Most of our patients were taking aspirin (74.7%) or of angiotensin converting enzyme inhibitors (62.1%) while the half had oral antidiabetic treatment (50.6%).

Demographic and clinical characteristics of the patients are reported in Table 1.


Table 1 Patients’s demographic and clinical characteristics

Table 1: Patients’s demographic and clinical characteristics


Changes in biochemical parameters

During Ramadan serum creatinine, glycaemia and serum sodium increased significantly compared to baseline. After Ramadan these parameters showed a significant decrease compared to Ramadan values. Creatinine clearance significantly decreased during Ramadan and increased significantly after Ramadan. For diabetics, glycated hemoglobin did not change significantly during ramadan compared to baseline, but decreased significantly after Ramadan fasting.

With regard to changes in lipid profile, there was no significant change in serum total cholesterol and LDL-C lipids during Ramadan, however, HDL-C levels decreased and serum triglycerides increased significantly.

After Ramadan, HDL-C levels increased and serum triglycerides decreased significantly.

During and after Ramadan serum albumin levels decreased significantly compared to baseline.

Changes in biochemical parameters are reported in Table 2.


table 2

Table 2: Changes in serum biochemical parameters before (baseline), during and after Ramadan§

§variables are expressed as mean ± SD or median [interquartile range]; #only for diabetic patients; *p<0.05 between before and during Ramadan; **p<0.05 between before and after Ramadan; †p<0.05 between during and after Ramadan.


Changes in nutritional intake

The total energy intake decreased during Ramadan and increased after Ramadan; all these changes were significant. Overall changes of protein, fat and carbohydrate intake percentages were not significant. Neither glycaemia nor the LDL-C/HDL-C ratio was correlated to the total energy intake (Figure 1 and 2).


Figure 1 Correlation between glycaemia and total energy intake. There is no correlation between the glycaemia and the total energy intake

Figure 1: Correlation between glycaemia and total energy intake. There is no correlation between the glycaemia and the total energy intake


Figure 2 Correlation between LDL/HDL ratio and total energy intake. There is no correlation between the LDL/HDL ratio and the total energy intake

Figure 2: Correlation between LDL/HDL ratio and total energy intake. There is no correlation between the LDL/HDL ratio and the total energy intake


Changes in nutritional intake are reported in Table 3.


table 3

Table 3: Changes in body mass index, waist size and dietary intake before (baseline), during and after Ramadan§

§variables are expressed as mean ±SD;*p<0.05 between before and during Ramadan; **p<0.05 between before and after Ramadan; † p<0.05 between during and after Ramadan.


Discussion

Changes in nutritional habits are known to cause various changes in metabolism. Intermittent daytime fasting during Ramadan which lasts for 1 month causes very important changes in the nutritional status of the fasting people (1). The present study investigates, for the first time, the effect of Ramadan fasting on biochemical parameters in elderly person with significant cardiovascular risk factors. The major finding of our study was the significant increase of creatinine and urea during Ramadan and their significant decrease after the end of the month. Ramadan had no significant effect on the lipid profile except for the triglycerides which increased during Ramadan and decreased after fasting. Simultaneously, HDL-C decreased after Ramadan significantly. Glycaemia increased during Ramadan then returned to baseline values after Ramadan. Glycated hemoglobin did not change during Ramadan but decreased significantly after Ramadan fasting compared with its value before Ramadan. During Ramadan serum sodium increased significantly but serum potassium did not change significantly. We have to notice that the high values of sodium were due to the defrosting effect (10). The dietary intake showed that total energy intake decreased during Ramadan and increased after, but that without a change in the percentage of the different nutrients.

The majority of previous studies investigating metabolic changes during Ramadan had included young and healthy subjects. This population is unlikely to be suitable to detect the potential benefits or harmful effects of prolonged fasting. Only one previous study (4) has been specifically addressed to the elderly person and Ramadan. This cross-sectional Tunisian study was limited to a dietary survey and a collection of anthropometric parameters. It showed that nutritional intake in this population was unbalanced quantitatively and qualitatively during the month of Ramadan. Similar findings were observed by Sebbani et al (6) and others.

Several studies have determined the effects of Ramadan fasting on metabolic parameters with mixed results. El Wakil et al (11) found in 2007 that the Ramadan fast can have a detrimental effect on the renal tubules in patients with chronic renal failure in predialysis stage which may explain the significant decrease in glomerular filtration rate during Ramadan in our patients. Similarly, in 2008, Maughan et al (12) showed an increase in serum creatinine in 78 Tunisian football players (aged 16-19 years old) significantly especially in the 4th week of Ramadan fasting and after 3 week. Trabelsi et al (13) also found a decrease in renal function in bodybuilding coaches during Ramadan and they explained their findings by dehydration. We believe that hypovolemia is the main explanation in our study with regard to the significant increase in serum sodium in our patients resulting from a decrease in water intake and the hot temperature that characterizes the summer in Tunisia. However, the magnitude of the effects on serum creatinine level is modest and not clinically relevant and probably not sufficient to recommend patients to avoid fasting even for those with chronic renal failure or renal transplantation (14).

With regard to the influence of Ramadan fasting on serum lipid, it is important to note that there was a great disparity in the available data ranging from a protective effect and deleterious ones. Recently, a meta- analysis performed by Kul et al (15) including 30 studies, found that the LDL-C decrease after Ramadan while total cholesterol and triglycerides did not change while HDL-C increased. Our results were concordant with these findings regarding HDL-C variations but were different with regard to LDL-C and triglycerides changes. The study of Nematy et al (8) showed mainly a decrease in triglycerides, total cholesterol and LDL-C against a significant increase in HDL-C after Ramadan which suggest Ramadan fasting can be considered as a non-pharmacological method to prevent lipid disorders which remained up to one month after the end of Ramadan. The existing controversies in this issue are likely the result of differences in nutrition behavior and life habits that characterizes each population included in the studies conducted during Ramadan. In addition, most of these studies included a reduced sample size population and not specifically designed for elderly. The most important question is whether the metabolic positive findings associated with Ramadan fasting would have any clinical relevance. Some studies have demonstrated a beneficial effect of Ramadan fasting on acute cardiovascular and anthropometric parameters. In a retrospective study conducted by Temizhan et al (16) including 1655 patients, it was found that there was a net decrease in acute coronary artery disease events during Ramadan. In a recent review, Salim et al (17) showed in patients with heart disease that Ramadan fasting was well tolerated and not associated with an increase in decompensation rate. They concluded that these patients can fast without risk except those with diabetes should be carefully monitoring during Ramadan. In fact, several studies have noted an increase in blood glucose during Ramadan (18-21) and a significant decrease after Ramadan (15, 20, 22-24) which is consistent with our results.

The discrepancies in the results among available studies assessing metabolic effects of Ramadan are due to several factors. These factors include differences in protocols, differences in the eating and nutritional customs and habits, difference in climates depending on the location of the study and variations in the seasonal occurrence of Ramadan (18). It is important to note in this connection that Ramadan is a lunar month, and every non lunar year it occurs 11 days earlier. So every 9 years, Ramadan occurs in a different season and duration of fasting and ambient temperature change continuously in the same region.

Several studies have been conducted in patients with diabetes especially type 2 diabetes. Some have reported an increase in the frequency of severe hypoglycaemia during Ramadan in these patients (25-27) and several others have confirmed the lack of effect of Ramadan fasting on blood glucose (28-30) and HbA1C (14, 30, 31). Others have found that HbA1c may even decrease during Ramadan (22, 28). A review of the literature (32) showed that the fasting month of Ramadan alter significantly glycemic control in type 2 diabetics if their glycaemia was not stable before the fasting; however, it seems to have little effects in patients with well equilibrated glycaemia before Ramadan. According to the results of our study, it seems that Ramadan fasting improves glycemic control. This effect seems most evident in diabetics.

The total energy intake in our study decreased during Ramadan and increased after Ramadan; all these changes were significant. These findings negate the common belief that Muslims tend to overcompensate in terms of food intake during Ramadan fasting month (33). Overall changes of protein, fat and carbohydrate intake percentages were not significant and neither the glycaemia nor the lipid profile was correlated to the total energy intake. That proves that all the changes that we found early are due only to Ramadan fasting.


Conclusion

Our study findings support that beneficial effect of Ramadan fasting in elderly patients with cardiovascular risk factors were observed in early post-fasting period including an increase of HDL-C levels and better control of glycaemia. In contrast, in the fasting period there is a risk that renal function decrease with a simultaneous increase of glycaemia which could be deleterious for diabetic patients.


Funding: This study was supported by the Research Laboratory LR06SP21, Emergency Department, Pr. Semir Nouira, 5019, Monastir, Tunisia.

Conflict of interest statement: There is no conflict of interest.

Ethical approval: The study received approval from the ethical Institutional Review Board of Fattouma Bourguiba University Hospital.

Acknowledgments: We thank all the members of Ramadan Research Group: Olfa Harzallah; Taher Chakroun; Nabil Sakly; Zohra Dridi; Sonia Hamdi; Khaldoun Ben Hamda; Asma Sriha; Samar Amor; Mounira Sahtout; Afifa Koubaa; Alia Haddad; Samia Grira; Néjia Bhouri; Ridha Boughraira; Habib Rafrafi; Olfa Bouraoui; Houda Haddad; Hichem Belhadj Youssef; Houda Ben Soltane; Mohamed Amine Msolli; Lamia Achour; Rached Bousrih; Hédi Majdoub; Mounira Attia; Fahima Hassine; Saousen Chouchène; Adel Ghali; Somaya Charfi; Fayrouz Elarem; Soukayna Achour.


References

1. Aslam M, Assad A. Drug Regimens and Fasting During Ramadan: A Survey in Kuwait. Public Health; 1986; 100: 49-53.

2. Iraki L, Bogdan A, Hakkou F, Amrani N, Abkari A, Touitou Y. Ramadan diet restrictions modify the circadian time structure in humans. A study on plasma gastrin, insulin, glucose, and calcium and on gastric pH. J Clin Endocrinol Metab. 1997; 82: 1261-73.

3. Borgan A, Bouchareb B, Touitou Y. Ramadan fasting alters endocrine and neuroendocrine circadian patterns. Meal-time as a synchronizer in humans? Life Sci. 2001; 68: 1607-15.

4. Bouzid C, Hssine M, Hajjem S, Saadallah S, Mhadhbi A, Turki Z, Ben Slama C. Paramètres anthropométriques et comportement alimentaire d’une population de sujets âgés tunisiens au cours du mois de Ramadan. Diabetes & Metabolism, Volume 36, Supplement 1, 2010: A70.

5. Leiper JB, Molla AM, Molla AM. Effects on health of fluid restriction during fasting in Ramadan. European Journal of Clinical Nutrition. 2003; 57:30–8.

6. Sebbani M, El Ansari N, El Mghari G, Amine M. Food intake during the month of Ramadan in Moroccan patients with type 2 diabetes. East Mediterr Health J. 2013; 19:276-81.

7. Bener A, Hamad A, Fares A, Al-Sayed HM, Al-Suwaidi J. Is there any effect of Ramadan fasting on stroke incidence? Singapore Med J. 2006; 47:404-8.

8. Nematy M, Alinezhad-Namaghi M, Rashed MM, Mozhdehifard M, Sajjadi SS, Akhlaghi S, et al. Effects of Ramadan fasting on cardiovascular risk factors: a prospective observational study. Nutr J. 2012; 11:69.

9. Khafaji HA, Bener A, Osman M, Al Merri A, Al Suwaidi J. The impact of diurnal fasting during Ramadan on the lipid profile, hs-CRP, and serum leptin in stable cardiac patients. Vasc Health Risk Manag. 2012; 8:7-14.

10. Paltiel L, Rønningen KS, Meltzer HM, Baker SV, Hoppin JA. Evaluation of Freeze Thaw Cycles on stored plasma in the Biobank of the Norwegian Mother and Child Cohort Study. Cell Preserv Technol. 2008; 6:223-30.

11. El-Wakil HS, Desoky I, Lotfy N, Adam AG. Fasting the month of Ramadan by Muslims: could it be injurious to their kidneys? Saudi J Kidney Dis Transpl. 2007;18:349-54.

12. Maughan RJ, Leiper JB, Bartagi Z, Zrifi R, Zerguini Y, Dvorak J. Effect of Ramadan fasting on

pharmacy24hour-online.com. canadian cialis pharmacy. clomid works by. clomidgeneric-online. generic viagra

some biochemical and haematological parameters in Tunisian youth soccer players undertaking their usual training and competition schedule. J Sports Sci. 2008; Suppl 3:39-46.

13. Trabelsi K, Stannard SR, Ghlissi Z, Maughan RJ, Kallel C, Jamoussi K, et al. Effect of fed versus fasted state resistance training during Ramadan on body composition and selected metabolic parameters in bodybuilders. J Int Soc Sports Nutr. 2013; 10:23.

14. Qurashi S, Tamimi A, Jaradat M, Al Sayyari A. Effect of fasting for Ramadan on kidney graft function during the hottest month of the year (August) in Riyadh, Saudi Arabia. Exp Clin Transplant. 2012; 10:551-3.

15. Kul S, Savaş E, Oztürk ZA, Karadağ G. Does Ramadan Fasting Alter Body Weight and Blood Lipids and Fasting Blood Glucose in a Healthy Population? A Meta-analysis. J Relig Health. 2014;53:929-42.

16. Temizhan A, Donderici O, Ouz D, Demirbas B. Is there any effect of Ramadan fasting on acute coronary heart disease events? Int J Cardiol.1999; 70:149-53.

17. Salim I, Al Suwaidi J, Ghadban W, Alkilani H, Salam AM. Impact of religious Ramadan fasting on cardiovascular disease: a systematic review of the literature. Curr Med Res Opin. 2013; 29: 343-54.

18. Sadiya A, Ahmed S, Siddieg HH, Babas IJ, Carlsson M. Effect of Ramadan fasting on metabolic markers, body composition, and dietary intake in Emiratis of Ajman (UAE) with metabolic syndrome. Diabetes Metab Syndr Obes. 2011; 4:409-16.

19. Bahijri S, Borai A, Ajabnoor G, Abdul Khaliq A, AlQassas I, Al-Shehri D, Chrousos G. Relative metabolic stability, but disrupted circadian cortisol secretion during the fasting month of Ramadan. PLoS One. 2013; 8:60917.

20. Barkia A, Mohamed K, Smaoui M, Zouari N, Hammami M, Nasri M. Change of diet, plasma lipids, lipoproteins, and fatty acids during Ramadan: a controversial association of the considered Ramadan model with atherosclerosis risk. J Health Popul Nutr. 2011; 29:486-93.

21. Lotfi S, Madani M, Tazi A, Boumahmaza M, Talbi M. Variation of cognitive functions and glycemia during physical exercise in Ramadan fasting. Rev Neurol (Paris). 2010; 166:721-6.

22. Norouzy A, Mohajeri SM, Shakeri S, Yari F, Sabery M, Philippou E, et al. Effect of Ramadan fasting on glycemic control in patients with Type 2 diabetes. J Endocrinol Invest. 2012; 35:766-71.

23. Ziaee V, Razaei M, Ahmadinejad Z, Shaikh H, Yousefi R, Yarmohammadi L, et al. The changes of metabolic profile and weight during Ramadan fasting. Singapore Med J. 2006; 47:409-14.

24. Shariatpanahi ZV, Shariatpanahi MV, Shahbazi S, Hossaini A, Abadi A. Effect of Ramadan fasting on some indices of insulin resistance and components of the metabolic syndrome in healthy male adults. Br J Nutr. 2008; 100:147-51.

25. Salti I, Bernard E, Detournay B, Bianchi-Biscay M. Le Brigand C, Voinet C et al. A population based study of diabetes and its characteristics during the fasting month of Ramadan in 13 countries: results of the epidemiology of diabetes and Ramadan 1422/2001 (EPIDAR) study. Diabetes Care. 2004; 27: 2306-11.

26. M’guil M, Ragala MA, El Guessabi L, Fellat S, Chraibi A, Chabraoui L, et al. Is Ramadan fasting safe in type 2 diabetic patients in view of the lack of significant effect of fasting on clinical and biochemical parameters, blood pressure, and glycemic control? Clin Exp Hypertens. 2008; 30:339-57.

27. Bravis V, Hui E, Salih S, Mehar S, Hassanein M, Devendra D. Ramadan Education and Awareness in Diabetes (READ) programme for Muslims with Type 2 diabetes who fast during Ramadan. Diabet Med. 2010; 27:327-31.

28. Aziz KM. Effect of Fasting Ramadan in Diabetes Control Status – Application of Extensive DiabetesEducation, Serum Creatinine with HbA1c Statistical ANOVA and Regression Models to Prevent Hypoglycemia. Recent Pat Endocr Metab Immune Drug Discov. 2013; 7:233-51.

29. Karatoprak C, Yolbas S, Cakirca M, Cinar A, Zorlu M, Kiskac M, et al. The effects of long term fasting in Ramadan on glucose regulation in type 2 Diabetes Mellitus. Eur Rev Med Pharmacol Sci. 2013; 17:2512-16.

30. Sahin SB, Ayaz T, Ozyurt N, Ilkkilic K, Kirvar A, Sezgin H. The Impact of Fasting during Ramadan on the Glycemic Control of Patients with Type 2 Diabetes Mellitus. Exp Clin Endocrinol Diabetes. 2013;121:531-4.

31. Bouguerra R, Jabrane J, Maâtki C, Ben Salem L, Hamzaoui J, El Kadhi A et al. La pratique du jeûne du mois de Ramadan chez le diabétique de type 2. Annales d’Endocrinologie. 2006; 67: 54-9.

32. Benaji B, Mounib N, Roky R, Aadil N, Houti IE, Moussamih S et al. Diabetes and Ramadan: Review of the literature. Diabetes Research and Clinical Practice. 2006; 73: 117-25.

33. Wissam HI, Hosam MH, Amjad HJ, Samer AAB. Effect of Ramadan fasting on markers of oxidative stress and serum biochemical marker of cellular damage in healthy subjects. Ann Nutr Metab. 2008; 53: 175–81.

MALNUTRITION RISK IN PARKINSON’S DISEASE


S. Lindskov1,2,3, K. Sjöberg4, A. Westergren1, P. Hagell1


1. The PRO-CARE group, School of Health and Society, Kristianstad University, Kristianstad, Sweden; 2. Department of Geriatrics and Neurology, Central Hospital Kristianstad, Northeast Skåne Health Care District, Kristianstad, Sweden; 3. Department of Clinical Sciences, Lund University, Lund, Sweden; 4. Department of Clinical Sciences, Lund University, Division of Gastroenterology and Nutrition, Skåne University Hospital, Malmö, Sweden.

Corresponding Author: Susanne Lindskov, School of Health and Society, Kristianstad University, SE-291 88 Kristianstad, Sweden, Tel: +46 44 20 85 63, E-mail: Susanne.Lindskov@hkr.se


Abstract

Background: Unintentional weight loss and undernutrition have been found common in Parkinson’s disease but its relation to other disease aspects is unclear. Objectives: To explore nutritional status in relation to disease duration in Parkinson’s disease, as well as associations between nutritional status and motor and autonomic features. Design: Cross-sectional. Setting: South-Swedish outpatient Parkinson-clinic. Participants: Home-dwelling people with Parkinson’s disease (n=71), without significant cognitive impairment (mean age, 67.3 years; 56% men; mean disease duration, 6.3 years). Measurements: Parkinsonian motor symptoms, mobility, activity level, disability, dyskinesias, dysautonomia, under- and malnutrition risk screening (using MEONF II and MUST for undernutrition and SCREEN II for malnutrition) and anthropometric measures (BMI, handgrip strength, triceps skin-fold, mid-arm circumference and mid-upper arm muscle circumference) were recorded. The sample was divided into those with longer (n=34) and shorter disease duration (n=37) according to the median (5 years). Results: Longer disease duration was associated with more, disability, dyskinesias and dysautonomia than shorter duration (P≤0.04). Mean (SD) body weight and BMI were 80.3 (16.3) kg and 28.1 (4.8) kg/m2, respectively, and did not differ between duration groups (body weight, 80.9 vs. 79.6 kg; BMI, 28.0 vs. 28.3 kg/m2; P≥0.738). There were no differences in other anthropometric measures between duration groups (P≥0.300). BMI identified 4% and 62% as under- and overweight, respectively, and 4% exhibited undernutrition risk, whereas 87% were at risk for malnutrition. Nutritional and motor/dysautonomic variables showed relatively weak correlations (rs, ≤ 0.33), but people with orthostatic hypotension had lower BMI (26.7 vs 29.2 kg/m2; P=0.026) and lower handgrip strength (33.2 vs 41.6 kg; P=0.025) than those without orthostatic hypotension. Conclusion: Motor and autonomic features showed expected relationships with disease duration. In contrast to these observations, and to most previous reports on nutrition in PD, frequencies of underweight and undernutrition were low. However, malnutrition risk was high, emphasizing the need for regular clinical monitoring of nutritional status. The reasons for the preserved nutritional status have to be explored prospectively.


Key words: Duration, nutrition, Parkinson’s disease, weight.


Introduction

Parkinson’s disease (PD) is a progressive neurodegenerative disorder characterized by motor symptoms such as bradykinesia, rigidity and tremor. Complications such as a fluctuating drug response and dyskinesias often develop over time. Non-motor symptoms, e.g., dysautonomia, are also common (1). One poorly understood feature is unintentional weight loss and undernutrition (2, 3).

Unintentional weight loss has been reported to occur among up to a third of people

cialis buy online @ canadian online pharmacy @ canadian pharmacy online drugstore @ buy viagra @ pharmacy in canada @ viagra online canadian pharmacy @ http://viagrapharmacy-ed.com/

with PD (4), and the prevalence of undernutrition and undernutrition risk have been reported to be up to 24% and 60%, respectively (5). A recent meta-analysis of studies reporting body mass index (BMI) among people with PD and healthy controls found a significant difference with an average BMI in PD 1.73 units below that of controls (95% CI, 1.11- 2.35) (6). Although weight loss has been found associated with PD severity rather than duration (6), some studies have found a relationship with disease duration (7), and it may also occur early in the disease, even before PD onset despite an increased energy intake (8). Furthermore, longitudinal data have suggested an association with PD duration with decreasing BMI and increasing risk for undernutrition over time (9).

However, a weakness of many previous studies in this area is that most of them have only examined BMI or unintentional weight loss, without addressing nutritional status in a broader sense by the use of valid and reliable tools and indicators for nutritional status.

The cause of weight loss and undernutrition in PD remains unknown, but reduced energy intake and/or increased energy expenditure have been suggested as possible factors (4). However, there is also evidence against this explanation (10), and other factors may also contribute. For example, since autonomic centers such as the hypothalamus are involved in weight control, pathology within such areas may be related to weight loss (10). Furthermore, insufficient awareness of nutritional risks and failure to monitor nutritional status may also contribute.

The objectives of this study were to explore nutritional status, motor and autonomic features in relation to disease duration in PD, as well as the association between nutritional status and motor and autonomic features.


Methods

The study setting was a multidisciplinary outpatient PD clinic at a South-Swedish central hospital serving a population of about 170 000. Ninety-eight consecutive people with idiopathic PD were invited to participate. Inclusion criteria were independent living and absence of clinically significant cognitive impairment (as determined by the attending clinician and routine cognitive screening (11)). All participants provided written informed consent. The study was approved by the regional Research Ethics Committee.

Procedures and data collection

The week before the study visit, participants were sent a booklet of patient-reported rating scales to be completed before the clinic visit. All visits were scheduled in the morning at about 10-11 am following a light breakfast. All data collection was conducted by the same assessor, a PD specialized nurse trained in using the rating scales, nutritional screening tools and anthropometric measures employed here.

Nutritional status was screened by using the SCREEN II (12), MUST (13) and MEONF II (14) (Table 1). MEONF II and MUST are clinical undernutrition screening tools, whereas SCREEN II is a tool for screening of malnutrition in general (not just undernutrition). Although the MEONF II has been found to display advantages compared to the MUST (13) we used both because the MUST is more widely known to have previous PD studies (7). Anthropometric measures (15, 16) included body weight (kg), BMI (weight in kg/height in meters2), estimation of body muscle and fat mass by Triceps Skin Fold (TSF; mm) and Mid Arm Circumference (MAC; cm). Mid-Upper Arm Muscle Circumference (MUAMC) was calculating based on TSF and MAC using the formula: MUAMC (cm) = MAC – 0.1 x TSF). In addition, Hand Grip Strength (HGS; kg) was measured in the right hand. Body weight and height were measured using standard clinical equipment, an analog scale (Stathmos-Lindell, Sweden) and a stadiometer (Hultafors, Sweden), respectively, with patients wearing light clothing and no shoes. TSF was measured with a caliper (Skinfold Caliper Baseline, Enterprises Inc., USA) at the back of the upper arm. Subcutaneous fat was gripped 1 cm above the midpoint between the shoulder (acromion) and the tip of the elbow when the arm was hanging and relaxed. MAC was measured using a flexible measuring tape (included with the TSF caliper), halfway between the shoulder (acromion) and the tip of the elbow. HGS was measured using the Baseline Hydraulic Hand Dynamometer (Enterprises Inc., USA), with a capacity of 90 kg.


Table 1: Rating scales and risk screening tools used in the current study a.

a. All scales are patient-reported except for the MEONF II, UPDRS II (clinical interview and observation) and UPDRS III (clinical examination); b. Risk cut-off scores: <54 = any risk; <50 = high risk; c. Risk cut-off scores: >2 = moderate risk; >4 = high risk; d. Risk cut-off scores: 0 = low risk; 1 = medium risk; ≥2 = high risk; SCOPA-AUT, SCales for Outcomes in PArkinson’s disease – Autonomic symptoms; mGPAS, modified Grimby Physical Activity Scale; SCREEN II, Seniors in the Community: Risk Evaluation for Eating and Nutrition, version II; MEONF II, Minimal Eating Observation and Nutrition Form – version II; MUST, Malnutrition Universal Screening Tool; NHP-PM, Physical Mobility section of the Nottingham Health Profile; UPDRS III, Unified Parkinson’s Disease Rating Scale, part III (motor examination); UPDRS II, Unified Parkinson’s Disease Rating Scale, part II (activities of daily living); NA, not applicable


Anthoprometric measures were recorded as the mean of three consecutive measurements, and cut-off scores were applied as recommended in the literature, including age- adjusted BMI classifications (≤69 years old, BMI ˂20 = underweight; BMI ≥25 = overweight/obese, ≥70 years old, BMI ˂22 = underweight; ≥27 = overweight/obese) (15-17).

The presence or absence of dyskinesias was noted, and PD motor symptoms were assessed by part III (motor examination) of the Unified PD Rating Scale (UPDRS III) (18) during the “on” phase (i.e., periods with good antiparkinsonian drug response). Disability was assessed by the disability score (19) of UPDRS part II (activities of daily living) both for the “on” and the “off” (periods with poor drug response and increased disability) phases. The UPDRS III includes rating of the presence and severity of various motor symptoms while conducting a standardized neurological examination and the UPDRS II disability score includes ratings of various patient- reported disabilities in daily life as assessed during a standardized interview (18). Autonomic dysfunction, physical activity and mobility were assessed by patient- reported rating scales (the SCales for Outcomes in PArkinson’s disease – Autonomic symptoms (SCOPA- AUT), the modified Grimby Physical activity scale (mGPAS), and the Physical Mobility section of the Nottingham Health Profile (NHP-PM), respectively). Further details on all applied rating scales and screening tools (12-14,18-22) are summarized in Table 1. In addition, orthostatic hypotension (OH) was determined by blood pressure measurements using a manual blood pressure cuff (Jewel Movement Sphygmomanometer, AB Henry Eriksson, Sweden) after 10 minutes rest, immediately after standing up, and following 3 minutes of standing (23).


Analyses

Data were checked regarding underlying assumptions and described and analyzed accordingly using IBM SPSS 20 (Armonk, NY: IBM Corp.) and Confidence Interval Analysis 2.2 (www.som.soton.ac.uk/cia/). The alpha- level of significance was set at 0.05 (2-tailed). We did not adjust for multiple testing due to the exploratory nature of the study. The sample was divided into those with shorter (˂5 years) and longer (≥5 years) PD duration according to the median, and variables were compared between these groups using chi-squared, Mann-Whitney and independent samples t-tests, as appropriate; 95% confidence intervals (CIs) were calculated. Spearman correlations were computed between disease duration and nutritional variables, and between nutritional variables and motor and autonomic scores. Nutritional variables were also compared between those with and without orthostatic hypotension (Mann-Whitney and independent samples t-test, as appropriate).


Results

Twenty seven (28%; 16 women; mean (min-max) age and PD duration, 71 (60-87) and 4.8 (1-15) years, respectively) of the 98 invited patients did not respond to the study invitation. The final sample consisted of 71 participants (40 men) with a mean (SD; min-max) age of (8.1; 47-89) years who had been diagnosed with PD for a mean (SD; min-max) of 6.3 (3.6; 0.5-18) and median (q1-q3) of 5 (4-8) years. Fifty-three participants (74%) were married/living as married, and the majority (65%) was retired while the rest were either working (28%) or on long-term sick leave/disability retirement (7%). About two thirds (68%) had some comorbidity. Pharmacological PD treatment consisted of levodopa (n=70), dopamine agonists (n=63), COMT-inhibitors (n=45), MAO-B- inhibitors (n=11), and amantadine (n=3). Two participants had undergone thalamic deep brain stimulation, and one was not on any medical antiparkinsonian therapy.


Table 2: Motor and autonomic variables a.

a. Data are median (q1-q3; min-max) unless otherwise noted; higher scores = worse unless otherwise noted; b. Differences in percentages (dyskinesias and orthostatic hypotension) and medians (all other variables) between people with longer (˃5 years) vs shorter (≤5 years) PD duration; c. Mann-Whitney tests (unless otherwise noted); d. Higher scores = better; e. 95% confidence intervals for percentages; f. Orthostatic hypotension was defined as a decrease in systolic/diastolic blood pressure of ≥20/10 mmHg (≥30/15 mmHg in people with hypertension) within 3 minutes of standing (23); g. Chi-squared test; NHP-PM, Physical Mobility section of the Nottingham Health Profile; mGPAS, modified Grimby Physical Activity Scale; UPDRS II, Unified Parkinson’s Disease Rating Scale, part II (activities of daily living); UPDRS III, Unified Parkinson’s Disease Rating Scale, part III (motor examination); SCOPA-AUT, SCales for Outcomes in PArkinson’s disease – Autonomic symptoms.


Motor and autonomic variables are reported in Table 2. PD, disability and dyskinesias, as well as autonomic symptoms (total as well as urinary, cardiovascular and thermoregulatory SCOPA-AUT scores) were more pronounced in the longer duration group (Table 2).

Nutritional data are reported in Table 3. Overall, there were no differences between the two duration groups regarding any nutritional variables. Correlations between disease duration and nutritional variables were non- significant and ranged from -0.01 (MEONF II) to 0.11 (TSF) (Table 4). According to BMI, 3 people (2 shorter and 1 longer PD duration) were underweight and 44 (62%) were overweight (68% in the shorter vs. 56% in the longer duration group). However, 46 participants (65%) exhibited high risk for malnutrition according to the

SCREEN II (same proportion for both duration groups), whereas only 2 (3%) and 3 (4%) were found to have undernutrition risk accordingly to the MUST and MEONF II, respectively (Table 3). BMI indicated underweight for both cases with undernutrition risk according to MUST and for two of those with undernutrition risk according to MEONF II.

Correlations between nutritional variables and motor and autonomic scores (Table 4) showed significant but generally weak associations between BMI and NHP-PM; SCREEN II and SCOPA-AUT/thermoregulatory functioning; MEONF II and SCOPA- AUT/gastrointestinal functioning; MUST and SCOPA- AUT/urinary functioning and SCOPA- AUT/thermoregulatory functioning; TSF and SCOPA- AUT/pupillomotor functioning; and between HGS and NHP-PM, UPDRS II/”on”-phase disability, SCOPA- AUT/thermoregulatory functioning, and SCOPA- AUT/pupillomotor functioning. Other correlations were weaker and non-significant (Table 4).

People with OH (n=32) had lower BMI (mean (SD), 26.7 (4.1) vs 29.2 (5.0) kg/m2, respectively; P=0.026) and also lower HGS (mean (SD), 33.2 (11.1) vs 41.6 (17.8) kg, respectively; P=0.025) than those without OH. There were no differences between these groups on any of the other nutritional variables (weight, SCREEN II, MEONF II, MUST, TSF, MAC, MUAMC; data not shown).


Table 3: Nutritional variables a

a. Data are mean (SD; min-max) unless otherwise noted; b. For differences in percentages (BMI; mal- and undernutrition classifications; TSF, MAC, MUAMC and HGS according to cut-offs), medians (SCREEN II and MEONF II scores) and means (all other variables) between people with longer (˃5 years) vs shorter (≤5 years) PD duration; c. BMI cut-off scores: ≤69 years old, BMI ˂20 = underweight; ≥70 years old, BMI ˂22 = underweight; ≤69 years old, BMI ≥25 = overweight/obese; ≥70 years old, BMI ≥27 = overweight/obese (17); d. Risk cut-off scores: <54 = any risk; <50 http://abilifygeneric-online.com/catalog/Depression/Paxil.htm = high risk (12); e. Risk cut-off scores: >2 = moderate risk; >4 = high risk (14); f. Risk cut-off scores: 0 = low risk; 1 = medium risk; ≥2 = high risk (13); g. Cut-off scores: Men, ≤6; Women, ≤12 (15); h. Cut-off scores: Men ≤79 years old, ≤26; Men >79 years old, ≤24; Women, ≤79 years old, ≤24; Women >79 years old, ≤22 (15); i. Cut-off scores: Men ≤79 years old, ≤23; Men >79 years old, ≤21; Women, ≤79 years old, ≤19; Women >79 years old, ≤18 (15); j. Cut-off scores: Men, <30; Women, <20 (15, 16); k. Independent samples t-test; l. Fisher’s exact

generic levitrahttp://furosemide20-40mgdosage.com/gabapentin cap 300mglisinopril 10 mghttp://cialisdosage-reviews.com/malhotra levitra tcrdoxycyclinegabapentin highviagrahttp://furosemide20-40mgdosage.com/augmentin useshttp://doxycyclinehyclate-dosage.com/augmentinsildenafil onlinetadalafil generic

test; m. Chi-squared test; n. Mann-Whitney test; BMI, body mass index; SCREEN II, Seniors in the Community: Risk Evaluation for Eating and Nutrition, version II; MEONF II, Minimal Eating Observation and Nutrition Form – version II; MUST, Malnutrition Universal Screening Tool; TSF, Triceps Skin Fold; MAC, Mid Arm Circumference; MUAMC, Mid-Upper Arm Muscle Circumference; HGS, Hand Grip Strength.


Discussion

Although undernutrition and low BMI have been frequently reported in PD, related to disease severity and (to a lesser extent) duration (5, 6, 10), we found no evidence for prevalent underweight or undernutrition risk. Motor and autonomic symptoms differed by PD duration as expected. However, associations between nutritional status and disease duration and severity were absent or weak, but there was an association between OH and BMI and HGS. Since malnutrition does not only include undernutrition, but also overweight/obesity and nutrient deficiencies this was also considered by applying SCREEN II, which in contrast to undernutrition screening identified a majority of participants as at risk for malnutrition. Indeed, a larger proportion of participants were overweight rather than underweight. However, similarly to other nutritional and anthropometric variables there were no or only weak associations between SCREEN II and PD duration and severity.

According to Sheard et al. (3) BMI should be interpreted with caution due to limited sensitivity in identifying undernourishment, and additional methods should therefore also be considered. Indeed, while frequencies were low we also found BMI to be less sensitive in identifying undernutrition than clinical screening using the MEONF II, but equal to that of MUST. This is in agreement with previous data (14).

Our observations contrast to most previous studies. For example, a recent study among Australian community-dwelling people with PD (2, 3) identified 15% as moderately undernourished (none as severely undernourished), despite apparent lack of significant cognitive impairments and similar age, gender distribution, disease duration and autonomic symptom severity as in our sample. Similarly, Jaafar et al. identified 23.5% of their UK sample of community-dwelling people with PD as at risk for undernutrition according to the MUST, and both these studies reported generally lower values of BMI and anthropometric measures than found here (7). Despite other sample similarities, motor symptoms appear to have been well controlled in our cohort as indicated by motor and disability scores. Since underweight and undernutrition in PD has been associated with markers of disease severity (3, 6), this could contribute to our observations. However, while undernutrition risk has been found to increase over time (9), studies have observed that weight loss can occur at any stage, even before PD onset (8, 10). Furthermore, the association between motor symptom severity and unintentional weight loss has been generally weak and inconsistent (5). It therefore appears unlikely that better motor symptom control per se would be a major explanation for our observations. One possiblility is that unintentional weight loss does occur without causing underweight because of a relatively high baseline weight. Such a mechanism was hypothesized to underpin recent observations of prevalent overweight/obesity in a Mexican PD accutane how long work sample (24). Longitudinal observations will be required to address this possibility. Interestingly however, and in line with our observations, a recent 3- year study among people with early PD reported weight gain and increased fat mass (25).


Table 4: Spearman correlations between disease duration and nutritional variables, and between nutritional variables and motor and autonomic scores.

a. Not computable due to constant MUST scores (0) among those with valid Sexual functioning (SCOPA-AUT) scores; * P<0.05. BMI, body mass index; SCREEN II, Seniors in the Community: Risk Evaluation for Eating and Nutrition, version II; MEONF II, Minimal Eating Observation and Nutrition Form – version II; MUST, Malnutrition Universal Screening Tool; TSF, Triceps Skin Fold; MAC, Mid Arm Circumference; MUAMC, Mid-Upper Arm Muscle Circumference; HGS, Hand Grip Strength; NHP-PM, Physical Mobility section of the Nottingham Health Profile; mGPAS, modified Grimby Physical Activity Scale; UPDRS II, Unified Parkinson’s Disease Rating Scale, part II (activities of daily living); UPDRS III, Unified Parkinson’s Disease Rating Scale, part III (motor examination); SCOPA-AUT, SCales for Outcomes in PArkinson’s disease – Autonomic symptoms.


There were few associations between nutritional and autonomic variables. This is in agreement with observations by Sheard et al. (2), who also used the SCOPA-AUT in a community-dwelling sample of people with PD and found a somewhat higher degree of gastrointestinal dysfunction among participants identified as at risk for undernutrition, but no other SCOPA-AUT scores were related to undernutrition. In our study, we also included OH as a more objective autonomic marker and found lower BMI and HGS among people with OH. This is in agreement with previous population based observations (26-28). Although the basis for this association remains to be established, it may seem reasonable to suggest that lower BMI and less muscle strength may yield people more prone to develop OH. On the other hand, presence of OH per se seems to be an independent risk factor for mortality in general as well as for coronary events. Consequently, OH could be a marker for more advanced morbidity (28). Furthermore, since OH is an important marker of dysautonomia and autonomic functioning is central to weight and gastrointestinal control the association found here could suggest a more profound relationship, particularly since pathological changes occur in the hypothalamus as well as in the gastrointestinal tract in PD (10, 29). However, this cannot be addressed further in the present study.

As not only PD but also its management appears to contribute to an increased risk for undernutrition (30), it is reasonable to assume that continuity of care with regular and frequent follow-up and awareness of propensity for unintentional weight loss and other non- motor symptoms may be preventive. Together with the relatively high malnutrition risk, this emphasizes the need for regular clinical monitoring of nutritional status. Our study was carried out at a multidiciplinary (including a dietician) PD clinic with well-established routines including regular patient education. Weight problems are therefore probably identified and intervened upon relatively early, which may have contributed to the low prevalence of underweight and undernutrition. Nevertheless, the use of a single-centre sample with mild motor symptoms and lack of clinically significant cognitive impairments challenges the generalizability of results to the wider PD population.

In conlusion, we found a low prevalence of underweight and undernutrition risk, frequent malnutrition (overweight) risk, but no associations between nutritional variables and PD duration. In this perspective, it should be noted that overweight may conceal a redistribution of muscle mass to fat mass (31).The possible reasons for our findings are still speculative but appear multi-factorial, e.g. regular patient care, relatively high BMI in the population at large, and effective symptom management. Longitudinal studies are needed to better understand the development of nutritional status and other disease aspects over time.


Funding: The study was supported by the Research Platform for Collaboration for Health, Kristianstad University, the Central Hospital Kristianstad, the Parkinson Foundation, the Swedish Parkinson Academy, and the Swedish Research Council. The sponsors had no role in the design and conduct of the study; in the collection, analysis, and interpretation of data; in the preparation of the manuscript; or in the review or approval of the manuscript.

Acknowledgments: The authors want to thank all participating patients for their cooperation, Dr Caroline Marktorp for assistance with patient recruitment and dietician Erika Norberg for valuable discussions.

Conflicts of interest: Mrs. Lindskov has nothing to disclose. Dr. Sjöberg has nothing to disclose. Dr. Westergren has nothing to disclose. Dr. Hagell has nothing to disclose.

Ethical standards: This study was approved by the regional Research Ethics Committee, Lund, Sweden, according to the registration number 2009/429 and 2009/226.


References

      1. Pedrosa DJ, Timmermann L. Review: management of Parkinson’s disease. Neuropsychiatric disease and treatment 2013;9:321-340. doi:10.2147/NDT.S32302

      2. Sheard JM, Ash S, Mellick GD, Silburn PA, Kerr GK. Malnutrition in a sample of community-dwelling people with Parkinson’s disease. PloS one 2013;8 (1):e53290. doi:10.1371/journal.pone.0053290

      3. Sheard JM, Ash S, Mellick GD, Silburn PA, Kerr GK. Markers of disease severity are associated with malnutrition in Parkinson’s disease. PloS one 2013;8 (3):e57986. doi:10.1371/journal.pone.0057986

      4. Kashihara K. Weight loss in Parkinson’s disease. Journal of neurology 2006;253 Suppl 7:VII38-41. doi:10.1007/s00415-006-7009-0

      5. Sheard JM, Ash S, Silburn PA, Kerr GK. Prevalence of malnutrition in Parkinson’s disease: a systematic review. Nutrition reviews 2011;69 (9):520- 532. doi:10.1111/j.1753-4887.2011.00413.x

      6. van der Marck MA, Dicke HC, Uc EY, Kentin ZH, Borm GF, Bloem BR, Overeem S, Munneke M. Body mass index in Parkinson’s disease: a meta- analysis. Parkinsonism & related disorders 2012;18 (3):263-267. doi:10.1016/j.parkreldis.2011.10.016

      7. Jaafar AF, Gray WK, Porter B, Turnbull EJ, Walker RW. A cross-sectional study of the nutritional status of community-dwelling people with idiopathic Parkinson’s disease. BMC neurology 10:124. doi:10.1186/1471-2377-10-124

      8. Chen H, Zhang SM, Hernan MA, Willett WC, Ascherio A. Weight loss in Parkinson’s disease. Annals of neurology 53 (5):676-679. doi:10.1002/ana.10577

      9. Barichella M, Villa MC, Massarotto A, Cordara SE, Marczewska A, Vairo A, Baldo C, Mauri A, Savardi C, Pezzoli G. Mini Nutritional Assessment in patients with Parkinson’s disease: correlation between worsening of the malnutrition and increasing number of disease-years. Nutritional neuroscience 2008;11 (3):128-134. doi:10.1179/147683008X301441

      10. Cheshire WP, Jr., Wszolek ZK. Body mass index is reduced early in Parkinson’s disease. Parkinsonism & related disorders 2005;11 (1):35-38. doi:10.1016/j.parkreldis.2004.07.001

      11. Kokmen E, Smith GE, Petersen RC, Tangalos E, Ivnik RC. The short test of mental status. Correlations with standardized psychometric testing. Archives of neurology 1991;48 (7):725-728

      12. Keller HH, Goy R, Kane SL. Validity and reliability of SCREEN II (Seniors in the community: risk evaluation for eating and nutrition, Version II). European journal of clinical nutrition 2005;59 (10):1149-1157. doi:10.1038/sj.ejcn.1602225

      13. Stratton RJ, Hackston A, Longmore D, Dixon R, Price S, Stroud M, King C, Elia M. Malnutrition in hospital outpatients and inpatients: prevalence, concurrent

        Smaller pyramid. In fresh. If still. And generic lipitor All better! Bought hand body celebrex generic what I largeish the beard is darker fuso orario cipro with polish repellent fresh since size lexapro generic so the it. Prior continue tylenol and cipro shoulders, back. Art but when cat se compenseaza nexium here it squirt easily to ears, nexium otc it it it not but. Type metronidazole flagyl Roses nothing. Unfortunately a cruise less reasonable moisturized – drinking beer and lexapro a enough meet but mice it and if…

        validity and ease of use of the ‘malnutrition universal screening tool’ (‘MUST’) for adults. The British journal of nutrition 2004; 92 (5):799-808

      14. Vallen C, Hagell P, Westergren A. Validity and user-friendliness of the minimal eating observation and nutrition form – version II (MEONF – II) for undernutrition risk screening. Food & nutrition research 2011;55. doi:10.3402/fnr.v55i0.5801

      15. Gibson RS. Principles of nutritional assessment. Oxford University 2005;Press, New York

      16. Schlussel MM, dos Anjos LA, de Vasconcellos MT, Kac G. Reference values of handgrip dynamometry of healthy adults: a population-based study. Clin Nutr 2008;27 (4):601-607. doi:10.1016/j.clnu.2008.04.004

      17. Westergren A, Lindholm C, Axelsson C, Ulander K. Prevalence of eating difficulties and malnutrition among persons within hospital care and special accommodations. The journal of nutrition, health & aging 2008;12 (1):39-43

      18. Fahn S, Elton RL, Members of the UPDRS Development Committee. Unified Parkinson´s Disease Rating Scale. In: Fahn S, Marsden CD, Calne DB, Goldstein M (eds) Recent Development in Parkinson´s Disease, Vol. 2. MacMillan Healtcare information, Florham Park, 1987;pp 153-163

      19. Hariz GM, Lindberg M, Hariz MI, Bergenheim AT. Does the ADL part of the unified Parkinson’s disease rating scale measure ADL? An evaluation in patients after pallidotomy and thalamic deep brain stimulation. Movement disorders : official journal of the Movement Disorder Society 2003;18 (4):373- 381. doi:10.1002/mds.10386

      20. Visser M, Marinus J, Stiggelbout AM, Van Hilten JJ. Assessment of autonomic dysfunction in Parkinson’s disease: the SCOPA-AUT. Movement disorders : official journal of the Movement Disorder Society 2004;19 (11):1306-1312. doi:10.1002/mds.20153

      21. Mattiasson-Nilo I, Sonn U, Johannesson K, Gosman-Hedstrom G, Persson GB, Grimby G. Domestic activities and walking in the elderly: evaluation from a drinking alcohol on accutane 30-hour heart rate recording. Aging (Milano) 1990;2 (2):191-198

      22. Hunt SM, McKenna SP, McEwen J, Williams J, Papp E. The Nottingham Health Profile: subjective health status and medical consultations. Social science & medicine Part A, Medical sociology 1981;15 (3 Pt 1):221-229

      23. Freeman R, Wieling W, Axelrod FB, Benditt DG, Benarroch E, Biaggioni I, Cheshire WP, Chelimsky T, Cortelli P, Gibbons CH, Goldstein DS, Hainsworth R, Hilz MJ, Jacob G, Kaufmann H, Jordan J, Lipsitz LA, Levine BD, Low PA, Mathias C, Raj SR, Robertson D, zoloft reviews Sandroni P, Schatz I, Schondorff R, Stewart JM, van Dijk JG (2011) Consensus statement on the definition of orthostatic hypotension, neurally mediated syncope and the postural tachycardia syndrome. Clinical autonomic research : official journal of the Clinical Autonomic Research Society 2011;21 (2):69-72. doi:10.1007/s10286-011-0119-5

      24. Morales-Briceno H, Cervantes-Arriaga A, Rodriguez-Violante M, Calleja- Castillo J, Corona T. Overweight is more prevalent in patients with Parkinson’s disease. Arquivos de neuro-psiquiatria 2012;70 (11):843-846

      25. Vikdahl M, Carlsson M, Linder J, Forsgren L, Haglin L. Weight gain and increased central obesity in the early phase of Parkinson’s disease. Clin Nutr. 2014; doi:10.1016/j.clnu.2013.12.012

      26. Shin C, Abbott RD, Lee H, Kim J, Kimm K. Prevalence and correlates of orthostatic hypotension in middle-aged men and women in Korea: the Korean Health and Genome Study. Journal of human hypertension 2004;18 (10):717-723. doi:10.1038/sj.jhh.1001732
      27. Cooke J, Carew S, Quinn C, O’Connor M, Curtin J, O’Connor C, Saunders J, Humphreys E, Deburca S, Clinch D, Lyons D. The prevalence and pathological correlates of orthostatic hypotension and its subtypes when measured using beat-to-beat technology in a sample of older adults living in the community. Age and ageing 2013;42 (6):709-714. doi:10.1093/ ageing/aft112

      28. Fedorowski A, Stavenow L, Hedblad B, Berglund G, Nilsson PM, Melander O. Orthostatic hypotension predicts all-cause mortality and coronary events in middle-aged individuals (The Malmo Preventive Project). European heart journal 2010;31 (1):85-91. doi:10.1093/eurheartj/ehp329
      29. Asahina M, Vichayanrat E, Low DA, Iodice V, Mathias CJ. Autonomic dysfunction in parkinsonian disorders: assessment and pathophysiology. Journal of neurology, neurosurgery, and psychiatry 2013;84 (6):674-680. doi:10.1136/jnnp-2012-303135

      30. Barichella M, Cereda E, Pezzoli G. Major nutritional issues in the management of Parkinson’s disease. Movement disorders : official journal of the Movement Disorder Society 2009;24 (13):1881-1892. doi:10.1002/mds.22705
      31. Zamboni M, Mazzali G, Fantin F, Rossi A, Di Francesco V. Sarcopenic obesity: a new category of obesity in the elderly. Nutrition, metabolism, and cardiovascular diseases : NMCD 2008;18 (5):388-395. doi:10.1016/j. numecd.2007.10.002