jarlife journal
Sample text

AND option

OR option

mTOR REGULATES THE PROLIFERATION AND DIFFERENTIATION OF TENDON STEM CELLS: AN IN VITRO STUDY


S. Gao, H. Tang, BH. Zhou, KL. Tang


Department of Orthopedic Surgery, Third Military Medical University Affiliated Southwest Hospital, Gaotanyan Str. 30, Chongqing 400038, People’s Republic of China

Corresponding Author: BH. Zhou, KL. Tang, Department of Orthopedic Surgery, Third Military Medical University Affiliated Southwest Hospital, Gaotanyan Str. 30, Chongqing 400038, People’s Republic of China, yijian510868@hotmail.com
 

J Aging Res Clin Practice 2017;6:168-175
Published online September 7, 2017, http://dx.doi.org/10.14283/jarcp.2017.22


Abstract

Objectives: The mechanistic target of rapamycin (mTOR) controls cell growth and proliferation via translation regulation in eukaryotes. The present study investigated the effects of mTOR on the proliferation and differentiation of tendon stem cells (TSCs). Methods: The proliferation and differentiation ability of TSCs was tested in response to antagonist (MHY1485), and a depressor of mTOR (Rapamycin and KU0063794). CCK test was performed to test cell proliferation; quantitative real-time PCR (RT-PCR) and Western blot test were performed to evaluate the differentiation of TSCs. Results: Blocking of mTOR1 inhibited the proliferation of TSCs and blocking of mTOR2 enhanced the proliferation of TSCs; however, the effects of mTOR1 surpassed the effects of mTOR2. Blocking of mTOR1 or activation of mTOR2 induced the expression of TNC, and blocking of mTOR2 inhibited the expression of TNC. Blocking of mTOR1 by rapamycin decreased the expression of ap2. Both blocking of mTOR1 or mTOR2 had little effects on the expression of Runx2 and Sox9; however, activation of mTOR2 induced the expression of Runx2 and Sox9. Moreover, the Western blot test showed that blocking of mTOR1 by Rapamycin or the blocking of both mTOR1 and mTOR2 by KU-0062794 enhanced the expression of TNC; in addition, blocking of mTOR1 by Rapamycin enhanced the expression of c-EBPα and Sox9. However, activation of mTOR1 and mTOR2 by MHY1485 increased the expression of Runx2. Conclusions: mTOR played important roles in the proliferation and differentiation of TSCs. Furthermore, mTOR1 and mTOR2 played different roles on the proliferation and differentiation of TSCs. Blocking mTOR1 inhibited the proliferation of TSCs and played a dominant function.Blocking of mTOR1 enhanced the expression of tenocyte related genes; however, blocking of mTOR2 inhibited the expression of TNC. Blocking of mTOR1 by rapamycin decreased the expression of ap2 and activation of mTOR2 induced the expression of Runx2.

Key words: mTOR, proliferation, differentiation, tendon, stem cells.


Introduction

The primary function of tendons is to transfer mechanical loads from muscle to bone, which can easily lead to tendinopathy (1). Tendinopathy commonly affects adult athletes and aged population; it occurs in the rotator cuff (2), Achilles, patellar tendons (3), and medial epicondyle (4). Bi firstly identified tendon stem/progenitor cells (TSPCs) in 2007 (5). More and more evidence showed that pluripotent tendon cells (PTCs), also termed tendon stem cells (TSCs), play important roles in the development of tendinopathy via proliferation and non-tenocyte differentiation (6-9).
The mechanistic target of rapamycin (mTOR) is a specific target of the natural compound rapamycin (10-12). mTOR is a highly conserved protein kinase and a member of a family of phosphatidylinositol-3-kinase-related kinases (PIKKs), which are protein kinases (10, 13, 14). mTOR signaling was confirmed to regulate cell growth, proliferation, and differentiation in different kinds of cells. mTOR1 and mTOR2 are two structurally and functionally distinct protein complexes. Raptor is a component of mTORC1 that determines the specificity of mTORC1 (15); mTOR2 contains mTOR, mLST8, and mAVO3 (14). Rapamycin inhibits the regulation and functions of mTOR1, but not mTOR2 (10). MHY1485 is a small-molecular synthesized compound and mTOR activator, based on its morpholinotriazine structure. MHY1485 promotes follicle growth through the activation of both mTORC1 and mTOR2 (16). In addition, MHY1485 inhibits the autophagy process of rat hepatocytes by inhibiting of fusion (17). KU0063794, a well-known inhibitor of mTOR, inhibited both mTOR1 and mTOR2. Moreover, KU0063794 reportedly enhanced the inhibition of the phosphorylation of Akt or downstream molecules of mTOR1, and it then maintained cell cycle arrest at the G0/G1 phase (18). KU0063794 demonstrated a significant synergistic growth inhibition effects in HepG2 cell growth in mice (19). Recent studies suggested that mTOR played important roles in the translation of mRNA into proteins involved in cancer, diabetes, cardiovascular disease, and neurological disorders (20-22), which sense and respond to nutrient availability, energy sufficiency, stress, hormones, and mitogens (23). However, there is few report about the effects of mTOR on TSCs. We assume that mTOR might have an effect on the proliferation and differentiation of TSCs.
Chronical tendinopathy has been verified by abnormal tissue structures and hypercellularity by histological findings (24). Moore reported that mTOR was inactivated by rosemary extract, which inhibited the proliferation of human lung cancer cells (25). However, Gharibi found that blocking mTOR enhanced muscle stem cells ‘(MSC) proliferative capacity and it also induced osteogenic differentiation mediated by the expression of pluripotency (26). In addition, mTOR was reported to be essential for skeletal muscle regeneration by controlling the expression of myogenic genes in satellite cells (27). Collectively, mTOR showed different effects on the proliferation and differentiation of different types of cells. Whether and how mTOR regulates the proliferation and differentiation of TSCs remains to be fully understood. It is essential to delineate the response of TSCs to mTOR to better understand tendon physiology and tendinopathy.
Therefore, this study aimed to determine the response of TSCs to mTOR in vitro. To this end, we examined the expression of mTOR in TSCs and compared the ability of TSCs to proliferate, and differentiate in response to an agonist and depressor of mTOR.


Materials and methods

Ethics statement

The ethics committee at the Southwest Hospital approved all of the experimental protocols applied when using rats for tendon samples and for culturing the TSCs in this study.
Isolation of TSCs The TSCs isolation procedures were carried out as previously described (6, 7). TSCs were isolated from the Achilles tendons of SD rats. In brief, after removing the surrounding tendon sheath and paratenon, the Achilles tendons were minced into fine pieces. Then, 10 mg of an Achilles tendon sample was digested in 1 ml of phosphate buffer saline (PBS) containing 3 mg of collagenase type I and 4 mg of dispase at 37˚C for 3 hours and centrifuged at 3,500 rpm for 15 minutes to obtain cell pellets. Tendon cells in the pellets were re-suspended in Dulbecco’s Modified Eagle Medium (DMEM; Lonza, Walkersville, MD, USA) containing 20% fetal bovine serum (FBS), 100 U/ml of penicillin, and 100 µg /ml of streptomycin (Atlanta Biologicals, Lawrenceville, GA, USA). Next, the cell suspension was cultured in T75 flasks with growth medium (DMEM plus 20% FBS). After 10–16 days in culture, TSCs that formed colonies on the surface of the flask were removed and sub-cultured for up to three passages to obtain sufficient numbers of TSCs for in vitro experiments.

CCK test

TSCs were seeded into 96-well culture plates at a density of 3,000 cells/well in 100 µl of growth medium maintained in 20 % O2 culture conditions. Then, 10 µl of CCK-8 solution was added to each well of the plate, 24 hours after seeding, and they were incubated for an additional 2 hours to measure absorbance at 450 nm using a microplate reader (SpectraMax Plus384 Absorbance Microplate Reader, Molecular Devices, LLC, CA, USA).

Western blotting

Total proteins were extracted by using a cell total protein extraction kit. We then used a BCA protein assay kit for determination of protein concentration. A total of 50μg of protein per sample was resolved on 10% sodium dodecyl sulfate-polyacrylamide gel electrophoresis (SDS-PAGE), and then transferred onto a polyvinylidene fluoride (PVDF) membrane. After being closed with 5% skim milk powder, they were incubated in an anti-dilution (anti-p-S6K antibody, anti-S6K antibody, anti-p-AKT antibody, ant-AKT antibody, anti-TNC antibody, and anti-c-EBPa antibody) overnight at 4℃. A second antibody was incubated at room temperature for 2 hours; finally, the membrane was washed with an ECL developing kit. The Quantity One software (Bio-Rad Laboratories, Hercules, CA, USA) was used to analyze the protein expression level.

Quantitative Real-time PCR (qRT-PCR)

We determined the expression of tenocyte related gene (Collagen type I) and non-tenocyte related genes (collagen type II, PPARg, Runx-2) using qRT-PCR. Total RNA was extracted from TSCs at passage one from TSCs using an RNeasy Mini Kit with an on-column DNase I digest (Qiagen, Inc., Hilgen, Germany) and first-strand cDNA was synthesized following the manufacturer’s instruction. qRT-PCR was carried out using 2 µl cDNA (approximately 100 ng RNA) in a 25 µl PCR reaction volume using QIAGEN QuantiTect SYBR Green PCR Kit (Qiagen) in a Chromo 4 Detector (MJ Research, Inc., Waltham, MA, USA). Glyceraldehyde-3-phosphate dehydrogenase (GAPDH) was used as an internal control. Forward and reverse primers for all genes were designed based on previously published sequences and were synthesized by Thermo Fisher Scientific (Waltham, MA, USA). All reactions had three replicates.

Statistical analysis

The Statistical Package for the Social Sciences for Windows, version 21.0 (SPSS Inc, Chicago, IL, USA) was used for the statistical analyses. All data are presented as mean ± standard deviation (SD). Independent t-tests and analysis of variance (ANOVA) were used for the statistical analysis. Differences between two groups were considered significant when the p-value was ≤ 0.05.


Results

The results of CCK test showed proliferation ability of TSCs decreased in all 3 groups: blocking mTOR1 by rapamycin group, blocking of both mTOR1 and mTOR2 by KU-0062794 group, and activation of mTOR1 and mTOR2 by MHY1485 group.
We tested the effect of mTOR on the proliferation capability of TSCs by performing CCK assays. Blocking of mTOR1 by rapamycin, blocking both mTOR1 and mTOR2 by KU-0062794, and activation of both mTOR1 and mTOR2 by MHY1485 significantly decreased the OD values of TSCs, respectively, compared with the control group. However, the OD value of TSCs in the MHY1485 group was significantly higher when compared with the rapamycin group or the KU-0062794 group. The OD values of TSCs cultured with the negative control group, the rapamycin 5 μM group, the MHY1485 2 μM group, and KU-0062794 0.5 μM group were 1.66 ± 0.15, 0.81 ± 0.39,1.48 ± 0.26, and 1.30 ± 0.11, respectively. Both blocking of mTOR by rapamycin (p<0.001) or KU-0062794 (p<0.001) and the activation of mTOR by the MHY1485 significantly decreased the OD values of TSCs (p=0.018), compared with the negative control. The OD value of TSCs cultured with MHY1485 was significantly higher when compared with those of rapamycin 5μM group (p<0.001) and KU-0062794 0.5 μM group (p=0.018) (Figure 1).
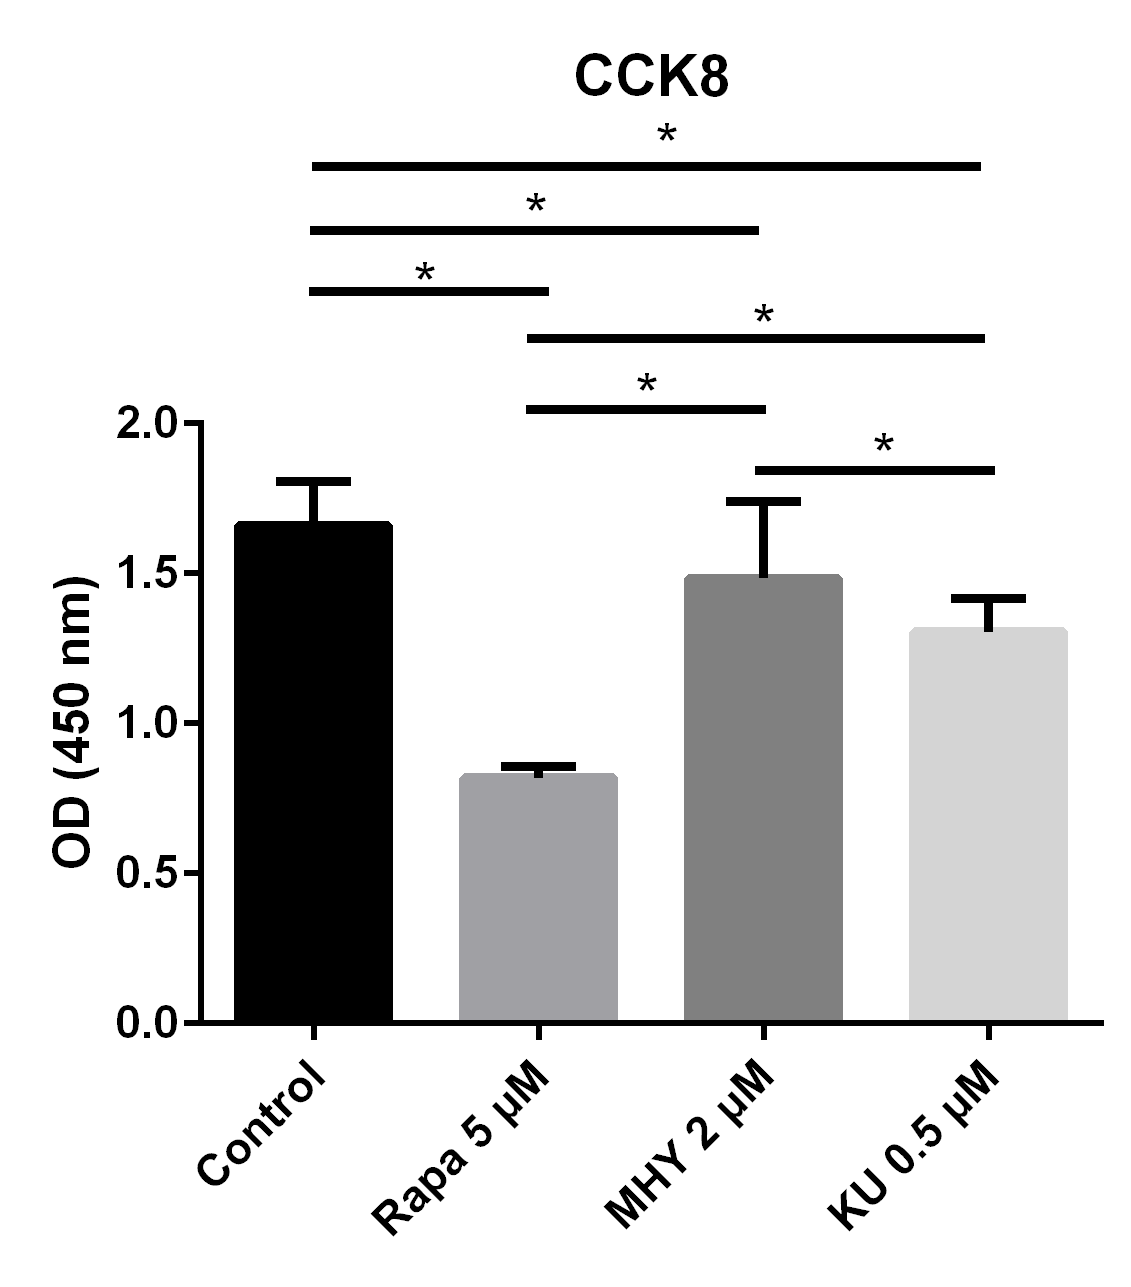
Figure 1 The results of CCK test showed proliferation ability of TSCs decreased in all 3 groups: blocking mTOR1 by rapamycin group, blocking of both mTOR1 and mTOR2 by KU-0062794 group, and activation of mTOR1 and mTOR2 by MHY1485 group

Figure 1
The results of CCK test showed proliferation ability of TSCs decreased in all 3 groups: blocking mTOR1 by rapamycin group, blocking of both mTOR1 and mTOR2 by KU-0062794 group, and activation of mTOR1 and mTOR2 by MHY1485 group

The OD values of TSCs cultured with negative control group, rapamycin 5μM, MHY1485 2 μM and KU-0062794 0.5 μM were 3.37 ± 0.14, 1.60 ± 0.08, 3.16± 0.17, 3.00 ± 0.11, respectively. Both of locking of mTOR by rapamycin (p<0.001 = or KU-0062794 (p<0.001) and activation of mTOR by MHY1485 significantly decreased the OD values of TSCs (p=0.005), compared with negative control. The OD value of TSCs cultured with MHY1485 is significantly higher compared with the one in rapamycin 5 μM group (p<0.001) and KU-0062794 0.5 μM group (p=0.018). Blocking of mTOR1 or the activation of mTOR2 induced the expression of TNC and blocking of mTOR2 inhibited the expression of TNC.


Blocking of mTOR1 inhibited the proliferation of TSCs and blocking of mTOR2 enhanced the proliferation of TSCs; however, the effects of mTOR1 surpassed the effects of mTOR2.
In addition, we further evaluated the effects of mTOR1 andmTOR2 on the proliferation of TSCs; we evaluated the proliferative capability of TSCs in the control, rapamycin 5 μM group, rapamycin 5 μM + MHY1485 2μM group, and KU-0062794 0.5 μM group. The results showed that the OD values of TSCs cultured with negative control group, rapamycin 5 μM group, rapamycin 5 μM + MHY1485 2 μM group, and KU-0062794 0.5 μM group, are 1.57 ± 0.25, 0.83 ± 0.54, 0.80 ± 0.11, and 1.30 ± 0.14, respectively. The OD values of TSCs cultured with rapamycin 5 μM (p<0.001), rapamycin 5 μM + KU-0062794 0.5 μM (p<0.001), and rapamycin 5μM + MHY1485 2 μM (p<0.001), significantly decreased, compared with negative control group. However, The OD values of TSCs cultured with KU-0062794 0.5 μM was higher, as compared with rapamycin 5 μM + MHY1485 2 μM group (p<0.001) (Figure 2).

We performed RT-PCR to examine the effects of mTOR on the differentiation of TSCs. The expression of TNC cultured in rapamycin 5 μM and rapamycin 5 μM + MHY1485 2 μM increased by 56% (p=0.025) and 185% (p<0.001) respectively. Furthermore, the expression of TNC cultured in rapamycin 5 μM + KU-0062794 0.5 μM significantly decreased by 48% (p=0.039) (Figure 3).
Blocking of mTOR1 by rapamycin decreased the expression of ap2; however, activation of mTOR1 and mTOR2 simultaneously by MHY decreased the expression of ap2 too.
Blocking of mTOR1 by rapamycin and activation of mTOR1and mTOR2 by MHY1485 decreased the expression of ap2. The expression of ap2 in TSCs cultured with rapamycin 5 μM group, rapamycin 5 μM + MHY1485 2 μM group, and rapamycin 5 μM KU-0062794 0.5 μM group decreased by 75% (p=0.005), 94% (p=0.002) and 52% (p=0.019) respectively, compared with negative control group. Further, the expression of ap2 in rapamycin 5 μM + KU-0062794 0.5 μM group is significantly higher compare with the one in the rapamycin 5 μM + MHY1485 2 μM group (Figure 4).
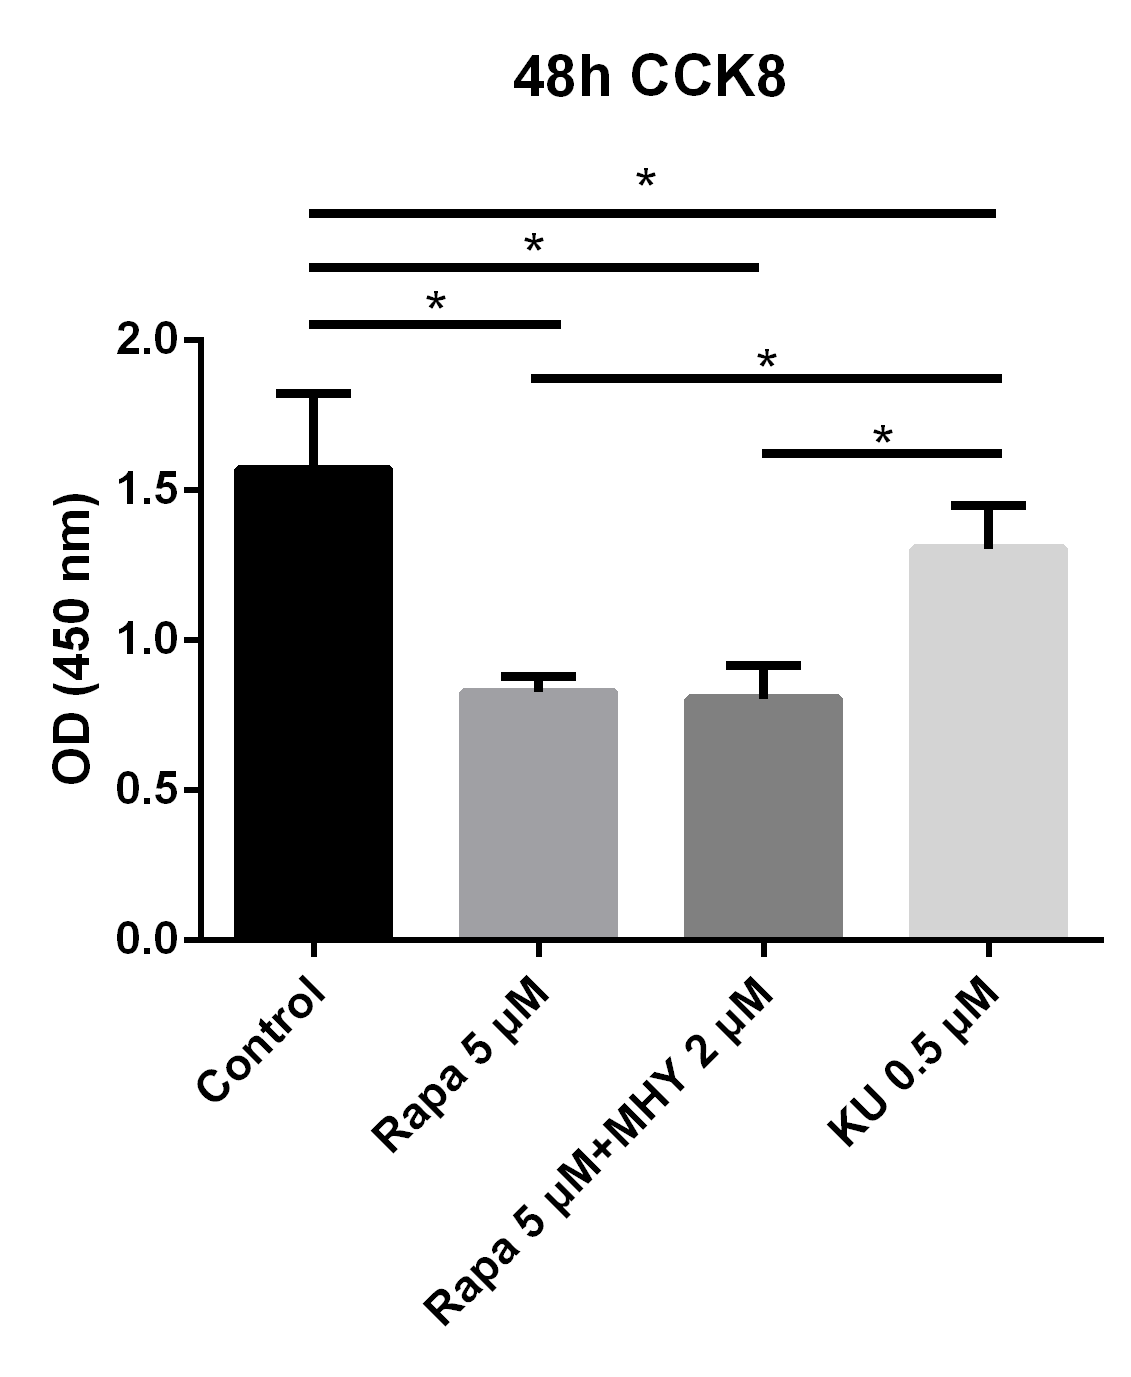
 

Figure 2 Blocking of mTOR1 inhibited the proliferation of TSCs and blocking of mTOR2 enhanced the proliferation of TSCs; however, the effects of mTOR1 surpassed the effects of mTOR2

Figure 2
Blocking of mTOR1 inhibited the proliferation of TSCs and blocking of mTOR2 enhanced the proliferation of TSCs; however, the effects of mTOR1 surpassed the effects of mTOR2

To evaluate the effects of mTOR1 and mTOR2 on TSCs respectively, We performed proliferation capability test of TSCs in control, rapamycin 5 uM, rapamycin 5 uM + KU-0062794 0.5 uM, and rapamycin 5 uM + MHY1485 2 uM. The results showed that the OD values of TSCs cultured with negative control group, rapamycin 5 uM, rapamycin 5uM+ KU-0062794 0.5uM, and rapamycin 5 uM+ MHY1485 2uM are 1.57 ± 0.25, 0.83 ± 0.54, 0.80 ± 0.11, 0.57 ± 0.34 respectively. The OD values of TSCs cultured with rapamycin 5 uM (p<0.001), rapamycin 5uM+ KU-0062794 0.5 uM (p<0.001), and rapamycin 5uM+ MHY1485 2uM (p<0.001), significantly decreased, compared with negative control group. However, The OD values of TSCs cultured with rapamycin 5 uM+ KU-0062794 0.5 uM was higher, compared with rapamycin 5uM+ MHY1485 2uM group (p<0.001).


Both blocking mTOR1 or mTOR2 had little effects on the expression of Runx2; however, activation of mTOR2 induced the expression of Runx2.
Rapamycin or rapamycin combined with KU0062794 did not significantly change the expression of Runx2; however, the expression of Runx2 was increased when simultaneously blocked by rapamycin and activated by MHY1485. The expression of Runx2 in TSCs cultured with rapamycin 5 μM, rapamycin 5 μM+ MHY1485 2 μM, and rapamycin 5 μM + KU-0062794 0.5 μM increased by 49% (p=0.111), 123% (p=0.006) and 45% (p=0.134) respectively, compared with negative control. Also there was significant difference between the rapamycin 5 μM group and rapamycin 5 μM + MHY1485 2 μM (p=0.030); and between the rapamycin 5 μM + MHY1485 2 μM group, and rapamycin 5 μM+ KU-0062794 0.5 μM group (p=0.026) (Figure 5).
Blocking of either mTOR1 or mTOR2 had little effect on the expression of Sox9; however, activation of mTOR2 can induced a lower expression of Sox9, when compared with the one in the rapamycin group.
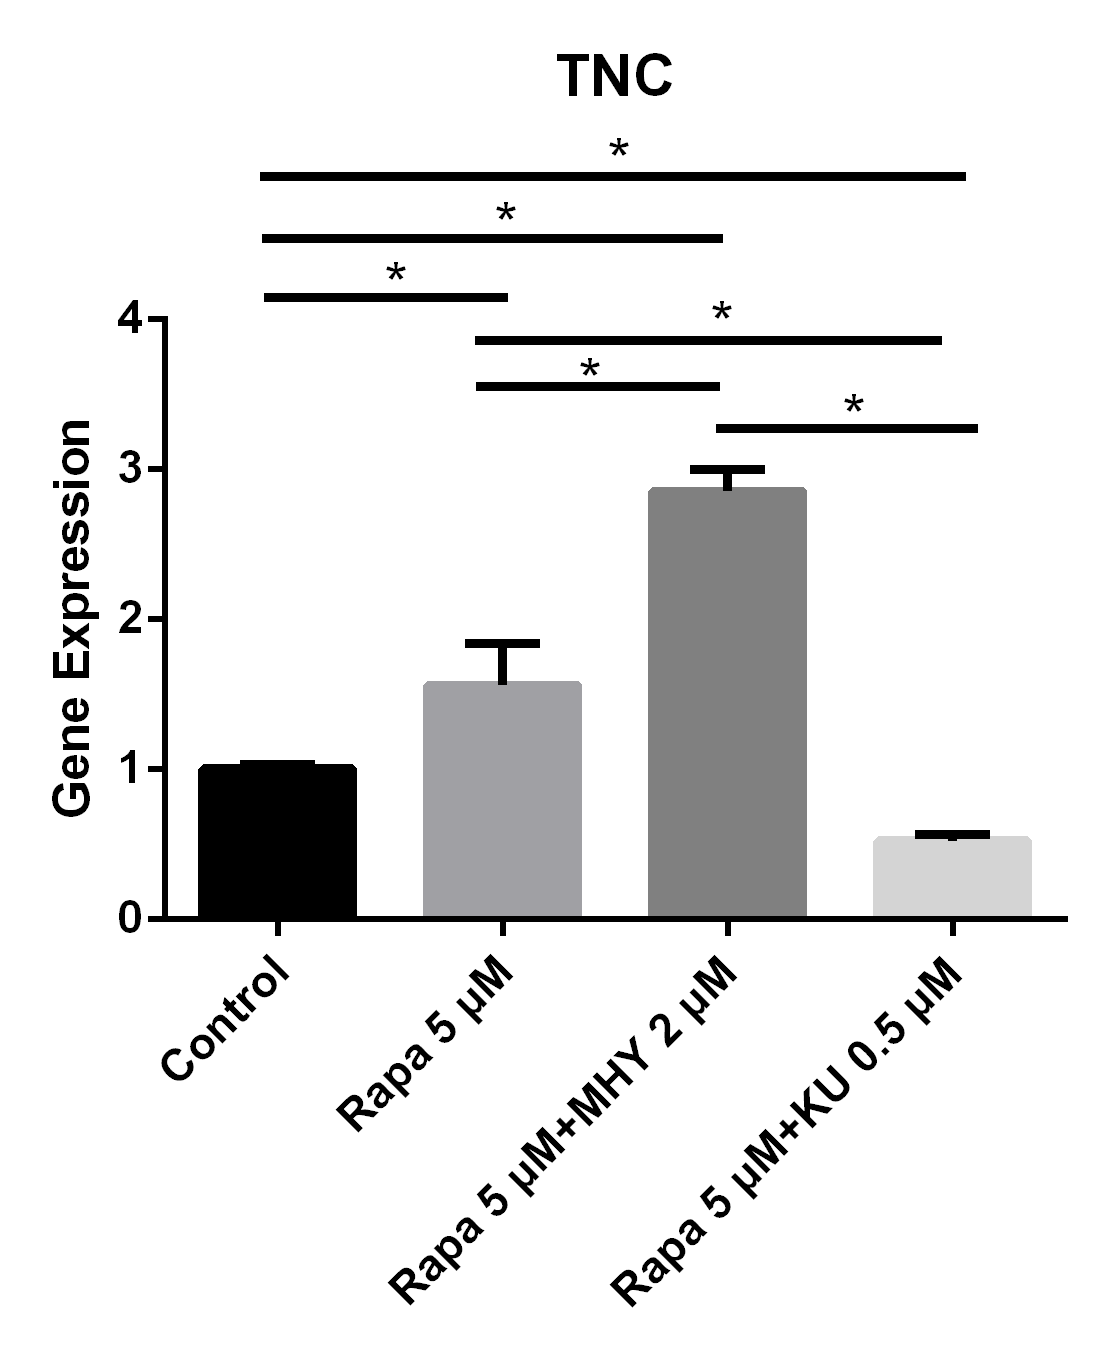
 

Figure 3 Blocking of mTOR1 or the activation of mTOR2 induced the expression of TNC and blocking of mTOR2 inhibited the expression of TNC

Figure 3
Blocking of mTOR1 or the activation of mTOR2 induced the expression of TNC and blocking of mTOR2 inhibited the expression of TNC

The expression of TNC cultured in rapamycin 5uM and rapamycin 5 uM + MHY1485 2 uM increased 56% (p=0.025) and 185% (p<0.001) respectively. And the expression of TNC cultured in rapamycin 5 uM+ KU-0062794 0.5 uM significantly decreased 48% (p=0.039).


Blocking of mTOR by rapamycin or rapamycin combined with KU-0062794 decreased the expression of Sox9; while expression of Sox9 had decreased the most when simultaneously in the rapamycin combined MHY1485 group. The expression of Sox9 in TSCs cultured with rapamycin 5 μM, rapamycin 5 μM + MHY1485 2 μM, and rapamycin 5 μM + KU-0062794 0.5 μM decreased 10% (p=0.43), 33% (p=0.045), 23% (p=0.11) respectively, compared with control group (Figure 6).
We further performed Western blot tests to evaluate the effects of mTOR on the differentiation tendency of TSCs. The results of Western blot showed that rapamycin and KU-0062794 blocked the phosphoration of Raptor and S6k; also, mTOR2 was activated by MHY1485, which was confirmed by the phosphorylation of AKT. Blocking of mTOR1 by Rapamycin or blocking both mTOR1 and mTOR2 by KU-0062794 enhanced the expression of TNC; in addition, blocking of mTOR1 by Rapamycin enhanced the expression of c-EBPα and Sox9. However, activation of mTOR1 and mTOR2 by MHY1485 increased the expression of Runx2.
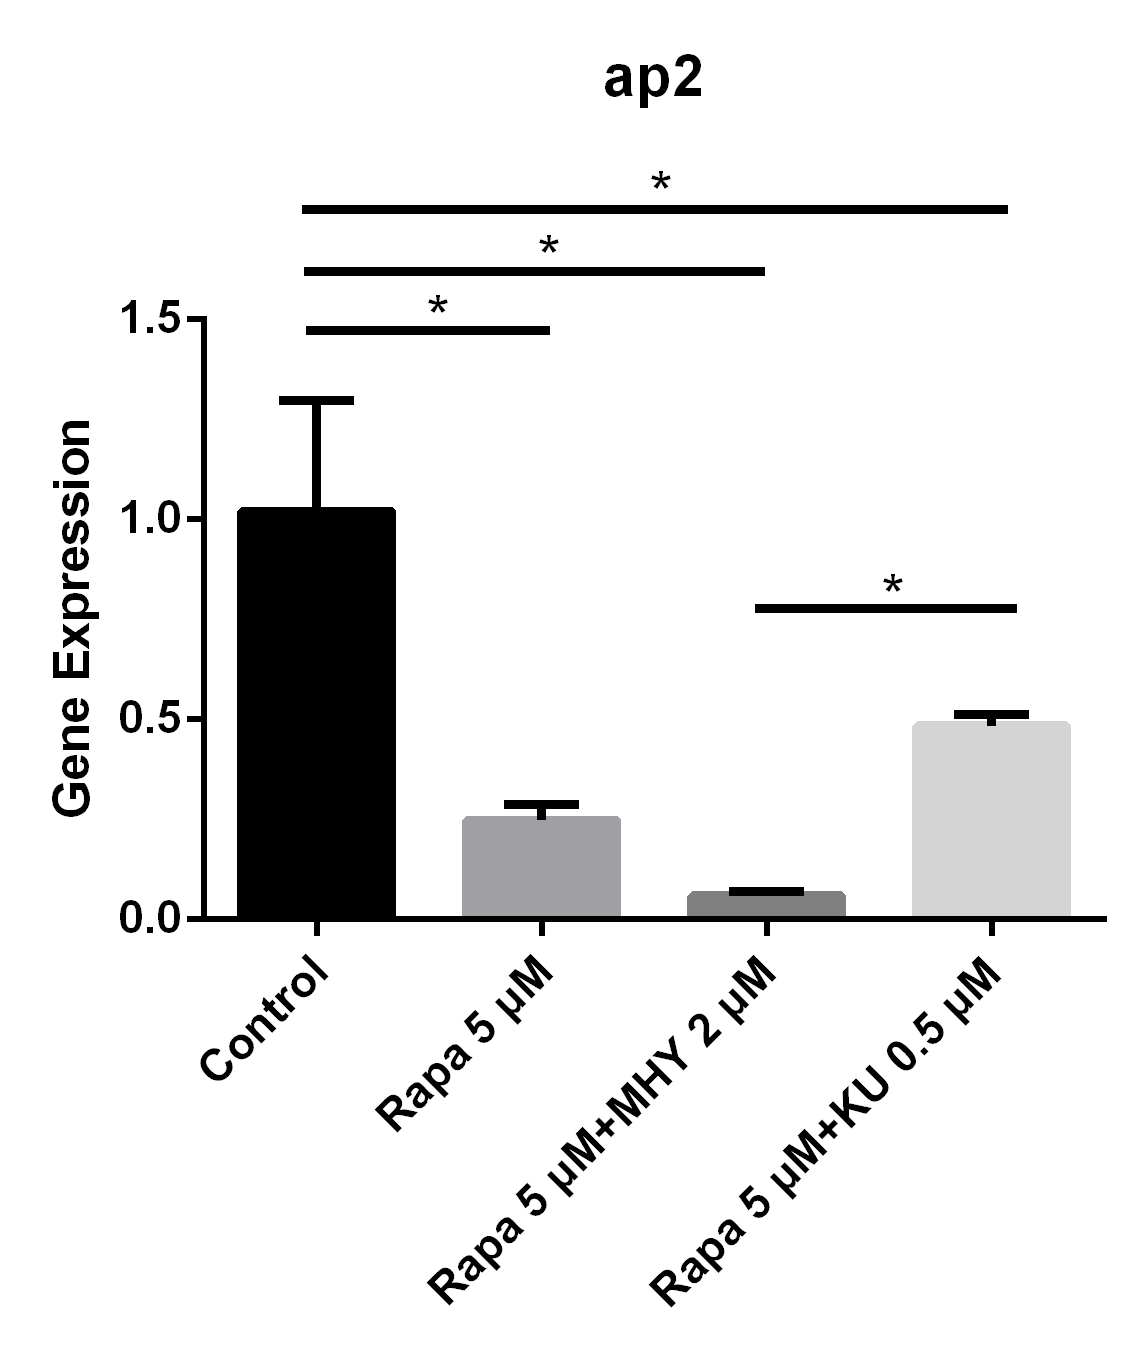
 

Figure 4 Blocking of mTOR1 by rapamycin decreased the expression of ap2; however, activation of mTOR1 and mTOR2 simultaneously by MHY decreased the expression of ap2 too

Figure 4
Blocking of mTOR1 by rapamycin decreased the expression of ap2; however, activation of mTOR1 and mTOR2 simultaneously by MHY decreased the expression of ap2 too

The expression of ap2 in TSCs cultured with rapamycin 5 uM, rapamycin 5 uM+ MHY1485 2 uM, and rapamycin 5 uM+ KU-0062794 0.5 uM decreased 75% (p=0.005), 94% (p=0.002) and 52% (p=0.019) respectively, compared with negative control group. And the expression of ap2 in rapamycin 5 uM+ KU-0062794 0.5 uM group is significantly higher compared with the one in the rapamycin 5 uM+ MHY1485 2 uM group.
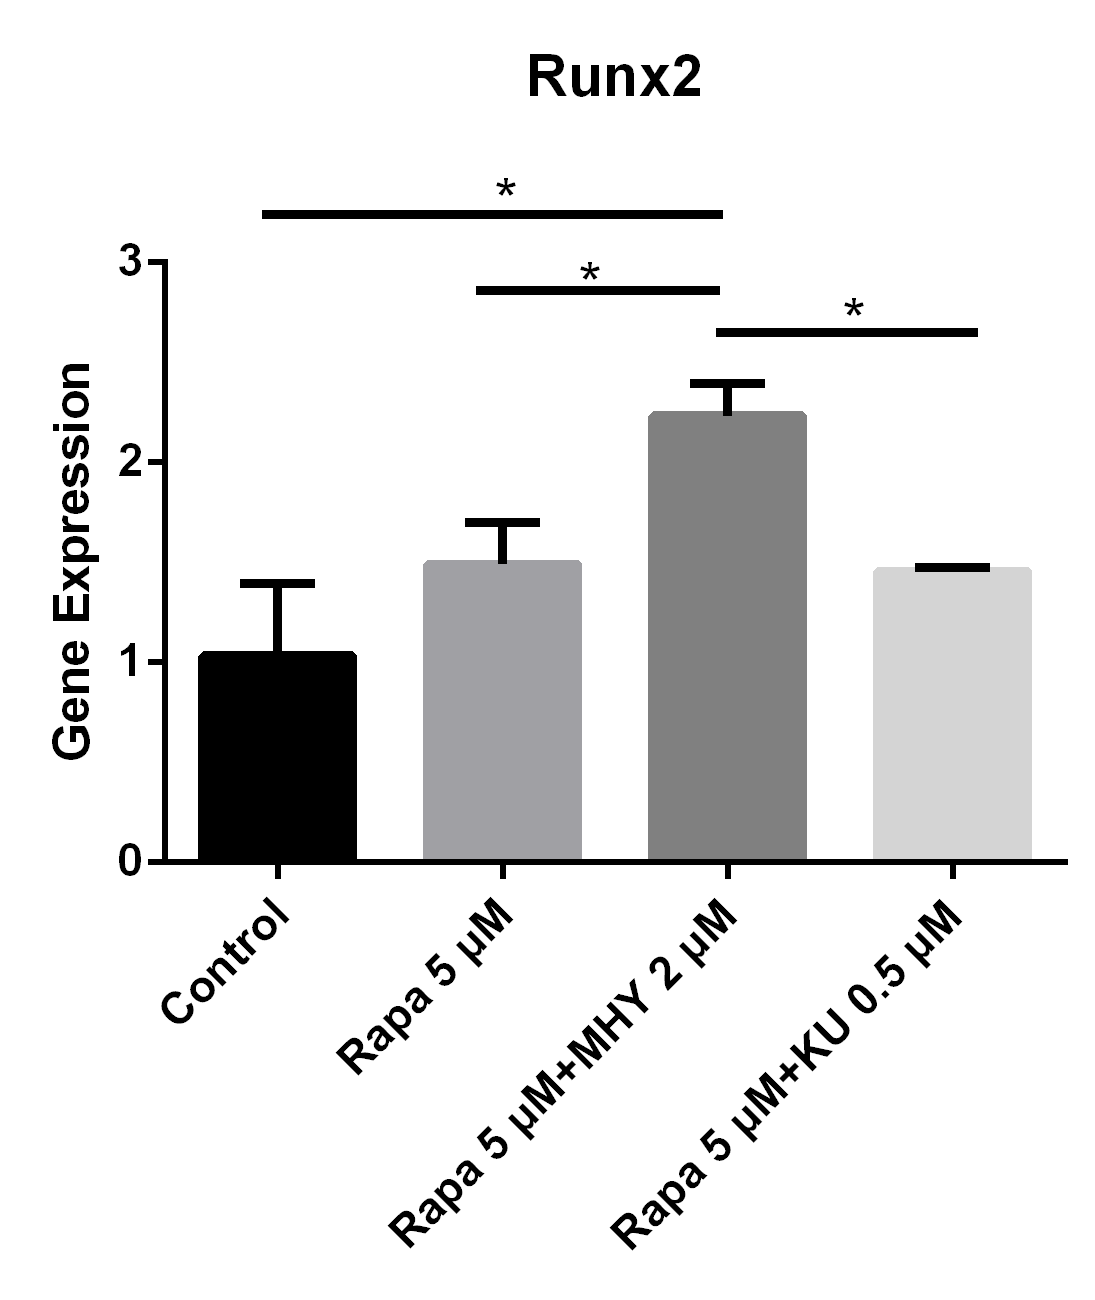
 

Figure 5 Both blocking mTOR1 or mTOR2 had little effects on the expression of Runx2; however, activation of mTOR2 induced the expression of Runx2

Figure 5
Both blocking mTOR1 or mTOR2 had little effects on the expression of Runx2; however, activation of mTOR2 induced the expression of Runx2

The expression of Runx2 in in TSCs cultured with rapamycin 5 uM, rapamycin 5 uM+ MHY1485 2 uM, and rapamycin 5 uM + KU-0062794 0.5 uM increased 49% (p=0.111), 123% (p=0.006) and 45% (p=0.134) respectively, compared with negative control. Also there was significant difference between the rapamycin 5uM group and rapamycin 5 uM+ MHY1485 2uM (p=0.030); or between rapamycin 5 uM+ MHY1485 2 uM and rapamycin 5 uM+ KU-0062794 0.5 uM (p=0,026).
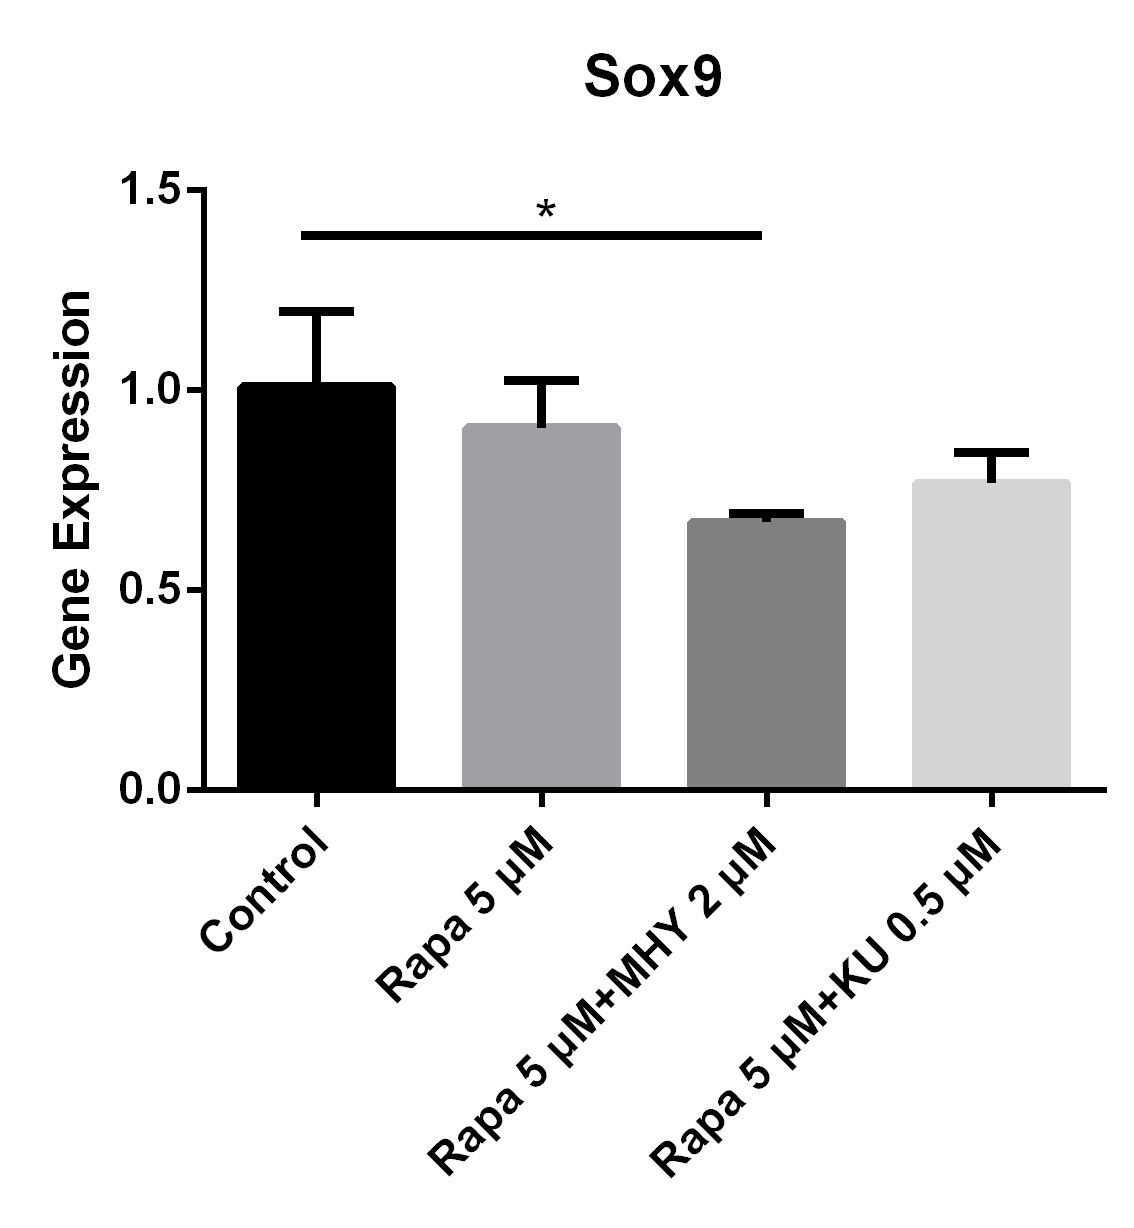
Figure 6 Blocking of either mTOR1 or mTOR2 had little effect on the expression of Sox9; however, activation of mTOR2 can induced a lower expression of Sox9, when compared with the group blocked by rapamycin

Figure 6
Blocking of either mTOR1 or mTOR2 had little effect on the expression of Sox9; however, activation of mTOR2 can induced a lower expression of Sox9, when compared with the group blocked by rapamycin

The expression of Sox9 in TSCs cultured with rapamycin 5 uM, rapamycin 5 uM+ MHY1485 2 uM, and rapamycin 5 uM+ KU-0062794 0.5 uM decreased 10% (p=0.43), 33% (p=0.045), 23% (p=0.11) respectively, compared with control group.
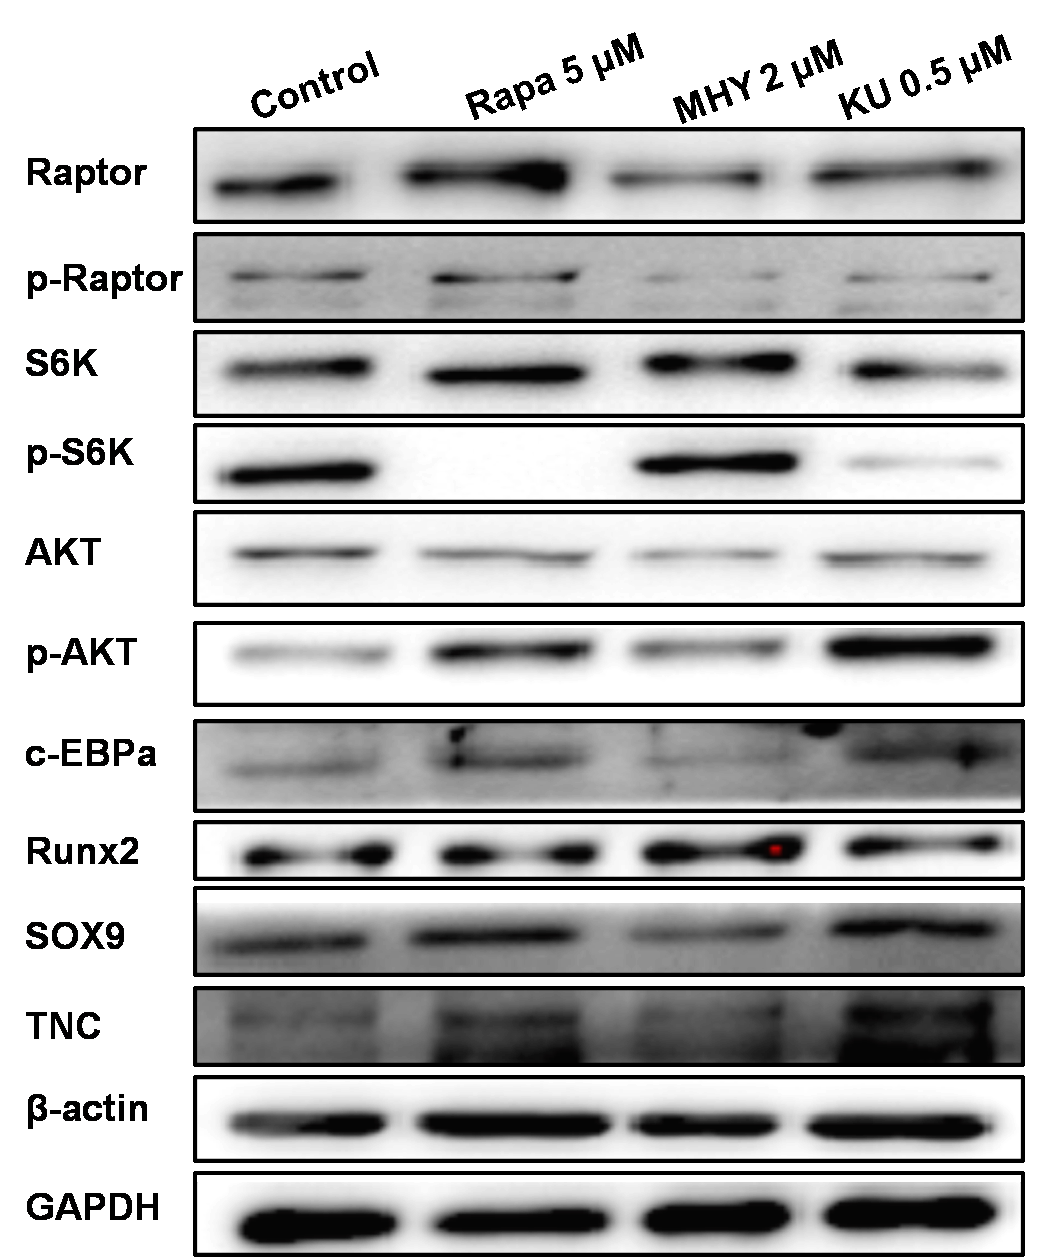
 

Figure 7 Western blot showed that rapamycin and KU-0062794 blocked the phosphoration of Raptor and S6k; also mTOR2 was activated by MHY1485, which confirmed by the phosphoration of AKT. MHY1485 effectively activated the phosphoration of S6k and AKT. Blocking of mTOR1 by Rapamycin or blocking both of mTOR1 and mTOR2 enhanced the expression of TNC; in addition, blocking of mTOR1 enhanced the expression of c-EBPα and Sox9. However, activation of mTOR1 and mTOR2 by MHY1485 increased the expression of Runx2

Figure 7
Western blot showed that rapamycin and KU-0062794 blocked the phosphoration of Raptor and S6k; also mTOR2 was activated by MHY1485, which confirmed by the phosphoration of AKT. MHY1485 effectively activated the phosphoration of S6k and AKT. Blocking of mTOR1 by Rapamycin or blocking both of mTOR1 and mTOR2 enhanced the expression of TNC; in addition, blocking of mTOR1 enhanced the expression of c-EBPα and Sox9. However, activation of mTOR1 and mTOR2 by MHY1485 increased the expression of Runx2


Discussion

mTOR played very important roles in modulating protein synthesis modulation by translational control (23). Numerous studies showed that mTOR regulated the proliferation and differentiation in different cell lines (20, 28, 29); however, few report are available on the effects of mTOR on TSCs. It is essential to define the effects of mTOR on TSCs in order to gain a better understanding of tendon metabolic balance and tendinopathy. In this study, we found that mTOR1 and mTOR2 played different roles on the proliferation and non-tenocyte differentiation of TSCs.
The underlying tissue changes during tendinopathy mainly constitute hypercellularity (1, 30, 31). Cell growth and proliferation are orchestrated by signaling networks in response to environmental cues such as nutrients, growth factors, and hormones. As we know, conserved protein kinases play important roles in the control of cell growth. mTOR was reported to regulate cell proliferation in a wide range of cells, including cancers (20, 28, 29, 32), and vascular endothelial cell (33). mTOR inhibited the proliferation of DU145 cells by activating apoptosis and autophagy (34). Da Silva reported that rapamycin reduced HEPG2 cell proliferation via an increase of free radicals and apoptosis (35). Furthermore, Fernandes-Silva G reported that mTOR inhibitors disrupted autophagy and inhibited cell proliferation (36). In our study, we found that blocking mTOR1 by rapamycin inhibited the proliferation of TSCs. The OD value was significantly higher when both mTOR1 and mTOR2 were blocked, which mean that blocking of mTOR2 promoted the proliferation of TSCs. However, it did not increase the OD value when the mTOR2 was activated by MHY1485; on the contrary, the OD value significantly decreased when mTOR2 was blocked using KU0062794. The results showed that blocking mTOR1 inhibited the proliferation of TSCs, while the blocking of mTOR2 enhanced the proliferation of TSCs; however, mTOR1 was dominate in the proliferation of TSCs.
The mechanism by which rapamycin inhibits mTOR activity in TSCs is still unclear. Rodrik-Outmezguine delineated the resistance mechanisms likely involved in the existing mTOR inhibitors in human cell lines (37). The mTOR pathway can be induced by a variety of mechanisms, including cytokine receptors such as PDGF receptors and by environmental cues (26), phosphoinositide 3 kinase (PI3K)–AKT–mTOR pathway in human cancers (38). Ma found that the PI3K–AKT pathway and the extracellular signal regulated cell growth and proliferation by inhibiting the tumor suppressor complex (23). MHY1485 has an inhibitory effect on the autophagic process by inhibiting the fusion between autophagosomes and lysosomes (17). mTOR2 mediated spatial control of cell growth by polarizing the actin cytoskeleton (39). In brief, the function and mechanism of mTOR in cell proliferation involves cell type specific regulation. An important avenue for future researches is to delineate between upstream signals and downstream effectors that are crucial for dictating mTOR1 activity in different cell types. Taken together, blocking of mTOR inhibited the proliferation of TSCs, and mTOR1 might play more important roles in proliferation. The mechanisms though which mTOR regulates TSC’ proliferation may be dependent on the ratio of phosphoinositide in mTOR1 and mTOR2. Further research is needed to investigate the upstream signals that modulate mTOR activity and the associated downstream components; we also need to confirm the conditions that regulated the ratio of phosphoinositide in mTOR1 and mTOR2.
Non-tenocyte differentiation of TSCs was thought to be an underlying factor in tendinopathy. mTOR regulated differentiation in different eukaryotic cells, including dendritic cells (40), retinal pigment epithelium cells (41), the leukocytes (42), and they are also involved in early neural development (43). Takayama reported that mTOR signaling accelerated aging in muscle-derived stem/progenitor cells isolated from a murine model (44). Moreover, activating the mTOR signaling pathway could induce myogenic differentiation and myotube hypertrophy (45). In our study, we found that blocking of mTOR1 by rapamycin enhanced the expression of TNC; however, blocking of mTOR2 led to the decreased expression of TNC. Moreover, the expression of TNC significantly increased when activated by MHY1485. These results highlighted that mTOR2 positively promoted the differentiation of tenocyte; however, mTOR1 might negatively modulate tenogenesis.
We found when mTOR1 was blocked by rapamycin and when mTOR2 was activated by MHY1485, addipogenesis differentiation was inhibited. In addition, blocking both mTOR1 and mTOR2 decreased the expression of AP2 as well. This meant that mTOR2 played more important roles in the adipogenesis of TSCs. Our results coincided with those of Bezzerri V, reported that adipose-specific disruption of rictor increased body size in a striking defect mouse model (46). The inhibition of mTORC1-mediated PPARγ expression decrease the adiposity in adipocytes (10).
Hu reported that mTOR attenuated osteoplastic differentiation of MC3T3‑E1 cells (47). In addition, mTOR activated by MHY1485 promoted osteoblastic differentiation in T-cell differentiation (48). In this study, the results showed that blocking mTOR1 by rapamycin or both of mTOR1 and mTOR2 by Ku0063794 did not significantly change the expression of Runx2; however, the expression of Runx2 increased when mTOR2 was activated. Collectively, the results indicated that mTOR2 was inclined to lead TSCs’ differentiation into osteogenesis when compared with mTORC1.
Zaseck found that age-associated calcification of Achilles tendons and accompanying elevations in expression of chondrocyte and osteoblast markers were all lower in old eRAPA-fed mice. Their results suggested that long-term administration of rapamycin responsible for aging of tendon extracellular matrix. And Gharibi B found that inhibition of Akt/mTOR attenuates age-related changes in mesenchyme stem cells too (49). As we found in our research, mTOR played important roles in the proliferation and differentiation of TSCs. That is probably the reason that mTOR affects the aging process.
Collectively, mTOR2 and mTOR1 were both positively and negatively implicated in the differentiation of tenocyte, respectively. However, mTOR2 played more important roles in the adipogenesis and osteogenesis of TSCs. In addition, In addition, these effects might be does-dependent. Therefore, the exact mechanism of how mTOR regulates the differentiation of TSCs remains to be further examined.
There are some limitations of this study. Firstly, we did not investigate the probable molecular mechanisms which mTOR regulated the proliferation and differentiation of TSCs. Also, we did not perform the positive regulation of mTOR1 or mTOR2, as we did not use a transfection technique (10, 13). However, this study focused on characterizing the effects of mTOR on TSCs. Thus, this limitation does not undermine our conclusion. Further studies are needed to shed light on the mechanisms and the roles of mTOR1 and mTOR2, respectively.
In summary, this is the first study to delve into the effects of mTOR on TSCs in vitro. The findings reported herein show that mTOR played important roles in the proliferation and differentiation of TSCs. Furthermore, mTOR1 and mTOR2 played different roles on the proliferation and differentiation of TSCs. Blocking mTOR1 inhibited the proliferation of TSCs and played a dominant function. Blocking of mTOR1 enhanced the expression of tenocyte related genes; however, blocking of mTOR2 inhibited the expression of TNC. Blocking of mTOR1 by rapamycin decreased the expression of ap2 and activation of mTOR2 induced the expression of Runx2.


Acknowledgments: This research was supported by grants from the National Natural Science Foundation of China (81572152), and we would like to thank Journal Prep for assistance in the polishing of this manuscript. .

Conflict of interest: We declare no conflicts of interest.


References

1.    Zhou B, Zhou Y, Tang K. An overview of structure, mechanical properties, and treatment for age-related tendinopathy. The journal of nutrition, health & aging. 2014;18(4):441-8.
2.     Lewis J, McCreesh K, Roy J-S, Ginn K. Rotator cuff tendinopathy: navigating the diagnosis-management conundrum. journal of orthopaedic & sports physical therapy. 2015;45(11):923-37.
3.     Cassel M, Baur H, Hirschmüller A, Carlsohn A, Fröhlich K, Mayer F. Prevalence of Achilles and patellar tendinopathy and their association to intratendinous changes in adolescent athletes. Scandinavian journal of medicine & science in sports. 2015;25(3):e310-e8.
4.     Mishra A, Pirolo JM, Gosens T. Treatment of Medial Epicondylar Tendinopathy in Athletes. Sports medicine and arthroscopy review. 2014;22(3):164-8.
5.     Bi Y, Ehirchiou D, Kilts TM, Inkson CA, Embree MC, Sonoyama W, et al. Identification of tendon stem/progenitor cells and the role of the extracellular matrix in their niche. Nature medicine. 2007;13(10):1219-27. Epub 2007/09/11. doi: 10.1038/nm1630. PubMed PMID: 17828274.
6.     Zhou B, Zhou Y, Tang K. The effects of substance P on pluripotent tendon cells: an in vitro and in vivo study. Journal of musculoskeletal & neuronal interactions. 2014;14(3):349-58.
7.     Zhou Y, Zhou B, Tang K. The effects of substance P on tendinopathy are dose-dependent: An in vitro and in vivo model study. The journal of nutrition, health & aging. 2015;19(5):555-61.
8.     Stanco D, Viganò M, ORFEI CP, Di Giancamillo A, Thiebat G, Peretti G, et al. In vitro characterization of stem/progenitor cells from semitendinosus and gracilis tendons as a possible new tool for cell-based therapy for tendon disorders. Joints. 2014;2(4):159.
9.     Alberton P, Dex S, Popov C, Shukunami C, Schieker M, Docheva D. Loss of tenomodulin results in reduced self-renewal and augmented senescence of tendon stem/progenitor cells. Stem cells and development. 2014;24(5):597-609.
10.     Oh WJ, Jacinto E. mTOR complex 2 signaling and functions. Cell Cycle. 2011;10(14):2305-16.
11.     Hay N, Sonenberg N. Upstream and downstream of mTOR. Genes & development. 2004;18(16):1926-45.
12.     Wullschleger S, Loewith R, Hall MN. TOR signaling in growth and metabolism. Cell. 2006;124(3):471-84.
13.     Frias MA, Thoreen CC, Jaffe JD, Schroder W, Sculley T, Carr SA, et al. mSin1 is necessary for Akt/PKB phosphorylation, and its isoforms define three distinct mTORC2s. Current Biology. 2006;16(18):1865-70.
14.     Loewith R, Jacinto E, Wullschleger S, Lorberg A, Crespo JL, Bonenfant D, et al. Two TOR complexes, only one of which is rapamycin sensitive, have distinct roles in cell growth control. Molecular cell. 2002;10(3):457-68.
15.     Kwiatkowski DJ, Manning BD. Tuberous sclerosis: a GAP at the crossroads of multiple signaling pathways. Human molecular genetics. 2005;14(suppl 2):R251-R8.
16.     Cheng Y, Kim J, Li XX, Hsueh AJ. Promotion of ovarian follicle growth following mTOR activation: synergistic effects of AKT stimulators. PloS one. 2015;10(2):e0117769.
17.     Choi YJ, Park YJ, Park JY, Jeong HO, Kim DH, Ha YM, et al. Inhibitory effect of mTOR activator MHY1485 on autophagy: suppression of lysosomal fusion. PloS one. 2012;7(8):e43418.
18.     Ayub A, Yip WK, Seow HF. Dual treatments targeting IGF-1R, PI3K, mTORC or MEK synergize to inhibit cell growth, induce apoptosis, and arrest cell cycle at G1 phase in MDA-MB-231 cell line. Biomedicine & Pharmacotherapy. 2015;75:40-50.
19.     Yongxi T, Haijun H, Jiaping Z, Guoliang S, Hongying P. Autophagy inhibition sensitizes KU-0063794-mediated anti-HepG2 hepatocellular carcinoma cell activity in vitro and in vivo. Biochemical and biophysical research communications. 2015;465(3):494-500.
20.     Hers I, Vincent EE, Tavaré JM. Akt signalling in health and disease. Cellular signalling. 2011;23(10):1515-27.
21.     Jacinto E, Facchinetti V, Liu D, Soto N, Wei S, Jung SY, et al. SIN1/MIP1 maintains rictor-mTOR complex integrity and regulates Akt phosphorylation and substrate specificity. Cell. 2006;127(1):125-37.
22.     Yu JS, Cui W. Proliferation, survival and metabolism: the role of PI3K/AKT/mTOR signalling in pluripotency and cell fate determination. Development (Cambridge, England). 2016;143(17):3050-60. Epub 2016/09/01. doi: 10.1242/dev.137075. PubMed PMID: 27578176.
23.     Ma XM, Blenis J. Molecular mechanisms of mTOR-mediated translational control. Nature reviews Molecular cell biology. 2009;10(5):307-18.
24.     Alfredson H. The chronic painful Achilles and patellar tendon: research on basic biology and treatment. Scandinavian journal of medicine & science in sports. 2005;15(4):252-9.
25.     Moore J, Megaly M, MacNeil AJ, Klentrou P, Tsiani E. Rosemary extract reduces Akt/mTOR/p70S6K activation and inhibits proliferation and survival of A549 human lung cancer cells. Biomedicine & Pharmacotherapy. 2016;83:725-32.
26.     Gharibi B, Farzadi S, Ghuman M, Hughes FJ. Inhibition of Akt/mTOR attenuates age-related changes in mesenchymal stem cells. Stem cells. 2014;32(8):2256-66.
27.     Zhang P, Liang X, Shan T, Jiang Q, Deng C, Zheng R, et al. mTOR is necessary for proper satellite cell activity and skeletal muscle regeneration. Biochemical and biophysical research communications. 2015;463(1):102-8.
28.     Liu Y, Bi T, Wang Z, Wu G, Qian L, Gao Q, et al. Oxymatrine synergistically enhances antitumor activity of oxaliplatin in colon carcinoma through PI3K/AKT/mTOR pathway. Apoptosis : an international journal on programmed cell death. 2016. Epub 2016/09/28. doi: 10.1007/s10495-016-1297-3. PubMed PMID: 27671687.
29.     Wang Y, Sun Y, Wu Y, Zhang J. Cucurbitacin E inhibits osteosarcoma cells proliferation and invasion through attenuation of PI3K/AKT/mTOR signaling. Bioscience reports. 2016. Epub 2016/09/23. doi: 10.1042/bsr20160165. PubMed PMID: 27653525.
30.     Fong G, Backman LJ, Andersson G, Scott A, Danielson P. Human tenocytes are stimulated to proliferate by acetylcholine through an EGFR signalling pathway. Cell and tissue research. 2013;351(3):465-75. Epub 2012/12/06. doi: 10.1007/s00441-012-1530-5. PubMed PMID: 23212463; PubMed Central PMCID: PMCPMC3582816.
31.     Andersson G, Forsgren S, Scott A, Gaida JE, Stjernfeldt JE, Lorentzon R, et al. Tenocyte hypercellularity and vascular proliferation in a rabbit model of tendinopathy: contralateral effects suggest the involvement of central neuronal mechanisms. British journal of sports medicine. 2011;45(5):399-406. Epub 2010/07/08. doi: 10.1136/bjsm.2009.068122. PubMed PMID: 20605910.
32.     Kwon S, Jeon JS, Ahn C, Sung JS, Choi I. Rapamycin regulates the proliferation of Huh7, a hepatocellular carcinoma cell line, by up-regulating p53 expression. Biochemical and biophysical research communications. 2016;479(1):74-9. Epub 2016/09/13. doi: 10.1016/j.bbrc.2016.09.035. PubMed PMID: 27616194.
33.     Wang S, Lu J, You Q, Huang H, Chen Y, Liu K. The mTOR/AP-1/VEGF signaling pathway regulates vascular endothelial cell growth. Oncotarget. 2016. Epub 2016/07/28. doi: 10.18632/oncotarget.10756. PubMed PMID: 27458160.
34.     Nie C, Zhou J, Qin X, Shi X, Zeng Q, Liu J, et al. Diosgenininduced autophagy and apoptosis in a human prostate cancer cell line. Molecular medicine reports. 2016. Epub 2016/09/27. doi: 10.3892/mmr.2016.5750. PubMed PMID: 27667394.
35.     da Silva EF, Krause GC, Lima KG, Haute GV, Pedrazza L, Mesquita FC,     et al. Rapamycin and fructose-1,6-bisphosphate reduce the HEPG2 cell proliferation via increase of free radicals and apoptosis. Oncology reports. 2016. Epub 2016/09/27. doi: 10.3892/or.2016.5111. PubMed PMID: 27665945.
36.     Fernandes-Silva G, Ivani de Paula M, Rangel EB. mTOR inhibitors in pancreas transplant: adverse effects and drug-drug interactions. Expert opinion on drug metabolism & toxicology. 2016:1-19. Epub 2016/09/24. doi: 10.1080/17425255.2017.1239708. PubMed PMID: 27659512.
37.     Rodrik-Outmezguine VS, Okaniwa M, Yao Z, Novotny CJ, McWhirter C, Banaji A, et al. Overcoming mTOR resistance mutations with a new-generation mTOR inhibitor. Nature. 2016;534(7606):272-6.
38.     Vivanco I, Sawyers CL. The phosphatidylinositol 3-kinase–AKT pathway in human cancer. Nature Reviews Cancer. 2002;2(7):489-501.
39.     Jacinto E, Loewith R, Schmidt A, Lin S, Rüegg MA, Hall A, et al. Mammalian TOR complex 2 controls the actin cytoskeleton and is rapamycin insensitive. Nature cell biology. 2004;6(11):1122-8.
40.     Sukhbaatar N, Hengstschlager M, Weichhart T. mTOR-Mediated Regulation of Dendritic Cell Differentiation and Function. Trends in immunology. 2016. Epub 2016/09/12. doi: 10.1016/j.it.2016.08.009. PubMed PMID: 27614799.
41.     Jiang C, Qin B, Liu G, Sun X, Shi H, Ding S, et al. MicroRNA-184 promotes differentiation of the retinal pigment epithelium by targeting the AKT2/mTOR signaling pathway. Oncotarget. 2016. Epub 2016/07/16. doi: 10.18632/oncotarget.10566. PubMed PMID: 27418134.
42.     Bezzerri V, Vella A, Calcaterra E, Finotti A, Gasparello J, Gambari R, et al. New insights into the Shwachman-Diamond Syndrome-related haematological disorder: hyper-activation of mTOR and STAT3 in leukocytes. Scientific reports. 2016;6:33165. Epub 2016/09/24. doi: 10.1038/srep33165. PubMed PMID: 27658964; PubMed Central PMCID: PMCPMC5034238.
43.     Garza-Lombo C, Gonsebatt ME. Mammalian Target of Rapamycin: Its Role in Early Neural Development and in Adult and Aged Brain Function. Frontiers in cellular neuroscience. 2016;10:157. Epub 2016/07/06. doi: 10.3389/fncel.2016.00157. PubMed PMID: 27378854; PubMed Central PMCID: PMCPMC4910040.
44.     Takayama K, Kawakami Y, Lavasani M, Mu X, Cummins JH, Yurube T, et al. mTOR signaling plays a critical role in the defects observed in muscle-derived stem/progenitor cells isolated from a murine model of accelerated aging. Journal of orthopaedic research : official publication of the Orthopaedic Research Society. 2016. Epub 2016/08/31. doi: 10.1002/jor.23409. PubMed PMID: 27572850.
45.     Kitakaze T, Sakamoto T, Kitano T, Inoue N, Sugihara F, Harada N, et al. The collagen derived dipeptide hydroxyprolyl-glycine promotes C2C12 myoblast differentiation and myotube hypertrophy. Biochemical and biophysical research communications. 2016;478(3):1292-7. Epub 2016/08/25. doi: 10.1016/j.bbrc.2016.08.114. PubMed PMID: 27553280.
46.     Cybulski N, Polak P, Auwerx J, Rüegg MA, Hall MN. mTOR complex 2 in adipose tissue negatively controls whole-body growth. Proceedings of the National Academy of Sciences. 2009;106(24):9902-7.
47.     Hu XK, Yin XH, Zhang HQ, Guo CF, Tang MX. Liraglutide attenuates the osteoblastic differentiation of MC3T3E1 cells by modulating AMPK/mTOR signaling. Molecular medicine reports. 2016;14(4):3662-8. Epub 2016/09/08. doi: 10.3892/mmr.2016.5729. PubMed PMID: 27600753.
48.     Pai C, Walsh CM, Fruman DA. Context-Specific Function of S6K2 in Th Cell Differentiation. Journal of immunology (Baltimore, Md : 1950). 2016. Epub 2016/09/11. doi: 10.4049/jimmunol.1600167. PubMed PMID: 27613697.
49.     Gharibi B, Farzadi S, Ghuman M, Hughes FJ. Inhibition of Akt/mTOR attenuates age-related changes in mesenchymal stem cells. Stem Cells. 2014;32(8):2256-66. Epub 2014/03/25. doi: 10.1002/stem.1709. PubMed PMID: 24659476.

STIMULATORY EFFECT OF ACUTE SINGLE DOSE OF DRIED WHOLE COFFEE CHERRY POWDER ON NRF2 ACTIVITY IN FRESHLY ISOLATED BLOOD CELLS. A SINGLE-BLIND, PLACEBO CONTROLLED CROSS-OVER PILOT CLINICAL STUDY


T. Reyes-Izquierdo1, B. Nemzer2, R. Argumedo1, M. Cervantes1, Z. Pietrzkowski1


1. Futureceuticals Inc.; 16259 Laguna Canyon Rd, Ste 150, Irvine, CA USA 92618; 2. Futureceuticals Inc.; 2692 N. State Rt. 1-17., Momence, IL, USA 60954

Corresponding Author: Tania Reyes-Izquierdo, 16259 Laguna Canyon Rd Ste 150, Irvine, CA, 92618 USA, Phone +1 949 502 4496, Fax +1 949 502 4987, Email: treyes@futureceuticals.com

J Aging Res Clin Practice 2016;5(3):120-127
Published online August 11, 2016, http://dx.doi.org/10.14283/jarcp.2016.109


Abstract

Background: NF-E2-related factor 2 (Nrf2) is a transcription factor that participates in the regulation of antioxidant expression during increased oxidant stress. Several phytochemicals and food products have shown to trigger Nrf2 activity. In this pilot placebo-controlled study the effects of a single dose of dried whole coffee cherry powder (“WCCP”) on Nrf2 levels were tested. Objectives: To characterize a blend of WCCP and evaluate the potential effects on mTOR and Nrf2 in healthy subjects. Design: In this cross over study, subjects were given placebo or a single dose of 1000mg WCCP on day 1 and 2. Blood was collected for four time points. Participants served as their own controls. Setting: After supplementation, blood samples were processed for mTOR and Nrf2 analysis. Blood ATP, glucose and lactate were also measured. Participants: Ten healthy subjects, ages ranging from 22 to 35 years and BMI ranging from 24.1 to 30 kg/m² were selected to participate. Results: One 1000 mg dose of WCCP resulted in an average 44% increase of NRf2 levels 180 minutes after ingestion (p=0.03 ). Phosphorylated mTOR (Ser 2448) was reduced at 180 minutes after supplement; when compared to placebo. Correlation (“Corr”) analyses revealed that increases in Nrf2 appear to be associated with mTOR reduction. Blood glucose and extracellular ATP levels were not changed. Conclusions: WCCP increased Nrf2 3 hours after ingestion. Additional testing is required to verify the potency of WCCP on Nrf2, as well as any potential correlation between mTOR (S2448) reduction and increased levels of Nrf2 after supplementation.

Key words: Nrf2 activation, mTOR, dried whole coffee cherry powder, antioxidants.


Introduction

Nuclear factor NF-E2-related factor 2 (Nrf2) is a key transcription factor in the regulation of antioxidant expression during increased oxidant stress (1, 2). This key cell-defense gene regulates the expression of cyto-protective proteins that detoxify harmful cellular compounds, neutralizes reactive oxygen species, directly or indirectly modulates the inflammatory response and immune system, and assists in the repair or removal of damaged macromolecules (2-5). Increased Nrf2 expression has previously been associated with improvements in neurodegenerative, autoimmune, diabetic and renal disease in animal and in vitro models (6).
Activation of Nrf2 and phosphoinositide 3-kinase (PI3K), serine-threonine kinase (AKT), and the mammalian target of rapamycin (mTOR) signaling pathways, (also known as PI3K)/AKT/mTOR signaling pathways, respectively), have been observed in certain human cancers and it has been postulated that said activations may be central to tumor development and progression (7). Increased expression of Nrf2 and decreased expression of mTOR has been associated with diminished frequency of tumor development and with smaller tumors in animal models (7). More interestingly, inhibition of PI3K)/AKT/mTOR has been associated with extended life spans in insects, invertebrates, and mammals (8-10). Collectively, these pathways present an attractive target for human longevity investigations.
Polyphenols have been suggested as potential therapeutic compounds that may have a positive effect on several pathological conditions such as neurodegenerative diseases, diabetes, certain cancers and cardiovascular diseases (11, 12). Dietary polyphenols have been reported to induce the expression of enzymes involved in cellular antioxidant defenses (13).
Several phytochemicals and food-derived products have similarly been shown to trigger Nrf2 activity (2, 14). Green coffee beans have been reported to contain large amounts of polyphenolic antioxidants, such as chlorogenic, caffeic, ferulic, and n-coumarinic acids (15).
Here we have evaluated the potential effects of the novel antioxidant activities inherent in dried whole cherries from the coffee plant on mTOR and Nrf2 expression in healthy humans as a preliminary study on potential for coffee cherry to support human health.


Materials and Methods

Materials

5-O-caffeoylquinic acid, (-)-epicatechin, procyanidin dimer B2, quercetin-3-glucoside and rutin were obtained from AASC Ltd (Southampton, UK). Methanol and acetonitrile were obtained from Rathburn Chemicals (Walkburn, Scotland). Formic acid was obtained from Fisher Scientific (Loughborough, UK). Dried, ground whole coffee cherry powder samples, commercially marketed as ”CoffeeBerry® Brand whole coffee fruit” was obtained from FutureCeuticals, Inc. (Momence, IL USA). Primary caffeine standard was obtained from USP (Rockville, MD). Perchloric acid (HPLC grade) and acetonitrile (HPLC grade) were purchased from Sigma-Aldrich Corp. (St. Louis, MO, USA). Primary Sorbent Amine (PSA) was obtained from Supelco Inc. (Bellefonte, PA, USA).
Dulbecco’s phosphate buffered saline (PBS) and water were purchased from Sigma-Aldrich Corp. Co. (St Louis, MO, USA). Low protein binding microtubes were obtained from Eppendorf (Hauppauge, NY, USA) and RC DC Protein Assay Kit II was from Bio-Rad (Hercules, CA, USA). ATP-luciferase assays were obtained from EMD Millipore (Billerica, MA, USA). Heparin capillary blood collection tubes were obtained from Safe-T-Fill® (Ram Scientific Inc. Yonkers, NY). Accutrend® Lactate Point of Care and BM-Lactate Strips® were from Roche (Mannheim, Germany). Accu-Chek® Compact Plus glucometer and Accu-Chek® test strips were from Roche Diagnostics (Indianapolis, IN, USA). TransAM® Nrf2 detection assay was from Active Motif (Carlsbad, CA, USA). Phospho m-TOR (Ser 2448), phospho m-TOR (Ser 2481) and total m-TOR were from Cell Signaling Technologies (Danvers, MA, USA).

Chemistry Analyses

Chlorogenic acids, procyanidins, flavanols and flavonols of WCCP were characterized by LC-MS (n) and quantified by UV absorbance (16, 17). Analysis was carried out on a Thermo Acella HPLC system comprising of an auto-sampler with sampler cooler maintained at 6ºC, an Accela photodiode array (PDA) detector (Thermo Fisher Scientific, San Jose, CA, USA) scanning from 200-600 nm. Samples (5 or 10μl) were injected onto a 150 x 3.0mm C18 Accucore (Thermo Fisher Scientific, Waltham, MA, USA) maintained at 40ºC and eluted with a 5-10-50% gradient of 1.0% formic acid and acetonitrile at 700 μL/min over 0-10-20 minutes. After passing through the absorbance detector, the eluant was split, and 200 uL/min was directed to the electrospray interface of an ExactiveTM Orbitrap mass spectrometer (Thermo Fisher Scientific, Waltham, MA USA). Samples were run in negative ionization mode, and the scan range was from 150 to 1200 amu with resolution set to 60,000.Peak identifications were based on co-chromatography with authentic standards, when available, as well as absorbance spectra and published MS2 mass spectra data.
Quantification of hydroxycinnamic compounds was obtained by comparison to an authentic standard of 5-O-caffeoylquinic acid, range 5 to 750 ng at 325 nm, and caffeine at 275 nm in the range 5 to 750 ng. Quantification of minor phenolic compounds was by exact mass measurements of calibration standards over the range of 0.5 to 50 ng using (-)-epicatechin for flavan-3-ol monomers and procyanidin B2 for dimer and trimer flavan-3-ols. Quercetin-3-glucoside and quercetin-3-rutinoside were quantified as quercetin-3-glucoside equivalents.
The caffeine and trigonelline contents were characterized by HPLC (Agilent 1100; Agilent Technologies, Palo Alto, CA, USA) equipped with diode array detector and quantified by UV absorbance (17, 18). For caffeine testing about 10 mg aliquot of caffeine primary standard was accurately weighed into a 50 mL volumetric flask. The volume was made up to 25 mL with mobile phase (90% of 0.1% perchloric acid and 10% acetonitrile) and sonicated for 5 min. The final volume was made to the mark with mobile phase. For the sample analysis, about 500 mg was weighed into 100 mL volumetric flask. Mobile phase was added up to 50 mL and sonicated for 5 min. The supernatant was then diluted to mark with mobile phase. About 1 g of PSA was weighed into a centrifuge tube. The prepared sample (5 mL) was dispensed into the tube containing PSA, vortexed for 3 min and filtered through a 0.45 µm PTFE syringe filter. Analysis was carried out by HPLC (Agilent 1100) with the diode array detector set at 275 nm. Samples (5 or 10μl) were injected onto a 150 x 3.0 mm, 2.7 μm Supelco Ascentis Express Phenyl-Hexyl Column (Supelco Inc., Bellefonte, PA, USA) maintained at 25°C and eluted with a 90-10% isocratic of 0.1% perchloric acid and in acetonitrile at 800 μL/min over 15 minutes. Quantification was by comparison to an authentic primary standard of caffeine.
Trigonelline analysis was performed on HPLC system (Agilent 1100) equipped with PDA detector, gradient pump unit, Kinetex 2.6 µm Biphenyl 100Å LC column 150 x 4.6 mm (Phenomenex, Torrance, CA, USA). Samples were eluted using mobile phase of ammonium formate: acetonitrile adjusted to pH 3.0 with formic acid and delivered at a flow rate of 1.0 mL/min. Detector was carried out at 265 nm. The injection volume was 10 µL. Data acquisition and analysis were carried out using Agilent ChemStation Software, version B.04.01, chromatography analysis software. Trigonelline primary standard (Sigma-Aldrich, St. Louis, MO USA) was used for quantitative analysis.

Clinical Study

Inclusion and Exclusion Criteria

This clinical case study was conducted according to guidelines laid out in the Declaration of Helsinki. All procedures involving human subjects were approved by the Ethics Committee named Comité de Investigación Biomédica para el Desarrollo de Fármacos S.A. de C.V. (Zapopan, Jal, México) (study protocol No. FC-2015-N287). Ten subjects were selected to participate. They were generally healthy with ages ranging from 22 to 35 years and BMI ranging from 24.1 to 30 kg/m². Exclusion criteria included acute infections, rhinitis, influenza, diagnosis of diabetes mellitus, dietary allergies. Subjects using anti-inflammatory drugs, analgesics, statins, diabetic drugs, anti-allergy medicines, multivitamins and dietary supplements were also excluded. All participants gave written, informed consent before any experimental procedure was performed.

Blood Collection and sample preparation

Study was performed by NutraClinical Inc. (Irvine, CA, USA) according to the study protocol designed by VDF FutureCeuticals, Inc. (Irvine, CA, USA). Ten subjects were included in this pilot study. Participants (6 females and 4 males) were >19 and <35 years of age, with a BMI of 29.94 (SD ± 6.51). Enrolled participants were instructed to fast for 12 h prior to the initial blood draw. Resting subjects were given a dosage of either two empty capsules as placebo or two 500 mg of encapsulated WCCP (for a total 1000mg single dose) on day 1. All dosages were switched on day 2 relative to each subject. Subjects were given a two-day “wash-out” period prior to switching supplementations.  350 mL of water was administered with the capsules on each day. Blood was collected by finger puncture and placed in lithium heparin Safe-T-Fill® capillary blood collection tubes (Ram Scientific Inc. Yonkers, NY, USA). The first tube, containing 50 µL of blood, was frozen immediately for ATP assays. The second tube, containing 600 µL blood was used for m-TOR and nuclear extraction from peripheral blood cells. One last tube was collected to obtain plasma. Blood samples were drawn at baseline (time zero), 60 min (T60), 120 min (T120) and 180 min (T180) after supplementation.

Cell Lysate preparation for mTOR detection

mTOR cell lysates were prepared from whole blood. One hundred µL of whole blood were added to 900µL of 1X cell lysis buffer containing 1 mM PMSF into a 2.0 mL LoBind microtube (Eppendorf®, purchased from Fisher Scientific, Inc. Pittsburgh, PA, USA). Samples were then placed in a small ice bath and sonicated for 5 minutes. After sonication, cell lysates were centrifuged at 14,000 x g for 10 minutes at 40C. The cell lysate supernatant (CLS) for each sample was collected and transferred into a clean, labeled 2.0 mL microtube and placed on ice.

mTOR Protocol

In order to determine the optical density of mTOR in each CLS sample, p-mTOR Ser 2481, p mTOR Ser 2448, and total mTOR kits from Cell Signaling Technology® (Danvers, MA, USA) were run simultaneously. One hundred µL of CLS sample was added to each assay plate. The assay protocol for each mTOR kit was followed according to the manufacturer’s instructions. Total mTOR absorbance was used as reference in the analysis in order to determine the specific activity of p-mTOR (Ser 2448) and p-mTOR (Ser 2481).

Protein quantification

The protein concentration of each CLS sample was determined by the Bio-Rad DC™ Protein Assay (Hercules, CA, USA), using bovine serum albumin (BSA) (Fisher Scientific, Grand Island, NY, USA) as a standard. In order to determine the absorbance over milligram per protein of mTOR in each CLS sample, the absorbance from each mTOR assay absorbance was divided by the protein concentration.

ATP Detection and Quantification

Blood ATP concentration was determined using an ATP Assay Kit (EMD Millipore, Billerica, MS, USA) with a modification to the original method, as previously described (19). Briefly, 10 μL of lysed blood were loaded onto a white plate (Corning® Fisher Scientific, Waltham, MA, USA). One hundred µL of ATP nucleotide-releasing buffer containing 1 µL luciferase enzyme mix was added in each well and the plate was immediately placed on a luminometer (LMaX, Molecular Devices; Sunnyvale, CA, USA). Readings were performed during 15 min at 3 min intervals at 470 nm. Relative Light Units (RLU) was recorded and ATP concentrations were determined using a standard ATP curve.

Lactate and Glucose Detection

Glucose and lactate levels were measured at collection time points 0, 60, 120, and 180 minutes. Glucose was measured using an AccuChek® Compact Plus glucometer (Roche Diagnostics, Indianapolis, IN, USA). Two μl of fresh finger blood were loaded onto an AccuChek® Testing Strip (Roche Diagnostics, Indianapolis, IN, USA) and read from the glucometer according to manual instructions. Blood lactate was measured using an Accutrend® Lactate Analyzer (Roche, Mannheim, Germany). Sixteen μl of fresh finger blood were loaded onto a BM Lactate Test Strip and read from the Lactate Analyzer according to manufacturer’s instructions.

White blood cell isolation

Five hundred µL of whole blood collected from finger puncture as previously described were added to a 15mL falcon tube containing 10 mL 1X Red Blood Cell Lysis buffer at room temperature (RT) (22°C). After 15 min incubation, samples were centrifuged at 1200g for 10 min. The supernatant was discarded and 10 mL ice cold Dulbecco’s PBS (Sigma Chem. Corp.; St. Louis, MO, USA) was added followed by centrifugation as mentioned before. Supernatant was discarded and cells were snap frozen (-80°C) until use.

Nuclear extracts

White blood cell (WBC) samples were thawed on an ice bath and 300 µL 1X cell lysis buffer (Cell Signaling Technologies; Danvers, MA, USA) containing 1 mM dithiothreitol (DTT) and 10 µL/mL protease inhibitor cocktail (Active Motif; Carlsbad, CA, USA). Samples were vortexed and incubated on an ice bath for 30 min. Samples were subsequently centrifuged at 14,000g for 30 min and the supernatant was recovered. Protein concentration was determined as previously described.

Nrf2 Detection

Nrf2 was determined using Trans AM® Nrf2 ELISA kits. Nuclear extract samples were loaded at 30 µg protein/well. A positive control provided was used as reference. The protocol was followed as indicated by the manufacturer’s instructions.

Statistical Analysis

Total mTOR, 2448-mTOR and 2481-mTOR levels were normalized using time zero as the baseline, as well as the analyses for Nrf2. Statistical analysis was performed using the commercially available GraphPad® statistical software (Graphpad Software Inc., La Jolla, CA, USA). Descriptive statistics are presented by the mean ± standard error. Supplementations were compared at 60, 120 and 180 minutes (placebo vs WCCP) within the experimental groups with baseline and between experimental groups using a one-way analysis of variance with Tukey’s post hoc analysis when a significant F-ratio was observed. Statistical significance was set at P: 0.05.


Results

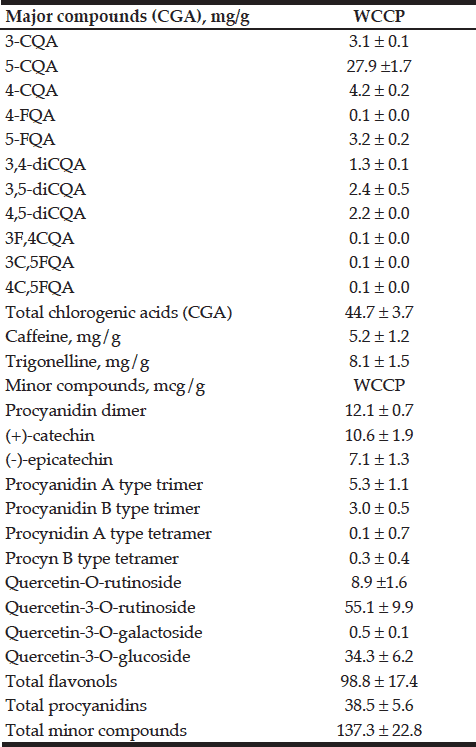
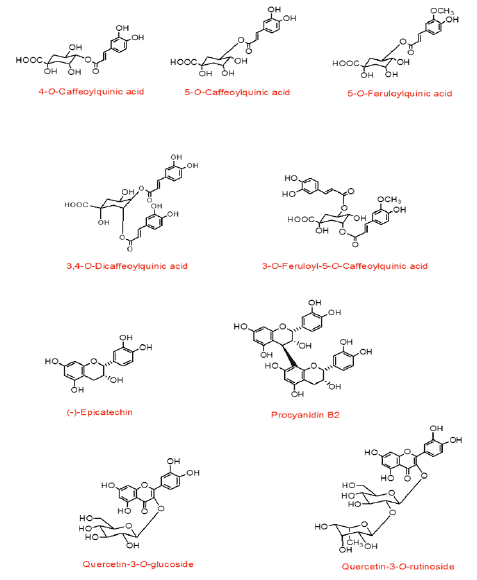
We identified and quantified the major phytochemicals present in WCCP. Structures of some of the major identified components are shown in Figure 1. As reported in table 1; total chlorogenic acids were the most abundant phytochemicals present in WCCP (44.7 ± 3.7 mg/g), of which 5-O-Caffeoylquinic acid (5-CQA) showed the highest concentration (27.9 ± 1.7 mg/g) which represents 62% of the total CGA content. Other chlorogenic acids were also detected, such as 4-O-caffeoylquinic acid (9%), 3-O-caffeoylquinic acid (6%), 3,4-O-dicaffeoylquinic acid (5%), 3,5-O-dicaffeoylquinic acid (5%). Caffeine and trigonelline were additionally detected (5.2 ± 1.2 mg/g and 8.1 ± 1.5 mg/g; respectively). Minor compounds such as procyanidin dimer, (+)-catechin and (-)-epicatechin were less abundant.


Figure 1 Structure of major hydroxycinnamates, flavan-3-ols and flavonols detected in WCCP samples

Figure 1
Structure of major hydroxycinnamates, flavan-3-ols and flavonols detected in WCCP samples


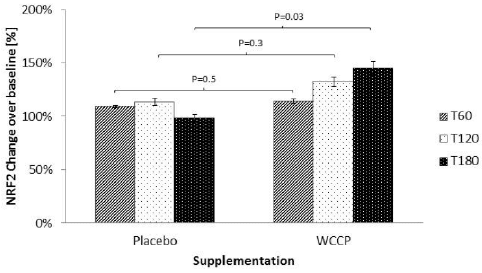
Nrf2 detected post supplementation with placebo and WCCP is shown in Figure 2. During the placebo supplementation non-significant Nrf2 increases were detected at T60 (109% ± 1%), T120 (113% ± 3%) and T180 (98% ± 3%). When treated with WCCP, Nrf2 was increased at T60 (114% ±2%), T120 (132% ± 4%) and T180 (145% ±6%). When compared to placebo, T60 and T120 showed no significance (P= 0.5 and P=0.3 respectively). However, T180 was statistically significant (P=0.03).


Table 1 Chemical composition of WCCP (dried whole coffee cherry powder). Results are displayed as mean ± SD (n = 3 true replicates), in mg/g. 3-CQA (3-O-Caffeoylquinic acid);5-CQA (5-OCaffeoylquinic acid); 4-CQA (4-O-caffeoylquinic acid); 4-FQA (4-O-Feruloyquinic acid); 5-FQA (5-O-Feruloyquinic acid); 3, 4-diCQA (3-4-O-Dicaffeoylquinica acid); 3, 5-diCQA (3-5-O-Dicaffeoylquinica acid); 4,5-diCQA (4-5-O-Dicaffeoylquinica acid); 3F, 4CQA (3-O-Feruloyl-4-O-caffeoylquinic acid); 3C, 5FQA (3-O-Caffeoyl-5-feruloyquinic acid); 4C, 5FQA (4-O-Caffeoyl-5-feruloyquinic acid); CGA (Chlorogenic acid)

Table 1
Chemical composition of WCCP (dried whole coffee cherry powder). Results are displayed as mean ± SD (n = 3 true replicates), in mg/g. 3-CQA (3-O-Caffeoylquinic acid);5-CQA (5-OCaffeoylquinic acid); 4-CQA (4-O-caffeoylquinic acid); 4-FQA (4-O-Feruloyquinic acid); 5-FQA (5-O-Feruloyquinic acid); 3, 4-diCQA (3-4-O-Dicaffeoylquinica acid); 3, 5-diCQA (3-5-O-Dicaffeoylquinica acid); 4,5-diCQA (4-5-O-Dicaffeoylquinica acid); 3F, 4CQA (3-O-Feruloyl-4-O-caffeoylquinic acid); 3C, 5FQA (3-O-Caffeoyl-5-feruloyquinic acid); 4C, 5FQA (4-O-Caffeoyl-5-feruloyquinic acid); CGA (Chlorogenic acid)


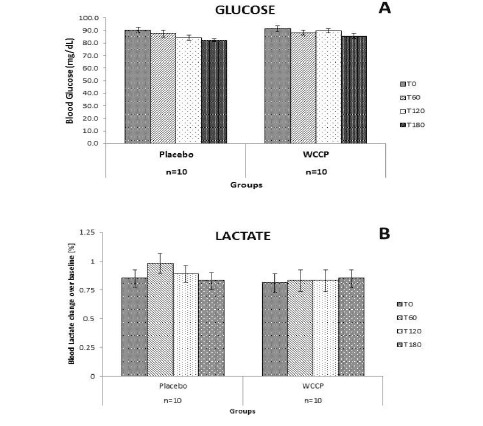
Glucose and lactate levels were also monitored in this 2 day study, as can be observed in Figure 3. Since subjects fasted for 12h prior to the supplementations, they were monitored for possible hypoglycemia. Also, we wanted to learn whether WCCP may affect blood glucose and lactate levels. There were no observed changes for glucose or lactate on placebo or WCCP. Blood glucose was monitored for placebo (Baseline: [90.3±2.21]; T60: [87.6±2.68]; T120: [84.3±2.12] and T180: [82.3±1.05]) and WCCP (Baseline: [91.8±2.26]; T60: [88.1±2.08]; T120: [89.8±1.81] and T180 [85.6±1.77]). Blood lactate was also monitored for placebo (baseline: [0.85±0.07]; T60: [0.98±0.08]; T120: [0.89±0.07] and T180: [0.83±0.07]) and for WCCP (baseline: [0.81±0.08]; T60: [0.83±0.09]; T120: [0.83±0.09] and T180: [0.85±0.07].It is important to reiterate that this study was conducted in healthy subjects and that any effect of WCCP has not been investigated in subjects with chronic conditions.


Figure 2 Nrf2 after supplementation with WCCP. Nrf2 was detected in nuclear extracts from isolated white blood cells. During the placebo supplementation, Nrf2 did not show any significant increase. When treated with WCCP, Nrf2 was increased at T60 (114% ±2%), T120 (132 ± 4%) and T180 (145% ±6%). When compared to placebo, T60 and T120 showed no significance (P= 0.5 and P=0.3 respectively). However, T180 was significant (P=0.03). Data are presented as Mean ± SE; n=10

Figure 2
Nrf2 after supplementation with WCCP. Nrf2 was detected in nuclear extracts from isolated white blood cells. During the placebo supplementation, Nrf2 did not show any significant increase. When treated with WCCP, Nrf2 was increased at T60 (114% ±2%), T120 (132 ± 4%) and T180 (145% ±6%). When compared to placebo, T60 and T120 showed no significance (P= 0.5 and P=0.3 respectively). However, T180 was significant (P=0.03). Data are presented as Mean ± SE; n=10

Figure 3 Glucose and lactate after placebo or WCCP supplementation. Subjects were fasted for 12h prior to the supplementation. Both glucose and lactate were monitored at the indicated time points (T0, T60, T120 and T180), for the duration of the study. Neither glucose nor lactate showed any significant changes on either supplementation day. Data are presented as Mean ± SE; n=10

Figure 3
Glucose and lactate after placebo or WCCP supplementation. Subjects were fasted for 12h prior to the supplementation. Both glucose and lactate were monitored at the indicated time points (T0, T60, T120 and T180), for the duration of the study. Neither glucose nor lactate showed any significant changes on either supplementation day. Data are presented as Mean ± SE; n=10


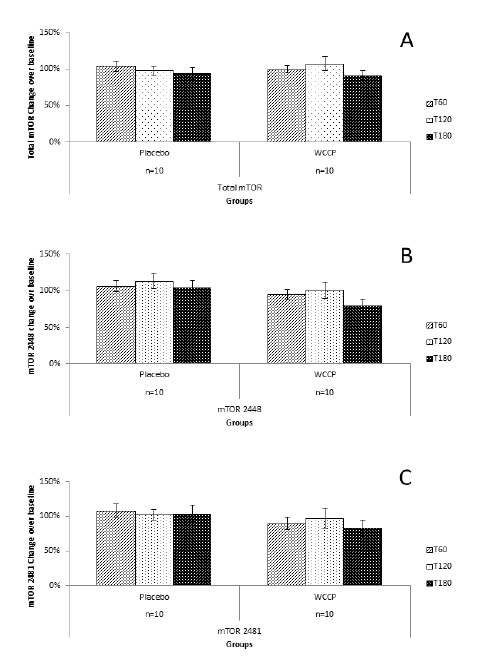
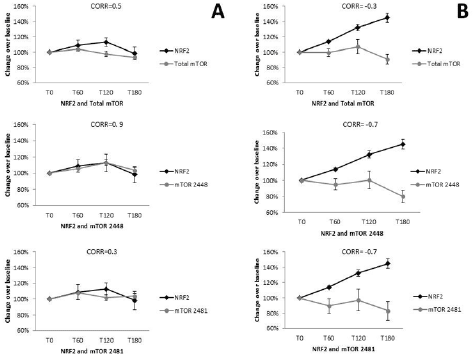
Total mTOR, 2448-mTOR and 2481-mTOR are shown in figure 4A. Total mTOR showed no changes at T60 (107% ±7%), T120 (98% ± 6%) and 180 min (93% ± 8%) in the placebo group. Supplementation with WCCP showed only as a slight non-significant change (99% ±5% at T60; 107% ±9% at T120, and 91% ± 6% at T180). When compared to placebo, neither T60 (P=0.23), T120 (P=0.31) nor T180 (P=0.09) were significant. For mTOR 2448; T60 and T180 showed no change, and for T120, there was a slight increase (13% above baseline). For the supplemented group, T60 and T120 showed no change or significance (P=0.39; P=0.38, respectively) when compared to placebo. At T180, mTOR showed a decrease of 20% below baseline, which is not significant when compared to placebo (P=0.07) (Figure 4B). For mTOR 2481, placebo showed no change. Supplementation showed a non-significant reduction when compared to placebo at T60 (90% ± 9%; P=0.22), T120 (97% ±14%, P=0.77) and T180 (83% ± 12%; P=0.19) (Figure 4C).
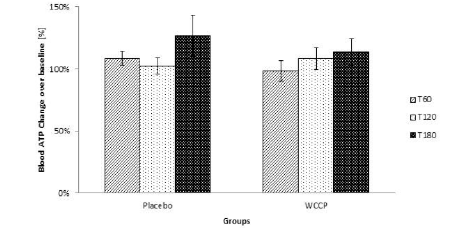
Blood ATP was detected by using a luciferase-based assay. As reported in Figure 6, ATP levels were not modified even though they  showed a tendency to increase at T180. However, when compared to placebo, supplemented group was not significant at any collection point (P=0.12; P=0.62; P=0.5 respectively). Data are presented as Mean ± SE; n=10 (Figure 6).

Figure 4 mTOR detection after supplementation with placebo or WCCP. Total mTOR (A) did not show any significant changes when compared to placebo at T60 (P=0.23), T120 (P=0.31) or T180 (P=0.09). mTOR 2448 (B) as well as mTOR 2481 (C) showed a reduction at T180 for the WCCP supplementation. However, when compared to placebo, neither mTOR 2448 (P=0.07) nor mTOR 2481 (P=0.19) were significant. Data are presented as Mean ± SE; n=10

Figure 4
mTOR detection after supplementation with placebo or WCCP. Total mTOR (A) did not show any significant changes when compared to placebo at T60 (P=0.23), T120 (P=0.31) or T180 (P=0.09). mTOR 2448 (B) as well as mTOR 2481 (C) showed a reduction at T180 for the WCCP supplementation. However, when compared to placebo, neither mTOR 2448 (P=0.07) nor mTOR 2481 (P=0.19) were significant. Data are presented as Mean ± SE; n=10


Pearson’s correlation was performed for placebo NRF2 and total mTOR (r= 0.5, CI -0.88 to 0.98; P=0.5, n=10), and mTOR 2481 (r=0.3, -0.93 to 0.97, P=0.7, n=10) where no correlation was observed, while mTOR 2448 showed a positive correlation (r=0.9, CI -0.47 to 0.99, P=0.1, n=10) (Figure 5A). NRF2 and total mTOR showed a negative correlation (r=-0.3, CI -0.98 to 0.94, P=0.7, n=10), as did mTOR 2448 (r=-0.7, CI -0.47 to 0.99, P=0.1, n=10) and mTOR 2481 (r=-0.7, CI -0.99 to 0.79, P=0.3, n=10).


Figure 5 Correlation between Nrf2 and mTOR levels within placebo and supplemented groups. Placebo (A) Nrf2 was compared to total mTOR (r=0.43, n=10), as well as mTOR 2448 (r=0.89, n=10) and mTOR 2481 (r=0.27, n=10). For the WCCP supplemented group (B), Nrf2 was also correlated with total mTOR (r=-0.32, n=10); mTOR 2448 (r=-0.68, n=10) and mTOR 2481 (r=-0.7, n=10)

Figure 5
Correlation between Nrf2 and mTOR levels within placebo and supplemented groups. Placebo (A) Nrf2 was compared to total mTOR (r=0.43, n=10), as well as mTOR 2448 (r=0.89, n=10) and mTOR 2481 (r=0.27, n=10). For the WCCP supplemented group (B), Nrf2 was also correlated with total mTOR (r=-0.32, n=10); mTOR 2448 (r=-0.68, n=10) and mTOR 2481 (r=-0.7, n=10)


Figure 6 Blood ATP was measured after supplementation. ATP levels were not significantly modified. Although the trend indicates that there was a tendency to increase when compared to placebo, WCCP supplemented group was not significant at any collection point (P=0.12; P=0.62; P=0.5 respectively). Data are presented as Mean ± SE; n=10

Figure 6
Blood ATP was measured after supplementation. ATP levels were not significantly modified. Although the trend indicates that there was a tendency to increase when compared to placebo, WCCP supplemented group was not significant at any collection point (P=0.12; P=0.62; P=0.5 respectively). Data are presented as Mean ± SE; n=10


Discussion

Dietary polyphenols such as flavones, isoflavones, flavonols, catechins and phenolic acids are mostly found in fruits and vegetables (20, 21). These compounds have shown antioxidant, anti-aging, anti-inflammatory, anti-atherosclerotic, and other biological abilities (11, 12). Chlorogenic acid (CGA) (5-caffeoylquinic acid) and caffeic acid, which have been reported to show antioxidant properties In vitro, (16, 20) are major components of coffee cherry (Table 1). The chemical composition of coffee beans (green and roasted) has been studied to a considerable extent (22, 23), as well as the proprietary green coffee fruit (24, 25). Recently, the proprietary composition for two coffee fruit extracts and two coffee powders has been reported (16). In all cases, chlorogenic acids have been reported to be the most abundant components (23). In WCCP, CGA is one of the main constituents (44.7 mg/g). When compared to roasted or green coffee, green coffee fruit, coffee fruit extracts and coffee powders, WCCP has a similar composition as of that described for “coffee fruit powder” 1 and 2 (CFP-1, CFP-2) (16). For WCCP; 5-O-Caffeoylquinic acid was the main chlorogenic acid, at 62% of the total content. Other chlorogenic acids were also detected, such as 4-O-caffeoylquinic acid (9%), 3-O-caffeoylquinic acid (6%), 3,4-O-dicaffeoylquinic acid (5%), 3,5-O-dicaffeoylquinic acid (5%). Trigonelline, detected in green coffee bean (23) was also found in WCCP, as well as caffeine. Average caffeine content of regular coffee goes from 9-13mg/g in Coffea arabiga to 15-25mg/g in Coffea canephora (23). Whilst coffee brew contains from 90-160mg caffeine per cup (26), WCCP contains only 5.2mg/g.

Several coffee constituents such as kahweol and cafestol have been reported to increase the nuclear Nrf2 protein level and modulating ARE-mediated gene expression. More recently, chlorogenic acid has been proposed as an activator of the Nrf2/ARE pathway, activating nuclear Nrf2-translocation as well as gene expression of different phase II enzymes in the colon carcinoma cell line HT29 (27, 28). In a human intervention study, an increase of transcripts of phase II genes in peripheral blood lymphocytes (PBL) after 4 weeks of daily consumption of either a coffee rich in CGA or one rich in N-methylpyridinium (NMP) was observed (29).
In this study, we examined the acute effect of WCCP on peripheral blood expression of markers related to healthy aging and longevity in healthy human subjects. Acute testing was performed following a single dose, oral administration of the supplement. No significant changes in peripheral WBC Nrf2 protein levels were seen over time following consumption of placebo. In contrast, a linear increase in peripheral WBC Nrf2 protein levels was seen during the 3 hours evaluated after oral supplementation with WCCP. A significant increase from baseline control was seen at 180 minutes. Neither the effect of the placebo nor the supplementation was evaluated beyond three hours. Fasting is associated with oxidative stress and can activate Nrf2 expression (30). It has been reported that activation of Nrf2 is associated with increased glucose uptake by the pentose phosphate pathway in fibroblasts (31). Similar observations have been made in animal models (32). Cells starved of glucose have decreased Nrf2 mediated detoxification of reactive oxygen species and decreased Nrf2 initiated expression of antioxidant defense proteins (31). Diabetic animal models also suggest Nrf2 expression can affect glucose metabolism (6). In this study, baseline fasting glucose levels were in the normal range in all the subjects. Also, no changes in blood glucose or lactate levels were seen in study subjects over time following supplementation with WCCP (Figure 3). Serum glucose and lactate levels were similar to those of placebo controls. These findings suggest acute oral WCCP intake did not have a measurable impact on the pentose phosphate pathway glucose uptake during the time period examined or that the glucose uptake was compensated for by glycogenolysis or other mechanisms, even though Nrf2 expression was increased.

In this study, a trend towards a decrease in total mTOR S2481, and mTOR S2448 expression was seen over time (Figure 4). These findings suggest that there was minimal effect of WCCP on mTOR expression and the two related pathways. No significant correlation was found between peripheral WBC expression of Nrf2 and total mTOR, mTOR 2481, or mTOR 2448 expression after treatment with placebo, although they did appear similar. This finding suggests that the two pathways are not interlinked closely during the time period examined. The expression of Nrf2 and all three mTOR proteins appeared to be opposed, increased for Nrf2and decreased for mTOR, after supplementation with WCCP (Figure 5A, 5B). These findings would be in line with current models of longevity
Activation of Nrf2 is associated with increased production of NADPH in fibroblasts (31). NADPH is responsible for providing reducing equivalents to allow glutathione or thioredoxin redox cycling, elements responsible for countering cellular redox stress. Increased NADPH synthesis is often linked to the generation of ATP, and Nrf2 expression has been correlated with ATP expression (33). These findings suggest increased ATP levels would be expected with increased Nrf2 expression. No significant changes in blood ATP levels were seen acutely after administration of placebo. In this study, a linear increase in blood ATP levels was seen after oral WCCP administration, although this increase was not statistically significant (Figure 6). It has been reported that cellular ATP levels were not altered in cells with genetically or pharmacologically activated Nrf-2 expression (31).
In summary, a single dose of coffee cherry powder WCCP was shown to increase Nrf2 expression. The highest Nrf2 expression was seen at the final time point of 180 minutes. Consequently, any higher subsequent expression could have been missed. Blood ATP levels remained unchanged, demonstrating that glucose is not diverted for energy production upon activation of Nrf2, whilst mTOR levels decreased. In this case, the small number of subjects evaluated may not have had enough power to detect differences in treatment outcomes. Further investigations are needed to verify whether WCCP affects Nrf2 directly or indirectly, as well as to investigate the acute and long term effect of WCCP on aging or related neurodegenerative conditions. Additional clinical testing is justified in order to further verify potency of WCCP to increase levels of Nrf2 and any potential correlation between reduced mTOR (S2448) and increased levels of Nrf2.


Funding: The present study was funded by Futureceuticals, Inc. The sponsors had no role in the design and conduct of the study; in the collection, analysis, and interpretation of data.

Conflict of interest disclosure: All authors declare that they have no conflict of interest.

Acknowledgments: We express our gratitude to John Hunter (FutureCeuticals, Inc.) for his comments and suggestions in the preparation of this paper. We would like to thank Michael Sapko for his help in editing and reviewing this manuscript.

Ethical standard: Ethical approval was granted by the Ethics Committee named Comité de Investigación Biomédica para el Desarrollo de Fármacos (Biomedical Research and Medicine Development Committee) México (Ref: FC-2015-N287).


References

1.     Balligand JL, Reducing damage through Nrf-2. Cardiovasc Res, 2013. 100:1-3.
2.    Gao B, Doan A and Hybertson BM, The clinical potential of influencing Nrf2 signaling in degenerative and immunological disorders. Clin Pharmacol 2014; 6:19-34.
3.    Dayalan Naidu S, Kostov RV and Dinkova-Kostova AT, Transcription factors Hsf1 and Nrf2 engage in crosstalk for cytoprotection. Trends Pharmacol Sci 2015; 36:6-14.
4.    Dinkova-Kostova AT and Abramov AY, The emerging role of Nrf2 in mitochondrial function. Free Radic Biol Med 2015; 88:179-88.
5.    Zhang M, An C, Gao Y, et al. Emerging roles of Nrf2 and phase II antioxidant enzymes in neuroprotection. Prog Neurobiol 2013; 100:30-47.
6.    Whitman SA, Long M, Wondrak GT, et al. Nrf2 modulates contractile and metabolic properties of skeletal muscle in streptozotocin-induced diabetic atrophy. Exp Cell Res 2013; 319:2673-2683.
7.    Sahin K, Orhan C, Tuzcu M, et al. Orally administered lycopene attenuates diethylnitrosamine-induced hepatocarcinogenesis in rats by modulating Nrf-2/HO-1 and Akt/mTOR pathways. Nutr Cancer 2014; 66:590-8.
8.    Harrison DE, Strong R, Sharp ZD, et al. Rapamycin fed late in life extends lifespan in genetically heterogeneous mice. Nature 2009; 460:392-5.
9.    Johnson SC, Rabinovitch PS and Kaeberlein M, mTOR is a key modulator of ageing and age-related disease. Nature 2013; 493: 338-45.
10.    Papaioannou AI, Rossios C, Kostikas K, et al. Can we delay the accelerated lung aging in COPD? Anti-aging molecules and interventions. Curr Drug Targets 2013; 14:149-57.
11.    Kishimoto Y, Tani M and Kondo K, Pleiotropic preventive effects of dietary polyphenols in cardiovascular diseases. Eur J Clin Nutr 2013; 67:532-535.
12.    Tomás-Barberán FA and Andrés-Lacueva C. Polyphenols and Health: Current State and Progress. J. Agric. Food Chem 2012; 60:8773–8775.
13.    Dinkova-Kostova AT, Talalay P. Direct and indirect antioxidant properties of inducers of cytoprotective proteins. Mol Nutr Food Res 2008; 52:S128-38.
14.    Jeong WS, Jun M and Kong AN, Nrf2: a potential molecular target for cancer chemoprevention by natural compounds. Antioxid Redox Signal 2006; 8:99-106.
15.    Nicoli, MC, Anese M, Manzocco L, et al. Antioxidant properties of coffee brews in relation to the roasting degree. Lebensm Wiss Technol 1997; 30:292–297.
16.    Mullen W, Nemzer B, Ou B, et al. The antioxidant and chlorogenic acid profiles of whole coffee fruits are influenced by the extraction procedures. J Agric Food Chem 2011; 59:3754-62.
17.    Mullen W, Nemzer B, Stalmach A, et al. Polyphenolic and hydroxycinnamate contents of whole coffee fruits from China, India, and Mexico. J Agric Food Chem 2013; 61:5298-309.
18.    Duarte GS, Pereira AA and Farah A. Chlorogenic acids and other relevant compounds in Brazilian coffees processed by semi-dry and wet post-harvesting methods. Food Chemistry 2010; 118:851-855.
19.    Reyes-Izquierdo T, Hammond, LE; Sikorski, RS; et al. Acute effect of HH2o on oxygen consumption rate, intracellular ATP and ROS in freshly isolated human peripheral blood mononuclear cells. Current Topics in Nutraceutical Research 2011; 9:139-146.
20.    Han X, Shen T, Lou H. Dietary polyphenols and their biological significance. Int J Mol Sci 2007; 8:950-988.
21.    Kim HS, Quon MJ and Kim JA, New insights into the mechanisms of polyphenols beyond antioxidant properties; lessons from the green tea polyphenol, epigallocatechin 3-gallate. Redox Biol 2014; 2:187-95.
22.    Crozier A, Jaganath IB and Clifford MN, Dietary phenolics: chemistry, bioavailability and effects on health. Natural Product Reports 2009; 26:1001-1043.
23.    Chu YF, Coffee: emerging health effects and disease prevention. 2012. John Wiley & Sons.
24.    Farah A, Monteiro M, Donangelo CM, et al. Chlorogenic acids from green coffee extract are highly bioavailable in humans. J Nutr 2008; 138:2309-15.
25.    Farah A, Donangelo CM. Phenolic compounds in coffee. Brazilian Journal of Plant Physiology, 2006. 18:23-36.
26.    Blauch JL and Tarka SM, HPLC determination of caffeine and theobromine in coffee, tea, and instant hot cocoa mixes. J Food Sci 1983; 48:745-747.
27.    Boettler U, Volz, N., Pahlke, G., et al. Coffees rich in chlorogenic acid or N-methylpyridinium induce chemopreventive phase II-enzymes via the Nrf2/ARE pathway in vitro and in vivo. . Mol. Nutr Food Res 2011; 55:798–802.
28.    Boettler U, Volz N, Pahlke G, et al. Coffee constituents as modulators of Nrf2 nuclear translocation and ARE (EpRE)-dependent gene expression. J Nutr Biochem 2011; 22:426-440.
29.    Volz N, Boettler U, Winkler S, et al. Effect of coffee combining green coffee bean constituents with typical roasting products on the Nrf2/ARE pathway in vitro and in vivo. J Agric Food Chem 2012; 60:9631-41.
30.    Zhang YK, Wu KC and Klaassen CD, Genetic activation of Nrf2 protects against fasting-induced oxidative stress in livers of mice. PLoS One 2013; 8:e59122.
31.    Heiss EH, Schachner D, Zimmermann K, et al. Glucose availability is a decisive factor for Nrf2-mediated gene expression. Redox Biol 2013; 1:359-365.
32.    Bardoux P, Zhang P, Flamez D, et al. Essential role of chicken ovalbumin upstream promoter-transcription factor II in insulin secretion and insulin sensitivity revealed by conditional gene knockout. Diabetes 2005; 54: 1357-63.
33.    Holmstrom KM, Baird L, Zhang Y, et al. Nrf2 impacts cellular bioenergetics by controlling substrate availability for mitochondrial respiration. Biol Open 2013; 2:761-770.