jarlife journal
Sample text

AND option

OR option

MALNUTRITION POINT-PREVALENCE FROM 2012 TO 2019 AND ASSOCIATED HEALTH-OUTCOMES IN ADULT PATIENTS IN RURAL HOSPITALS

E. Lopez1, M. Banbury2,3, E. Isenring4, S. Marshall5

1. MNutrDietPrac, Accredited Practising Dietitian, Faculty of Health Sciences and Medicine, Bond University, Australia; 2. BSc (Hons) Applied Human Nutrition & Dietetics. Accredited Practising Dietitian. Northern NSW Local Health District; 3. Faculty of Health Sciences and Medicine, Bond University, Australia; 4. PhD. Advanced Accredited Practising Dietitian. Bond University Nutrition & Dietetics Research Group, Faculty of Health Sciences and Medicine, Bond University, Australia; 5. BNutr&Diet (Hons), PhD. Accredited Practising Dietitian. Bond University Nutrition & Dietetics Research Group, Faculty of Health Sciences and Medicine, Bond University, Australia

Corresponding Author: Skye Marshall, Nutrition & Dietetics, Bond University, Robina, Queensland, 4226, Australia. Email: skye_marshall@bond.edu.au; Phone: 07 5595 3337.

J Aging Res Clin Practice 2019;8:91-97
Published online January 20, 2020, http://dx.doi.org/10.14283/jarcp.2019.16


Abstract

Background: Malnutrition negatively impacts hospitalised patients and the healthcare system. Objectives: 1) report point-prevalence of hospital malnutrition from 2012 to 2019; and 2) determine if there was an association between nutrition status and health-related outcomes. Design: Point-prevalence of malnutrition was determined by three (2012, 2014, and 2019) cross-sectional studies. Health-related outcomes, assessed by a prospective cohort study in 2014, were length of stay, in-hospital mortality, hospital readmission, infection, falls, fractures, and pressure wounds. Setting: three Australian rural hospitals. Participants: Adult inpatients. Measurements: Nutrition status was assessed with the Subjective Global Assessment (SGA) tool. Results: Malnutrition point prevalence was 39% in 2012 (n=62), 48% in 2014 (n=128), and 28% in 2019 (n=96); where the prevalence in 2019 was significantly lower than in 2014 (p<0.017). The 2019 (median age 70 years) sample was younger than the 2012 (median age 80 years) and 2014 (median age 78 years) samples (p<0.05). Mortality and falls rate were higher in the severely malnourished participants (p=<0.05); and severe malnutrition may predict mortality (Adjusted OR: 3.47 (95%CI: 0.94, 12.78] p=0.061). Conclusions: Nutrition status did not predict other health-related outcomes. The rate of malnutrition in rural hospitals was consistently high and may increase the risk of in-hospital mortality.

Key words: Malnutrition, hospitals, nutrition assessment, subjective global assessment, mortality.


Introduction

Protein-energy malnutrition (herein referred to as ‘malnutrition’) negatively impacts the patient and healthcare system alike (2, 3), a major concern as the prevalence has been reported internationally at 30-50% across inpatient and residential settings, and 1-25% across community settings (4-8). Malnutrition is the unintended loss of lean mass (muscle, immune and blood cells, viscera), with or without fat loss, due to inadequate intake, uptake, and/or utilisation of protein and energy to meet requirements (4, 9). Older adults are at greater risk of malnutrition due to their susceptibility of aetiological factors including psychological, socio-economic, and physiological changes and an overall increase in multi-morbidities and polypharmacy (9). A consequence of malnutrition is further morbidity, requiring increased healthcare resources including but not limited to hospital beds, multidisciplinary staff, and pharmaceutical and nutritional medicine (10). In particular, malnutrition increases risk of infection, pressure ulcers, poor wound healing, decreased response to medical treatment and pharmaceuticals, decreased respiratory function, decreased muscle repair, and overall functional impairment; leading to decreased quality of life and increased risk of mortality (3, 6, 11).
While several large-scale studies have reported the prevalence and outcomes of hospital malnutrition, the rural context requires specific examination as populations in rural areas are ageing more rapidly than in urban areas (11, 15-17). Rural areas face increased challenges in providing health and aged care due to the higher cost of establishing and delivering services, the limited availability of and access to health professionals, and less availability of informal care networks (12-14). Not only is access to health care more limited in rural areas, rural-dwelling older adults are also more in need of health and aged care services. A recent meta-analysis and meta-regression of international data found the prevalence of malnutrition in rural-dwelling older adults living at home was double that of urban-dwelling older adults (5). Therefore, the prevalence and health-related outcomes of malnutrition in rural hospitals is of interest, so that policies may appropriately support patients in the continuum of care from hospital to home or residential care.

Research aims

In adult patients admitted to three rural hospitals in Australia, the aims of this study were to: 1) report point-prevalence of malnutrition from 2012 to 2019; and 2) determine if there was an association between nutrition status and health-related outcomes.

Materials and Methods

Study design

The point-prevalence of malnutrition was assessed using three cross-sectional studies conducted in 2012, 2014, and 2019. The association between malnutrition and health-related outcomes was evaluated using a prospective observational study in 2014. Participants gave their verbal consent to participate in the study. The project was approved by the Human Research Ethics Committees in April 2018 (QA249) as a quality assurance project. This study has been reported according to the STROBE Statement for cohort studies (15) and was retrospectively registered with ANZCTR (ACTRN12619000342112) (19).

Setting and sample

All three hospitals within a rural government-funded local health district in northern New South Wales, Australia, were conveniently sampled in 2012. Reflecting the staffing resources available for each cross-sectional study, the medical, surgical, general (not diagnosis or treatment specific), and/or rehabilitation wards were sampled (Table 1).

Table 1 Rural hospitals and wards sampled by the three cross-sectional studies

Table 1
Rural hospitals and wards sampled by the three cross-sectional studies

* This sample was also that used in the prospective observational study.

The prospective cohort study was conducted using the 2014 sample due to availability of data and its larger sample size. Patients were eligible if they were 18 years or older and were admitted as inpatients to study sites during the recruitment phase of one to two weeks. No exclusion criteria were applied.

Participant characteristics and potentially confounding variables

Participant characteristics of age (years) and sex (male/female) were recorded for all participants. The 2014 sample were also described by comorbidities and medications. The number of active comorbidities were categorised into medical diagnostic groups: cancer, digestive, musculoskeletal, circulatory, respiratory, nervous, skin, reproductive, kidney, infectious, endocrine, injuries, ear, blood, and other. The number of medications were categorised into 24 drug classes based on the profile of medications recorded from the cohort (16).

Outcomes

Malnutrition was determined by the SGA tool which rates patients as A = well nourished, B = mild-moderate malnutrition, or C = severe malnutrition (17, 18).  The presence of malnutrition was the primary outcome to answer the first research question (point-prevalence) and the independent variable to answer the second research question (health-related outcomes).
The primary health-related outcome was length of hospital stay, defined by the number of days including the day of admission and discharge. Secondary health-related outcomes were in-hospital mortality (yes/no), hospital readmission (yes/no), in-hospital fall (yes/no), fall in subsequent hospital admissions (yes/no), pressure ulcer (yes/no), fracture acquired in hospital (yes/no), urinary tract or respiratory tract infection (yes/no). Health-related outcomes were measured from the day of hospital admission to three months post-discharge.

Data Collection

In 2012 and 2014, nutrition status was assessed by department dietitians over a 7-day period within each ward using the SGA. In 2019, nutrition status was assessed by one student-dietitian (EL) using the SGA over two weeks. Only the student dietitian in 2019 received training in correct SGA use, whereas department dietitians were expected to be competent in nutrition assessment due to years of experience. The SGA is comprised of two main components: medical and physical assessment. Changes in weight, dietary intake, gastrointestinal symptoms, and nutrition-related functional capacity were observed from a combination of patient records and patient interview for the medical component; while evidence of oedema, ascites, and loss of subcutaneous fat and muscle was assessed during a physical examination to inform the physical component. A patient who demonstrated negative changes to their oral intake and failed to meet their nutritional requirements with evidence of muscle and fat deterioration were classified as exhibiting a degree of malnutrition. Participant characteristics and the health-related outcomes were observed from the medical record.

Data Analysis

Data analysis was completed using IBM SPSS Statistics 25 [IBM Corp. Released 2017. IBM SPSS Statistics for Windows, Version 25.0. Armonk, NY: IBM Corp]. Descriptive statistics were used to summarise characteristics and outcome data. Continuous variables were considered non-normal if their skewness and kurtosis divided by their standard error exceeded +2 or -2; parametric variables were reported as mean (standard deviation) and non-parametric as median (IQR). Participants were considered “malnourished” if they were rated as SGA B or C, and “well-nourished” if rated SGA A. To determine if there was a significant difference in age, nutrition status, and sex between the samples, the Kruskal-Wallis H Test was applied. If significance was observed, post-hoc testing using Mann-Whitney U was used for pairwise comparisons between cohorts. Here, the Bonferroni correction was applied at 0.05 level and adjusted for three groups; therefore, the cut-off value for significance for Mann-Whitney U tests was at p<0.017. If significance was observed, post-hoc testing using Mann-Whitney U was used between pairs of cohorts. Post hoc power analysis using G*Power (version 3.1.9.2) was conducted on independent group means which showed significant difference. Extreme outliers (interquartile range rule with multiplier of 3) were removed from continuous variables. Binary logistic regression was used to determine the effect of the sample (2012, 2014, or 2019) on nutrition status, with age and sex as a confounding variables.
For the 2014 cohort, differences between nutrition status and outcomes were tested by the Mann-Whitney U Test or Chi-squared test. Associations with health-related outcomes were tested according to the level of severity, with patients considered as “malnourished” (SGA rating B or C), and “severely malnourished” (SGA rating C). Multiple linear regression was used to determine the impact of nutrition status on LOS, and multiple logistic regression was used to determine the impact of nutrition status on secondary outcomes, accounting for participant characteristics which met assumptions for the model. Statistical significance was considered at the p<0.05 level two tailed unless otherwise indicated.

Results

Participant characteristics

A total of 286 participants were recruited; n=62 in 2012, n=128 in 2014, and n=96 in 2019 (Table 2). There was no difference in the sex ratio or the prevalence of malnutrition between the sexes in any sample. The 2019 sample (median age 70 years) was found to be significantly younger than the 2012 (median age 80 years) and 2014 (median age 78 years) samples (p < 0.017). In the 2014 sample, a circulatory condition was the most common comorbidity experienced (72%), followed by musculoskeletal and respiratory conditions (40% and 38% respectively) (Table 3). Cancer was more prevalent in malnourished (33%) than well-nourished participants (16%) (p=0.028); where prevalence and total number of other comorbidities between groups were similar. Both groups had a median of six classes of medications prescribed during hospitalisation; where the malnourished group had a higher range (IQR 5, 7.25) than the well-nourished group (IQR 3, 6.25) (p=0.024). Malnourished participants were also more likely to be prescribed nutritional supplements (p=0.008) and proton-pump inhibitors (p=0.013), and less likely to be prescribed medication for insomnia (p=0.037).

Table 2 Age, sex, and malnutrition point-prevalence of the 2012, 2014, and 2019 participant samples

Table 2
Age, sex, and malnutrition point-prevalence of the 2012, 2014, and 2019 participant samples

* Kruskal-Wallis H Test applied followed by Mann-Whitney U tests to determine significance between cohort years. The Bonferroni correction was applied at 0.05 level. Cut-off value for significance for Mann-Whitney U tests at p=0.017 (0.05/3) for 3 pairwise comparisons between cohorts. Significance for age found between pairs 2012 vs 2019 and 2014 vs 2019 cohorts; † No significance found between sex across cohorts; ‡ Malnourished = B (mild-moderate malnutrition) and C (severe malnutrition) rating combined; § Kruskal-Wallis H Test applied followed by Mann-Whitney U tests to determine significance between cohort years. The Bonferroni correction was applied at 0.05 level. Cut-off value for significance for Mann-Whitney U tests at p=0.017 (0.05/3) for 3 pairwise comparisons between cohorts. Significance for malnourished patients only found between 2014- and 2019-year groups; || No significance found for sex effect on malnutrition across cohorts.

Table 3 Comorbidity and medication characteristics of 2014 sample

Table 3
Comorbidity and medication characteristics of 2014 sample

* Comorbidity data in the medical record was unavailable for n=4 participants; † Comparison of well-nourished (SGA rating A) and malnourished (SGA rating B or C) groups; ‡  Number of comorbidities experienced by a single participant; data presented mean (SD); § PPI = proton pump inhibitor; ||  Number of medication classes taken by a single participant; data presented median (IQR)

Point-prevalence of malnutrition from 2012 to 2019

Across the three time-points, malnutrition according to the SGA shows a peak in the 2014 cohort (48%), which was significantly higher than in 2019 (28%), but not 2012 (39%) (Table 2). The prevalence of participants assessed as severely malnourished (SGA rating C) decreased over time from 15% in 2012, 13% in 2014, to 2% in 2019 (p=0.005); whereas the prevalence of well-nourished fluctuated from 61% in 2012, 52% in 2014, to 72% in 2019 (p=0.005). In a model adjusted for age and sex, regression analyses found that only age was a predictor of malnutrition, where each year of life increased the odds of malnutrition by 2% (OR: 1.020 [95%CI: 1.003, 1.036] p=0.018) but explained only 5% of variation in the model.
‘Effect size’ and ‘chance of impact’ was reported for comparisons between year groups for nutrition status to determine the magnitude of the difference between groups and whether or not the outcome was likely to have an actual impact. The pairwise comparison for nutrition status between 2014 and 2019 had a medium effect and 93% chance of impact. For age comparison, 2014 versus 2019 had a medium effect and 89% chance of impact. The 2012 versus 2019 comparison has a small effect size and a 35% chance of impact.

Association of malnutrition with health-related outcomes

In the 2014 sample, there were five extreme outliers for LOS that were removed. The average LOS was 12 (IQR: 6, 22) days and 60% of participants were readmitted to hospital within 3-months. Malnourished participants (SGA rating B or C) had a higher rate in-hospital mortality but this did not quite reach significace (21% versus 9%; p=0.059); groups did not differ on other outcomes (Table 4). Malnutrition was not a significant predictor of any health-related outcome in adjusted regression models.
Severely malnourished participants (SGA C) had a higher rate in-hospital mortality (38% versus 12%; p=0.006), and a lower rate of falls during subsequent admissions (0% versus 22%; p=0.035); but groups did not differ on other outcomes (Table 5). Severe malnutrition increased the risk of in-hospital mortality by 457% (OR: 4.57 [95%CI: 1.42, 14.66], p=0.011); but in a model adjusted for age, cancer diagnosis, and prescription of nutrition supplements (confounders which met assumptions), this was reduced to 347% with a trend for significance [OR: 3.47 (95%CI: 0.94, 12.78] p=0.061). Severe malnutrition was not a predictor of other health-related outcomes in adjusted or unadjusted models.

Table 4 Health-related outcomes of the 2014 sample according to well-nourished or malnourished

Table 4
Health-related outcomes of the 2014 sample according to well-nourished or malnourished

Data expressed as median (IQR) or n (%) ; * Comparison of well-nourished (SGA rating A) and malnourished (SGA rating B or C) groups;  † Test performed on log10 normalised data

Table 5 Health-related outcomes of the 2014 sample according to severely malnourished or not severely malnourished

Table 5
Health-related outcomes of the 2014 sample according to severely malnourished or not severely malnourished

Data expressed as median (IQR) or n (%); * Comparison of no severe malnutrition (SGA rating A or B) and severely malnourished (SGA rating C) groups; † Test performed on log10 normalised data

Discussion

This study has reported a consistently high prevalence of malnutrition in three rural hospitals in northern NSW from 2012 to 2019; however, in 2019 the prevalence was 11% and 20% lower than in the previous samples, and the prevalence of severe malnutrition was very low at 2%. The 2014 sample reported the highest prevalence of malnutrition in any Australian hospital (45%); which exceeds the rate reported in three remote Australian hospitals (42%) (19-21). The lowest prevalence reported in 2019 aligns with prevalence rates in Australian metropolitan hospitals. As nutrition status comparison between the 2014 and 2019 cohorts had a calculated medium effect size and high impact value, there is high confidence in the measured prevalence rates. Relevant for the Australian health care system, the SGA tool used to determine prevalence is synonymous with the International Classification for Diseases, 10th revision, Australian Modification (ICD-10-AM) classification of protein-energy malnutrition (22), and therefore directly linked to case-mix funding.
The differing rates in malnutrition prevalence over time is partially explained by the age of participants; however, the impact of age cannot account for the changes in prevalence alone. The lower rate of malnutrition in 2019 compared 2014 may also be due to variations in the sampled wards and hospital sites. The 2019 sample did not include a 34-bed rehabilitation ward; a setting which has previously been reported to have a high prevalence of malnutrition at 53% (23). There are also likely causes of variation in the prevalence of malnutrition over time which were not captured by this study, including demographics such as socio-economic status or ethnicity, inter-rater variability of SGA assessment, or changes in hospital policies and priorities to address malnutrition. Interestingly, the rate of malnutrition did not vary according to sex. A recent meta-analysis of worldwide data found that females had a 45% increased risk of malnutrition (OR: 1.45 [95%CI: 1.27, 1.66] p<0.00001) in the community setting, which included post-hospital samples.
It has been well established that malnutrition increases the risk of poor health outcomes in the hospital setting, (21, 24, 25). This study confirms that malnourished participants had higher rates of in-hospital mortality; however, only severe malnutrition was a predictor of this outcome. The clinical importance of this is still relevant despite the rate of severe malnutrition being reduced to only 2% in 2019, as there is a possibility of inter-rater variability in application of the SGA. To confirm if the risk of malnutrition-related in-hospital mortality has been eradicated with the decrease in severe malnutrition rates, health outcomes of the 2019 would need to be examined. A high rate of false positives in the 2014 sample would also explain why many participant characteristics usually associated with malnutrition were not significant predictors in multivariable models. Although severe malnutrition appeared to have a lower rate of falls in subsequent hospital admissions compared to better nourished participants, this is explained by very low rates of hospital readmission reflecting the high rate of in-hospital mortality in this group.
Of clinical significance, less than 50% of malnourished participants in the 2014 sample were provided with nutritional supplementation, and non-supplementation was a predictor of poor health-related outcomes in the adjusted models, including the high rate of hospital readmission within 3-months. Additionally, prescription of proton-pump inhibiters, which inhibit nutrient digestion, was higher in malnourished participants. Overall, the 2014 sample had a high rate of polypharmacy, a risk factor for malnutrition (26). Although comorbidities were highly prevalent, the only disease which was higher in the malnourished participants was cancer. Whilst malnutrition in cancer is known to highly prevalent (27); previous studies have identified that patients with other hypermetabolic conditions such as hepatic, cardiovascular, and gastrointestinal disease, depression, and dementia also have increased risk of malnutrition (28, 29).

Limitations

As discussed above, this study is limited by potential poor inter-rater reliability for the SGA assessment between samples, and not including further demographic data to explore variation in the multivariable models. In addition, as the SGA assessments were implemented cross-sectionally, the ratio of pre-existing malnutrition (i.e. admitted to hospital with malnutrition) to hospital acquired malnutrition within the reported prevalence is unclear. Finally, the 2014 sample may have been underpowered to detect differences in health-related outcomes, particularly risk of in-hospital mortality (p=0.059).

Conclusion

Although the prevalence of malnutrition decreased over time, the rate of malnutrition in the sampled rural hospitals was consistently high; and is associated with increased risk of in-hospital mortality. Research should continue to monitor the rate of malnutrition in acute hospitals in rural areas to evaluate the impact of health service policies and procedures to address this problem.

Key Question Summary

What is known about the topic? Malnutrition is highly prevalent in the acute hospital setting in Australia at 30-40% and up to 71% in older adults (1). The Australian health system faces unique challenges related to high proportions of older adults living in geographically rural and remote areas. The rates and health-related complications of malnutrition in rural and remote Australian hospitals is unexplored.
What does this paper add? This study reported the highest ever recorded prevalence of malnutrition in Australia, at 48% in 2014; which was associated with increased risk of death. However, in 2019 the prevalence has reduced to 28%, and severe malnutrition was almost eradicated (down to 2%).
What are the implications for practitioners? Although the prevalence of malnutrition decreased over time, the rate of malnutrition in the sampled rural hospitals was consistently high; and was associated with increased risk of in-hospital mortality. Less than 50% of malnourished participants were provided with nutritional supplementation, and non-supplementation was a predictor of poor health-related outcomes in adjusted models, including in-hospital mortality.

Acknowledgements: A great thank you to Bond University statistician Evelyn Rathbone and the staff at Tweed, Murwillumbah, and Byron Bay Hospitals for their support of this study.

Conflicts of Interest: MB is the nutrition and dietetics department manager for the sampled sites and oversaw the implementation of all three cross-sectional studies. MB was not involved in the analysis of results. All other authors declare no existing or potential conflict of interest.

Funding sources: This research did not receive any specific grant from funding agencies in the public, commercial, or not-for-profit sectors.

Author contributions: All authors contributed to the conception of the study. EL and MB contributed to data collection. EL and SM contributed to data analysis. EL drafted the manuscript, and all authors contributed to manuscript revision. All authors approve the final version of the manuscript.

References

1.    Banks M, Ash S, Bauer J, Gaskill D. Prevalence of malnutrition in adults in Queensland public hospitals and residential aged care facilities. Nutrition & Dietetics. 2007;64(3):172-8.
2.    Camilo ME. Disease-related Malnutrition: An Evidence-based Approach to Treatment. Clinical Nutrition. 2003;22(6):585.
3.    Marshall S, Bauer J, Isenring E. The consequences of malnutrition following discharge from rehabilitation to the community: a systematic review of current evidence in older adults. J Hum Nutr Diet. 2014;27(2):133-41.
4.    Marshall S. Protein-energy malnutrition in the rehabilitation setting: Evidence to improve identification. Maturitas. 2016;86:77-85.
5.    Crichton M, Craven D, Mackay H, Marx W, de van der Schueren M, Marshall S. A systematic review, meta-analysis and meta-regression of the prevalence of protein-energy malnutrition: associations with geographical region and sex. Age Ageing. 2018;48(1):38-48.
6.    Agarwal E, Ferguson M, Banks M, Batterham M, Bauer J, Capra S, et al. Malnutrition and poor food intake are associated with prolonged hospital stay, frequent readmissions, and greater in-hospital mortality: results from the Nutrition Care Day Survey 2010. Clin Nutr. 2013;32(5):737-45.
7.    Agarwal E, Marshall S, Miller M, Isenring E. Optimising nutrition in residential aged care: a narrative review. Maturitas. 2016;92:70-8.
8.    Pirlich M, Schütz T, Norman K, Gastell S, Lübke HJ, Bischoff SC, et al. The German hospital malnutrition study. Clin Nutr. 2006;25(4):563-72.
9.    Marshall S. Why is the skeleton still in the hospital closet? A look at the complex aetiology of malnutrition and its implications for the nutrition care team. J Nutr Health Aging. 2018;22:26-9.
10.    Curtis LJ, Bernier P, Jeejeebhoy K, Allard J, Duerksen D, Gramlich L, et al. Costs of hospital malnutrition. Clin Nutr. 2017;36(5):1391-6.
11.    Marshall S, Agarwal E. Comparing characteristics of malnutrition, starvation, sarcopenia and cachexia in older adults. Handbook of famine, starvation, and nutrient deprivation: from biology to policy. 2017:1-23.
12.    Caring for Older Australians, Volume 1. Canberra: Productivity Commission; 2011.
13.    Living Longer. Living Better. Aged Care Reform Package. Canberra: Australian Government Department of Health and Ageing; 2012.
14.    Caring for Older Australians, Volume 2. Canberra: Productivity Commission; 2011.
15.    Von Elm E, Altman DG, Egger M, Pocock SJ, Gøtzsche PC, Vandenbroucke JP, et al. The Strengthening the Reporting of Observational Studies in Epidemiology (STROBE) statement: guidelines for reporting observational studies. Prev Med. 2007;45(4):247-51.
16.    Agarwal E, Ferguson M, Banks M, Vivanti A, Batterham M, Bauer J, et al. Malnutrition, poor food intake, and adverse healthcare outcomes in non-critically ill obese acute care hospital patients. Clinical Nutrition. 2019;38(2):759-66.
17.    Detsky AS, McLaughlin JR, Paker JP, Johnston N, Wittaker S, Mendelson RA, et al. What is subjective global assessment of nutritional status. JPEN. 1987;11:8-11.
18.    Marshall S, Craven D, Kelly J, Isenring E. A systematic review and meta-analysis of the criterion validity of nutrition assessment tools for diagnosing protein-energy malnutrition in the older community setting (the MACRo Study). Clin Nutr. 2018;37(6A):1902-12.
19.    Morris NF, Stewart S, Riley MD, Maguire GP. The burden and nature of malnutrition among patients in regional hospital settings: A cross-sectional survey. Clinical Nutrition ESPEN. 2018;23:1-9.
20.    Allard JP, Keller H, Jeejeebhoy KN, Laporte M, Duerksen DR, Gramlich L, et al. Decline in nutritional status is associated with prolonged length of stay in hospitalized patients admitted for 7 days or more: A prospective cohort study. Clinical Nutrition. 2016;35(1):144-52.
21.    Agarwal E, Ferguson M, Banks M, Batterham M, Bauer J, Capra S, et al. Malnutrition and poor food intake are associated with prolonged hospital stay, frequent readmissions, and greater in-hospital mortality: results from the Nutrition Care Day Survey 2010. Clin Nutr. 2013;32(5):737-45.
22.    Australian coding standards for I.C.D.-10-AM. Sydney: National Centre for Classification in Health; 2008.
23.    Marshall S, Young A, Bauer J, Isenring E. Malnourished older adults admitted to rehabilitation in rural New South Wales remain malnourished throughout rehabilitation and once discharged back to the community: a prospective cohort study Journal of Aging Research and Clinical Practice. 2015;4(4):197-204.
24.    Allard JP, Keller H, Jeejeebhoy KN, Laporte M, Duerksen DR, Gramlich L, et al. Malnutrition at Hospital Admission-Contributors and Effect on Length of Stay: A Prospective Cohort Study From the Canadian Malnutrition Task Force. JPEN J Parenter Enteral Nutr. 2016;40(4):487-97.
25.    Sanson G, Bertocchi L, Dal Bo E, Di Pasquale CL, Zanetti M. Identifying reliable predictors of protein-energy malnutrition in hospitalized frail older adults: A prospective longitudinal study. Int J Nurs Stud. 2018;82:40-8.
26.    Nutrition screening as easy as mna. A guide to completing the Mini Nutritional Assessment (MNA). Swizterland Nestle Nutrition Institute.
27.    Segura A, Pardo J, Jara C, Zugazabeitia L, Carulla J, de las Penas R, et al. An epidemiological evaluation of the prevalence of malnutrition in Spanish patients with locally advanced or metastatic cancer. Clin Nutr. 2005;24(5):801-14.
28.    Konturek PC, Herrmann HJ, Schink K, Neurath MF, Zopf Y. Malnutrition in Hospitals: It Was, Is Now, and Must Not Remain a Problem! Medical science monitor : international medical journal of experimental and clinical research. 2015;21:2969.
29.    Bonetti L, Terzoni S, Lusignani M, Negri M, Froldi M, Destrebecq A. Prevalence of malnutrition among older people in medical and surgical wards in hospital and quality of nutritional care: A multicenter, cross-sectional study. Journal of clinical nursing. 2017;26(23-24):5082-92.
29.    Faul, F., Erdfelder, E., Buchner, A., & Lang, A.-G. (2009). Statistical power analyses using G*Power 3.1: Tests for correlation and regression analyses. Behavior Research Methods, 41, 1149-1160.

ADEQUACY OF CURRENT AND FUTURE INCOME AND ASSETS AND THE RISK OF MORTALITY IN A COHORT OF OLDER MEN – THE MANITOBA FOLLOW-UP STUDY

P.D. St John1,2, R.B. Tate2,3

1. Section of Geriatric Medicine, Max Rady College of Medicine, Rady Faculty of Health Sciences, University of Manitoba, Winnipeg, Canada; 2.  Centre on Aging, University of Manitoba, Winnipeg, Canada; 3. Department of Community Health Sciences, Max Rady College of Medicine, Rady Faculty of Health Sciences, Winnipeg, Canada

Corresponding Author: Philip D St John, MD, MPH, FRCPC, Professor, Section of Geriatric Medicine, Max Rady College of Medicine – University of Manitoba – Room GE547 Health Sciences Centre, 820 Sherbrook St, Winnipeg  R3A 1R9, Phone 204-787-1819, Email: pstjohn@hsc.mb.ca

J Aging Res Clin Practice 2019;8:80-84
Published online January 9, 2020, http://dx.doi.org/10.14283/jarcp.2019.14


Abstract

Objective: To determine if self-reported current income adequacy or future expectation of income adequacy predicts death amongst older men. Design and Setting: We conducted an analysis of a prospective cohort of 3 983 men who have been followed since 1948. In 2006, 1001 men were alive, of whom 807 completed the annual survey without assistance. Two items in the 2006 survey were: “How well do you think your income and assets satisfy your current needs?” and “How well do you think your income and assets will satisfy your needs in the future?” We considered the categories: “very adequate, adequate and inadequate.” Time to death over the next 11 years was examined with the Cox proportional hazards models, and adjusted for age, marital status, and functional status. Results: The mean age in 2006 was 85 years old. The median follow-up time was 6.1 years, and 664 of the participants died. Satisfaction with current income did not predict mortality. Those with an expectation of inadequate future income had a higher risk of death: Hazard Ratio of 1.37 [(95%CI) 1.02, 1.84)] for “Not adequate” relative to “Very Adequate”.  In models adjusted for age, marital status and functional status, this association was only marginally statistically significant (p=0.07). Conclusions: Perceived adequacy of future income predicts mortality in very old men. The effect may be confounded or mediated by functional decline.

Key words: Social position, satisfaction with income adequacy, aging, men, mortality.


Introduction

Social and economic circumstances have long been noted to predict adverse health outcomes in general populations (1-3). More recently, education and income security have been further studied in older populations (4-6). While the effect of social position on health appears to diminish or reverse in late life compared to early life (7, 8), measures of social position predict mortality (9), disability (9), multimorbidity (10) and healthy ageing (11) even in older populations.  Social determinants of health, such as income, education and occupation, are potentially modifiable risk factors for adverse outcomes. Some social determinants of health which are generally well defined in early life, such as educational attainment, may be difficult to modify in very late life. However, other determinants, such as maintaining income security, may be more amenable to intervention at all stages in the life course. Efforts to secure stable pensions, support low income individuals, and maintain access to social services may serve to improve health in late life, and reduce health inequalities even into late life (12).
In Canada, income support to older persons is provided from various sources. A small percentage of older Canadians remain employed, and continue to have a work-related income. Others rely primarily on savings and investments. However, most older adults receive a pension – some through their employment, and some through the Canada Pension Plan (CPP) or Quebec Pension Plan (QPP). Almost all individuals who work in Canada and Quebec contribute to the CPP or QPP while working, and are then eligible for CPP/QPP pensions. The monthly pension is dependent upon the duration of employment as well as employment income. In addition, all Canadians receive the Old Age Security (OAS) pension. This is funded out of the general revenues of the Government of Canada, and is available to all residents over the age of 65. For low income older adults, a Guaranteed Income Supplement (GIS) is also available to ensure that a basic income is met (13). While poverty remains a substantial concern amongst older Canadians (14), the poverty rates are comparable to OECD countries (15, 16). Poverty rates are considerably higher among older women than older men in Canada.
While there is compelling evidence that income security remains a social determinant of health in working age populations, there is less evidence in very old populations. Furthermore, the effect may differ between societies. A recent review notes the importance of maintaining income security in older populations, but calls for ongoing study of the effect of income security on late life health, since the effect may vary across time intervals or across societies (4). Another issue is the measurement of social position in late life. There are numerous aspects of social and economic position – educational attainment, income, total wealth, as well as measures of income adequacy – and they may predict adverse outcomes differently. Furthermore, different measures of income adequacy may measure income security in the present, or measure the expectation of income adequacy to meet future needs.
To address some of these issues, we explored self-assessed income and asset adequacy in an existing cohort of older men – the Manitoba Follow Up Study (MFUS). Specifically, the objectives are: 1. To determine if self-assessed current income adequacy predicts death over a long (11 year) time interval; and 2. To determine if self-assessed expectations of future income adequacy predict death over a long time interval.

Methods

The Manitoba Follow-up Study (MFUS) (17)is a prospective cohort study of cardiovascular disease and ageing. The MFUS cohort consists of 3983 men recruited from the Royal Canadian Air Force at the end of the Second World War. At entry to the study, 1 July 1948, their mean age was 31 years, with 90% between ages 20 and 39 years. All study members were free of clinical evidence of ischemic heart disease. The protocol of MFUS was to obtain routine medical examinations from these men at regular intervals over time. The research goal of the study was to examine the role that non-specific abnormalities detected on routine electrocardiograms from apparently healthy men might play in the prediction of subsequent diagnoses of cardiovascular disease. The research focus was expanded in 1996 to explore the roles of physical, mental and social functioning (18). In 2017, 180 were alive (5%), with a mean age 96y; 91% lived in Canada, and 36% developed IHD. The study receives annual approval from the University of Manitoba Health Research Ethics Board.
The study methods have been previously reported (17).  The study protocol evolved with the ageing of the cohort. Initially, study members were contacted at 5-year intervals, then 3-year intervals, every year, twice a year and now three times each year.  This annual medical contact queries if they had seen their primary care provider, or if they have been admitted to hospital during the past year. If they have, then the medical records are obtained. As well, records pertaining to the death of the participant are also received. These records are then reviewed by physicians who code the charts for disease states and cause of death. Over the seventy years of follow-up, there have been 22 participants who have been lost to follow-up (defined as having no contact during the previous three consecutive years). A Successful Aging Questionnaire (SAQ) was added in 1996 and repeated in 2002, 2004 and annually since then, with annual completion rates exceeding 80%. Core components of the SAQ in all years have been: Living arrangements, marital status, items of social engagement, self-rated health, items of life satisfaction, the ability to perform basic and instrumental activities of daily living (ADL, IADL), and the Short Form -36 (SF-36). The SAQ is completed by the participant, or appropriate proxy. Participants who enter long term care do not complete the SAQ, but medical records continue to be reviewed. Items on income adequacy were added to the 2006 survey of MFUS These items were: “How well do you think your income and assets satisfy your current needs?” and “How well  do you think your income and assets will satisfy your needs in the future?” The responses were recorded on five point ordinal scales. We collapsed categories into very adequate (very well); adequate (adequately); and not adequate (with some difficulty; not very well; totally inadequate); since there were very few individuals with low income satisfaction.
We defined the observation window for this analysis to be from the date of return of the Spring 2006 survey to December 31, 2017, a follow up time of just over 11 years. We considered the outcome as the time to death.  We created Kaplan – Meier survival curves for the time to death, and used log rank tests to determine differences in the survival probability across income adequacy categories. We then constructed Cox proportional hazards models with the time to death as the outcome.  Other factors in the Cox models were marital status in 2006 (defined as  married or not married), age, and the number of impairments in BADLs or IADLs, considered as  continuous variables.
There were 1001 participants considered alive at the time of the 2006 mailing: 807 questionnaires were returned completed by the man; 34 were returned completed by a proxy; 54 were returned incomplete (due to death, illness, or relocated); 106 were not returned. There were 18 individuals who did not complete the item on adequacy of current income and 22 individuals who did not complete the item on adequacy of future income.

Results

There were 807 men considered in these analyses. Over a median follow-up time of 6.1 years to the end of 2017, 664 (82%) of the men died. Most of the men had adequate or very adequate self-reported income.  Baseline characteristics are shown in Table 1. Those who felt that their future income would be inadequate were more likely to have impairments in ADLs.  In unadjusted analyses, current income satisfaction did not predict mortality over the eleven year time frame (Figure 1 and Table 2). However, low satisfaction with income and assets in the future did predict mortality over the eleven year period (Figure 2).  This effect did not appear to be a gradient, but seemed limited to those who felt their income would be inadequate in the future. In models which adjusted for baseline functional status and marital status, expectation of future income inadequacy did not predict mortality. Lower functional status was a very strong predictor of dying. Being married was associated with a lower mortality (Table 3).

Table 1 Baseline characteristics of the sample

Table 1
Baseline characteristics of the sample

ADL is activities of daily living; IADL is instrumental activities of daily living

Table 2 Results of Cox Proportional Hazards Model for current income

Table 2
Results of Cox Proportional Hazards Model for current income

HR is Hazard Ratio; CI is confidence interval; ADL is activities of daily living; IADL is instrumental activities of daily living

Figure 1 Kaplan Meier Plot for those with Very Adequate (category 1), Adequate (category 2) and Inadequate (category 3) self-rated adequacy of current income

Figure 1
Kaplan Meier Plot for those with Very Adequate (category 1), Adequate (category 2) and Inadequate (category 3) self-rated adequacy of current income

Figure 2 Kaplan Meier Plot for those with Very Adequate (category 1), Adequate (category 2) and Inadequate (category 3) self-rated adequacy of future income

Figure 2
Kaplan Meier Plot for those with Very Adequate (category 1), Adequate (category 2) and Inadequate (category 3) self-rated adequacy of future income

Table 3 Results of Cox Proportional Hazards Model for expected future income

Table 3
Results of Cox Proportional Hazards Model for expected future income

HR is Hazard Ratio; CI is confidence interval; ADL is activities of daily living; IADL is instrumental activities of daily living

Discussion

We have examined the effect of income security on mortality over a decade among very old men. We have found that most of the men were satisfied or very satisfied with their income, and their expected future income. Those who felt that their future income would not meet their needs had a higher risk of death than those who did not. This effect did not appear to have a gradient effect across the range, but seemed limited to those who did not anticipate an adequate future income. When adjusted for baseline functional status, this effect was no longer apparent. Our findings are broadly similar to a large literature documenting the importance of income security on health outcomes in younger populations. We continue to observe an effect of income security in late life on mortality. However, this effect may be confounded by impaired functional status. Perhaps there is a mediating effect, whereby those with lower income security become functionally impaired prior to dying.

There are strengths and limitations to our approach. First, we have a large population of very old men. There are few prospective cohort studies of men over the age of 85. Second, the measure of income security we used is consistent with that used in other Canadian surveys. On the other hand, we considered subjective income security rather than the actual income. There is some debate about the merits of subjective assessments of social and economic security, although subjective measures of social position strongly predict health status and mortality in other cohort studies (19, 20). One advantage of subjective assessments is that they may be less sensitive to differences in the cost of living. Since this varies widely across Canada (where most of the participants reside), there are merits to these subjective measures. However, the use of these measures may limit the understanding of income effects on health for policy measures, where more objective measures of income may be needed. There are also limitations to the generalizability of our findings. The finding may not apply to those living outside Canada. However, the effects may be more apparent outside Canada, where rates of poverty are higher. Our findings also do not extend to women, where the rates of poverty are higher. Finally, the MFUS cohort members were all healthy at entry into the study, and had important shared life experiences, which limits the generalizability of our findings.
Nevertheless, if confirmed, our findings may have several implications. First, efforts to ensure income adequacy remain important even in late life. Others have found that mortality rate changes in England were linked to reductions in spending on income support for low income pensioners (21).  Second, we did not observe a gradient effect. This should be verified in other studies. If true, then efforts to support low income older adults may be more important than redistribution of income across the spectrum of income, at least for mortality-related outcomes. Third, the effects of low income may be mediated through disability. Efforts aimed at restoring functional status may be relevant in low income men. Finally, there is a need for further study in other populations, particularly those with higher rates of income insecurity and in women.

Acknowledgements: The authors would like to thank (posthumously) Dr Francis Mathewson and Dr Ted Cuddy, previous directors of MFUS, and Dr Leon Michaels,  Dr Julia Uhanova, and Dr Christie Macdonald (medical coders.) They would also like to thank the staff, past and present of the MFUS. Most importantly, they would also like to thank the participants of the study for the unwavering support throughout the years.

Financial support: These analyses were funded by the Canadian Institute for Health Research Project Grant Number PJT-152874. The Manitoba Follow-Up Study also received Bridge Funding from the Dean’s Fund (Max Rady College of Medicine, University of Manitoba) and charitable donations from the participants and families of the Manitoba Follow-Up Study. The sponsors had no role in the design and conduct of the study; in the collection, analysis, and interpretation of data; in the preparation of the manuscript; or in the review or approval of the manuscript. The analyses and conclusions are the authors, and no endorsement from funding sources is implied.

Ethical standard: The Manitoba Follow-up Study receives annual approval from the Health Research Ethics Board of the University of Manitoba, and adheres to the Declaration of Helsinki.

References

1.    Graunt J. Natural and Political Observations Made upon the Bills of Mortality London: Royal Society; 1662.
2.    Mari-Dell’Olmo M, Gotsens M, Palencia L, Burstrom B, Corman D, Costa G, et al. Socioeconomic inequalities in cause-specific mortality in 15 European cities. Journal of epidemiology and community health. 2015 May;69(5):432-41. PubMed PMID: 25631857. Epub 2015/01/30. eng.
3.    Chetty R, Stepner M, Abraham S, Lin S, Scuderi B, Turner N, et al. The Association Between Income and Life Expectancy in the United States, 2001-2014. Jama. 2016 Apr 26;315(16):1750-66. PubMed PMID: 27063997. Pubmed Central PMCID: PMC4866586. Epub 2016/04/12. eng.
4.    Huisman M, Read S, Towriss CA, Deeg DJ, Grundy E. Socioeconomic inequalities in mortality rates in old age in the World Health Organization Europe region. Epidemiologic reviews. 2013;35:84-97. PubMed PMID: 23382476. Epub 2013/02/06. eng.
5.    Waldron H. Mortality differentials by lifetime earnings decile: implications for evaluations of proposed Social Security law changes. Social security bulletin. 2013;73(1):1-37. PubMed PMID: 23687740. Epub 2013/05/22. eng.
6.    Hoffmann R. Socioeconomic inequalities in old-age mortality: A comparison of Denmark and the USA. Social Science & Medicine. 2011 2011/06/01/;72(12):1986-92.
7.    Liang J, Bennett J, Krause N, Kobayashi E, Kim H, Brown JW, et al. Old age mortality in Japan: does the socioeconomic gradient interact with gender and age? The journals of gerontology Series B, Psychological sciences and social sciences. 2002 Sep;57(5):S294-307. PubMed PMID: 12198109. Epub 2002/08/29. eng.
8.    Merlo J, Gerdtham UG, Lynch J, Beckman A, Norlund A, Lithman T. Social inequalities in health- do they diminish with age? Revisiting the question in Sweden 1999. International journal for equity in health. 2003 Mar 11;2(1):2. PubMed PMID: 12685938. Pubmed Central PMCID: PMC153479. Epub 2003/04/11. eng.
9.    Makaroun LK, Brown RT, Diaz-Ramirez LG, Ahalt C, Boscardin WJ, Lang-Brown S, et al. Wealth-Associated Disparities in Death and Disability in the United States and England. JAMA internal medicine. 2017 Dec 1;177(12):1745-53. PubMed PMID: 29059279. Pubmed Central PMCID: PMC5820733. Epub 2017/10/24. eng.
10.    St John PD, Tyas SL, Menec V, Tate R. Multimorbidity, disability, and mortality in community-dwelling older adults. Canadian family physician Medecin de famille canadien. 2014 May;60(5):e272-80. PubMed PMID: 24829022. Pubmed Central PMCID: PMC4020665. Epub 2014/05/16. eng.
11.    White CM, St John PD, Cheverie MR, Iraniparast M, Tyas SL. The role of income and occupation in the association of education with healthy aging: results from a population-based, prospective cohort study. BMC public health. 2015 Nov 25;15:1181. PubMed PMID: 26607694. Pubmed Central PMCID: PMC4660771. Epub 2015/11/27. eng.
12.    Arno PS, House JS, Viola D, Schechter C. Social security and mortality: the role of income support policies and population health in the United States. Journal of public health policy. 2011 May;32(2):234-50. PubMed PMID: 21326333. Pubmed Central PMCID: PMC3148579. Epub 2011/02/18. eng.
13.    Statistics Canada.  [April 2, 2018]. Available from: https://www.statcan.gc.ca/pub/11-630-x/11-630-x2016008-eng.htm.
14.    Report of the National Seniors Council on Low Income Among Seniors. Ottawa 2009.
15.    Conference Board of  Canada [April , 2018]. Available from: http://www.conferenceboard.ca/hcp/Details/society/elderly-poverty.aspx?AspxAutoDetectCookieSupport=1.
16.    OECD;  [June 20, 2018]. Available from: https://data.oecd.org/inequality/poverty-rate.htm.
17.    Tate RB, Cuddy TE, Mathewson FA. Cohort Profile: The Manitoba Follow-up Study (MFUS). International journal of epidemiology. 2015 Oct;44(5):1528-36. PubMed PMID: 25064641. Epub 2014/07/30. eng.
18.    Swift AU, Tate RB. Themes from older men’s lay definitions of successful aging as indicators of primary and secondary control beliefs over time: The Manitoba Follow-up Study. Journal of aging studies. 2013 Dec;27(4):410-8. PubMed PMID: 24300061. Epub 2013/12/05. eng.
19.    Demakakos P, Biddulph JP, de Oliveira C, Tsakos G, Marmot MG. Subjective social status and mortality: the English Longitudinal Study of Ageing. European journal of epidemiology. 2018 May 19. PubMed PMID: 29779203. Epub 2018/05/21. eng.
20.    Demakakos P, Nazroo J, Breeze E, Marmot M. Socioeconomic status and health: the role of subjective social status. Social science & medicine (1982). 2008 Jul;67(2):330-40. PubMed PMID: 18440111. Pubmed Central PMCID: PMC2547480. Epub 2008/04/29. eng.
21.    Loopstra R, McKee M, Katikireddi SV, Taylor-Robinson D, Barr B, Stuckler D. Austerity and old-age mortality in England: a longitudinal cross-local area analysis, 2007-2013. Journal of the Royal Society of Medicine. 2016 Mar;109(3):109-16. PubMed PMID: 26980412. Pubmed Central PMCID: PMC4794969. Epub 2016/03/17. eng.

PREVALENCE AND PROGNOSTIC VALUE OF GERIATRIC SYNDROMES IN ELDERLY PATIENTS IN INTERMEDIATE GERIATRIC REHABILITATION UNITS


M. Serra-Prat1, E. Martínez-Suárez2, R. Cristofol Allue2, S.Santaeugènia3, M. Roqué4, A. Salvà4 and the XARESS group


1. Research Unit. Consorci Sanitari del Maresme, Barcelona, Spain; 2. Geriatric Service. Consorci Sanitari del Maresme, Barcelona, Spain; 3. Programa de Prevenció i Atenció a la Cronicitat, Health Department, Catalan Government, Barcelona, Spain; 4. Fundació Salut i Envelliment UAB. Universitat Autònoma de Barcelona, Barcelona, Spain.

Corresponding Author: Mateu Serra-Prat, Research Unit, Hospital de Mataró, Carretera de Cirera s/n, 08304 Mataró, Tel. 93741 77 30, e-mail: mserra@csdm.cat

J Aging Res Clin Practice 2019;8:39-43
Published online May 20, 2019, http://dx.doi.org/10.14283/jarcp.2019.7


Abstract

Background: The prevalence and prognostic value of geriatric syndromes in geriatric rehabilitation units is poorly understood. Objective: To determine the prevalence of geriatric syndromes in intermediate geriatric rehabilitation units and evaluate associations with outcomes and death during admission. Methods: Observational, longitudinal study of patients admitted to 10 intermediate geriatric rehabilitation units in 2015. Admission-to-discharge data were collected retrospectively from a shared minimum data set (CMBD-RSS). The geriatric syndromes considered were dementia, depression, immobility, urinary incontinence, faecal incontinence, instability, insomnia, acute confusional state, terminal illness and pressure ulcers. The main outcome measures were functional status on admission (assessed using the Resource Utilization Group Activities of Daily Living Scale), functional improvement between admission and discharge, length of stay and death during admission. Results: We analysed 5619 patients (mean age 80.2 years; 57.1% women). The mean number of syndromes was 2.3. The most prevalent syndromes were urinary incontinence (62%), dementia (35%), faecal incontinence (35%) and immobility (26%). The presence of each geriatric syndrome increased the risk of functional impairment at discharge (except in the case of insomnia) and of death during admission (except in the case of instability syndrome). Conclusions: Geriatric syndromes are very prevalent in intermediate geriatric rehabilitation units and indicate a lower probability of functional recovery and a greater probability of death during admission.

Key words: Geriatric syndrome, intermediate geriatric rehabilitation unit, mortality, functional capacity.


Introduction

Ageing produces physiological changes and a decrease in the functional reserve of different organs and systems that favours the appearance of geriatric syndromes such as dementia, depression, insomnia, acute confusional state (delirium), falls, pressure ulcers and frailty (1, 2). Geriatric rehabilitation units in intermediate or subacute care facilities offer subacute and postacute care to elderly patients. These patients need treatment or continuous clinical supervision to recover as much autonomy as possible so that they are sufficiently prepared to return to their social and family life (3). They typically have advanced chronic disease and need to complete medical treatment or rehabilitation before they can be discharged (4). The presence of geriatric syndromes in this population could be an indicator of clinical complexity and poorer prognosis. Detection on admission  may help predict functional decline and the risk of unfavourable outcomes, facilitating early planning of care (according to the complexity of each case), length of stay and discharge destination (e.g., home or nursing home) (5). Research in this area, however, is scarce and little is known about the prevalence or prognostic value of geriatric syndromes in this setting (6).
The aims of this study were to determine the prevalence of geriatric syndromes in intermediate geriatric rehabilitation units and to evaluate their association with length of stay, discharge destination, and functional improvement or death during admission.


Material and methods

Design and study population

We conducted an observational, longitudinal study of patients in geriatric rehabilitation units at 10 intermediate care facilities with follow-up data from admission to discharge. The 10 facilities are all part of the Catalan social health research network XARESS. The data were collected retrospectively from a shared minimum data set (CMBD-RSS). The data collection was coded and anonymized. Only patients with complete stays, defined as admission and discharge in 2015, were included. When there was more than one complete stay in this period, the first stay was selected.

Study variables

We applied a previously described methodology (6) to estimate the prevalence and number of geriatric syndromes from data in the CMBD-RSS. A patient was considered to have conditions as follows: dementia, when there was mention of recent or distant memory problems or moderately or severely deteriorated cognitive capacity regarding daily decision-making; depression, when there was mention of tears, expressions of sadness, pain, worry or distress or frequent withdrawal from activities of interest (5–7 days a week); immobility, when there was mention of a need for help or total dependence when in bed; urinary incontinence, when there was mention of occasional, frequent or total bladder incontinence or use of a urinary catheter, diapers or compresses; faecal incontinence, when there was mention of occasional, frequent or total faecal incontinence; instability syndrome, when there was mention of partial or total dependence on assistance with walking around a room or hallway; insomnia, when there was mention of insomnia or a change in regular sleep patterns 5-7 nights a week; acute confusional state, when there was mention of signs of delirium; terminal illness, when there was mention of an end-stage disease; and pressure ulcers, when there was mention of a pressure ulcer of any severity (3).
The main outcome measures were functional capacity on admission, functional improvement on discharge, length of stay, discharge destination and death during admission. Functional capacity was assessed using the Resource Utilization Group’s Activities of Daily Living (ADL) scale (7), which rates the ability to perform nine ADLs according to whether the person is dependent on help, requires assistance, requires supervision or is independent, with higher scores indicating greater functional impairment. ADLs were classified as dependence-ADLs when the patient was coded as being dependent or requiring assistance, and independence-ADLs when the patient was coded as being independent or requiring supervision. The nine ADLs included in the CMBD-RSS were considered. An individual could have anywhere between zero and nine dependence-ADLs on admission and on discharge. Functional improvement was defined as a reduction of one or more in the number of dependence-ADLs between admission and discharge. Patients with no dependence-ADLs on admission and discharge were also included in the functional improvement group. Patients who showed no reduction or change in the number of dependence-ADLs were not considered to have achieved functional improvement.

Data analysis

We estimated the prevalence of each geriatric syndrome and the mean number of geriatric syndromes per patient at admission and calculated the percentages of patients who showed functional improvement and who died during admission. We also evaluated the associations between each geriatric syndrome and the main outcome measures (ADL score on admission, discharge destination, mean length of stay, functional improvement and death). The t-test was used to compare mean length of stay and mean ADL scores between patients with and without each syndrome. Categorical variables (discharge destination, functional improvement [yes/no] and death) were compared using the chi-square test. The effect of each geriatric syndrome on functional improvement or death was assessed by logistic regression analysis, with odds ratios calculated and adjusted for age, sex and care facility. Finally, multivariate logistic regression analysis was performed to identify the best predictors of functional improvement and death during admission. The multivariate models included geriatric syndromes with an odds ratio of greater than 2 in the univariate analysis, in addition to the number of geriatric syndromes and dependence-ADLs on admission, age, sex and care facility. Statistical significance was established at a p-value of less than 0.05.


Results

A total of 5619 patients with complete stays during 2015 were analysed. The mean (SD) age of the sample was 80.2 (10.6) years and 57.1% were women. The overall prevalence of geriatric syndromes was as follows: dementia 35.3%, depression 16.7%, immobility 26.0%, urinary incontinence 62.0%, faecal incontinence 35.5%, instability 15.1%, insomnia 11.4%, acute confusional state 3.9%, terminal illness 5.2%, and pressure ulcers 11.5%. The mean number of syndromes per patient was 2.3 (1.8) and the median was 2 (range, 0–9). There were notable differences in the prevalence of geriatric syndromes between care facilities, with the mean in each one ranging from 1.2 to 3.5. Nevertheless, all the facilities had patients with no geriatric syndromes and some had patients with as many as five.
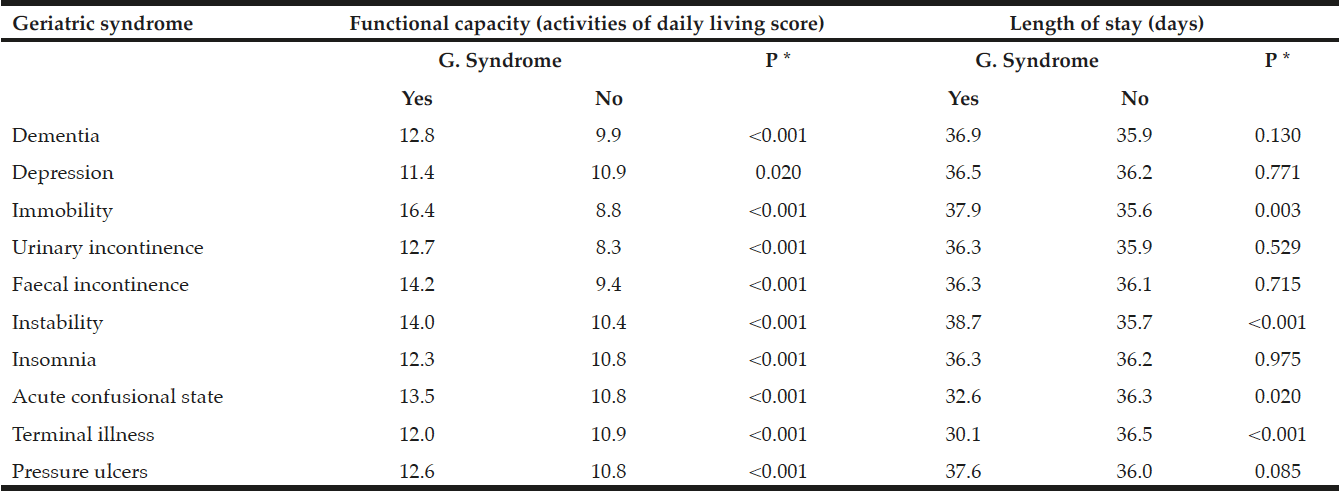
Table 1 shows the prevalence of geriatric syndromes on admission according to discharge destination. Not counting the patients who died during admission, the highest prevalence rates were largely observed in patients discharged to a nursing home or another care facility. Patients discharged to their place of usual residence had a mean of 1.9 (median 2) syndromes compared with 3.1 (median 3) syndromes for those discharged to a nursing home and 3.9 (median 4) syndromes for those discharged to another care facility. Table 2 shows that geriatric syndromes were associated with greater functional impairment on admission and, with the exception of acute confusional state and terminal illness, a longer mean stay.

Table 1 Prevalence of geriatric syndromes on admission to an intermediate care rehabilitation unit according to discharge destination and death during admission

Table 1
Prevalence of geriatric syndromes on admission to an intermediate care rehabilitation unit according to discharge destination and death during admission

Table 2 Functional capacity on admission and length of stay according to the presence or absence of geriatric syndromes

Table 2
Functional capacity on admission and length of stay according to the presence or absence of geriatric syndromes

*P-values correspond to t-test


Overall, 49.2% of patients experienced an improvement in functional capacity between admission and discharge, 46.7% experienced no change and 4.1% experienced deterioration. The number of geriatric syndromes on admission was negatively correlated with the number of ADLs for which an improvement was observed during admission (r=-0.21, p<0.001).
Table 3 shows the association between each geriatric syndrome and functional improvement or death during admission. After adjustment for age, sex and care facility, in almost all cases, the presence of a geriatric syndrome increased the risk of functional impairment (with the exception of insomnia) and of death during admission (with the exception of instability).

Table 3 Association between geriatric syndromes and functional improvement or death during admission

Table 3
Association between geriatric syndromes and functional improvement or death during admission

*Odds ratio adjusted for age, sex and intermediate care facility.


Table 4 shows the multivariate analysis results for the independent effect of each geriatric syndrome on functional improvement and death during admission, after adjustment for the presence and number of other geriatric syndromes, the number of dependence-ADLs on admission, age, sex and care facility. Although not highly prevalent, acute confusional state was the strongest predictor of an absence of functional improvement. After terminal illness, faecal incontinence was the strongest predictor of death during admission.

Table 4 Independent effect of geriatric syndromes on the absence of functional improvement and death during admission

Table 4
Independent effect of geriatric syndromes on the absence of functional improvement and death during admission

ADLs, activities of daily living; OR, odds ratio.


Discussion

Our results point to a high prevalence of geriatric syndromes in intermediate rehabilitation units, with a mean of 2.3 syndromes per patient. The most common syndrome was urinary incontinence, followed by faecal incontinence, dementia and immobility. Our results also show that presence of geriatric syndromes was associated with a poorer prognosis in the form of poorer functional recovery, longer stay, a greater risk of death during admission and a lower probability of being discharged to the home.
Very few studies have evaluated the prevalence of geriatric syndromes in intermediate facilities or, more specifically, in geriatric rehabilitation units (8). Most studies have analysed institutionalized elderly patients in acute care hospitals – a profile of patient that differs somewhat from that of patients in intermediate care facilities. The prevalence rates for depression, pressure ulcers and cognitive impairment are similar to those reported for hospitalized elderly patients (9, 10). The fact that higher rates were observed for immobility, urinary incontinence and faecal incontinence (9, 11) can probably be explained by the strong association between these three conditions and frailty (12, 13), as frail elderly people are more likely to be referred to a rehabilitation unit. The prevalence rates observed for acute confusional state and insomnia were lower than those reported for elderly patients in acute care hospitals (14, 15), indicating that these syndromes are more common in the acute care setting. The rates for the different geriatric syndromes analysed were very similar to those reported for the same care facilities in the XARESS network in 2014 (6).
Geriatric syndromes complicate care and indicate a poor prognosis, so systematic assessment is imperative in ensuring adequate management and planning (5, 16, 17). In all cases, we found geriatric syndromes to be associated with a poorer functional status on admission and a lower probability of improvement during admission. This association was most evident for terminal illness, but it was also strong for immobility, dementia and faecal incontinence. In addition, patients with immobility and instability syndrome had longer stays, probably because their advanced age and greater degree of functional dependence reduced the likelihood of being discharged to their place of usual residence.
Our findings also show that the presence of geriatric syndromes influenced discharge destination. Patients with fewer syndromes were more likely to be discharged to their place of usual residence than to a nursing home or another intermediate care facility. Overall, patients with geriatric syndromes were less likely to achieve functional recovery and were more likely to have longer stays, be transferred to another care facility or die during admission. Like terminal illness, both faecal incontinence and immobility were strong predictors of death during admission. The above findings suggest a need to establish suitable prevention, diagnosis and treatment strategies aimed at improving functional status and survival in patients with geriatric syndromes. Diagnosis and treatment requires a multidisciplinary approach based on a comprehensive geriatric assessment (17). Frailty is characterized by a decrease in the functional reserves of different organs and systems that leads to a state of vulnerability to external aggressions or stressors (18). Multiple studies have identified frailty as a risk factor for falls, disability, dependence, institutionalization and even death (19). This syndrome has also been found to be closely associated with other geriatric syndromes (13, 20), which would explain its prognostic value.
We were unable to assess frailty in our sample and so could not adjust for its effect on the different syndromes. Our study, nonetheless, shows that most of the geriatric syndromes analysed – most especially, immobility, faecal incontinence, terminal illness and pressure ulcers – exerted an independent effect on functional impairment and mortality during admission. The analysis shows that the higher the number of dependence-ADLs on admission, the more likely the patient was to present functional improvement. This apparently paradoxical effect can be explained by the fact that patients with few dependence-ADLs on admission had less room for improvement than patients with more dependence-ADLs, who were more likely to show improvement in at least one ADL.
Very few studies have analysed geriatric syndromes in subacute care facilities or, more specifically, in geriatric rehabilitation units (21). Studies of this nature are of great interest, however, given the distinctive characteristics of patients in these settings. A major strength of our study is that the analysis of a large sample of geriatric patients from 10 intermediate care facilities enhances the external validity of our findings and ensures sufficient statistical power to estimate the impact of geriatric syndromes. As for limitations, the most important is related to the quality of the administrative data in the CMBD-RSS minimum data set, as the variability observed between facilities suggests that certain geriatric syndromes may have been underdiagnosed in some units.
In conclusion, geriatric syndromes are very prevalent in patients admitted to geriatric rehabilitation units and their presence is predictive of a lower probability of functional recovery and a greater probability of death during admission. Assessment and early diagnosis of these syndromes could help in planning care and effective use of health and social resources. More studies, however, are needed in to evaluate the effectiveness of such interventions.


XARESS group: Mireia Bosch, Charo Casas, Laura Coll, Dolors Cubí, Joan Conill, Benito Fontecha, Esther Jovell, María Teresa Molins, Antoni Salvà, Jauma Sanahuja, Pau Sanchez, Sebastià Santaeugènia and Mateu Serra-Prat.

Conflict of interest: The authors declare that they have no conflict of interest in relation with this study.

Ethical Standard: The study was carried out respecting all applicable confidenciality rules.


References

1.    Inouye SK, Studenski S, Tinetti ME, Kuchel GA. Geriatric syndromes: Clinical, research and policy implications of a core geriatric concept. J Am Geriatr Soc. 2007; 55(5): 780–791.
2.    Carlson C, Merel SE, Yukawa M. Geriatric syndromes and geriatric assessment for the generalist.Med Clin North Am. 2015;99(2):263-79.
3.    Santaeugènia SJ, Garcia-Lázaro M. Nuevo Modelo de atención integrada orientada a ancianos ingresados en Unidades de Atención Intermedia en Cataluña: protocolo de una estudio cuasi experimental. Rev Esp Geriatr Gerontol. 2017;52(4): 201-208.
4.    Salva A et al. Descripción del perfil de complejidad de los pacientes admitidos en unidades sociosanitarias de larga estancia entre los años 2003 y 2009.RevEspGeriatGerontol. 2014;49.59-64.
5.    Senn N, Monod S. Development of a Comprehensive Approach for the Early Diagnosis of Geriatric Syndromes in General Practice. Front Med (Lausanne). 2015;2:78. doi: 10.3389/fmed.2015.00078. eCollection 2015.
6.    Santaeugènia SJ, Roqué M, Sánchez P, Salvà A. Complejidad y prevalencia de síndromes geriátricos de los pacientes atendidos en unidades sociosanitarias en Cataluña. Estudio multicéntrico del proyecto XARES. Rev Esp Geriatr Gerontol 2018. https://doi.org/10.1016/j.regg2018.10.006
7.    Romeo S, Gala B, Gómez E. Uso de escalas de valoración en el proyecto de ley de promoción de la autonomía personal y de atención a las personas dependientes. Index Enferm 2006; 15 (54).
8.    Wang H, Niewczyk P, DiVita M, et al: Impact of pressure ulcers on outcomes in inpatient rehabilitation facilities. Am J Phys Med Rehabil 2014;93:207-16.
9.    Garcia T, López JA, Villalobos JA, d’Hyver C. Prevalencia de sindromes geriátricos en ancianos hospitalizados. Med interna Mex 2006; 22(5): 369-74.
10.    McCusker J, Cole M, Dufouil C. The prevalence and correlates of major and minor depression in older medical inpatients. J Am Geriatr Soc 2005; 53: 1344-53.
11.    Remes JM, Sáenz P, Riaño D, et al. Incontinencia fecal en adultos mayores. Rev Investigación Clínica 2004; 56(1): 21-6.
12.    M Cabré, L Elias, M García, E Palomera, M Serra-Prat. Hospitalizaciones evitables por reacciones adversas medicamentos en una unidad geriátrica de agudos. Análisis de 3292 pacientes. Med Clin (Barc), 2018;150(6), 209-214
13.    Serra-Prat M, Papiol M, Vico J, Palomera E, Sist X, Cabré M. Factors associated with frailty in community-dwelling elderly population. A cross-sectional study. Eur Geriatric Med 2016; 7 (6): 531-7.
14.    Chávez-Delgado ME, Virgen-Enciso M, Pérez-Guzman, Celis-de la Rosa M, Castro-Castañeda S. Delirio en pacientes hospitalizados. Rev Med Inst Mex Seguro Soc 2007; 45 (4): 321-8.
15.    Pi-Figueras M, Aguilera A, Arellano M, Miralles R, Garcia-Caselles P, Torres R, Cervera AM. Prevalence of delirium in a geriatric convalescence hospitalization unit: patient’s clinical characteristics and risk precipitating factor analysis. Arch Gerontol Geriatr Suppl. 2004;(9):333-7.
16.    Carlson C, Merel SE, Yukawa M.Geriatric syndromes and geriatric assessment for the generalist. Med Clin North Am2015;99(2):263-79.
17.    Carlson C, Merel SE, Yukawa M.Geriatric syndromes and geriatric assessment for the generalist. Med Clin North Am2015;99(2):263-79.
18.    Morley J, Vellas B, van Kan GA, Anker SD, Bauer JM, Bernabei R, et al. Frailty consensus: a call to action. Journal of the American Medical Directors Association 2013; 14: 392-7.
19.    Vermeiren S, Vella-Azzopardi R, Beckwée D, Habbig AK, Scafoglieri A, Jansen B, Bautmans I; Gerontopole Brussels Study group. Frailty and the Prediction of Negative Health Outcomes: A Meta-Analysis.J Am Med DirAssoc2016;17(12):1163.e1-1163.e17
20.    Tze Pin Ng, Liang Feng, Ma Shwe Zin Nyunt, Anis Larbi, Keng Bee Yap. Frailty in older persons: multisystem risk factors and the frailty risk index (FRI). JAMDA 2014; 15: 635-42.
21.    Esperanza A. et al Evaluation of functional improvement in older patients with cognitive impairment, depression and/or delirium admitted to a geriatric convalescence hospitalization unit. Arch Gerontol Geriatr 2004 (Suppl 9); 149-153.

NUTRITIONAL RISK IN HOSPITALIZED OLDER ADULTS WITH NEOPLASMS


V.  Braga1, J.L. Braga de Aquino2, V.A. Leandro-Merhi3

1. Introduction to Science Grantee, School of Nutrition, PUC-Campinas-SP-Brazil; 2. Professor Doctor, School of Medicine, PUC-Campinas -SP-Brazil; 3. Professor Doctor, School of Nutrition, PUC-Campinas- SP-Brazil.

Corresponding Author: Vânia Ap. Leandro-Merhi, : Pontifical Catholic University of Campinas-SP-Brazil, graduate program in Health Sciences, Puc-Campinas-SP-Brazil, e-mail: valm@dglnet.com.br


Abstract

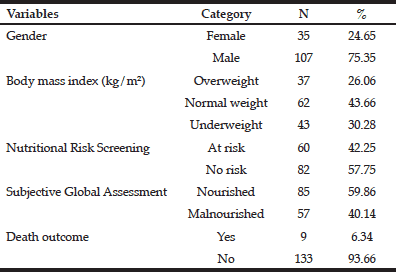
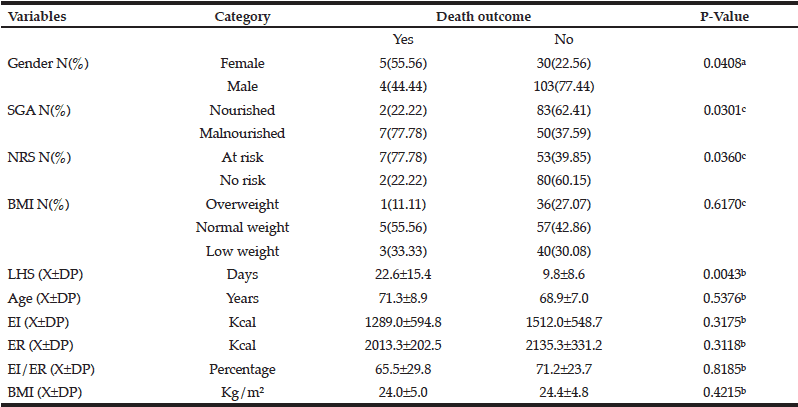
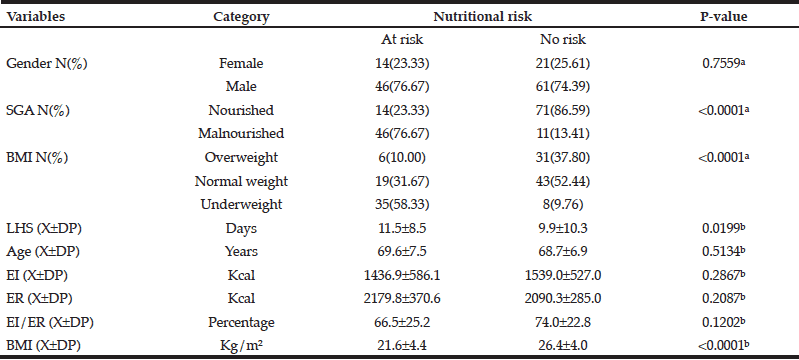
Objective: To investigate nutritional risk in hospitalized older adults with neoplasms. Methods: This cross-sectional study collected the following data from 142 older patients: gender, age, length of hospital stay (LHS), death outcome, and nutritional status indicators, such as body mass index (BMI), nutritional risk screening (NRS), subjective global assessment (SGA), and energy intake. The statistical analyses included the tests chi-square, Fisher’s exact, and Mann-Whitney’s at a significance level of 5%. Results: According to the NRS, 42.25% of the patients were at nutritional risk, and according to the SGA, 40.14% of the patients were malnourished. A total of 6.34% of the patients died. Death outcome was significantly associated with gender (p=0.0408); SGA (p=0.0301); NRS (p=0.0360); and LHS (p=0.0043). Nutritional risk (NRS) was significantly associated with SGA and BMI (p<0.0001), and LHS (p=0.0199). Conclusion: Death outcome was more common in malnourished patients, patients at nutritional risk, and patients with longer LHS. Nutritional risk was associated with malnutrition (SGA), BMI, and longer LHS. Hence, early nutritional care should be provided routinely in the hospital care of hospitalized older patients. 

Key words: Nutritional risk, hospitalized older adults, neoplasms, energy intake, mortality.


Introduction 

The population of older adults has risen nearly globally (1). As longevity increases, so do the demands on health providers, society, and health services (1). Some studies have found a higher mortality rate in older adults with cancer undergoing chemotherapy, especially those who are malnourished or at risk of malnutrition (2).

Low energy intake, weight loss, and reduction of body mass index can further increase the frailty and mortality of hospitalized older patients, creating a vicious circle between malnutrition and mortality (1,3). Saka et al, 2011 (4), found that malnourished patients according to the Nutritional Risk Screening (NRS) had longer hospital stays (4). Another study from Albania found that nutritional risk increased progressively in patients aged ≥ 65 years compared with those aged less than 65 years (5).

The literature attests that no single method can determine the nutritional status of hospitalized older adults. Thus, it is necessary to combine methods, using many nutritional risk indicators, such as anthropometry, subjective global assessment (SGA), NRS, and the mini nutritional assessment (MNA), among others, to diagnose an unsatisfactory nutritional status and help this type of patient to make a nutritional recovery (6, 11). Given these considerations, the objective of the present study was to investigate the nutritional risk of hospitalized older adults with neoplasms. 


Cases and Methods

This cross-sectional study was conducted from August 2014 to June 2015 after approval of the local Research Ethics Committee. The study population consisted of 142 older adults being treated for neoplasms at the Hospital and Maternity Hospital Celso Pierro, of PUC-Campinas-SP-Brazil.

The following data were collected from the medical records of patients being treated for neoplasms: gender, age, length of hospital stay, and death outcome. The nutritional diagnosis was based on nutritional screening indicators, such as the Nutritional Risk Screening (NSR)11, Subjective Global Assessment (SGA) (7), and body mass index (BMI)10. Habitual energy intake in kcalories was also collected. All these data are routinely recorded in the medical records of the institution. The inclusion criteria were: patients who had undergone nutritional assessment within 24 hours of hospital admission, without end-stage disease, and aged ≥ 60 years. The exclusion criteria were: patients with incomplete nutritional status data, patients who did not undergo nutritional assessment shortly after admission, and patients admitted only for clinical investigation and tests. 

The BMI of the study population was classified as recommended by Lipschitz (1994)10, who suggests the following cut-off points: underweight when BMI≤22, normal weight when 22<BMI<27, and overweight when BMI≥27.

The NRS, a method developed by Kondrup et al, 200211 classifies the nutritional risk of hospitalized older patients using the following criteria: weight loss, low energy intake, BMI loss, disease severity, and age. Patients are then classified as being or not at nutritional risk according to their score: at risk when score ≥ 3 and not at risk when score < 3)11.

The SGA model established by Detsky et al 7 investigates the following: clinical history, physical examination, weight loss in the last six months, diet changes, presence of significant gastrointestinal symptoms, assessment of functional capacity, and level of disease-related stress. These items allow the nutritional status classification of patients as follows: well-nourished when score < 7 points; mildly malnourished when 7 ≤ score ≤ 17 points; moderately malnourished when 17 < score ≤ 22 points, and severely malnourished when score > 22 points 7.

Later, habitual energy intake (HEI) was assessed by the patient’s habitual food intake history, analyzing energy intake. The percentage of HEI adequacy was estimated in relation to the energy requirement (ER) of each patient using the equation proposed by Harris & Benedict12. Energy intake was considered low when the percentage of HEI adequacy was less than 75% of the established daily energy requirement (HEI/ER<75%). 

The statistical analysis included a descriptive analysis of the study variables, calculating frequency, percentage, mean, and standard deviation. The chi-square test or Fisher’s exact test when necessary was used for checking for associations or comparing proportions. The Mann-Whitney test compared continuous or ordinal measurements between two groups. The significance level was set at 5% for all tests. 

Results

This study analyzed the variables gender, age, length of hospital stay, energy intake, death outcome, BMI, NRS, and SGA of 142 older patients with neoplasms. The mean age of the sample was 69.1±7.1 years with a mean LHS of 10.6±9.6 days. The mean percentage of HEI adequacy was 70.8±24.0% (energy intake of 1496±552.4 kcal versus an energy requirement of 2128.4±326.0 kcal). The mean BMI of the sample was 24.4±4.8 kg/m². Most patients were male (75.35%) (Table 1) and 43.66% were normal weight. According to the NRS, 42.25% of the patients were at nutritional risk, and according to the SGA, 40.14% of the patients were malnourished. A few (6.35%) patients died.


Table 1 Characteristics of the study population (N=142)


Table 2 compares the study variables and their association with death outcome, which was statistically associated with gender (p=0.0408); SGA (p=0.0301); NRS (p=0.0360); and LHS (p=0.0043). The other study variables, such as BMI, age, and EI, were not associated with death outcome. 


Table 2 Relationship between the study variables and their association with death outcome (N=142)

a. Chi-square test; b. Mann-Whitney test; c. Fisher’s exact test; X±SD: mean and standard deviation; SGA: Subjective Global Assessment; NRS: Nutritional Risk Screening; LHS: Length of hospital stay; EI: Energy intake; ER: Energy requirement; %EI/ER: Percentage of energy intake in relation to the energy requirement; BMI: Body mass index.


Table 3 illustrates the relationship between the study variables and nutritional risk (NRS). NRS was significantly associated with SGA (p<0.0001); with BMI by nutritional status categories (p<0.0001); and with LHS (p=0.0199). Mean BMI along with its standard deviation was also associated with nutritional risk (p<0.0001). The other variables, such as gender, age, EI, ER, and %EI/ER were not associated with nutritional risk (NRS). 


Table 3 Relationship between the study variables and their association with nutritional risk according to the Nutritional Risk Screening (NRS) (N=142)

a. Chi-square test; b. Mann-Whitney test; c. X±SD: mean and standard deviation; SGA: Subjective Global Assessment; NRS: Nutritional Risk Screening; LHS: Length of hospital stay; EI: Energy intake; ER: Energy requirement; %EI/ER: Percentage of energy intake in relation to the energy requirement; BMI: Body mass index.


Discussion

The main results of this study are that nutritional risk (NRS), malnutrition (SGA), being male, and having longer hospital stays are associated with death outcome in older patients. Furthermore, nutritional risk (NRS) was significantly associated with SGA, longer hospital stays, and lower BMI. Almost one-third (30%) of the sample was underweight, 43% was normal weight, and 26% was overweight. Although most patients were normal weight according to their BMI, 26% were overweight, reflecting the impact of the nutritional transition that still occurs in Brazil (13).

Isenring et al, 2003 (14), reported that 65% of their sample was normal weight, 28% was moderately malnourished, and 7% was severely malnourished according to the SGA. The present study found that 59% of the sample was normal weight and 40% was underweight using the same method. The prevalences of normal weight, moderate malnutrition, and severe malnutrition found by another study that used the SGA to assess older cancer patients with a mean age of 70.6±7.8 years were 56.2%, 29.2%, and 14.2%, respectively15. In Chile Pañella et al, 201416, used the SGA to assess 129 patients with a mean age of 60.9±11 years and digestive tract cancer and found that 14.7% were well-nourished, 57.3% were moderately malnourished, and 27.9% were severely malnourished.

A recent study5 assessed 459 patients and found that the risk of malnutrition was higher in patients aged more than 65 years, 82.65% of the deaths involved patients aged 65 years or more, and all patients who died were at nutritional risk (5).

Another study with hospitalized older patients found a mean age of 71.7±8.2 years, mean BMI of 24.5±6.1kg/m2, mean %EI/ER of 71.6±29.9%, and mean LHS of 6.5±6.6 days8 The mean age in the present study was 69.1±7.1 years and mean %EI/ER was 70.8±24%. McLellan et al, 201017, found a mean age of 72.5±8.6 years, while LHS was around 10 days, similar to the LHS found by the present study (LHS = 10.6±9.6 days). In the present study, energy intake was not significantly associated with death outcome or nutritional risk (NRS). In another study McLellan et al, 201018, found that males had higher energy intake than females, and that patients aged 60 years or more had a mean energy intake of 1403.8±563.9 kcal. The mean energy intake found by the present study was 1496±552.4 kcal, very similar to the abovementioned study. Hospitalized older patients have unsatisfactory nutritional status, which may be related to dietary changes (19).

A Mexican study found that 50.2% of the patients were at nutritional risk (NRS) during their hospital stay and that gender, age, weight loss, low food intake, and BMI<20.5kg/m2 had the highest associations with nutritional risk. 

The study data evidence that hospitalized older patients may be at nutritional risk. If diagnosed early, reversion of an inadequate nutritional status could reduce long hospitals stays, disease complications, and mortality. 

Conclusion

Death outcome was more common in malnourished patients, patients at nutritional risk, and patients with longer hospital stays. Nutritional risk was associated with malnutrition (SGA), BMI, and longer hospital stays. Hence, early nutritional care should be inserted routinely in the hospital care of hospitalized older patients. 


Declaration of authorship: All authors collected data, analyzed data, and wrote the article. 

Conflicts of interest: The authors have no conflicts of interest.  

Acknowledgments: The authors thank the Pontifical Catholic University of Campinas (PUC-Campinas) for the opportunity to conduct this study. 


References

1. Agarwalla R, Saikia AM, Baruah R. Assessment of the nutritional status of elderly and its correlates. Journal of Family and Community Medicine 2015; 22(1):39-43.

2. Bourdel-Marchasson I, Blanc-Bisson C, Doussau A, Germain C, Branc JF, Dauba J, Lahmar C, Terrebonne E, Lecaille C, Ceccaldi J, Cany L, Lavau-Denes S, Houede N, Chomy F, Durrieu J, Soubeyran P, Senesse P, Chene G, Fonck M. Nutritional advice in older patients at risk of malnutrition during treatment for chemotherapy: a two-year randomized controlled trial. Plos One 2014; 9(9):1-8.

3. Silva HGV, Andrade CF, Moreira ASB. Dietary intake and nutritional status in câncer patients: comparing adults and older adults.  Nutr Hosp 2014; 29(4):907-912.

4. Saka B, Ozturk GB, Uzun S, Erten N, Genc S, Karan MA, Tascioglu C, Kaysi A. Nutritional risk in hospitalized patients: impact of nutritional status on serum prealbumin. Revista de Nutrição 2011; 24(1):89-98.

5. Shpata V, Ohri I, Nurka T, Prendushi X. The prevalence and consequences of malnutrition risk in elderly albanian intensive care unit patients. Clinical Interventions in Aging 2015; 10:481-486.

6. Santos CA, Rosa COB, Ribeiro AQ, Ribeiro RCL. Patient-generated subjective global assessment and classic anthropometry: comparison between the methods in detection of malnutrition among elderly with câncer. Nutr Hosp 2015; 31(1):384-392.

7. Detsky AS, McLaughlin JR, Baker JP, Johnston N, Whittaker S, Mendelson RA, et al. What is subjective global assessment of nutritional status? J Parenter Enteral Nutr 1987; 11(1):8-13.

8. Leandro-Merhi VA, Aquino JLB, Camargo JGT. Agreement between body mass index, calf circumference, arm circumference, habitual energy intake and the MNA in hospitalized elderly. The Journal of Nutrition, Health & Aging 2012; 16(2):128-132.

9. Dudrick SJ. Nutrition Management of Geriatric Surgical Patients. Surg Clin N Am 2011; 91(4):877-896. 

10. Lipschitz DA. Screening for nutritional status in the elderly. Prim Care 1994; 22(1):55-67.

11. Kondrup J, Allison SP, Elia M, Vellas B, Plauth M. ESPEN guidelines for nutrition screening 2002. Clin Nutr 2003; 22(4):415- 421.

12. Harris JA, Benedict FG. Biometric studies of basal metabolism in man. Proc Natl Acad Sci USA 1918; 4(12):370-373.

13. Batista-Filho M, Anete R. Nutritional transition in Brazil: geographic and temporal trends. Cad Saúde Pública 2003; 19(5):1445-51.

14. Isenring E, Bauer J, Capra S. The scored Patient-generated Subjective Global Assessment (PG-SGA) and its association with quality of life in ambulatory patients receiving radiotherapy. Eur J Clin Nutr 2003; 57(2):305-309.

15. Santos CA, Rosa COB, Ribeiro AQ, Ribeiro RCL. Patient-Generated Subjective Global Assessment and classic anthropometry: comparison between the methodsin detection of malnutrition among elderly with câncer. Nutr Hosp 2015; 31(1):384-392.

16. Pañella L, Jara M, Cornejo M, Lastra X, Conteras MG, Alfaro K, De La Maza MP. Relación entre estado nutricional y evolución postoperatoria, en cirurgía oncológica digestiva. Rev Med Chile 2014; 142:1398-1406.

17. Portero McLellan KC, Staudt C, Silva FRF, Bernardi JLD, Frenhani PB, Leandro-Merhi VA. The use of calf cirumference measurement as an anthropometric tool to monitor nutritional status in elderly inpatients. The Journal of Nutrition, Health & Aging 2010; 14(4):266-270.

18. McLellan KCP, Bernardi JLD, Jacob P, Soares CSR, Frenhani PB, Leandro-Merhi VA. Estado nutricional e composição corporal de pacientes hospitalizados: reflexos da transição nutricional. RBPS 2010; 23(1):25-33.

19. Gaino NM, Leandro-Merhi VA, Oliveira MRM. Idosos hospitalizados: estado nutricional, dieta, doença e tempo de internação. Rev Bras Nutr Clin 2007; 22(4):273-9.

20. Alvarez-Altamirano K, Delgadillo T, García-García A, Alatriste-Ortiz G, Fuchs-Tarlovsky V. Prevalencia de riesgo de desnutrición evaluada con NRS-2002 en población oncológica mexicana. Nutrición Hospitalaria 2014; 30(1):173-178.

SEVERE VITAMIN D DEFICIENCY, FUNCTIONAL IMPAIRMENT AND MORTALITY IN ELDERLY NURSING HOME RESIDENTS

V. Centeno Peláez1, L. Ausín2, M. Ruiz Mambrilla3, M. Gonzalez-Sagrado4, J.L. Pérez Castrillón5


1. Servicio Medicina Interna. Hospital Santos Reyes Aranda de Duero. Burgos. Spain; 2. Residencia de Ancianos Parquesol. Valladolid. Spain; 3. Centro de Rehabilitación y Lenguaje. Valladolid. Spain; 4. Unidad de Investigación. Hospital Universitario Río Hortgea. Valladolid; 5. Servicio Medicina Interna. Hospital Universitario Rio Hortega. University of Valladolid. Spain

Corresponding Author: José Luis Pérez Castrillón, Servicio de Medicina Interna, Hospital Universitario Río Hortega, c/ Dulzaina 2, 47012 Valladolid. Spain, E-mail: castrv@terra.com, Phone: 34983420400, Fax: 34983331566


Abstract

Background: Vitamin D deficiency is independently associated with functional impairment in elderly patients and is an independent risk factor for mortality. Objective: To assess the influence of severe vitamin D deficiency on the functional status, falls, fractures, cardiovascular morbidity and mortality and all-cause mortality in elderly nursing home residents. Design: Non- interventional, prospective, observational study. Setting: Nursing home. Participants: Non-dependent elderly. Measurements: Urea, creatinine, cholesterol, triglycerides, calcium, phosphorus, 25-OH vitamin D, parathyroid hormone (PTH), and cystatin C were determined in blood and microalbuminuria in urine. All patients were administered the Katz Index of Independence in Activities of Daily Living (Katz ADL), the Tinetti Balance and Gait Evaluation, lower extremity function tests and the Mini-Mental State Examination. Patients were divided in two groups: those with 25-hydroxyvitamin D <12.48 nmol/l (severe vitamin D deficiency) and those with 25-hydroxyvitamin D ≥ 12.48 nmol/l. Falls, clinical fractures, and cardiovascular morbidity and mortality and all- cause mortality were recorded during the 20-month follow up. Results: Patients with severe vitamin D deficiency were older (87 ± 7 vs. 83 ± 7 yrs., p = 0.025) and more often female (96% vs 4%, p = 0.028) and had lower levels and calcium and albumin and higher levels of PTH, a higher frequency of heart disease (p = 0.02), and worse lower extremity function: Tinetti gait (10 ± 2.39 vs 11.21 ± 1.44, p = 0.034), Tinetti balance (1.83 ± 1.11 vs 2.5 ± 1.19, p = 0.011). These patients had a non-significant higher number of falls and clinical fractures, and significantly greater mortality (29% vs 2%, p = 0.01). Conclusions: Non-dependent elderly nursing home residents with severe vitamin D deficiency have greater mortality, functional impairment of the lower extremities and a trend to a greater number of falls and clinical fractures.

Key words: Mortality, vitamin D, cardiovascular morbidity.


Introduction

Vitamin D levels have been associated with muscle function, with low levels increasing the risk of falls and fractures (1). Low levels of 25-hydroxyvitamin D (25(OH) D) have been associated with an increased risk of falls in institutionalized elderly patients, with 25(OH)D levels < 40 nmol/l associated with reduced lower extremity function, while optimal function is obtained when levels are > 90-100 nmol/l: levels > 60nmol/l are associated with a 20% reduction in the risk of falls (2). Studies have shown that vitamin D (800 IU of vitamin D3 daily) and calcium supplements reduce the risk of falls (3), although single high doses of vitamin D may increase the risk (4).

There is considerable evidence of the role of vitamin D in cardiovascular disease: studies have shown a relationship with hypertension (5, 6), coronary disease (7, 8), cerebrovascular disease (9), heart failure (6), vascular disease (10) and, specifically, peripheral arterial disease (11), in addition to a relationship with renal disease (5). In addition, vitamin D deficiency has also been associated with increased mortality, especially cardiovascular mortality. A study in postmenopausal Japanese women examined the relationship between low 25(OH)D levels and low bone mineral density with increased mortality (12) and check estrace price comparison and read estrace reviews before you showed that 47% of patients had low levels of vitamin D and that the most frequent causes of death were cardiovascular events (28%) and cancer (21%). A study in Caucasian southern Californian adults evaluated the relationship between 25-hydroxyvitamin D, 1,25-dihydroxyvitamin D and parathyroid hormone (PTH) with cardiovascular mortality. The study found that 14% of patients had levels of 25(OH)D < 75 nmol/l and 3% had levels < 50 nmol/l. High levels of 1,25-dihydroxyvitamin D had a protective effect on cardiovascular mortality, while high PTH levels increased the risk of cardiovascular disease. After adjusting for age and multiple covariates (including renal function) no significant association between 25-hydroxyvitamin D, 1,25-dihydroxyvitamin D, PTH and cardiovascular mortality was found (13). Another study evaluated the effects of low levels of calcitriol as a predictor of mid-term mortality in patients attending a specialized heart disease centre and found that low calcitriol levels were a predictor of mid-term mortality (14) and that 67% of patients with low levels had heart failure, 64% hypertension, 33% coronary artery disease, 20% diabetes and 17% renal failure after a one-year follow up. In contrast, other authors suggest that, although observational studies have shown an association between low levels of 25(OH)D and a wide range of acute and chronic disorders, there are no causal data that indicate vitamin D levels are a marker of disease (15).

The aim of this study was to assess the influence of severe vitamin D bleeding after cheap prednisone no prescription, or after a stomach operations can be in a gleam of deficiency on the functional status, falls and fractures, cardiovascular morbidity and mortality, and all-cause mortality in elderly nursing home residents.


Materials and Methods

We made a non-interventional, prospective, observational cohort study in non-dependent elderly residents of the Parquesol nursing home (Valladolid). Inclusion criteria were age ≥ 80 and residence in the nursing home. Exclusion criteria were people who were bedridden or had diminished mobility that precluded functional testing and those who did not wish to participate.

At inclusion, blood was extracted from all participants and a urine sample was collected. Samples were collected between 8 and 9 am and were processed immediately. Samples were deposited as serum (1 ml) and plasma (1 ml). The following determinations were made: urea, creatinine, total cholesterol, triglycerides, glucose, calcium, phosphorous and microalbuminuria using a Hitachi 917 automated analyser. Parathyroid hormone (PTH) was measured by electrochemiluminescence (® Roche Diagnostics GmbH, Mannheim, Germany), 25(OH) D3 by high performance liquid chromatography and cystatin C (a marker of renal function deterioration) by immunonephelometry (N Latex Cistatina C, Siemens Marburg GmbH, Germany). The presence of cardiovascular diseases and treatments were also recorded. Falls were recorded for 20 months using the nursing home’s own protocol. Clinical fractures and mortality were also recorded. Patients were divided in two groups: those with 25-hydroxyvitamin D <12.48 nmol/l (severe vitamin D deficiency) and those with 25-hydroxyvitamin D ≥ 12.48 nmol/l.

Independence was measured using the Katz Index of Independence in Activities of Daily Living (Katz ADL) (16). The Tinetti Balance and Gait Evaluation was used to detect the risk of falls (17, 18). Lower extremity function was evaluated by examining the ability to stand with the feet together in the side-by-side, semi-tandem, and tandem positions, time to walk 8 feet, and time to rise from a chair and return to the seated position 5 times. These tests are predictors of falls, disability, institutionalization and death (19, 20). For accuracy, these tests were made using a Van Allen chronometer and a 3-metre tape measure

The study was approved by the Clinical Research Committee of the Hospital Universitario Río Hortega. Patients or their representatives gave written informed consent to participate in the study.


Stastistical analysis

The results are expressed as mean ± standard deviation. Comparisons of the mean were made using the paired t-test and the Mann-Witney non-parametric U test. Correlations between variables were assessed using Pearson’s r test and Spearman’s test. Mortality during the follow up period were assessed by logistic regression analysis: the variables included were the median age of the study sample, sex and variables that were significant in the bivariate analysis. Statistical significance was established as p ≤ 0.05. The analysis was made using SPSS for Windows v. 15.0 (SPSS Inc. 1989-2006 Chicago IL, USA).


Results

Of the 183 institutionalized patients, 80 met the inclusion criteria, and levels of vitamin D were finally measured in 74 patients who were included in the final analysis. All had very low 25(OH)D levels, with a mean of 18.40 ± 7.58 nmol/L, a minimum of 9.10 and a maximum of 36.80 nmol/L. Twenty-four patients had 25(OH)D levels < 12.48 nmol/L and 50 had levels > 12.48 nmol/L.

Of the 74 patients analysed, 59 (79.7%) were female, the mean age was 84 ± 7 years and the mean body mass index was 29 ± 5 kg/m2. Patients with 25(OH)D levels < 12.48 nmol/L were older (87 ± 7 vs 83 ± 7, p = 0.025) and more often female (96% vs. 4%, p = 0.028) than patients with 25(OH)D levels > 12.48 nmol/L.

Patients with 25(OH)D levels < 12.48 nmol/L had significantly lower calcium and albumin levels and significantly higher levels PTH levels (Table 1).The presence of heart disease, the number of heart diseases, and treatment with nitrates was more frequent in patients with 25(OH)D levels < 12.48 nmol/L. (Table2).


Table 1 Biochemical variables according to vitamin D levels

Table 1: Biochemical variables according to vitamin D levels


Table 2 Cardiovascular disease and therapy according to vitamin D levels

Table 2: Cardiovascular disease and therapy according to vitamin D levels


No significant between-group differences in the Katz index were found (58.3% vs 73.5%, p = NS). Significant differences were found in the Tinneti gait and balance tests (Table 3). Falls (82.6% vs 62.5%, p = NS) and fractures (17.4% vs 12.5%, p = NS) were more frequent in patients with 25(OH)D levels < 12.48 nmol/L during the 20 months follow up, but the differences were not significant. Mortality during the follow-up was significantly higher in patients with 25(OH)D levels < 12.48 nmol/L (29% vs 2%, p. = 0.001). Cystatin C (a marker of renal function and cardiovascular risk) was significantly higher in patients who died during the follow up compared with survivors (1.33 ± 0.31 vs 1.04 ± 0.25, p = 0.001).


Table 3 Functional tests according to level of vitamin D

Table 3: Functional tests according to level of vitamin D


The following variables were entered into the logistic regression analysis to assess the factors that independently predicted mortality: age, sex, vitamin D and cystatin C. Only vitamin D levels <12.48 nmol/L (19.7, p = 0.024, 95% CI 1.48-261.53) remained as an independent factor of mortality (Table 4).


Table 4 Logistic regression and mortality

Table 4: Logistic regression and mortality


Discussion

The patients included in this study had very low levels of 25(OH)D: all patients had vitamin D insufficiency and most had vitamin D deficiency. Possible explanations may include the time of sample taking (May), and the patients were nursing home residents with less exposure to sunlight, or that the nutritional intake of vitamin D was not sufficient. Levels of 25(OH)D were lower than that found in a study of elderly female nursing home residents in Lleida (Spain) which found that 90% of patients had 25(OH) levels < 50 nmol/L and 47% had levels < 25 nmol/L, although samples were collected in late summer (21).

Patients with 25(OH)D < 12.48 nmol/L were significantly more often female and significantly older, and had significantly higher levels of PTH, which could explain the greater morbidity and mortality in these patients, and significantly lower levels of calcium and albumin.

Patients with 25(OH)D levels < 12.48 nmol/L had significantly more previous heart disease, and non- significantly higher levels of other cardiovascular diseases and risk factors. Patients with 25(OH)D levels < 12.48 nmol/L had a significantly higher level of nitrates. Greater nitrate consumption in this group could act as a protective factor against fractures and might explain why no significant differences in the number of fractures between groups were found (22). As stated in the introduction, 25(OH)D levels < 50 nmol/l have been associated with an increased prevalence of coronary artery disease (7, 8 ) and lower levels of 25(OH)D have been found in patients with heart failure compared with the healthy population (6).

Patients with 25(OH)D levels < 12.48 nmol/L had a greater degree of dependence. Although no significant differences were found for the Katz index, patients with 25(OH)D levels < 12.48 nmol/L had significantly worse scores in the Tinetti gait and balance tests, signifying worse function. Severe 25(OH)D deficiency has been related to muscle weakness (1), and levels < 40 nmol/L have been associated with reduced lower extremity function (2). A higher level of dependency and loss of function predisposes to an increased risk of falls and fractures, which were miscellaneous short takes: biogen reports no no  very common in both study groups, but more frequent in patients with 25(OH)D levels < 12.48 nmol/L, although the differences were not statistically significant, possibly because both groups had very low levels of vitamin D. Various studies have shown an association between vitamin D deficiency and impaired physical function in nursing home residents, although these studies found a higher level of vitamin D than those observed in our subjects, and the follow-up periods differed (23-25). However, not all studies are in agreement. Mathei et al (26) found no such association even though 35% of the 367 subjects studied had a severe vitamin D deficiency.

There was significantly greater mortality in patients with 25(OH)D levels < 12.48 nmol/L (29.2% vs. 2%). In a study of subjects with a similar age to ours, Formiga et al (27) found no association between mortality and vitamin D levels.

Patients who died had significantly higher cystatin C levels. As stated above, cystatin C is a marker of renal function and cardiovascular risk and increased levels increase the risk of all-cause mortality and linearly increase the risk of cardiovascular mortality (28).

The main limitations of our study are the small sample size and the fact that all patients had low levels of vitamin D. The strengths of the study are the uniformity of the population studied and the complete record of falls and fractures.

In conclusion, severe vitamin D deficiency in was an independent risk factor for mortality in elderly nursing home residents, as shown by other reports (13, 14). However, our study shows that severe vitamin D deficiency was independently associated with functional impairment in elderly patients, predisposing them a higher number of falls.


References

1. Rosen CJ. Vitamin D Insufficiency. N Engl J Med 2011; 364:248-254.

2. Bischoff-Ferrari HA, Dawson-Hughes B, Willett WC et al. Effect of vitamin D on falls: a meta-analysis. JAMA 2004; 291: 1999-2006.

3. Holick MF. Vitamin D Deficiency N Engl Med 2007; 357:266-281.

4. Sanders KM, Stuart AL, Williamson EJ, et al. Annual high dose vitamin D and falls and fractures in older women: a randomized controlled trial. JAMA 2010; 303: 1815-1822.

5. Zittermann A, Gummert JF. Nonclassical Vitamin D Actions. Nutrients 2010; 2: 408-425.

6. Zittermann A. Vitamin D and disease prevention with special reference to cardiovascular disease. Prog Biophys Mol Biol. 2006; 92:39-48.

7. Kim DH Sabour S, Sagar UN, et al. Prevalence of hypovitaminosis D in cardiovascular diseases (from the National Health and Nutrition Examination Survey 2001 to 2004) Am J Cardiol 2008;102:1540-4.

8. Kendrick J Targher G, Smits G, Chonchol M. 25-hydroxyvitamin D deficiency is independently associated with cardiovascular disease in the Third National Health and Nutrition Examination Survey. Atherosclerosis 2009; 205:255-260.

9. Michos E. D, Reis JP, Post WS et al. 25-Hydroxyvitamin D deficiency is associated with fatal stroke among Whites but not Blacks: The NHANES-III linked mortality files. Nutrition 2012; 28: 367–371.

10. Zittermann A, Schleithoff SS, Reiner K. Vitamin D and vascular calcification. Curr Opin Lipidol 2007; 18:41-46.

11. Fahrleitner-Pammer A, Obernosterer A, Pilger E et al. Hypovitaminosis D, impaired bone turnover and low bone mass are common in patients with peripheral arterial disease. Osteoporos Int. 2005; 16: 319-324.

12. Kuroda T, Shiraki M, Tanaka S, Onta H. Contributions of 25-hydroxyvitamin D, comorbidities and bone mass to mortality in Japanese postmenopausal women. Bone 2009; 44: 168-172.

13. Jassal S. K, Chonchol M, von Mühlen D, Smits G, Barrett- Connor E. Vitamin D, Parathyroid Hormone, and Cardiovascular Mortality in Older Adults: The Rancho Bernardo Study. The American Journal of Medicine 2010; 123: 1114- 1120.

14. Zittermann A, Schleithoff SS, Frisch S et al. Circulating Calcitriol Concentrations and Total Mortality. Clinical Chemistry 2009; 55: 1163-1170.

15. Autier P, Boniol M, Mullie P (2014). Vitamin D status and ill health: a systematic review. Lancet Diabetes Endocrinol 2014;2:76-89.

16. Katz S, Ford AB, Moskowitz RW, Jackson BA, Jaffe MW. Studies of illness in the aged. The index of ADL: a standardized measure of biological and psychosocial function. JAMA 1963; 185: 914-919.

17. Roqueta C, De Jaime E, Miralles R, Cervera AM. Experiencia en la evaluación del riesgo de caídas. Comparación entre el test de Tinetti y Timed Up &Go. Rev Esp Geriatr Gerontol 2007; 42:319-327.

18. Lázaro del Nogal M, González-Ramírez A, Palomo-Lloro A. Evaluación del riesgo de caídas. Protocolos de valoración clínica. Rev Esp Geriatr Gerontol 2005; 40(Supl 2): 54-63.

19. Guralnik JM, Simonscik EM, Ferrucci et al. A short physical performance battery assessing lower extremity function: association with self-reported disability and prediction of mortality and nursing home admission. J Gerontol. 1994;49: M85-94.

20. Guralnik JM, Ferrucci L, Simonsick EM, Selive ME, Wallace RB. Lower- extremity function in persons over the age of 70 years as a predictor of subsequent disability. N Engl J Med 1995; 332:556-561.

21. Martin Portela M. A. L, Mónico A. Comparative 25-OH-vitamin D level in institutionalized women older than 65 years from two cities in Spain and Argentina having a similar solar radiation index. Nutrition 2010; 26: 283–289.

22. Jamal SA, Reid LS, Hamilton CJ. The effects of organic nitrates on osteoporosis: a systematic review. Osteoporos Int 2013;24: 763-770.

23. Diekmann R, Winning K, Bauer JM et al. Vitamin D status and physical function in nursing home residents: a 1-year observational study. Z Gerontol Geriatr 2013; 46: 403-9.

24. Kojima G, Tomai A, Meseki K et al. Prevalence of vitamin D deficiency and association with functional status in newly admitted male veteran nursing home residents. J Am Geriatr Soc 2013; 61: 1953-7.

25. Houston DK, Tooze JA, Davis CC et al. Serum 25-hydroxivitamin D and physical function in older adults: the Cardiovascular Health Study All Stars. J Am Geriatr Soc 2011; 59: 1793-1801.

26. Mathei E, Van Pottelberg C, Bees B, Adriaensen W, Gruson D, Degryse JM. No relation between vitamin D status and physical performance in the oldest old: results from the Belfroid study. Age Ageing 2013; 42: 186-190.

27. Formiga F, Ferrer A, Mejido MJ, Boix L, Contra A, Puyol R, Octabaix study members. Low serum vitamin D is not associated with an increase of mortality in oldest old subjects: the Octabaix three-year follow-up study. Gerontology 2014: 60: 10-15.

28. Shastri S, Katz R, Rifkin DE et al. Kidney Function and Mortality in Octogenarians: Cardiovascular Health Study All Stars. J Am Geriatr Soc 2012; 60:1201–1207.