T. Neves1,3, M. Bomfim Martin Lopes2, M.G. Crespilho Souza3, E. Ferriolli4, C.A. Fett3, W.C. Rezende Fett3
1. Department of Physical Education, University of the State of Mato Grosso, Diamantino, MT, Brazil; 2. Department of Physical Education, Physical Education College, IPE Faculty of Technology, Cuiabá, MT, Brazil; 3Department of Physical Education, Nucleus of Studies in Physical Fitness, Computers, Metabolism, and Sports and Health, Federal University of Mato Grosso, Cuiabá, MT, Brazil; 4. Department of Internal Medicine, Faculty of Medicine of Ribeirão Preto, University of São Paulo, Ribeirão Preto, SP, Brazil.
Corresponding Author: Thiago Neves, Department of Physical Education, University of the State of Mato Grosso, 166, Rui Barbosa Street, Eldorado Garden, ZIP Code 78.400-000, Diamantino, MT, Brazil, E-mail address: thiago.alimt@gmail.com. Telephone: +5565-99957-9709. Fax: +55653336-1446.
J Aging Res Clin Practice 2018;7:60-68
Published online April 5, 2018, http://dx.doi.org/10.14283/jarcp.2018.12
Abstract
Background: The magnitude of “Sarcopenia” and “Dynapenia” as a public health problem is not well established, nor is the relationship of declines strength and muscle mass to physical disability and/or loss of mobility. Objectives: Test the hypothesis that the elderly with sarcopenia are more likely to physical disability than are those with dynapenia. Design: Cross-sectional study. Setting/Participants: A total of 387 older adults (≥65 years old) from the FIBRA Study in Cuiabá, Mato Grosso, Brazil. Measurements: Sarcopenia was diagnosed according to the European Working Group on Sarcopenia in Older People (EWGSOP), which includes the presence of low muscle mass, plus low muscle strength or low physical performance. Dynapenia was defined as handgrip strength <30kgf (men) and <20kgf (women). Data relating to socio-demographic, behavioral, health conditions, physical disability, the level of physical activity, body composition, hand grip strength and the Short Physical Performance Battery were collected. Results: Regarding the loss of mobility, sarcopenia was associated with age ≥75 years, female, sedentary lifestyle, stroke, arthritis, and falls (OR = 2.95, 95% CI: 1.07 – 8.09); with no association for physical disability in BADL and IADL. Dynapenia had no association with loss of mobility; however, for disability in BADL and IADL, it was associated with the elderly aged ≥80 years old and arthritis (OR = 2.35, 95% CI: 1.42 – 3.88). Conclusion: Dynapenia is more sensitive to the prevention of future self-reported physical disability, in comparison to sarcopenia which can be used in clinical practice as a screening tool for the early decline in mobility..
Key words: Physical disability, mobility, activities of daily living, sarcopenia, dynapenia.
Introduction
Physical disability usually occurs in older adults, and it is estimated that 20% to 30% of individuals over 70 years old have difficulties in performing basic and instrumental activities of daily living that require mobility and locomotion. Sarcopenia, which is defined as the loss of muscle mass associated with the presence of low muscle function (strength or physical performance), is one of the main causes of mobility loss and disability related to aging (1–4).
Sarcopenia is a syndrome characterized by the progressive and widespread loss of skeletal muscle mass and strength related to the age, leading to the risk of adverse outcomes, such as physical disability, poor quality of life and death (1). Complementary to the definition of sarcopenia, the recent discussion is that the decline in muscle strength can be given to a combination of muscular and neural factors and not only to reduced muscle mass, so recent questions about the inclusion of muscle mass and strength in the same concept (1, 5, 6).
Recently, results from some studies that analyzed muscle strength and muscle mass and their effect in physical disability, finding that muscle strength is a better predictor of disability (5). Dynapenia is the age-associated loss of muscle strength (5) and premature death (7,8). Thus, the term “dynapenia” was created to describe the functional impairment of the entire neuromuscular apparatus, and it was also claimed that sarcopenia has its original definition limited to the decline in age-related skeletal muscle mass (9). There is no evidence that the definition of sarcopenia has clinical importance (6), but this term attempts to achieve its widespread use. The proposal of the term dynapenia focuses on the aspect of performance seeking to overcome this dichotomy. However, some authors do not agree with the distinction between the terms “dynapenia” and “sarcopenia”, due to the risk of confusion between the nomenclatures (1).
The Fragility in Brazilian Elderly Research Network (FIBRA Network) was designed and developed to investigate and survey data on the prevalence, characteristics, and risk profiles for the biological fragility syndrome, among other syndromes in Brazilian elderly population. This study was performed with urban residents in localities with different levels of human development, in different geographic regions, considering socio-demographic, anthropometric, physical health, physical and mental functionality, and psychological variables (10).
Therefore, this study aimed to test the hypothesis that the elderly with sarcopenia (loss of physical performance and muscle mass) are more likely to physical disability and comorbidities than those with dynapenia (loss of physical performance).
Materials and methods
Participants
This research is a subproject of the Fragility in Brazilian Elderly Research Network (FIBRA Network) and consists of an exploratory cross-sectional multidisciplinary and multicentric population-based study, conducted in the period between 2009 and 2010 in 17 Brazilian regions selected by the criterion of quota sampling, with different indices of human development.
Regarding the present study, 513 elderly residents in the urban area of Cuiabá (Mato Grosso State, Brazil) were interviewed through registration forms from the census database of the IBGE, which registered 17,329 older adults. Participants aged under 65 years, or with severe mental retardation, severe or unstable Parkinson’s disease, terminal stage; amputations, and severe orthopedic limitations were not considered in this study.
Thus, only 387 older adults met all the inclusion criteria and completed all the evaluation stages of this study. All participants were previously informed about the study proposal and procedures they would be submitted to. Then they were asked to sign a consent form, approved by the Research Ethics Committee (protocol No. 196/96 CNS, approval number 632/09) of the Hospital Universitário Júlio Müller of the Federal University of Mato Grosso (HUJM-UFMT).
Anthropometric measurements
The body mass of the volunteers was determined using an electronic platform scale (ID 1500, Filizola®, Brazil) with a capacity of 200 kg and a precision of 0.1 kg. The elderly stood up in the middle of the platform scale, with their feet joined and arms along the body. Their height was measured with their body in an upright position, in bare feet, joined and close to the scale, using a portable stadiometer (Sanny®, Profissional model, Brazil) with a precision of 0.1 cm.
The body mass index was calculated by dividing the weight (in kilograms) by the squared height (in meters) (kg/m2). The reference values adopted for the body mass index were those suggested and suitable for the elderly, who are categorized in: <22.0 kg/m² = low weight, from 22.0 kg/m² to 27.0 kg/m² = eutrophic, and >27.0 kg/m² = excess weight (11). The circumferences of the abdomen (AC), waist (WC), calf (CC) and hip (HC) were measured using a flexible and inextensible plastic metric tape (Sanny®, Brazil) with a precision of 0.1 cm. The reference values for AC were ≥94.0 cm for men and ≥80.0 cm for women (12). The CC was used to verify the nutritional status, considering well-nourished those elderly who presented values ≥31 cm, for both genders (13).
Diagnosis and Classification of Sarcopenia
Sarcopenia was diagnosed according to consensus of the European Working Group on Sarcopenia in Older People (EWGSOP), which recommends the use of low muscle mass accompanied by low muscle function (strength or physical performance) for the diagnosis of sarcopenia (1). Thus, the diagnosis of sarcopenia in the present study sample required the confirmation of low muscle mass, in addition to the reduced muscle strength or poor physical performance (Figure 1).
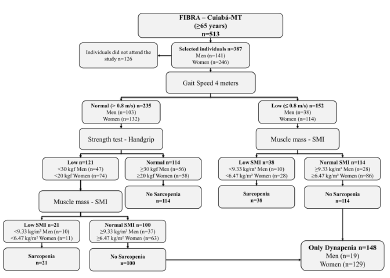
Profile of the study using the consensus of the European Working Group on Sarcopenia in Older People (EWGSOP), suggested in case you find sarcopenia in older individuals. SMI = skeletal muscle mass index obtained by the absolute mass of the skeletal muscles divided by squared height in meters (kg/m²)
Skeletal Muscle Mass Measurement
Muscle mass was estimated by skeletal muscle mass (SMM), using the mathematical equation of Lee (14).
SMM (kg) = 0.244 x body mass + 7.8 x height + 6.6 x gender – 0.098 x age + ethnicity – 3.3
The body mass was determined in kilograms and the height measured in meters. The age (years), gender (1 for men and 0 for women), race (-1.2 for Asians, 1.4 for Afro-descendants, and 0 for Caucasians) were also considered.
This equation was validated in the Brazilian population using the dual energy X-ray (DXA) method, and there was a high correlation between the methods (r = 0.86 for men and r = 0.90 for women, p<0.05). Moreover, there was a strong correlation between DXA and the predictive equation to determine the prevalence of sarcopenia (k = 0.74, p<0.001), with a high specificity (89%) and sensitivity (86%) (15).
The absolute skeletal muscle mass was converted to a skeletal muscle mass index (SMI), divided by squared height (kg/m2). The SMI was used to adjust the height and mass of non-skeletal muscle tissues, being used in several epidemiological studies (16, 17). The low muscle mass was defined by the SMI, with the cut-off point based on 20% of the lowest percentile of the population distribution, representing an SMI of ≤6.47 kg/m2 for women and ≤9.33 kg/m2 for men (16).
Muscle Strength Measurement
Muscle strength was evaluated by the hand grip strength, using a manual hydraulic dynamometer (Saehan Corporation®, Model SH5001, 973, Yangdeok-Dong, Masan 630-728, Korea). For this measurement, the elderly sat on an armless chair, and were positioned with the elbow flexed at 90°; shoulder adducted, forearm in a neutral position, and the wrist between 0° and 30° of extension. Three successive measurements were performed (at about 15 seconds between each one), and the best score of three trials was recorded for analysis. Cut-off values with a hand grip strength less than 30 kgf in men and 20 kgf in women were considered to represent low muscle strength (1, 4).
Four-Meter Walking Test
The gait speed (meters/second) was determined by assessing the low physical performance of the lower limbs by the 4-meter walking test (4mWT) of the Short Physical Performance Battery (SPPB) (18). The average walking speed of the elderly was calculated by dividing the walking distance by the time spent in the test. The cut-off point of ≤0.8 m/s was used to identify low physical performance (1,4).
Loss of mobility
Loss of mobility was evaluated through the Short Physical Performance Battery (SPPB) (18), which is an instrument composed of three tests that evaluate, in sequence, the standing static balance, gait speed in usual step (measured in two times in a certain round-trip route of 4 meters) and the muscle strength of the lower limbs by the movement of standing up from and sitting down on a chair five consecutive times. The SPPB test is scored on a 0–12 scale, with higher scores indicating a higher functional level. The elderly who scored ≤7 points were considered at risk for mobility loss, because of their clinical relevance was associated with the triage of the elderly at risk of developing future disabilities, in addition to being objective, standardized and multidimensional. The variable of risk for loss of final mobility was dichotomous. A score of 0 indicates a higher functional level (>7 points in the SPPB) and 1 indicates a risk for mobility loss (≤7 points in the SPPB) (19).
Diagnosis and Classification of Dynapenia
Measures of upper extremity muscle strength were isometric shoulder adduction and handgrip. We selected the handgrip for the present analysis because the assessment of handgrip is easy, reliable, and inexpensive. Using the cut-off points indicated the Dynapenia was defined using the criteria with a hand grip strength less than 30 kgf in men and 20 kgf in women, considering with dynapenia those who exclusively lost only muscular strength (1, 4). Included in the classification individuals who had only loss of muscle strength (Figure 1).
Functional capacity
The functional capacity of the elderly for the basic activities of daily living (BADL) and instrumental activities of daily living (IADL) was evaluated by the Katz scale (20) and Lawton & Brody scale (21), respectively. Interviewees were asked if they had difficulties in performing the BADL (transfer, go to the bathroom, take a bath, urinary continence, get dressed, and eat) and the IADL (use a telephone, use mean of transportation, do/go shopping, cook, do light housework, do heavy housework, take medicines, and manage their money). The respondents who indicated difficulty or deficiency in performing one or more of the tasks were classified as having physical disability both in BADL and IADL. The final physical disability variable was dichotomous. A score of 0 indicates no limitation in BADL and IADL, whereas 1 indicates any limitation in BADL and/or IADL.
Physical Activity Level
The assessment of physical activity level was defined using self-report on weekly frequency and the daily duration of physical exercises, active sports, and domestic activities carried out in the week prior to the evaluation, based on items from the Minnesota Leisure Time Activity Questionnaire (22), validated for Brazil (23). For this research, the content, statements, and sequence of the questionnaire items were adapted to the study conducted by the FIBRA Network. Items describing common activities among the Brazilian elderly were kept, and questions on frequency and duration were included, intending to enrich the information on the regularity of the activity practices (if they had been practiced in the last 14 days).
The questionnaire was composed of 42 closed yes or no questions. Each dichotomous answer was followed by other questions about the continuity of activities during the evaluated period (if the elderly had performed each activity in the last two weeks), weekly frequency (how many days in a week) and duration (how many minutes a day).
The elderly who performed at least 150 minutes of weekly moderate-intensity physical activity, or 120 minutes of vigorous-intensity physical activities, following the recommendations of the American College of Sports Medicine (ACSM) and American Heart Association (AHA) (24), were considered active.
Geriatric Depression Scale (GDS)
The depressive symptoms were evaluated using the short version (15 items) of the Geriatric Depression Scale (GDS) (25). These items, together, showed a good diagnostic accuracy, with adequate sensitivity, specificity, and reliability, and can be an alternative for triage mood disorders in the elderly population. Participants with a score of ≥6 in the GDS were considered as having depressive symptoms.
Statistical analysis
The data were analyzed by using the Statistical Package for Social Sciences (SPSS for Windows, version 20.0). The Kolmogorov-Smirnov test was used to verify the normality of the independent variables. The descriptive statistics were presented as mean, standard deviation, median, and minimum – maximum; sample distribution was described, and the prevalence of sarcopenia and dynapenia of the population sample was calculated. For the independent samples, the T-student test was used if the data were parametric and the Mann-Whitney test if the data were non-parametric, and the chi-square test was used to examine the differences in the basic characteristics between the two groups. Values of p≤0.05 were considered significant.
Multiple logistic regression analysis was used to evaluate the effect of sarcopenia and dynapenia on physical disability and loss of mobility. For the degree of mobility, the dummy variables were created and coded, as follows: normal mobility = 0, loss of mobility = 1, whereas for physical disability, the dummy variables were created and coded, as follows: without physical disability = 0, with physical disability = 1, and Odds Ratio (OR) were subsequently computed for these factors. Associations with p≤0.20 in the univariate analysis were selected for logistic regression, for which the step-by-step advance method was used. Model 1 includes sarcopenia as an independent variable and model 2 includes dynapenia.
Results
The general characteristics of the sample of elderly are summarized in Table 1. The participants’ mean age was 72 years, most of them weren’t married, white, but had on mean 4 years of schooling, and received less than R$510,00 monthly. Regarding the occurrence of health problems, there was a prevalence of hypertension, diabetes, arthritis/rheumatism, and osteoporosis, with a high cardiovascular risk since the waist circumference was higher than the reference value: 94.0 cm for women and 105.0 cm for men. Sarcopenia and dynapenia were in 15% and 38% of the elderly, respectively, and were higher in women than in men (Table 1).
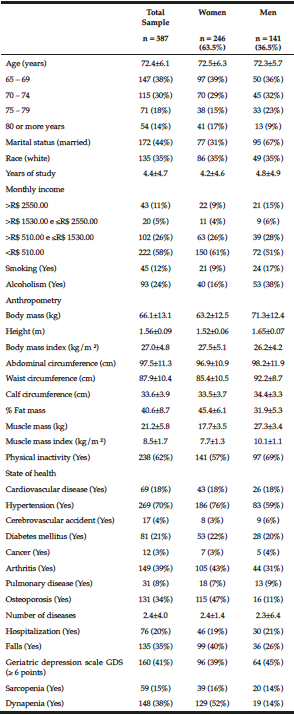
Table 1
The general characteristics of the sample of elderly by genders, Cuiabá, Mato Grosso, Brazil (2010)
The majority were women; among them, there was a higher percentage of older people, with an income lower than R$ 510.00 monthly, excess weight, and a higher percentage of fat, arterial hypertension, arthritis, osteoporosis, and occurrence of falls, compared to men (Table 1).
The elderly with sarcopenia and dynapenia had functional and physical performance significantly lower in comparison to those classified as normal, and were slower and reported more dependencies in ADL (Table 2).

Table 2
Functional performance and physical dependence on 387 seniors living in Cuiabá, Mato Grosso, Brazil (2010)
Different letters show significant statistical difference between the groups (p ≤ 0.05). Mann-Whitney test with data expressed as median (minimum-maximum). SPPB – Short Physical Performance Battery. BADL – basic activities of daily living. IADL – instrumental activities of daily living.
The logistic regression analysis for loss of mobility and disability in BADL and IADL is shown in Table 3. In model 1, the odds ratio (OR) and 95% CI for the factors statistically associated with loss of mobility were: being 75 years old or older, woman, sedentary, have had a stroke, arthritis, falls, and sarcopenia. The factors associated with disability in BADL and IADL were: being 80 years old or older, have had arthritis, and being a woman.
The logistic regression analysis for loss of mobility and disability in BADL and IADL is shown in Table 3. In model 1, the odds ratio (OR) and 95% CI for the factors statistically associated with loss of mobility were: being 75 years old or older, woman, sedentary, have had a stroke, arthritis, falls, and sarcopenia. The factors associated with disability in BADL and IADL were: being 80 years old or older, have had arthritis, and being a woman. In model 2, the OR and 95% CI for factors statistically associated with loss of mobility were the same as those found in model 1, but dynapenia was not associated with loss of mobility. The factors associated with disability in BADL and IADL were being 80 years old or older, have had arthritis and dynapenia.
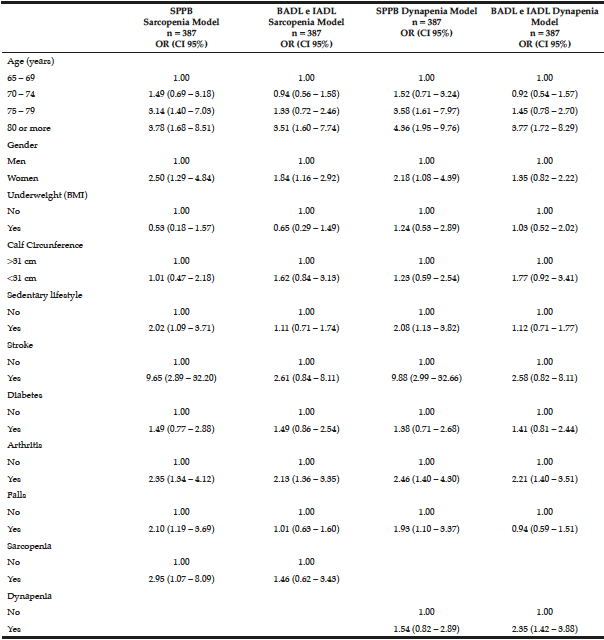
Table 3
Multiple logistic regression models to test the association of physical dependence or loss of mobility with sarcopenia and dynapenia in the study in 387 seniors living in Cuiabá, Mato Grosso, Brazil (2010)
OR – Odds ratio. CI – Confidence interval. SPPB – Short Physical Performance Battery. BADL – basic activities of daily living. IADL – instrumental activities of daily living.
Discussion
Perhaps the most relevant aspect of the present study is the observation that both classifications (sarcopenia and dynapenia) were significantly associated with physical disability and comorbidities, with a prevalence of 15% and 38%, respectively. Therefore, a division of these classifications is necessary because only the classification as sarcopenia, as proposed by some authors (1), would underestimate an important percentage of individuals with high risk for health and physical disability. Few studies involving elderly individuals have carried out these associations separately. Loss of mobility was only associated with sarcopenia; however, there was an association of self-reported physical disability in BADL and IADL only with dynapenia. Our results suggest that the association between sarcopenia and loss of mobility could be explained by the present comorbidities, the sedentary lifestyle, and the occurrence of falls.
The prevalence of sarcopenia varies among different populations, due to differences relating to age, gender, diagnostic method, and evaluation instruments (26–29). Different instruments used to define sarcopenia, as well as the age group and incompatible living habits of the study population may cause different diagnoses of its prevalence. Because of this variability, it is necessary to emphasize the importance of adopting a standardized and operational definition of sarcopenia for multidimensional geriatric assessment, similarly to the one adopted in the present study.
It is believed that the evaluation of muscle strength by the isolated hand grip strength is useful only in the triage phase of dynapenia, because it explains about 40% of the variation in the strength of the lower limbs, suggesting, for the diagnosis, the evaluation of the muscular strength by the extension of the Knee due to its association with gait speed and physical function (5). Other researchers observed that hand grip strength was a strong predictor of gait speed reduction and self-reported physical disability (in BADL and IADL) (30). These researchers found, in the elderly with low hand grip strength, a higher incidence of physical disability in IADL, and this correlation was higher in women (2.28, 95% CI = 1.59 – 3.27) than in men (1.90, 95% CI = 1.13 – 3.17) (31).
However, in this study, the hand grip strength was used as a method to define the dynapenia, since it is a good indicator of the strength of the whole body, given that a low hand grip strength is strongly associated with a high probability of mortality, the risk of complications and development of physical disability (8,32). Moreover this method makes easier the strength measurement, and it is significantly less expensive and accessible to developing countries, such as Brazil.
Sarcopenia was associated with an increase in loss of mobility, with advancing age, especially in sedentary women, with arthritis or stroke, and with a history of falls. These results together suggest that reductions in skeletal muscle mass accompanied by a decline in strength or physical performance with the aging, as suggested in the EWGSOP document, cause loss of mobility, and if these declines reach a critical point, the physical function can be compromised (33,34).
Data used from the longitudinal Health Aging and Body Composition Study, which observed 3,075 elderly Americans, showed that the lowest quintile of muscle mass was associated with a poor performance of the lower limbs in both genders (35), and they also showed an association with loss of mobility, similar to the results found in our study (34).
The Health, Welfare and Aging (SABE in Portuguese) study, conducted in Brazil with 478 elderly individuals aged 60 years or over, compared the association of sarcopenia and dynapenia with the incidence of deficiency in mobility or IADL, and with disability in basic and instrumental activities of daily living. The authors observed that sarcopenia was associated with a deficiency in mobility or IADL (2.38, 95% CI 1.10 – 5.17), whereas dynapenia was neither associated with physical disability nor with the loss of mobility (33), corroborating, in part, our findings since the dynapenia was associated with self-reported physical disability. Melton et al. (36) reported an association of sarcopenia with walking difficulty in older men and women.
Several studies have shown a relationship between sarcopenia and self-reported physical disability, using scales of basic and instrumental activities of daily living (16,17,37,38), evidencing that women and men with sarcopenia were 3.6 and 4.1 times, respectively, more likely to physical disability in comparison to individuals without sarcopenia (16). On the other hand, some authors reported that only severe sarcopenia was independently associated with an increase in the probability of functional damage and physical disability in the elderly, after adjustments for potential variables of confusion, such as age, race, health behaviors, and comorbidities (37), in addition, they showed that the effect of sarcopenia on physical disability was considerably lower (38,39). However, in our study, the self-reported physical disability was not associated with sarcopenia.
Another study carried out in Australia with 1,705 elderly men, aimed to determine the association among loss of strength, mass and muscle quality, functional limitation, and physical disability, concluded that the muscle strength measurement is the best one to measure age-related muscle change and that it is associated with the deficiency in instrumental activities of daily living and functional limitation (3), corroborating our results. In a sample of 1,030 elderly Italians, some researchers concluded that isometric hand grip strength is strongly related to muscle power of the lower extremities, knee extensor torque, and calf cross-sectional muscle area, and that the decrease in hand grip strength is a clinical marker of mobility loss (walking speed <0.8m/s) better than the decline in muscle mass (4). In other words, conversely to our findings, these researchers evidenced that low values of muscle strength can predict, regardless of other risk factors, the incidence of physical disability (31).
However, in our study, we did not find this association with sarcopenia, perhaps because the elderly participants did not have a high degree of disability in ADL, which could lead to a poor functional performance, explaining this dissociation, besides the fact that these activities are related to works that do not require strength, muscular endurance, and walking speed (40). The differences may be related to diversities in outcome measurements and characteristics of the studied populations, in addition to the fact that physical disability is self-reported, which can hide the true relationship between sarcopenia and physical disability in these elderly. In this sense, a battery of physical tests may be adequately sensitive to support the diagnosis of present and future dependencies and comorbidities (41).
Also, our study indicated that dynapenia was associated with disability in ADL, agreeing with some studies that reported the relationship between dynapenia (measured through hand grip strength) and ADL (31,32). Furthermore, these studies indicated that strength and body mass index (BMI) were positively and negatively associated with the disability in ADL, respectively (39). In this study, the occurrence of falls and sedentary lifestyle were other factors associated with loss of mobility. As found in other studies, older men and women, who are less physically active, have less skeletal muscle mass, which can increase the prevalence of physical disability (42). Thus, the effects of physical exercise, including a simple walk, can protect against the loss of mobility in older adults. Falls and their related injuries are a major health problem in the elderly population and are associated with an increase in morbidity and physical disability (16).
From the results presented here, the following limitation can be considered: 1) The fact this is a cross-sectional study, so the cause-and-effect relationships could not be established. 2) The use of regression equations to estimate muscle mass can underestimate or overestimate the prevalence of sarcopenia. However, few studies have used the DEXA to estimate muscle mass in elderly populations and epidemiological studies because of the high cost. Therefore, simple and feasible options that have the same function without causing population risk are indicated. Furthermore, the equation used in the present study was validated in American and Brazilian populations, presenting a high correlation with magnetic resonance and DXA (14,15). 3) The use of the sarcopenia equation (equation that assists in the diagnosis of sarcopenia by estimating skeletal muscle mass) does not include BMI, it only includes the weight and height in its logistic regression analysis. However, it is known that 50% of the variance of muscle mass is explained by BMI, preventing the identification of other factors related to muscle mass. 4) The FIBRA Study aimed to evaluate the population of elderly residents in the community and did not include the elderly from asylums and hospitals. Thus, the relationship between sarcopenia and physical disability and between dynapenia and physical disability cannot be considered for all elderly population.
Finally, regarding the dynapenia, few population studies were found, as it is a recent issue (32,43). However, the prevalence of dynapenia, as reported for sarcopenia, shows differences among the previous studies (32,43). Probably, the discrepancies among the results can be related to the lack of sufficient evidence in the literature to identify specific cut-off points, complete assessment of risk factors, and the lack of consensus relating to methods and instruments used to define the final diagnostic algorithm. Nevertheless, it is observed in the present study that, among the used methods, the one used to classify dynapenia was more sensitive to associate a higher percentage of the studied population with the factors related to self-reported physical disability.
Conclusions
In summary, this study is relevant because it focused on a large sample of elderly residents in the community, which represents the elderly population in a large Latin American city, in addition to comparing dynapenia with sarcopenia, using the EWGSOP criteria as factors of risk for the loss of mobility and physical disability in ADL.
It also evidenced that individuals who lost strength in addition to muscle mass were more likely to the loss of mobility than those who only lost muscle strength. However, the elderly with dynapenia showed a high disability in self-reported ADL. These associations were measured by the presence of comorbidities, sedentary lifestyle, and occurrence of falls.
The classification of dynapenia differs from the classification of sarcopenia (according to the EWGSOP) in qualitative and quantitative aspects, and we found a higher percentage of individuals classified as having dynapenia. This fact demonstrates that, at least in this population, the classification as dynapenia is more sensitive to prevent future physical dependencies in comparison to the classification as sarcopenia, and can be used in clinical practice as a screening tool for the early decline of mobility. Thus, we emphasize the need for an active lifestyle and the inclusion of physical exercise programs to protect old people against the loss of mobility.
Author affiliations: Center for Physical Fitness, Informatics, Metabolism, Sports and Health, Faculty of Physical Education, Federal University of Mato Grosso, Cuiabá, Mato Grosso State, Brazil (Thiago Neves, Marcela Bomfim Martin Lopes, Milene Giovana Crespilho Souza, Carlos Alexandre Fett, Waléria Christiane Rezende Fett). We thank the members of the Fragility in Brazilian Elderly Research Network (FIBRA Network) who assisted with the scientific and data collection team, in particular the general coordinator of this study, Eduardo Ferriolli, professor at the University of São Paulo, Medical School of Ribeirão Preto , Department of Clinical Medicine, Division of General Medical Clinic and Geriatrics. This research was supported by the National Council of Scientific and Technological Development – CNPq (nº 17/2006) and by the Foundation for Research Support of the State of Mato Grosso – FAPEMAT (002.017/2007). The funding body had no role in the design, data collection, data analysis and interpretation of the study, article writing, or in the decision to submit the manuscript.
Role of the Funding Source: This research was supported by the National Council of Scientific and Technological Development – CNPq (nº 17/2006) and by the Foundation for Research Support of the State of Mato Grosso – FAPEMAT (002.017/2007).
Conflict of interest: None declared.
Ethical standard: The experiments described in this manuscript comply with the current of laws of Brazil.
References
1. Cruz-Jentoft AJ, Baeyens JP, Bauer JM, Boirie Y, Cederholm T, Landi F, et al. Sarcopenia: European consensus on definition and diagnosis: Report of the European Working Group on Sarcopenia in Older People. Age Ageing. Madrid: Br Geriatrics Soc; 2010 Jul;39(4):412–23.
2. Ling CHY, Taekema D, de Craen AJM, Gussekloo J, Westendorp RGJ, Maier AB. Handgrip strength and mortality in the oldest old population: the Leiden 85-plus study. CMAJ. 2010 Mar 23;182(5):429–35.
3. Hairi NN, Cumming RG, Naganathan V, Handelsman DJ, Le Couteur DG, Creasey H, et al. Loss of muscle strength, mass (sarcopenia), and quality (specific force) and its relationship with functional limitation and physical disability: the Concord Health and Ageing in Men Project. J Am Geriatr Soc. 2010 Nov;58(11):2055–62.
4. Lauretani F, Russo CR, Bandinelli S, Bartali B, Cavazzini C, Di Iorio A, et al. Age-associated changes in skeletal muscles and their effect on mobility: an operational diagnosis of sarcopenia. J Appl Physiol. 2003 Nov;95(5):1851–60.
5. Manini TM, Clark BC. Dynapenia and aging: an update. J Gerontol A Biol Sci Med Sci. 2012 Jan;67(1):28–40.
6. Clark BC, Manini TM. Functional consequences of sarcopenia and dynapenia in the elderly. Curr Opin Clin Nutr Metab Care. NIH Public Access; 2010 May;13(3):271–6.
7. Newman AB, Kupelian V, Visser M, Simonsick EM, Goodpaster BH, Kritchevsky SB, et al. Strength, but not muscle mass, is associated with mortality in the health, aging and body composition study cohort. J Gerontol A Biol Sci Med Sci. 2006 Jan;61(1):72–7.
8. Bohannon RW. Hand-grip dynamometry predicts future outcomes in aging adults. J Geriatr Phys Ther. 2008 Jan;31(1):3–10.
9. Clark BC, Manini TM. Sarcopenia ≠ dynapenia. J Gerontol A Biol Sci Med Sci. 2008 Aug;63(8):829–34.
10. Neves T. Comparação entre sarcopenia e dinapenia quanto ao desempenho funcional, aptidão cardiorrespiratória e dependência física. Universidade Federal de Mato Grosso; 2014.
11. Lipschitz DA. Screening for nutritional status in the elderly. Prim Care. 1994;21(1):55.
12. Simão A, Precoma D, Andrade J, Correa Filho H, Saraiva J, Oliveira G, et al. I Diretriz Brasileira de Prevenção Cardiovascular. Arq Bras Cardiol. 2013;101(6):1–63.
13. Vellas B, Guigoz Y, Garry PJ, Nourhashemi F, Bennahum D, Lauque S, et al. The Mini Nutritional Assessment (MNA) and its use in grading the nutritional state of elderly patients. Nutrition. Elsevier; 1999;15(2):116–22.
14. Lee RC, Wang Z, Heo M, Ross R, Janssen I, Heymsfield SB. Total-body skeletal muscle mass: development and cross-validation of anthropometric prediction models. Am J Clin Nutr. Am Soc Nutrition; 2000;72(3):796–803.
15. Rech CR, Dellagrana RA, Marucci M de FN, Petroski EL. Validade de equações antropométricas para estimar a massa muscular em idosos. Rev Bras Cineantropometria e Desempenho Hum. 2012 Jan 2;14(1):23–31.
16. Baumgartner RN, Koehler KM, Gallagher D, Romero L, Heymsfield SB, Ross RR, et al. Epidemiology of sarcopenia among the elderly in New Mexico. Am J Epidemiol. 1998 Apr 15;147(8):755–63.
17. Janssen I, Heymsfield SB, Ross R. Low relative skeletal muscle mass (sarcopenia) in older persons is associated with functional impairment and physical disability. J Am Geriatr Soc. Wiley Online Library; 2002;50(5):889–96.
18. Guralnik JM, Simonsick EM, Ferrucci L, Glynn RJ, Berkman LF, Blazer DG, et al. A Short Physical Performance Battery Assessing Lower Extremity Function: Association With Self-Reported Disability and Prediction of Mortality and Nursing Home Admission. J Gerontol. Oxford University Press; 1994 Mar 1;49(2):M85–94.
19. Guralnik JM, Ferrucci L, Pieper CF, Leveille SG, Markides KS, Ostir G V, et al. Lower Extremity Function and Subsequent Disability: Consistency Across Studies, Predictive Models, and Value of Gait Speed Alone Compared With the Short Physical Performance Battery. Journals Gerontol Ser A Biol Sci Med Sci. Oxford University Press; 2000 Apr 1;55(4):M221–31.
20. Katz S. Studies of Illness in the Aged. JAMA. 1963 Sep 21;185(12):914.
21. Lawton MP, Brody EM. Assessment of older people: self-maintaining and instrumental activities of daily living. Gerontologist. 1969;9(3):179–86.
22. Taylor HL, Jacobs DR, Schucker B, Knudsen J, Leon AS, Debacker G. A questionnaire for the assessment of leisure time physical activities. J Chronic Dis. 1978 Jan;31(12):741–55.
23. Lustosa LP, Pereira DS, Dias RC, Britto R, Parentoni A, Pereira L. Tradução e adaptação transcultural do Minnesota Leisure Time Activities Questionnaire em idosos. Geriatr Gerontol. 2011;5(2):57–65.
24. Nelson ME, Rejeski WJ, Blair SN, Duncan PW, Judge JO, King AC, et al. Physical activity and public health in older adults: recommendation from the American College of Sports Medicine and the American Heart Association. Circulation. 2007 Aug 28;116(9):1094–105.
25. Yesavage JA, Sheikh JI. 9/Geriatric Depression Scale (GDS). Clin Gerontol. Taylor & Francis; 1986 Nov 18;5(1–2):165–73.
26. Tanimoto Y, Watanabe M, Sun W, Tanimoto K, Shishikura K, Sugiura Y, et al. Association of sarcopenia with functional decline in community-dwelling elderly subjects in Japan. Geriatr Gerontol Int. 2013 Oct;13(4):958–63.
27. Patel HP, Syddall HE, Jameson K, Robinson S, Denison H, Roberts HC, et al. Prevalence of sarcopenia in community-dwelling older people in the UK using the European Working Group on Sarcopenia in Older People (EWGSOP) definition: findings from the Hertfordshire Cohort Study (HCS). Age Ageing. 2013 May;42(3):378–84.
28. Patil R, Uusi-Rasi K, Pasanen M, Kannus P, Karinkanta S, Sievänen H. Sarcopenia and osteopenia among 70-80-year-old home-dwelling Finnish women: prevalence and association with functional performance. Osteoporos Int. 2013 Mar;24(3):787–96.
29. Volpato S, Bianchi L, Cherubini A, Landi F, Maggio M, Savino E, et al. Prevalence and clinical correlates of sarcopenia in community-dwelling older people: application of the EWGSOP definition and diagnostic algorithm. J Gerontol A Biol Sci Med Sci. 2014 Apr;69(4):438–46.
30. Rantanen T, Guralnik JM, Foley D, Masaki K, Leveille S, Curb JD, et al. Midlife hand grip strength as a predictor of old age disability. JAMA J Am Med Assoc. Am Med Assoc; 1999;281(6):558–60.
31. Al Snih S, Markides KS, Ottenbacher KJ, Raji MA. Hand grip strength and incident ADL disability in elderly Mexican Americans over a seven-year period. Aging Clin Exp Res. Springer; 2004 Oct 10;16(6):481–6.
32. Yang M, Ding X, Luo L, Hao Q, Dong B. Disability associated with obesity, dynapenia and dynapenic-obesity in Chinese older adults. J Am Med Dir Assoc. Elsevier; 2014 Feb;15(2):150.e11-6.
33. da Silva Alexandre T, de Oliveira Duarte YA, Ferreira Santos JL, Wong R, Lebrão ML. Sarcopenia According to the European Working Group on Sarcopenia in Older People (EWGSOP) Versus Dynapenia as a Risk Factor for Disability in the Elderly. J Nutr Health Aging. 2014 Jan 14;18(5):547–53.
34. Delmonico MJ, Harris TB, Lee J-S, Visser M, Nevitt M, Kritchevsky SB, et al. Alternative definitions of sarcopenia, lower extremity performance, and functional impairment with aging in older men and women. J Am Geriatr Soc. 2007 May;55(5):769–74.
35. Newman AB, Kupelian V, Visser M, Simonsick E, Goodpaster B, Nevitt M, et al. Sarcopenia: alternative definitions and associations with lower extremity function. J Am Geriatr Soc. Wiley Online Library; 2003;51(11):1602–9.
36. Melton 3rd LJ, Khosla S, Crowson CS, O’Connor MK, O’Fallon WM, Riggs BL. Epidemiology of sarcopenia. J Am Geriatr Soc. 2000;48(6):625.
37. Janssen I. Skeletal Muscle Cutpoints Associated with Elevated Physical Disability Risk in Older Men and Women. Am J Epidemiol. 2004 Feb 15;159(4):413–21.
38. Janssen I. Influence of sarcopenia on the development of physical disability: the Cardiovascular Health Study. J Am Geriatr Soc. Wiley Online Library; 2006;54(1):56–62.
39. Iwamura M, Kanauchi M. A cross-sectional study of the association between dynapenia and higher-level functional capacity in daily living in community-dwelling older adults in Japan. BMC Geriatr [Internet]. BMC Geriatrics; 2017;17(1):1–6. Available from: http://dx.doi.org/10.1186/s12877-016-0400-5
40. Rolland Y, Lauwers-Cances V, Cournot M, Nourhashémi F, Reynish W, Rivière D, et al. Sarcopenia, calf circumference, and physical function of elderly women: a cross-sectional study. J Am Geriatr Soc. 2003 Aug;51(8):1120–4.
41. Pahor M, Blair SN, Espeland M, Fielding R, Gill TM, Guralnik JM, et al. Effects of a physical activity intervention on measures of physical performance: Results of the lifestyle interventions and independence for Elders Pilot (LIFE-P) study. J Gerontol A Biol Sci Med Sci. 2006 Nov;61(11):1157–65.
42. Vandervoort AA. Aging of the human neuromuscular system. Muscle Nerve. Wiley Online Library; 2002;25(1):17–25.
43. Alexandre T da S, Duarte YA de O, Santos JLF, Wong R, Lebrão ML. Prevalence and associated factors of sarcopenia among elderly in Brazil: findings from the SABE study. J Nutr Health Aging. Springer; 2014 Mar 13;18(3):284–90.

