jarlife journal
Sample text

AND option

OR option

NUTRITIONAL ASSESSMENT IN PATIENTS WITH EARLY-ONSET AUTOSOMAL DOMINANT ALZHEIMER’S DISEASE DUE TO PSEN1- E280A GENETIC VARIANT: A CROSS-SECTIONAL STUDY


M. Gómez-Vega1,2, E. Garcia-Cifuentes2,3, D. Aguillon1,2, J.E. Velez2, A. Jaramillo-Jimenez1,2,4,5, D. Vasquez2,6, C. Gómez-Henck2, C. Andrés Tobon1, G.C. Deossa Restrepo7, F. Lopera2


1. Grupo Neuropsicología y Conducta, Facultad de Medicina, Universidad de Antioquia, Institución Prestadora de Servicios de Salud – IPS Universitaria, Medellín, Colombia; 2. Grupo Neurociencias de Antioquia, Facultad de Medicina, Universidad de Antioquia, Medellín, Colombia; 3. Semillero de Neurociencias y Envejecimiento, Facultad de Medicina, Instituto de Envejecimiento, Pontificia Universidad Javeriana, Bogotá, Colombia; 4. Centre for Age-Related Medicine (SESAM), Stavanger University Hospital. Stavanger, Norway; 5. Faculty of Health Sciences, University of Stavanger. Stavanger, Norway; 6. Grupo de investigación en Epidemiología y Bioestadística, Universidad CES, Medellín, Colombia; 7. Escuela de nutrición y dietética, Universidad de Antioquia, Medellín, Colombia.ORCID digit: Manuela Gómez-Vega: 0000-0002-2000-4901; Elkin Garcia-Cifuentes: 0000-0003-4214-0266; David Aguillon: 0000-0003-2283-536X; Juan Esteban Velez: 0000-0002-0800-5709; Alberto Jaramillo-Jimenez: 0000-0001-5374-6410; Daniel Vasquez: 0000-0002-2586-162X; Clara Gómez Henck: 0000-0003-0848-8330; Carlos Andrés Tobon: 0000-0002-5787-6279; Gloria Cecilia Deossa Restrepo: 0000-0002-1635-1601; Francisco Lopera: 0000-0003-396-1484

Corresponding author: Manuela Gómez Vega, Grupo Neuropsicología y Conducta, Facultad de Medicina, Universidad de Antioquia, Institución Prestadora de Servicios de Salud – IPS Universitaria, Medellín, Colombia E:mail: manugomezvega@gmail.com; Tel: (+57) 319 5245304; Fax: (+574) 219 6444

J Aging Res & Lifestyle 2021;10:32-38
Published online June 6, 2021, http://dx.doi.org/10.14283/jarlife.2021.6


Abstract

Background: Weight loss and malnutrition are frequent findings in late-onset and sporadic presentations of Alzheimer’s Disease (AD). However, less is known about nutritional status in Early-Onset Autosomal Dominant AD (EO-ADAD). Objective: To analyze the association between nutritional status and other clinical and sociodemographic characteristics in individuals with a genetic form of EO-ADAD. Design, settings, and participants: Cross-sectional study with 75 non-institutionalized participants from a cohort of Autosomal Dominant AD (13 with mild cognitive impairment and 61 with dementia, ages from 38 to 67 years) underwent a structured clinical assessment with emphasis on nutritional status. Measurements: Primary outcome was nutritional status and it was measured using the Mini Nutritional Assessment (MNA). Patients were categorized according to MNA total score, as undernourished (MNA ≤23.5) and well-nourished (MNA ≥ 24). Sociodemographic and clinical variables identified as potential predictors or confounders of nutritional status were also collected. Results: Undernourishment by MNA was present in 57.3% of the sample. Forty-two percent of participants had abnormal BMI values considered lower than 18.5 or higher than 24.9 kg/m2. Total BMI values were similar in well and undernourished patients (median 24.2 IQR 3.59 and median 23.9 IQR 4.42, respectively, p=0.476). When comparing well and undernourished groups, we found statistically significant differences for variables: severity of dementia (p=0.034), frailty (p=0.001), multimorbidity (p=0.035) and, polymedication (p=0.045). Neither adjusted logistic regression nor the Poisson regression showed that any clinical or sociodemographic variables explained undernourishment. Conclusions: Undernourishment was a frequent finding in our sample of EO-ADAD, especially in later stages of the disease. Patients with polymedication, multimorbidity, frailty and severe dementia show differences in their nutritional status with a tendency to be more frequently undernourished. Further studies with larger sample sizes are needed to establish this association.

Key words: Autosomal Dominant Alzheimer’s Disease, Mini Nutritional Assessment, malnutrition.


Introduction

Alzheimer’s Disease (AD) is the main cause of dementia worldwide (1). Less than 1% of all AD cases are due to a genetic variant with familial aggregation. However, these forms of dementia are usually more severe and have an earlier onset (before age 65) (2). As a case in point, the Group of Neurosciences of Antioquia (GNA by its name in Spanish: Grupo de Neurociencias de Antioquia) in Colombia, has longitudinally followed around 6000 individuals at risk of Early-Onset Autosomal Dominant AD (EO-ADAD), 20% of them potentially carrying a single genetic variant, E280A (Glu280Ala) in Presenilin 1 (PSEN1), responsible for the disease (3). In this population, the mean age of onset for Mild Cognitive Impairment (MCI) is 44 years of age and 49 years of age for dementia (4), which is approximately 20 years younger than in late-onset AD (2).
Changes in nutritional status and weight loss have been widely studied before the onset and during the course of sporadic AD (5) representing a mortality predictor (6). Some mechanisms involved are neurodegeneration of specific brain regions (7), inflammatory processes (8) and, olfactory and taste dysfunction (9). Besides, some dementia-specific symptoms such as executive function and planning impairments, amnesia, behavioral and neuropsychiatric disorders (10, 11) dysphagia, side effects of pharmacotherapy (12), among others, lead to reduced dietary intake and malnutrition.
Malnutrition is related to modification of many epigenetic markers, resulting in the development of complex systemic disorders such as diabetes, obesity and hypertension: all related to higher cardiovascular risk and greater progression of AD (13–15). Malnutrition increases mortality rates in adults with dementia, causes reduced muscle mass, loss of autonomy, increased falls, decubitus ulcers, systemic infections (11) and rapid cognitive decline (16).
Approximately 44% of cognitively impaired elderly subjects are at risk of malnutrition and 15% suffer from it, albeit with variations in measurement from one region to another (17). Despite wide availability of information on malnutrition in late and sporadic forms of AD, only a few studies have assessed nutritional variables either in early-onset AD or in preclinical stages of ADAD (18–22). Studying the relationship between nutrition and EO-ADAD may provide a basis for effective preventive strategies as a public health priority against malnutrition, as well as a better understanding of morbimortality risk, due more to dementia than aging itself.
The purpose of the current study is to analyze the association between nutritional status in individuals with a genetic form of EO-ADAD and some clinical and sociodemographic potential determinants of malnutrition.


Methods

Study design and population

This is a cross-sectional study with a convenience sample of 75 individuals. The study population consisted of a sub-group of the longitudinal cohort of participants with EO-ADAD due to a genetic variant in PSEN1 (E280A) followed by the GNA. Major eligibility criteria included: diagnosis of cognitive impairment provided by an expert neurologist based on clinical and neuropsychological aspects (23, 24), carrier status of the PSEN1-E280A genetic variant and written informed consent from the participant or authorized proxy. Exclusion criteria were: functional limitation defined as a Global Deterioration Scale ≥6 (25) and clinical diagnosis of cerebrovascular disease.
Data was collected from records of 75 non-institutionalized patients (13 with MCI and 62 with dementia) participating in the ongoing project of the GNA called “Characterization of frailty syndrome in a population with early-onset Alzheimer’s Disease due to a genetic variant in PSEN1-E280A, using the evaluation methodology: Multimodal Approach for the Patient with Alzheimer’s and other Dementias (AMPAD)”, in Spanish: “Caracterización del síndrome de fragilidad en población con Enfermedad de Alzheimer de inicio precoz por variante genética PSEN1- E280A usando la metodología de evaluación: Abordaje Multimodal al Paciente con Alzheimer y otras Demencias (AMPAD)”. The genotypification of PSEN1-E280A variant is regularly conducted by the GNA using the molecular method PCR-RFLP (26), in all the members of the kindred that is being longitudinally followed since the 1990s (3).
Written informed consent was obtained from participants and their caregivers before study enrollment. The study was approved by the ethics committee of the Institute of Medical Research – School of Medicine of the University of Antioquia act 005 /2020.

Clinical assessment

Demographic and clinical data were obtained by a trained physician with a simultaneous interview of both participants and their caregivers. Polymedication was defined as taking ≥ 3 medications (24) and multimorbidity as having ≥ 2 chronic conditions (29). Hypertension, dyslipidemia and diabetes mellitus 2 were assessed by having it recorded in a previous medical record.
Frailty status was assessed through the Short Physical Performance Battery (SPPB) and the Timed Up and Go Test following standardized methods. The SPPB classifies individuals as non-frail or pre-frail/frail with a total score > 9, and ≤ 9, respectively (30). Participants who could not complete the SPPB because of major cognitive impairment were assessed using gait speed, classifying those with speed on a 6 meter walk < 1m/s as pre-frail/frail (31).
Anthropometric measures included brachial, calf and abdominal circumference obtained with a measuring tape SECA 101 (sensibility 0.1 cm). The abdominal perimeter was measured at the midpoint between the last rib and the upper border of the iliac crest and was categorized as normal or at risk of metabolic syndrome (women ≥ 80, men ≥90 cm) (32). Weight was measured in light clothing to the nearest 0.1 kg using SECA 813 electronic scale (sensibility 0.1 kg) and height using a wall-mount SECA 206 stadiometer. World Health Organization`s classification was used for Body Mass Index (BMI) (body weight [kg] divided by body height squared [m2]): underweight <18.5, normal weight 18.5 – 24.9, overweight 25 -29.9 and obesity ≥30 (33).

Main outcome measure

Main outcome for nutritional status was the total score on the Mini Nutritional Assessment® Guideline (MNA) questionnaire (including both screening and assessment). MNA has been validated for the evaluation of nutritional status of frail elderly including those with AD (17, 34). It has shown high sensitivity, specificity, and positive predictive value (96%, 98% and, 97% respectively) (35). MNA has also been used in younger populations (36). Brachial and calf circumferences were measured as described in the MNA guideline (37). It classifies patients into well-nourished (MNA score >23.5), at risk of malnutrition (MNA score=17.0–23.5), or malnourished (MNA score <17).

Neuropsychological assessment

All participants evaluated in the longitudinal follow-up of the Group of Neurosciences of Antioquia undergo a standardized neuropsychological assessment by a trained clinician based on the research group protocol (38). For the dementia stage grading, we collected neuropsychological data from visits in the prior three months to the clinical evaluation. We included: Mini-Mental State Examination from 0 to 30, where higher values indicate a better cognitive function (39), Global Deterioration Scale used to establish cognitive and functional impairment ranging from 1 to 7, and Barthel Index (40) for impairment in basic activities of daily living, lower scores indicating greater dependency.

Statistical analysis

Absolute and relative measures of demographic and clinical variables were obtained for qualitative data, central tendency and dispersion measures were evaluated using median and interquartile range. For statistical purposes, we categorized subjects according to the MNA total score into well-nourished (MNA score >23.5), and undernourished (MNA score ≤23.5) groups. Therefore, the undernourished group consisted of both: subjects at risk of malnutrition (n = 37) as well as those classified as malnourished (n = 6) according to the MNA total score.
To compare demographic and clinical variables between the well-nourished and undernourished groups, group differences in demographic (i.e. age, gender, and years of education) and clinical variables (i.e. severity of dementia, frailty, multimorbidity, polymedication, BMI, diagnosis of diabetes mellitus type 2, hypertension, dyslipidemia and risk of metabolic syndrome) were evaluated with independent samples Mann-Whitney U or T-test (depending on normal distribution according to Shapiro Wilk test) and Chi-square test for continuous and categorical variables, respectively.
To analyze the association between nutritional status and clinical and demographic characteristics, we performed a bivariate and multivariate analysis using logistic regression models. Unadjusted models included each clinical and demographic variable as explicative variables and nutritional status as a binary outcome (i.e. well-nourished and undernourished categories). The variables included in the bivariate analysis were used to adjust the estimators in the multivariate analysis and all of them had Variance Inflation Factors (VIF) values smaller than 2. Thus, an adjusted model included relevant demographic and clinical predictors mutually adjusted, and nutritional status as a binary outcome. Besides, these results were also verified by estimating the Prevalence Ratios (instead of Odds ratios) for undernutrition and well-nourishment groups, thus, Poisson regressions with robust variance estimation using the White’s estimator with an Omega value of 1 (Supplementary material 1), following previously published recommendations for cross-sectional designs with a binary outcome (41, 42). However, no major differences were evidenced between both methods. All the hypothesis tests were performed using an alpha value of 0.05 and a confidence interval of 0.95. The statistical analysis was performed using R software (version 3.6.1) (43).


Results

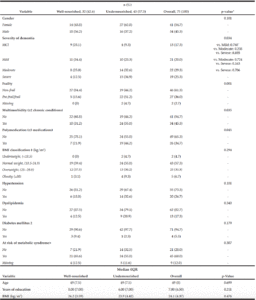
The demographic and clinical characteristics of the sample are shown in Table 1. Ages varied from 38-67 years with a median of= 49 years of age, IQR=8. We found an overall frequency of undernutrition of 57.3% (n=43) in patients with EO-ADAD by MNA. Of those in the undernourished group, 67.5% (n=29) were in later stages of AD (moderate and severe dementia). Forty-two percent (n=32) of the sample had abnormal BMI values distributed as underweight n=2, overweight n=25, obesity n=5. BMI values were similar in well and undernourished patients (median =24.2 IQR = 3.59 and median=23.9 IQR= 4.42, respectively, p=0.476).

Table 1
Demographic and clinical characteristics of the sample according to nutritional status

BMI: Body Mass Index; MCI = Mild Cognitive Impairment, IQR=Interquartile Range. *p-Values for differences between Well-nourished and Undernourished groups using independent samples T-test, and Chi-squared, multiple comparisons for severity of dementia were adjusted with Tukey test. ‡ BMI classification using the World Health Organization reference values. ×Risk of metabolic syndrome was defined as an abdominal perimeter >80 cm for women and >90 cm for men.


There were statistically significant differences for the variables: severity of dementia, frailty, multimorbidity and, polymedication when comparing well and undernourished groups. Undernourished patients tend to be more commonly frail (n=22, 52.1%) than well-nourished patients (n=5, 15.6%) p=0.001. Likewise, the differences between the groups regarding severity of dementia were significant (p=0.034), particularly when comparing MCI vs. severe dementia (p = 0.035). For the other variables, we found no statistically significant differences (see Table 1).

Associations between clinical variables and nutritional status

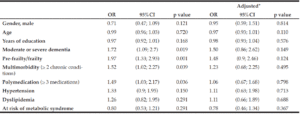
In the unadjusted bivariate analysis, the variables moderate or severe dementia, frailty, polymedication, and multimorbidity were associated with the undernourished category. However, after adjusting for all clinical variables included in the analysis, there was no significant association for any of the variables (Table 2).

Table 2
Associations between clinical and sociodemographic variables with undernourishment

OR = Odds Ratio; 95%CI = 95% confidence interval. * All the variables included in the bivariate analysis were used to adjust the estimators in the multivariate analysis.


Discussion

Our study analyses the association between nutritional status in individuals with a genetic form of EO-ADAD (median age 49 years) and some clinical and sociodemographic characteristics. Overall, we found undernutrition to be present in 57.3% (n=43) of the sample. We did not find other studies that use MNA in any kind of early-onset dementia. Nevertheless, these results are comparable to previous studies conducted in elderly adults with cognitive impairment due to AD, which show a similar frequency of undernutrition by MNA score similar to the one found: in Korea (46%) (44), Japan (57%) (10), Netherlands (14.1% ) (45), in France (21-25%) (17,34), and as high as 96% in Italy (46). These differences might be explained by disease duration, clinical-stage, study design and culture. However, considering that dementia is a common variable between these studies and our study, we suggest that undernutrition might be present independently from age of onset, and perhaps it is attributable by different mechanisms to the dementia syndrome.
Thirty-two patients (42.6%) had abnormal BMI values (including under/overweight and obesity), which is consistent with a study of cardiovascular risk factors of a French cohort of early-onset AD (18). Furthermore, it is remarkable that n=13 (40%) of these patients with abnormal BMI values were part of the well-nourished group, which could be probably explained because the BMI cut-off values of the MNA differ from the WHO reference values for middle-aged adults. After analyzing BMI as a continuous variable, we did not observe any differences between the well-nourished and undernourished groups. Likewise, we did not find any differences when comparing brachial, calf and abdominal circumferences. Therefore, despite the common use of BMI and other anthropometric variables to classify nutritional status, these results suggest, that anthropometric variables (as an independent measure) are not well related to nutritional status according to MNA in this population of middle-aged adults with dementia. For clinical purposes, we suggest, the importance of complementing the nutritional evaluation with both MNA and BMI in this population. Future studies are needed to address results adapting thresholds of BMI, brachial, and calf circumferences on the MNA in early-onset dementia, to increase its sensibility.
The tendency of frail patients to be more likely in the undernourished group found in our study has been previously proven in older adults, leading to the consideration of MNA as an appropriate tool to measure frailty (47). Likewise, multimorbidity and therefore polypharmacy have been postulated, by different mechanisms, to exert a negative impact on nutrition, due to disorders in food intake, insufficient absorption of nutrients and indirect metabolic effects (21, 48). Nevertheless, in the multivariate analysis, no association was found when adjusting for all variables included. This result could be partly attributable to the underestimation of any significant difference caused by grouping participants “at risk of malnutrition” and “malnutrition” as one variable, since those “at risk of malnutrition” could be differentiated to a lesser extent with the comparison group “well-nourished”. Another explanation may be given by other variables not included in our analysis that have been proven to have a relation with malnutrition in dementia, such as nutrient intake, Apolipoprotein E status and inflammation (49, 50) or due to the sample size.
The frequency of multimorbidity, polymedication, and frailty in our sample was consistent with the prevalence of the same geriatric syndromes in older patients (51). An in-vitro study of our group in carriers of the same E280A genetic variant found that cholinergic neurons (differentiated from multipotent mesenchymal cells) display high levels of reactive oxygen species, loss of mitochondrial membrane potential and DNA fragmentation unlike other mesenchymal-derived cells (52). Therefore, to date, we cannot attribute the similarities between the geriatric syndromes in our middle-aged adults and older people only to the genetic variant. On the other hand, neuropathology that leads to cognitive impairment has been proven to directly affect indicators of frailty, which could be in our case, a possible explanation for our findings (53). Thus, the novelty of our study lies in the high frequency of geriatric syndromes, including undernutrition, in a group of patients with EO-ADAD, raising the importance of a complete clinical assessment with emphasis on nutrition of middle-aged adults with dementia.

Strengths and limitations

We analyzed a convenience sample (N=75) which causes a lack of adequate statistical power. The sampling methodology and cross-sectional design do not allow us to establish causality and therefore, results and conclusions should be read with precaution for other populations. Nevertheless, we acknowledge the value of our findings given the infrequent presentation of EO-ADAD. Healthy control groups should be desirable to contrast our hypothesis in further studies. Other forms of evaluation such as food-frequency and food-security questionnaires and the measurement of plasma levels of nutrients should be applied in future research. Some limitations of the MNA in our context, are the questionable reliability and validity of responses from participants with dementia regarding self-perception, and the applicability of the thresholds of anthropometric variables validated in elderly populations but not in middle-aged adults. The MNA is a useful tool for grading nutritional status, but adaptations in anthropometric and self-graded parameters may be required for its use in EO-ADAD.


Conclusion

Undernourishment, determined by MNA score, is a frequent finding in patients with EO-ADAD, especially in those at later stages of the disease or those who are frail. However, BMI, brachial and calf circumferences as independent measures are not different between well and under-nourished groups. Polymedication and multimorbidity seem to have a direct relationship with an altered nutritional status. Likewise, frail patients with ADAD and those with severe dementia are more likely to be undernourished. Understanding the specific aspects of nutritional status that better describe this population may potentially improve diagnosis, treatment, and prognosis, slow cognitive decline, reduce comorbidity and impact quality of life and caregiver burden.


Author contributions: MGV was responsible for conducting the literature search, designing the research protocol, evaluating participants, interpreting results, writing the protocol and manuscript. EGC was responsible for designing the research protocol, evaluating participants, extracting and analyzing data, and interpreting results. DA was responsible for designing the protocol, evaluating participants, and interpreting results. CGH was responsible for conducting the literature search and writing the report. DV was responsible for extracting and analyzing data and creating the tables and figures. AJ contributed to the design of the research protocol, clinical evaluation of participants, and extraction of data. JEV contributed to the research protocol, evaluated participants, and extracted data. GDR was responsible for methodological review of the protocol, literature search, interpreting results and conclusions. CAT contributed to interpreting results and reviewing and editing the report. FL helped interpreting the results and provided feedback on the report.

Conflict of interest: Dr. Gomez Vega, Dr. Aguillon and Dr. Tobon report grants from Ministerio de Ciencia, Tecnología e Innovación-Minciencias, during the conduct of the study; Dr. Lopera reports grants from Minciencias, during the conduct of the study; grants from API COLOMBIA, outside the submitted work; Dr. Garcia-Cifuentes, Dr. Velez, Dr. Jaramillo-Jimenez, Dr. Vasquez, Dr. Gomez Henck, and Dr. Deossa Restrepo have nothing to disclose.

Ethical standards: Written informed consent was obtained from participants and their caregivers before study participation and publication. The study was approved by the ethics committee of the Institute of Medical Research – School of Medicine of the University of Antioquia act 005 /2020. All procedures followed were following the ethical standards of the Helsinki Declaration.

Acknowledgments: We thank the participants and family members enrolled in the longitudinal follow-up by the Group of Neurosciences of Antioquia for their kind contribution to science during the last 30 years. We also thank the Ministry of Sciences of Colombia and Colciencias for their support in providing research funding awarded to MGV in the Joven Investigador Profesional de Colciencias call (JIC-14-2019).

Funding sources: This research was supported by the Ministry of Sciences of Colombia and Colciencias, immersed in the project: “Identificación de biomarcadores preclínicos en enfermedad de Alzheimer a través de un seguimiento longitudinal de la actividad eléctrica cerebral en poblaciones con riesgo genético” executed by the Group of Neurosciences of Antioquia and Group Neuropsychology and Conduct (Project number: 111577757635). The sponsors had no role in the design and conduct of the study; in the collection, analysis, and interpretation of data; in the preparation of the manuscript; or the review or approval of the manuscript.

Availability of data and material: All authors have full access to the data.


SUPPLEMENTARY MATERIAL1


References

1. Querfurth HW, Laferla FM. Alzheimer’s Disease. N Engl J Med. 2010;362(4):329–44.
2. Acosta-Baena N, Sepulveda-Falla D, Lopera-Gómez CM, Jaramillo-Elorza MC, Moreno S, Aguirre-Acevedo DC, et al. Pre-dementia clinical stages in presenilin 1 E280A familial early-onset Alzheimer’s disease: A retrospective cohort study. Lancet Neurol. 2011;10(3):213–20.
3. Lopera F, Ardilla A, Martínez A, Madrigal L, Arango-Viana JC, Lemere CA, et al. Clinical features of early-onset Alzheimer disease in a large kindred with an E280A presenilin-1 mutation. J Am Med Assoc. 1997;277(10):793–9.
4. Ryman DC, Acosta-Baena N, Aisen PS, Bird T, Danek A, Fox NC, et al. Symptom onset in autosomal dominant Alzheimer disease. Neurology. 2014;83(3):253–60.
5. García-Ptacek S, Faxén-Irving G, Čermáková P, Eriksdotter M, Religa D. Body mass index in dementia. Eur J Clin Nutr. 2014;68(11):1204–9.
6. White H, Pieper C, Schmader K. The Association of Weight Change in Alzheimer’s Disease with Severity of Disease and Mortality: A Longitudinal Analysis. J Am Geriatr Soc. 1998;46(10):1223–7.
7. Grundman M, Corey-Bloom J, Jernigan T, Archibald S, Thal LJ. Low body weight in Alzheimer’s disease is associated with mesial temporal cortex atrophy. Neurology. 1996;46(6):1585–91.
8. Engelhart MJ, Geerlings MI, Meijer J, Kiliaan A, Ruitenberg A, Van Swieten JC, et al. Inflammatory Proteins in Plasma and the Risk of Dementia: The Rotterdam Study. Arch Neurol. 2004;61(5):668–72.
9. Stanciu I, Larsson M, Nordin S, Adolfsson R, Nilsson LG, Olofsson JK. Olfactory Impairment and Subjective Olfactory Complaints Independently Predict Conversion to Dementia: A Longitudinal, Population-Based Study. J Int Neuropsychol Soc. 2014;20(2):209–17.
10. Kimura A, Sugimoto T, Kitamori K, Saji N, Niida S, Toba K, et al. Malnutrition is Associated with Behavioral and Psychiatric Symptoms of Dementia in Older Women with Mild Cognitive Impairment and Early-Stage. Nutrients. 2019;11(8):1–14.
11. Tamura B, Masaki K, Blanchette P. Weight Loss in Patients with Alzheimer’s Disease. J Nutr Elder. 2008;26(3–4):21–38.
12. Little MO. Updates in nutrition and polypharmacy. Curr Opin Clin Nutr Metab Care. 2018;21(1):4–9.
13. Magierski R, Kłoszewska I, Sobow T. Evaluation of the influence of metabolic processes and body composition on cognitive functions: Nutrition and Dementia Project (NutrDem Project). Eur J Clin Nutr. 2014;68(11):1200–3.
14. Lefèvre-Arbogast S, Wagner M, Proust-Lima C, Samieri C. Nutrition and Metabolic Profiles in the Natural History of Dementia: Recent Insights from Systems Biology and Life Course Epidemiology. Curr Nutr Rep. 2019;8(3):256–69.
15. Nicolia V, Lucarelli M, Fuso A. Environment, epigenetics and neurodegeneration: Focus on nutrition in Alzheimer’s disease. Exp Gerontol J. 2014;1–5.
16. Soto ME, Secher M, Gillette-Guyonnet S, Van Kan GA, Andrieu S, Nourhashemi F, et al. Weight Loss and Rapid Cognitive Decline in Community-Dwelling Patients with Alzheimer’s Disease. J Alzheimer’s Dis. 2012;28(3):647–54.
17. Vellas B, Lauque S, Gillette-Guyonnet S, Andrieu S, Cortes F, Nourhashemi F et al. Impact of nutritional status on the evolution of Alzheimer’s disease and on response to acetylcholinesterase inhibitor treatment. J Nutr Heal Aging. 2005;9(2):75–80.
18. Chen Y, Sillaire AR, Dallongeville J, Skrobala E, Wallon D, Dubois B, et al. Low Prevalence and Clinical Effect of Vascular Risk Factors in Early-Onset Alzheimer’s Disease. J Alzheimer’s Dis. 2017;60(3):1045–54.
19. Gu Y, Scarmeas N, Cosentino S, Brandt J, Albert M, Blacker D, et al. Change in Body Mass Index Before and After Alzheimer’s Disease Onset. Curr Alzheimer Res. 2014;11(4):349–56.
20. Muñoz AM, Agudelo GM, Lopera FJ. Diagnóstico del estado nutricional de los pacientes con demencia tipo Alzheimer registrados en el Grupo de Neurociencias, Medellín, 2004. Biomédica. 2006;26(1):113–25.
21. Gerritsen AAJ, Bakker C, Verhey FRJ, de Vugt ME, Melis RJF, Koopmans RTCM, et al. Prevalence of Comorbidity in Patients With Young-Onset Alzheimer Disease Compared With Late-Onset: A Comparative Cohort Study. J Am Med Dir Assoc. 2016;17(4):318–23.
22. Panegyres PK, Chen HY. Differences between early and late onset Alzheimer’s disease. Am J Neurodegener Dis. 2013;2(4):300–6.
23. Petersen RC, Doody R, Kurz A, Mohs RC, Morris JC, Rabins P V., et al. Current Concepts in Mild Cognitive Impairment. Arch Neurol. 2001;58(12):1985–92.
24. McKhann G, Knopman DS, Chertkow H, Hyman BT, Jack Jr CR, Kawas CH, et al. The diagnosis of dementia due to Alzheimer’s disease: Recommendations from the National Institute on Aging- Alzheimer’s Association workgroups on diagnostic guidelines for Alzheimer’s disease. Alzheimers Dement. 2012;7(3):263–9.
25. Reisberg B, Ferris S, De Leon M, Crook T. The Global Deterioration Scale for Assessment of Primary Degenerative Dementia. Am J Psychiatry. 1982;139(9):1136–9.
26. Clark RF, Hutton M, Fuldner M, Froelich S, Karran E, Talbot C et al. The structure of the presenilin 1 (S182) gene and identification of six novel mutations in early onset AD families. Nat Genet. 1995;11(2):219–22.
27. Barbe C, Jolly D, Morrone I, Wolak-Thierry A, Dramé M, Novella J-L, et al. Factors associated with quality of life in patients with Alzheimer’s disease. BMC Geriatr. 2018 Jul;18(1):159.
28. Berndt S, Maier C, Schütz HW. Polymedication and medication compliance in patients with chronic non-malignant pain. Pain. 1993 Mar;52(3):331–9.
29. Navickas R, Petric V-K, Feigl AB, Seychell M. Multimorbidity: What Do We Know? What Should We Do? J Comorbidity. 2016;6(1):4–11.
30. da Câmara SMA, Alvarado BE, Guralnik JM, Guerra RO, Maciel ÁCC. Using the Short Physical Performance Battery to screen for frailty in young-old adults with distinct socioeconomic conditions. Geriatr Gerontol Int. 2013;13(2):421–8.
31. Savva GM, Donoghue OA, Horgan F, O’Regan C, Cronin H, Kenny RA. Using Timed Up-and-Go to identify frail members of the older population. J Gerontol A Biol Sci Med Sci. 2013 Apr;68(4):441–6.
32. Alberti KGMM, Eckel RH, Grundy SM, Zimmet PZ, Cleeman JI, Donato KA, et al. Harmonizing the metabolic syndrome: A joint interim statement of the international diabetes federation task force on epidemiology and prevention; National heart, lung, and blood institute; American heart association; World heart federation; International . Circulation. 2009;120(16):1640–5.
33. World Health Organization. El estado físico: Uso e interpretación de la antropometría [Internet]. OMS, Serie de Informes Técnicos. 1993. Available from: http://whqlibdoc.who.int/trs/WHO_TRS_854_spa.pdf?ua=1
34. Guerin O, Soto ME, Brocker P, Robert PH, Benoit M, Vellas B et al. Nutritional status assessment during Alzheimer’s disease: results after one year (the REAL French Study Group). J Nutr Heal Aging. 2005;9(2):81—84.
35. Vellas B, Guigoz Y, Garry PJ, Nourhashemi F, Bennahum D, Lauque S, et al. The Mini Nutritional Assessment (MNA) and Its Use in Grading the Nutritional State of Elderly Patients. Nutrition. 1999;15(2):116–22.
36. Demirel B, Atasoy BM. Comparison of Three Nutritional Screening Tools to Predict Malnutrition Risk and Detect Distinctions Between Tools in Cancer Patients Receiving Radiochemotherapy. Nutr Cancer. 2018;70(6):867–73.
37. Nestle Nutrition Institute. Cribado Nutricional. Guía para rellenar el formulario Mini Nutricional Assessment [Internet]. Nestle Nutr Inst Workshop Ser. 2015. p. 20. Available from: http://www.mna-elderly.com/forms/mna_guide_spanish.pdf
38. Torres VL, Vila-Castelar C, Bocanegra Y, Baena A, Guzmán-Vélez E, Aguirre-Acevedo DC, et al. Normative data stratified by age and education for a Spanish neuropsychological test battery: Results from the Colombian Alzheimer’s prevention initiative registry. Appl Neuropsychol. 2019;0(0):1–15.
39. Folstein MF, Folstein SE, McHugh PR. “Mini-Mental State” A practical method for grading the cognitive state of patients for the clinician. J psychiat Res. 1975;12:189–98.
40. Mahonei FI, Barthel DW. Functional Evaluation: The Barthel Index. Md State Med J. 1965;14:61–5.
41. Zou G. A Modified Poisson Regression Approach to Prospective Studies with Binary Data. Am J Epidemiol. 2004;159(7):702–6.
42. Barros AJD, Hirakata VN. Alternatives for logistic regression in cross-sectional studies: An empirical comparison of models that directly estimate the prevalence ratio. BMC Med Res Methodol. 2003;3:1–13.
43. R Core Team. R: A language and environment for statistical computing. R Foundation for Statistical Computing [Internet]. Viena, Austria; 2019. Available from: https://www.r-project.org/.
44. Jang JW, Kim Y, Choi YH, Lee JM, Yoon B, Park KW, et al. Association of nutritional status with cognitive stage in the elderly Korean population: The Korean brain aging study for the early diagnosis and prediction of alzheimer’s disease. J Clin Neurol. 2019;15(3):292–300.
45. Droogsma E, Van Asselt DZB, Scholzel-Dorenbos CJM, Van Steijn JHM, Van Walderveen PE, Van Der Hooft CS. Nutritional status of community-dwelling elderly with newly diagnosed Alzheimer’s disease: Prevalence of malnutrition and the relation of various factors to nutritional status. J Nutr Heal Aging. 2013;17(7):606–10.
46. Tombini M, Sicari M, Pellegrino G, Ursini F, Insardá P, Di Lazzaro V. Nutritional Status of Patients with Alzheimer’s Disease and Their Caregivers. J Alzheimer’s Dis. 2016;54(4):1619–27.
47. Abellan Van Kan G, Vellas B. Is the mini nutritional assessment an appropriate tool to assess frailty in older adults? J Nutr Heal Aging. 2011;15(3):159–61.
48. Zadak Z, Hyspler R, Ticha A, Vlcek J. Polypharmacy and malnutrition. Curr Opin Clin Nutr Metab Care. 2013;16(1):50–5.
49. Olde Rikkert MGM, Verhey FR, Sijben JWC, Bouwman FH, Dautzenberg PLJ, Lansink M, et al. Differences in nutritional status between very mild Alzheimer’s disease patients and healthy controls. J Alzheimer’s Dis. 2014;41(1):261–71.
50. Volkert D, Chourdakis M, Faxen-Irving G, Frühwald T, Landi F, Suominen MH, et al. ESPEN guidelines on nutrition in dementia. Clin Nutr. 2015;34(6):1052–73.
51. Kane RL, Shamliyan T, Talley K, Pacala J. The association between geriatric syndromes and survival. J Am Geriatr Soc. 2012;60(5):896–904.
52. Soto-Mercado V, Mendivil-Perez M, Velez-Pardo C, Lopera F, Jimenez-Del-Rio M. Cholinergic-like neurons carrying PSEN1 E280A mutation from familial Alzheimer’s disease reveal intraneuronal sAPPβ fragments accumulation, hyperphosphorylation of TAU, oxidative stress, apoptosis and Ca2+ dysregulation: Therapeutic implications. PLoS One [Internet]. 2020;15(5):1–29. Available from: http://dx.doi.org/10.1371/journal.pone.0221669
53. Robertson DA, Savva GM, Kenny RA. Frailty and cognitive impairment-A review of the evidence and causal mechanisms. Ageing Res Rev [Internet]. 2013;12(4):840–51. Available from: http://dx.doi.org/10.1016/j.arr.2013.06.004

PREVALENCE OF UNDER NUTRITION AND ASSOCIATED FACTORS AMONG PEOPLE OF OLD AGE IN DEBRE MARKOS TOWN, NORTHWEST ETHIOPIA, 2015


Z.K. Adhana1, G.H. Tessema2, G.A. Getie3


1. Missionaries of Charity – Ethiopia, Psychologist and program coordinator, Debremarkos, Ethiopia; 2. Department of Public Health, College of Health Sciences, Debre Markos University, Debre Markos, Ethiopia; 3. Department of Nursing, College of Health Sciences, Debre Markos University, Debre Markos, Ethiopia.

Corresponding Author: Zinabu Kebede Adhana, Missionaries of Charity – Ethiopia, Psychologist and program coordinator, Debremarkos, Ethiopia, alamata2007@yahoo.com
J Aging Res Clin Practice 2019;8:20-26
Published online January 24, 2019, http://dx.doi.org/10.14283/jarcp.2019.4


Abstract

Background: Malnutrition is defined as a disproportion of nutrients caused by either an excess intake of nutrients or a nutritional deficit. One of the most common nutritional problems in older people (aged 60 years and over) is under nutrition. Worldwide studies revealed that the prevalence of under nutrition in people of old age is high. Objective: To assess the prevalence of under nutrition and its associated factors among old people in Debre Markos town, Northwest Ethiopia, 2015. Methods and materials: A cross sectional study design was conducted among 423 study subjects of old age in Debre Markos town from August 4 to August 30, 2015. Primary data was collected using a pre tested Mini Nutritional Assessment Short-Form (MNA-SF) screening tool and structured questionnaires by trained data collectors. The data that was collected was entered and cleaned using EpiData version 3.1 statistical software then exported to the SPSS version 20 statistical package for further data analysis. Descriptive statistics of frequency, tables and graphs were used and summary measures were calculated to determine the prevalence of under nutrition. The data was also used to describe the distribution of the independent variables among study subjects. Bivariate and multivariate logistic regression models were utilized to calculate crude and adjusted odds ratios in order to identify factors associated with under nutrition of study participants at 0.05 level of significance. Result: The prevalence of under nutrition among study participants was found to be 22.7% (95%CI 18.7-26.7). A number of independent variables have a significant association with under nutrition, including gender (females (AOR 7.95 95% CI (2.86, 22.08)), age (Oldest Old and Middle Old, (AOR=3.45 95%CI (1.44, 8.26) and (AOR=5.25, 95%CI (2.48, 11.13) respectively), marital status (widowed elderly individuals (ARO 3.29 95 % CI (1.54, 7.06)), individuals with eating difficulty (AOR 10.73 95 % CI (4.49, 25.63), individuals with vision problems (AOR 5.67 95 % CI (2.80, 11.48) and meal frequency (ARO 6.71 95 % CI (3.31, 13.63). Conclusion and recommendation: Prevalence of under nutrition among study participants was 22.7%. Gender, age, marital status, eating difficulty, visual problems and meal frequency were found to be independent determinant factors of under nutrition among study subjects. The government, family members and other stakeholders should give more attention to older individuals especially older females.

Key words: Under nutrition, old age, prevalence, mini nutritional assessment


Introduction

Malnutrition is a general term that refers to both under-nutrition and over-nutrition. Under-nutrition is due to inadequate food intake, dietary imbalances, and deficiencies of specific nutrients (1). Undernourishment is common in older persons. Nutritional deficiencies in older persons have serious negative consequences which can increase morbidity and mortality, hospitalization, development of ulcer and infections (2). Involuntary weight loss can result in a reduction in the ability to care for oneself, loss of mobility and independence and a poorer quality of life (3).
The elderly population is growing worldwide. There were approximately 810 million persons aged 60 years and over in the world in 2012 and this number is projected to grow to more than 2 billion by 2050 (6). In 2014, the annual growth rate for the population aged 60 years and older will be almost triple the growth rate for the population as a whole (7) one out of every nine persons in the world is aged 60 years or over (6). In 2014, about two thirds of the world’s population aged 60 years and older lived in the less developed regions (7). By 2050, one out of every five persons is projected to be in that age group and one in 16 persons in Africa (6). In general, the number of older person is increasing rapidly and unexpectedly in all parts of the world. Although aging is evolving fast in the more developed regions, the less developed regions will over a much shorter period of time (6).
In Ethiopia, due to serious shortage of data, it is difficult to provide detailed analysis about the socio-economic conditions of older persons (4). Even though it is difficult to provide detailed analysis about the old age population of Ethiopia, the UN report shows that the population aged 60+is growing rapidly (6).
Older adults are at the greatest risk for becoming undernourished. Undernourishment may result in impairment, lowered resistance to infection; poor wound healing, and prolonged hospitalization with increased morbidity and mortality (8). Additionally, medical co-morbidities and a host of other factors, such as economic, geographic, and psychosocial concerns, can also affect diet behaviors and thus nutritional status (9).
Under nutrition among old age is a substantial problem globally. World-wide, the older population is increasing, and with it, the prevalence of under nutrition. The prevalence of under nutrition is undeniably high; worldwide the overall prevalence is 22.6% (15). The prevalence of under nutrition in older African men (9.5–36.1%) and women (13.1–27%) (16). In Ethiopia, the prevalence of under nutrition in old age people is remains high, as a study conducted in Gondar revealed that the prevalence of under nutrition among old age people was 21.9% (17).
More generally, the study of under nutrition in the 60+ age group in Ethiopia has been neglected. Most of the studies conducted on under nutrition in Ethiopia focus on mothers and children; producing more data related to the nutritional status of those within the old age group will fill the existing knowledge gap.

Objectives

* To determine the prevalence of under nutrition among old age people in Debre Markos town.
* To identify associated factors with under nutrition of old age people in Debre Markos town.


Method and material

Study design

A community based cross-sectional study design was conducted.

Study area and period

The study was conducted in Debre Markos Town. Debre Markos is the town of East Gojjam Administrative Zone; which is located in the Northwest of Addis Ababa at a distance of 300 Kms. With regard to the population of the town it is estimated to be 107684 of which 57791 are females and 49893 are males (34). Out of this total population the number of old age population is estimated at 3000 and from this estimated total number 1800 old age individuals (1276 females and 524 males) are officially registered (35). The data was collected from August 4, 2015 to August 30, 2015.

Source population

All old people who are living in Debre Markos town.

Study population

All old individuals who are officially registered in Debre Markos town.

Inclusion criteria

All old individuals greater than or equal to sixty years old, who are already registered in Social and Labor Office and were available during data collection period, were included in this study.

Exclusion criteria

Individuals who are unable to respond due to critical illness during data collection were excluded from this study.

Sample size determination

The sample size was calculated using single population proportion formula considering 50% prevalence of under nutrition, 0.05 level of type one error, 0.05 marginal error at 95% level of confidence and adding 10 % non-response rate. The final sample size was 423.

Sampling procedure

Primarily the total number of households was identified through reviewing records from the social and labor office. All individuals were then framed using their particular code number of the house and their name. From this list, sampled individuals were drawn through systematic random sampling technique from already registered individuals. The total number of registered individuals were (N=1800) and then calculated sampling fraction (Kth). A lottery method was used to get the first sampled individual from 1-4 sampling intervals. With a random start of two every fourth individual was included in to the study.

Variables of the study

Under nutrition of old age individuals is considered to be the dependent variable while socio-demographic variables (age, sex, marital status, ethnicity, family number, educational status, occupation, income), medical condition, smoking, feeding frequency (one times, two times and three times per day), food-cooking style (self, spouse, children, and/or maid) and feeding mode (unable to eat without assistance, self-fed with some difficulty, self-fed without any problem) are independent variables.

Operational definition

Old age people: those individuals aged ≥ 60 years old. Young old: individuals’ age group from 60 – 74 years old. Aged: individuals’ age group from 75 – 84 years old. Oldest old: individuals’ age group from 85+ years old (37). Nutritional status: for this study individuals who had >7 score were considered as having normal nutritional status (by merging normal nutrition and risk of under nutrition) and who had a score <=7 considered as having under nutrition. Dementia status: for this study, according to 6 CIT – King shill Version 2000, Dementia screening tool individuals who had a score of between 0 and 7 was considered as having normal score (no dementia), where as individuals who had a score of between 8 and 10 were considered as having mild dementia and individuals who had a score of between 10 and 28 were considered as having severe dementia.

Data collection instrument and measurement

The data was collected from participants’ by the means of structured questionnaire to address socio-demographic, socioeconomic, health and individual life style old age individuals and Mini Nutritional assessment Short – Form (MNA-SF) was used to assess nutritional status of old age individuals. The MNA-SF screening tool has five questionnaires and one anthropometric measuring tool on food intake, weight loss, mobility, psychological stress or acute disease, presence of dementia or depression and body mass index (BMI). When height and/or weight cannot be assessed, an alternate scoring for BMI is then included in the measurement of calf circumference.

Data processing and analysis

The data was entered into EpiData version3.1 software. It was then exported to SPSS version 20 for further data analysis. Binary logistic regression analysis was the fitted model to distinguish the effect of each independent variable on the dependent variable. Variables had a p-value

Ethical considerations

Ethical clearance was obtained from Debre Markos University health science college ethical review committee; further permission letters were also secured from each formal sector institutions in Debre Markos town. Informed consent was obtained from each study participants. Privacy and confidentiality was maintained.


Result and Discussion

Socio demographic and economic characteristics of respondents:

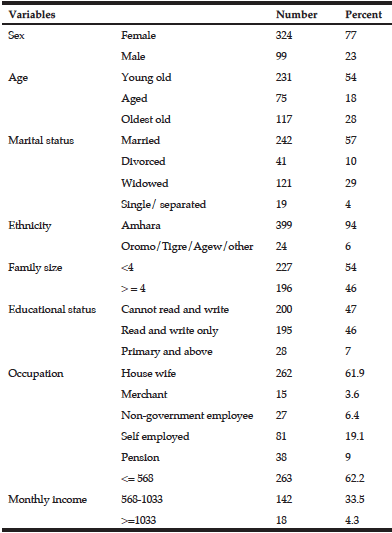
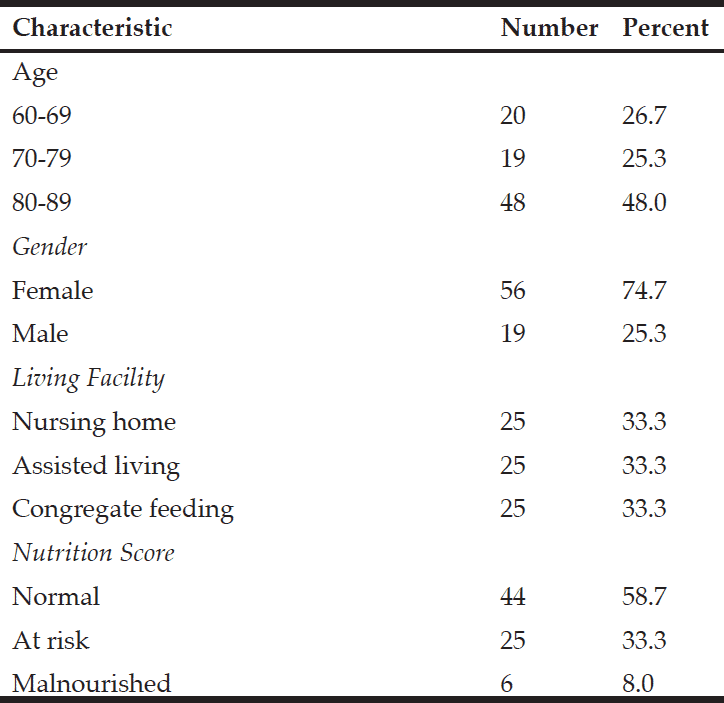
Of the study participants, three-fourth (77%, n=324) of them were females. The median age of the respondents was 72 years, ranging from 60 to 90 years old. More than half (57%, n=242) of the respondents were married while few (4%, n=19) were either separated or single in their marital status. The most (94%, n=399) were Amhara in their ethnicity. About 47% (n=200) of the respondents responded that they could not read and write while 46% (n=195) could read and write only by their educational status. Regarding to occupation, 62% (n=262) were house wife while few 4%, (n= 15) were merchants. The majority (62%, n=263) of the respondents had a monthly income 567 or less ETB. While 34% (n=142) and 4% (n=18) had 568-1033 and 1034 or greater ETB, respectively (Table 1).

Table 1 Socio-demographic and Socioeconomic characteristics of elderly people in Debre Markos town, Northwest Ethiopia, 2015

Table 1
Socio-demographic and Socioeconomic characteristics of elderly people in Debre Markos town, Northwest Ethiopia, 2015


Medical conditions and life style characteristics of the study participants

Medical conditions

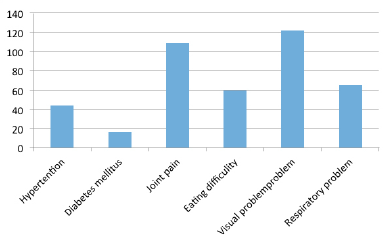
Among total study participants more than half (58%, n=245) responded as they had faced one or more medical illness at least once in their older life time. Of those that faced medical illness, visual problems were the most frequently self-reported illness, as reported by 29% (n=122) of the respondents, meanwhile the least frequently faced illness was diabetes mellitus (4%, n=17) (Fig1).

Figure 1 Self-reported medical condition of the study participants in Debre Markos town, Northwest Ethiopia, 2015

Figure 1
Self-reported medical condition of the study participants in Debre Markos town, Northwest Ethiopia, 2015


Life style characteristics of study participants

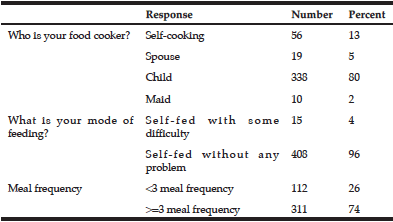
All of the study participants responded that they did not smoke. The majority (80%, n=338) of the respondents were responded as their children cooking their meals and the least number of respondents (2%, n=10) indicated that they had a maid cooking for them. Regarding mode of feeding, most (96%, n=408) of the study participants, responded as they could self-feed without any problem. In addition nearly three-fourth (74%, n=311) of the respondent replied as they have had a frequency of 3 or more meals per day (Table 2).

Table 2 Life style characteristics of study participants in Debre Markos town, Northwest Ethiopia, 2015

Table 2
Life style characteristics of study participants in Debre Markos town, Northwest Ethiopia, 2015


Nutritional status of the study participants

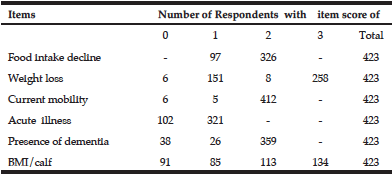
The nutritional status of the study participants were determined using the four level (0-3) multiple items (6) score scaling techniques of the MNA-SF screening tool. The tool is statistically reliable with the Cronbach score of α = 0.74. Based on the assessment, the average item score was found to be 1.84± 0.76 standard deviation with the variance of 0.58. Of the respondents, 22.7% (n=96) were found to be under nutrition with a cumulative score of seven or less assessment items. The remaining 77.7% (n=327) were found to be well-nourished with cumulative score of greater than seven nutritional assessment items (see summary based on item score Table 3).


Table 3 A Mini Nutritional Assessment (MNA-SF) item score among study participants in Debre Markos town, Northwest Ethiopia, 2015

Table 3
A Mini Nutritional Assessment (MNA-SF) item score among study participants in Debre Markos town, Northwest Ethiopia, 2015


Factors associated with nutritional status of old age individuals

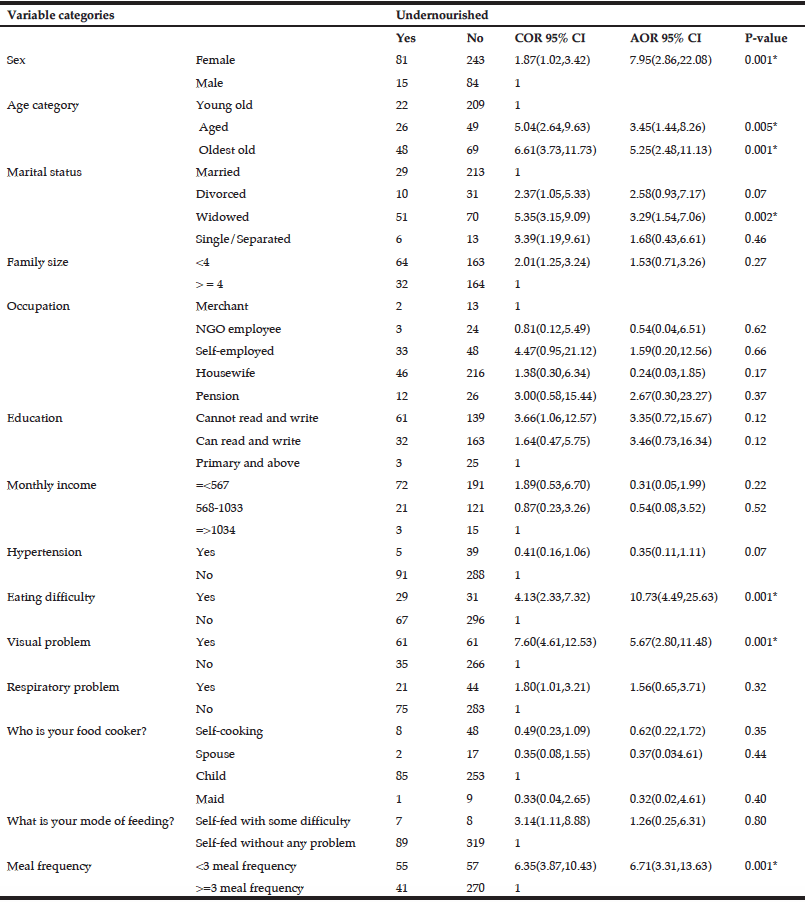
Gender was found to be a significant variable; females were nearly eight times more likely to suffer from under nutrition as compared to males (AOR 7.95 95% CI (2.86, 22.08). Age was also found to be associated with under nutrition in elderly people. The oldest old and middle old ((AOR=3.45 95%CI (1.44, 8.26), (AOR=5.25, 95%CI (2.48, 11.13) respectively) were more likely to suffer from under nutrition than younger old people.
Regarding marital status, widowed individuals were 3.3 times more likely to suffer from under nutrition (AOR 3.29 95 % CI (1.54, 7.06). Elderly people who had difficulty eating were 10.73 times more likely to suffer from under nutrition (AOR 10.73 95 % CI (4.49, 25.63). Also elderly participants with vision problems were 5.67 times more likely to suffer from under nutrition (AOR 5.67 95 % CI (2.80, 11.48). Finally, elderly individuals who had meal less than three times per a day were 6.71 times more likely to suffer from under nutrition (AOR 6.71 95 % CI (3.31,13.63) (Table 4).

Table 4 Bi-variable and multiple variable logistic regressions for nutritional status among participants in Debre Markos town, Northwest Ethiopia, 2015

Table 4
Bi-variable and multiple variable logistic regressions for nutritional status among participants in Debre Markos town, Northwest Ethiopia, 2015

* Statistically Significant


Discussion

In this study the prevalence of under nutrition among old age individuals was found 22.7 % of those sampled. This finding was similar with studies done in Gondar, Ethiopia (21.9%) and Rural Bangladesh (26%) (17, 20) and lower prevalence compared to those reported in Bogota, Colombia (4.58%) and Sargodha city, Pakistan (5.53%) (22, 27). These differences could be created by the variation of geographic, socioeconomic and inclusion or exclusion criteria of the study participants.
Regarding the association between sex and under nutrition, this study revealed a significant difference between females and males. Females were nearly eight times more likely to be undernourished than males. This was supported by studies done in Gondar, Ethiopia which shows that females were three times more likely to be undernourished than males and in Calcutta, India which reported that females were vulnerable (8.9%) than males (4.9%) to be undernourished (17, 21). The reason female older individuals are more vulnerable for under nutrition could be explained by the fact that the older population is predominantly female and tend to live longer than men (26) and it may also be due to the fact that older females still remain the care takers of their grandchildren and they receive less than the care necessary for themselves. Another possible implication could be due to cultural influence. However, the present study contradicts with a study done in Sargodha city, Pakistan which reported under nutrition was more prominent in older males (3.16%) as compared to the older females (2.37%) (27). This difference could also be created by the variation of geographic and socioeconomic status of the study participants.
Age is found to have a significant association with under nutrition in older people. Under nutrition was most common in the aged (75-84 years) and oldest old (85 years and above) age groups compared with young old age group. This finding was similar to a study done in Gondar, Ethiopia which states that oldest old and middle old were more likely to be undernourished than young old people (38.1 and 14.6) respectively (17). As age increases the risk of under nutrition increases. This might be due to the natural aging process accompanied by physiological changes which can negatively impact nutritional status and cause inadequate nutrition (11, 18).
Marital status was one of the factors that affected the nutritional status of elderly individuals. Individuals who are widowed/ widower were 3.3 more likely to be undernourished compared to those who are married. This finding was supported by study done in Portugal which was assessed the nutritional status of older adult in the community and reported that widowed individuals were 6.73 times more likely to be undernourished than non-widowed older individuals (29). The reason could be that being alone as a result of the death of one of the mates decreases social relations and economic deficiencies (18). These changes may cause inadequate nutrition. The loss of one’s mate may also be associated with loss of motivation to prepare and eat food. In this case, grief is considered a heavy burden that contributes to reduction of food intake which thereby increases risk of undernourishment.
Eating difficulties, there was found to be a significant association with under nutrition. The participants who had reported eating problem were nearly eleven times more likely to be undernourished. Eating difficulties may be a result of oral problems such as decrease in number of teeth, usage of dental facilities, which leads to problems in chewing food. This particular problem relies on the presence of adequate teeth or dentures, and saliva flow (10, 18). This could be a barrier to the intake of different nutritional elements and make the important meal situation problematic in an older individuals and lead to the need for several adaptations with regard to food choice and preparation (33) and which may lead eventually under nutrition.
With regard to visual problem, there was significant association with elderly under nutrition. According to this study old age people with visual problem were nearly six times more likely to be undernourished compared to those elderly without visual problem. This could be due to older individual with visual impairment may not be able to prepare, shop, and cook and/or properly select their food. Moreover, if they live with their children, they may not receive enough attention and/or they may be served food that is either low in quality or in quantity that can affect nutritional status.
Finally, meal frequency was a factor which showed significant association with elderly under nutrition (


Conclusion and Recommendation

This study revealed that the prevalence of under nutrition among study participants is high in Debre Markos town Northwest, Ethiopia. It was also indicated that sex, age, marital status, eating difficulty, visual problems and meal frequency were found to be independent determinant factors of under nutrition among old age individuals, especially among female individuals of old age. It is very important to merge nutritional management with clinical practice for elderly individuals and that consideration is given to individuals who have visual problems and eating difficulties. Researchers should conduct further comprehensive nutritional assessments of the elderly, and in addition, intervention programs supported by the government which target the elderly under nutrition should be strengthened.

Limitation of the Study

The limitation of this study was; it focused only on the urban elderly individuals and might not represent the rural residents.


Acknowledgment: We would like to thank Debre Markos University and GAMBY College of Medical Sciences for giving us the chance to do this study. We would like to acknowledge the data collectors and study participants.

Authors’ contribution: All authors designed the proposal, oversaw the measurement tool, participated in data collection arrangement and supervision, checked the collected data, analyzed and interpreted it. They also checked the final report of the research.

Conflict of interest: All the authors in this study declare neither financial nor non-financial competing interests.

Ethical Standard: This study was approved by Debre Markos University health science college human research ethical committee and complied with current laws governing ethics in research.


References

1. Katherine MURPHY. Malnutrition in the community and hospital setting. The patient association. August 2011, 54
2. Karen E. CHARLTON, Monica FERREIRA, and Jean M FOURIE. Chapter 8, Nutrient Requirements and Factors Affecting Nutritional Status in Older Adults. In: Norman J TEMPLE and Nelia P STEYN. Community Nutrition Textbook for Developing Countries. 2008, 159
3. Anne SCHNEYDER. Malnutrition and Nutritional Supplements. Australian prescriber. August 2014, V. 37: No. 4
4. United Nations Department of Economic and Social Affairs. Population aging and development. 2012, available at: http//www.unpopulation.org
5. United Nation (UN): Department of Economic and Social Affairs Population Division Concise Report on the World Population Situation in 2014: A Concise Report, 2014: 24
6. Ethiopian Ministry of Labor and Social Affairs: General condition of the elderly: 2011, available at http://www.molsa.gov.et/English/SWD/Pages/SituationofElderly.aspx
7. Kathy FLAMMOND. Chapter 14, Dietary and Clinical Data Assessment. In: Yvonne ALEXOPOULOS, Kristin HEBBERD and Heather BAYS. Krause’s Food and Nutrition therapy. USA: International Edition: 2008, 12 editions, 383
8. Connie Watkins BALES and Mary Ann JOHNSON. Chapter 56, Nutrition in Older adults’. In: A. Catharine ROSS, Benjamin CABALLERO, Robert J. COUSINS, Katherine L. TUCKER and Thomas R. Ziegler. Modern Nutrition in Health and Disease. USA: Williams and Wilkins, a Wolters Kluwer business, 2014, Eleventh edition, 745
9. Nestle Nutrition institute MNA®, Mini Nutritional Assessment. The problem malnutrition: available at http//www.mna-elderly.com/the_problem_malnutrition.html
10. Karen E. CHARLTON and Donald ROSE. Nutrition among Older Adults in Africa; the Situation at the Beginning of the Millennium. J. Nutr., 2001, 131, 2424S
11. Tessfamichael D, Gete AA, Wassie MM. High Prevalence of Under nutrition among Elderly People in Northwest Ethiopia: A Cross Sectional Study. J Nutrition Health Food Sci. 2014,2(4):1-5
12. Debre Markos University: Official Website of Debere Markos University, 2013, available at: http// web.dmu.edu.et/test-dmu-site/index.php/category…/debre-markos
13. Debre Markos town woreda administrative women, youth and children office, 2015
14. Nigerian National Population Commission: National Population Census 1991 Analysis. The Elderly. Abuja: 2004, Volume 3.
15. Zarina Nahar KABIR, Tamanna FERDOUS, Tommy CEDERHOLM, Masuma Akter KHANAM, Kim STREATFIED and A°ke WAHLIN. Mini Nutritional Assessment of rural elderly people in Bangladesh: the impact of demographic, socio-economic and health factors. Public Health Nutrition. February 2006, 9(8): 968–974
16. Diego Chavarro-CARVAJAL, Carlos Reyes-ORTIZ, Rafael Samper-TERNENT, Antonio J. ARCINIEGAS, and Carlos Cano GUTIERREZ. Nutritional Assessment and Factors Associated to Malnutrition in Older Adults: A Cross Sectional Study in Bogotá, Colombia. Journal of Aging and Health. 2015, Vol. 27(2): 304–319
17. Mondrita MAJUMDER, IndranilSaha, and Debnath CHAUDHURI. Assessment of Nutritional Risk in Community-Dwelling Older Adults (65 to 75 Years) in Kolkata, India. Journal of Nutrition in Gerontology and Geriatrics. 2014, 33:126–134
18. United Nations. Department of Economic and Social Affairs: Population Division. UN, 2013, available at: http//www.un.org/en/… /desa/population /…/pdf/…/ WorldPopulation Ageing201
19. Abdul GHANI, Sarfraz HUSSAIN, Muhammad ZUBAIR. Assessment of nutritional status of geriatrics population in Sargodha City, Pakistan. Int. J med. Appl. Health. 2013, Vol. 1: 7
20. Width MARY and Reinhard TONIA: Chapter 4, Older Adults. Clinical Dietitian’s Essential Pocket Guide. USA: Lippincott Williams & Wilkins, 2009: 1st Edition, 98
21. Emine AKSOYDAN, Turan BUZGAN, Biriz ÇAKIR and Meltem SOYLU. Old age period and nutrition. Ankara, Turkey: The Republic of Turkey Ministry of Health, November 2006, 2nd Edition (in English)
22. Ana Luísa Moreira dos SANTOS, Teresa Maria de Serpa Pinto Freitas do AMARAL, and Nuno Pedro Garcia Fernandes Bento BORGES. Undernutrition and associated factors in a Portuguese older adult community. Rev. Nutr., Campinas, maio/jun., 2015, 28(3):231-240
23. Ellie WHITNEY and Shoron Rody ROLFES: Chapter 17, Life Cycle Nutrition: Adulthood and the Later Years. Understanding nutrition. USA: Thomson Learning, Inc.,2008: Eleventh edition, 594-601
24. Maria NYBERG, Viktoria OLSSON, Zada PAJALIC, Gerd ÖRTMAN, Håkan S. ANDERSSON, Anna BLÜCHER, Karin WENDIN & Albert WESTERGREN: Eating difficulties, nutrition, meal preferences and experiences among elderly a literature overview from a Scandinavian context: Journal of Food Research; Vol. 4, No. 1; 2015

MODIFICATION OF THE MNA-SF FOR COMMUNITY-DWELLING OLDER ADULTS AT RISK OF MALNUTRITION


I. Nakamura1,2, T. Yoshida1, H. Kumagai1


1. Department of Clinical Nutrition, School of Food and Nutritional Sciences,  University of Shizuoka, Shizuoka, Japan; 2. Division of Home Care Service, Fukuoka Clinic, Tokyo, Japan

Corresponding Author: Hiromichi Kumagai M.D. Professor, Department of Clinical Nutrition, School of Food and Nutritional Sciences, University of Shizuoka, 52-1 Yada, Shizuoka 422-8526, Japan, Fax & phone: +81-54-264-5567, E-mail: kumagai@u-shizuoka-ken.ac.jp

 J Aging Res Clin Practice 2017;6:210-216
Published online October 5, 2017, http://dx.doi.org/10.14283/jarcp.2017.28


Abstract

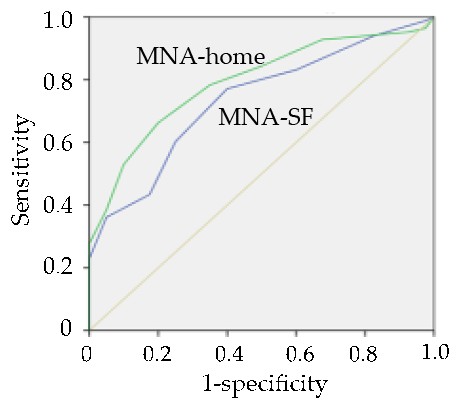
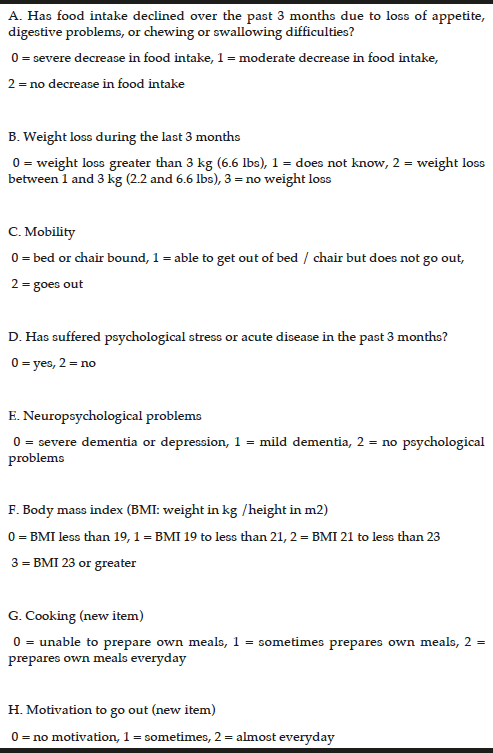
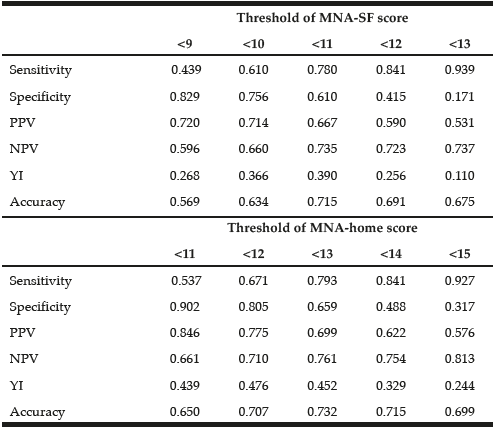
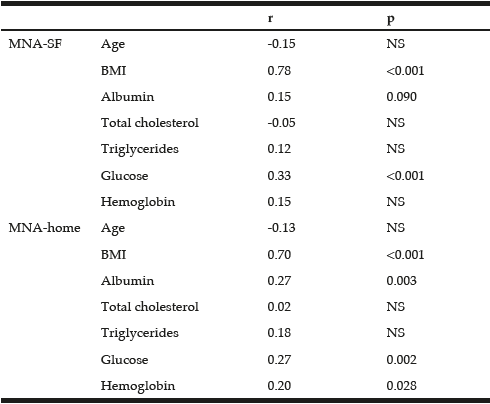
Objectives: The Mini-Nutritional Assessment Short Form (MNA-SF) may be insufficient for screening and assessing the nutritional status of community-dwelling older adults.  We modified MNA-SF to improve the ability for discriminating those at risk of malnutrition. Setting and participants: 123 community-dwelling elderly Japanese. Methods: Nutritional status was examined by the subjective global assessment (SGA), the geriatric nutritional risk index (GNRI) and MNA-SF.  The reference standard for the diagnosis of “at risk of malnutrition” was composed from the SGA and GNRI.  Specific factors associated with malnutrition in community-dwelling older adults were extracted from a literature survey and classified by a principal component analysis.  A new 8-item MNA-home was constructed by adding two items from these components to the MNA-SF and compared with the MNA-SF by applying a receiver operating characteristic (ROC) curve. Results: Among the various potential MNA-home scores, the ROC curve revealed that the MNA-SF plus two items, namely an inability to prepare own meals and no motivation to go out, produced the largest area under the curve (AUC), this value being greater than that from the MNA-SF.  The score of MNA-home was significantly correlated with serum albumin and hemoglobin, although the score of MNA-SF was not.  The cutoff value for predicting at risk of malnutrition was <14 in the MNA-home. Conclusion: The new MNA-home had a better discriminating ability than the MNA-SF to identify those at risk of malnutrition in community-dwelling older adults.  A subsequent long-term study is necessary to validate this MNA-home for correctly discriminating community-dwelling older adults at risk of malnutrition.

Key words: Malnutrition, elderly, mini nutritional assessment, home care.


Introduction

The number of people aged 65 and over in Japan has been increasing for the recent 20 years, resulting in the pace of aging being the highest among any other country in the world (1).  The rising medical cost caused by this increase of elderly people prompted the Japanese government to develop a policy of substituting a long hospital stay by a community-based service.  This policy has been achieved by long-term care insurance (LTCI) that was introduced in 2000 to support the elderly population by integrating health care services and social support services (2).  However, a number of problem has become apparent since this long-term care system was introduced.  First, many elderly people are insisting to return to their homes without satisfactory health care support.  Second, the main caregivers have been family members, and there are consequently a considerable number of cases of care for the elderly by the elderly.  Third, the number of elderly living alone has been increased to 11% for males and 20% for females (1).  Among these people living alone, many have limited contact with other people or have no person that they can rely on.
It had been thought that community-dwelling elderly people do not tend to be malnourished when compared with other situations.  A meta-analysis has shown that the prevalence of malnutrition or at risk of malnutrition was 37.7% when evaluated by the Mini-Nutritional Assessment (MNA) in community dwellers with a mean age of 79.3 yrs (3).  This percentage of malnutrition or at risk of malnutrition is much lower than that for elderly in hospitals (86.0%), nursing homes (67.2%) or rehabilitation (91.7%) settings for a similar age.  In Japan, however, the prevalence of a poor nutritional status is more common, as 60-72% of the elderly living in a community setting have suffered from malnutrition or at-risk of malnutrition (4-6).  The factors associated with malnutrition in the community-living elderly were similar but not equal to those living in hospitals and nursing homes.  The conditions of physical health, comorbidity, anorexia and psychological problems seem to be most common causes of malnutrition for both community-dwelling and institutionalized elderly.  However, the community-dwelling elderly have other specific problems associated with daily living at home, including food insecurity, human relationships, psychiatric problems and inadequate care (7-14).  These circumstances are resulting in increasing demands for nutritional screening and assessment in community-dwelling elderly.
The MNA is a tool specifically developed for assessing the nutritional status of elderly people (15-16).  The MNA comprises 18 items presenting an anthropometric assessment, general assessment, dietary assessment and subjective assessment, and the first six items have been used for screening people with undernutrition as the MNA-short form (SF) (17).  This MNA-SF was revised in 2009 and proposed as a stand-alone nutritional screening tool by adapting three categories of nutritional classification: well-nourished, at risk of malnutrition and malnutrition (18).  While MNA-SF was developed in Western countries for assessing nursing home and hospital-bound elderly people, it has been accepted that a revised MNA-SF can be applicable to a population of community-dwelling elderly (19) and can also be used in Japan (20) and Taiwan (21) by modifying its cutoff point.
However, MNA-SF does not include items related to the foregoing nutritional risks in community-dwelling elderly people.  If MNA-SF were to be further modified by incorporating these specific nutritional risks, the discriminating ability for those at risk of malnutrition by this nutritional screening tool may be increased.  We attempt in the present study to modify the MNA-SF by including two new items associated with the specific nutritional risks encountered by community-dwelling older adults.


Methods

Subjects

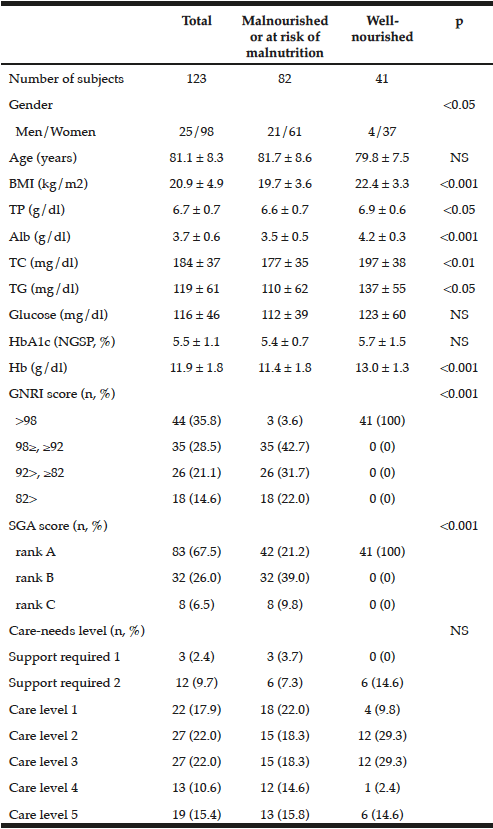
One hundred and twenty-nine community-dwelling elderly Japanese living in Tokyo, Shizuoka and Kochi prefectures (26 men and 103 women; age 81.0 ± 8.3 yr, range 60 – 98 yr) were enrolled in this study.  Any subjects diagnosed with acute infection, cancer or renal failure and those who could not take food by the mouth were excluded from the study (n=6).  The remaining 123 subjects were eligible for the analysis (Table 1).  All the subjects have been receiving various home care services based on public LTCI.  Their care needs were graded into seven levels (support level 1, support level 2, care level 1, care level 2, care level 3, care level 4 and care level 5).  The study protocol was approved by the ethics committee of the University of Shizuoka.  Written consent was obtained from all participants or their legal proxies.

Table 1 Patients’ characteristics

Table 1
Patients’ characteristics

Data are expressed as the mean±SD.  Nutritional status was determined by the joint criterion made from GNRI and SGA.

Anthropometric and serum biochemical measurements

Weight and height were measured for calculating the body mass index (BMI, kg/m2).  The weight (kg) was measured with a portable digital scale and the height (m) was measured by a portable stadiometer.  Those subjects who could not stand up were measured for their recumbent length by a steel measuring tape between two plates placed against the heel and the top of the head (22).  The self-reported height was also used in some cases (22).
A blood sample was taken from each subject at the regular health check, and serum albumin was measured for calculating the geriatric nutritional risk index (GNRI)

Nutritional assessment

Subjective global assessment (SGA), GNRI and MNA-SF were examined in all participants.  SGA is a valid nutritional assessment tool that has been found to be highly predictive of the nutrition-associated clinical outcome (23).  The SGA grade was classified into three levels on the basis of the subject’s history and physical examination: level A, well-nourished; level B, moderately malnourished; level C, severely malnourished.
GNRI is a very simple and objective method for screening the nutritional status of elderly people (24).  It can be calculated by a simple equation in which only three nutritional variables, serum albumin, actual body weight and ideal body weight, are used:
GNRI = [1.489×albumin (g/L)] + [41.7×(weight/ideal weight)]
The weight/ideal weight term is set to unity (1) when the weight exceeds the ideal weight in this equation.  These GNRI values were applied to define four grades of nutritional level in the present study, similar to the original classification: level 1, no risk of malnutrition (GNRI >98); level 2, low risk of malnutrition (GNRI 92 to ≤98); level 3, moderate risk of malnutrition (GNRI 82 to <92); level 4, major risk of malnutrition (GNRI <82).
MNA-SF has also proven to be a simple, non-invasive and valid screening tool for malnutrition in elderly people (17-19).  It comprises six questions chosen from the long form of MNA for identifying individuals at risk of malnutrition.  The maximum possible score of the MNA-SF assessment is 14.  The cutoff point for being at risk of malnutrition might be different between Western and Asian populations.
These nutritional assessments were performed by one well-trained dietitian.

Factors associated with malnutrition in community-dwelling older adults

A systematic literature search was performed to identify all relevant articles in which the specific factors associated with malnutrition in elderly community-dwelling subjects were included.  The bibliographic databases, PubMed and Igaku Chuo Zasshi, were searched from their inception to October 31, 2015.  Search terms expressing “malnutrition” were used in combination with search terms for “community-dwelling and home-bound elderly”. The references of the identified articles written in English and Japanese were searched for relevant publications.
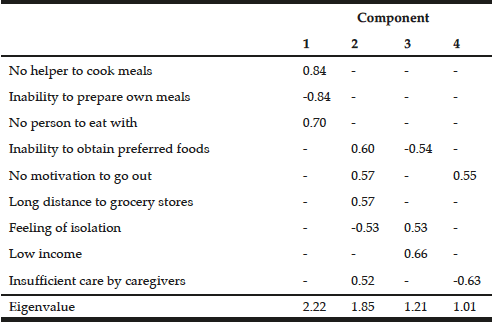
Nine items associated with malnutrition in community-dwelling elderly people were found in these references, after excluding items included in the questions of the original MNA-SF.  These nine items were 1) inability to obtain preferred foods(7, 8), 2) no helper to cook meals (7, 8), 3) inability to prepare own meals (7, 8), 4) no person to eat with (8), 5) feeling of isolation (9), 6) no motivation to go out (10), 7) low income (11-13), 8) insufficient care by caregivers (11, 14), and 9) long distance to grocery stores (8).
The participants were interviewed by using an interview form containing these 9-item questions.  The answers were selected according to three scales: 1, always; 2, sometimes; 3, never or 1, agree; 2, neutral; 3, disagree.

The development of the MNA-home and statistical analyses

A principal component analysis was performed to classify these nine new items associated with malnutrition in community-dwelling elderly people.  The number of components was determined by considering the eigenvalues, scree test and their interpretability.
We chose to develop a new nutritional screening tool called MNA-home to identify those subjects most at risk of malnutrition among the community-dwelling elderly by modifying the MNA-SF.  Two or three items were chosen from the results of the principal component analysis and added to the MNA-SF.  Each item was chosen from the components elicited from the principal component analysis.
A receiver operating characteristic (ROC) curve was generated for various MNA-home candidates to find the best combination of items added to the MNA-SF.  The reference standard was created from the combination of SGA, a subjective nutritional assessment, and GNRI, an objective nutritional risk assessment.  Since the MNA-home would be a nutritional screening tool capable of identifying community-dwelling elderly at risk of malnutrition, the community-dwelling elderly at risk of malnutrition in the reference standard was defined to include either the SGA grade of levels B and C or the GNRI grade of levels 2, 3 and 4 (the joint criterion by GNRI and SGA).  The area under the curve (AUC) for ROC indicates the probability of discriminating a nutritional risk.  Various potential MNA-home candidates incorporating several new items were examined in the ROC curve, and one of them with the largest AUC value was finally selected as the MNA-home.  The cutoff risk point for nutrition was determined by using the ROC curve.  The sensitivity, specificity, accuracy, Youden index (YI, sensitivity + specificity – 1), positive predictive value (PPV) and negative predictive value (NPV) were calculated at various threshold values for both MNA-SF and MNA-home by comparing with the reference standard.
Each variable is presented as the mean ± SD.  Differences between groups were determined by an analysis of variance or the chi-squared test.  The validity of MNA-home was evaluated by comparing the correlation between the anthropometric and biochemical nutritional variables and MNA-home or MNA-SF, using Spearman’s correlation coefficient.  A p-value of less than 0.05 was considered statistically significant.  All statistical analyses were performed by SPSS ver. 20 (IBM, Tokyo, Japan).


Results

The participants were classified into two groups according to the joint criterion made from SGA and GNRI; community-dwelling elderly with good nutrition and those with malnutrition or at risk of malnutrition (Table 1). Most of the individual variables, including the anthropometric and biochemical variables, were significantly lower in the subjects with malnutrition or those at risk of malnutrition.  Furthermore, the values for BMI, serum albumin, total cholesterol and hemoglobin in the subjects with malnutrition or those at risk of malnutrition suggest that this classification was reasonable as a reference standard for evaluating the MNA-home in this study.

Table 2 Classification of factors associated with malnutrition in community-dwelling elderly people by a principal component analysis

Table 2
Classification of factors associated with malnutrition in community-dwelling elderly people by a principal component analysis

These nine items associated with malnutrition in community-dwelling elderly people were found by the reference survey.  A coefficient less than ±0.5 is represented by a dash for simplicity.


The principal component analysis demonstrated that the nine items specifically associated with malnutrition in community-dwelling elderly people could be classified into four components (Table 2).  Since the scree plot showed that the eigenvalue of the first two components was relatively high, the potential MNA-home scores were selected as MNA-SF supplemented with two items chosen from these factors, each item being chosen from different components.  Among these potential MNA-home scores, the ROC curve analysis revealed that MNA-SF plus 2 items, “inability to prepare own meals” and “no motivation to go out”, had the largest AUC value when the above-mentioned reference standard was applied, this AUC value being larger than that of MNA-SF (Fig. 1).  This result suggested that the new 8-item MNA-home score (Table 3) would offer better ability to identify the nutritional risk in community-dwelling elderly people than the MNA-SF.

Figure 1 Receiver operating characteristic (ROC) curve for the MNA-SF and MNA-home as compared with the joint criterion for being at risk of malnutrition made from GNRI and SGA. Areas under the curve were 0.795 for MNA-home (green line) and 0.744 for MNA-SF (blue line)

Figure 1
Receiver operating characteristic (ROC) curve for the MNA-SF and MNA-home as compared with the joint criterion for being at risk of malnutrition made from GNRI and SGA. Areas under the curve were 0.795 for MNA-home (green line) and 0.744 for MNA-SF (blue line)

The various cutoff points for discriminating those elderly persons at risk of malnutrition were derived from these ROC curves of MNA-home and MNA-SF (Table 4).  The sensitivity, specificity, accuracy, YI, PPV and NPV data were compared between various threshold values for both MNA scores in predicting those at risk of malnutrition evaluated from the joint criterion by SGA and GNRI.  Since both the MNA-SF and MNA-home would be used as nutritional screening tools, high sensitivity was given priority over high specificity.  The cutoff values for predicting those at risk of malnutrition were considered best with 12 points in the MNA-SF and 14 points in MNA-home.  This means that the elderly who scored less than 12 in the MNA-SF or less than 14 in the MNA-home would be considered at risk of malnutrition.

Table 3 New 8-item MNA-home for community-dwelling elderly people

Table 3
New 8-item MNA-home for community-dwelling elderly people


Table 4 Diagnostic characteristics of MNA-SF and MNA-home for being at risk of malnutrition relative to the joint criterion by GNRI and SGA

Table 4
Diagnostic characteristics of MNA-SF and MNA-home for being at risk of malnutrition relative to the joint criterion by GNRI and SGA

PPV, positive predictive value; NPV, negative predictive value; YI, Youden index.

The Spearman correlation coefficients (r) of the score for each MNA with age, BMI and nutritional-related biochemical variables were compared between the MNA-SF and the MNA-home (Table 5).  The score for MNA-home was significantly correlated with serum albumin and hemoglobin, while the score for MNA-SF was not correlated with these values.

Table 5 Spearman correlation coefficients of MNA-SF or MNA-home with age, BMI and nutritional-related biochemical variables

Table 5
Spearman correlation coefficients of MNA-SF or MNA-home with age, BMI and nutritional-related biochemical variables

P-values less than 0.1 are shown in this table.


Discussion

We developed in the present study a modified MNA-SF named MNA-home for Japanese community-dwelling elderly by adding two items to the original MNA-SF.  This new 8-item MNA-home had higher discriminating ability for the community-dwelling elderly at risk of malnutrition than MNA-SF when the reference standard of “at risk of malnutrition” was determined by the combination of SGA and GNRI.
There is no accepted standard for the nutritional assessment of community-dwelling elderly people, so we merged the results of SGA and GNRI to devise a reference standard for those at risk of malnutrition.  We consider elderly people to be at risk of malnutrition if either the SGA grade was at level B or C, or the GNRI grade was at level 2, 3 or 4 (GNRI≤98).  This method is similar to that previously suggested by Pablo et al. (25) and Poulia et al. (26).  SGA includes information on weight loss, a change in dietary intake, symptoms from the gastrointestinal tract and functional capacity, all of which were evaluated by the subjective assessment.  SGA has been proven to be a reliable way for estimating a nutrition-related clinical outcome.  Recent literature has demonstrated SGA to be a similar or superior tool for nutritional diagnosis in both surgical and clinical patients when compared with anthropometric and laboratory data analyses (27).  Other instruments, however, might be as capable as or more capable than SGA as a screening tool in detecting important changes in nutritional status related to the occurrence of a worsening clinical outcome (27). On the other hand, GNRI has been calculated only from objective information, including body weight, height and serum albumin (24), and has been proposed and investigated for predicting nutrition-related complications (28).  We therefore presume the combination of SGA and GNRI to be a better reference of nutritional status than each separate tool that may be associated with the clinical outcome.  We did not use the full version of MNA as a reference standard because it has similar problems, as MNA-SF does not include the nutritional issues that are specifically associated with community-dwelling elderly people.
Two items, “inability to prepare own meals” and “no motivation to go out”, that were added to MNF-SF were chosen by the principal component analysis from nine items that might potentially be associated with malnutrition in community-dwelling elderly people.  These 9 items, namely an inability to obtain preferred foods, no helper to cook meals, inability to prepare own meals, no person to eat with, feeling of isolation, no motivation to go out, low income to buy sufficient foods, insufficient care service, long distance to grocery stores, do not seem to be specific to Japanese community-dwelling elderly persons, and are also common among the elderly living in westernized countries, where the number of elderly living alone in the community has been increasing during the most recent one or two decades (29).  The two chosen and added items are considered reasonable in the case of community-dwelling elderly people from the author’s perspective as a home-visiting dietitian.  The ability to prepare own meals is essential for the community-dwelling elderly persons for survival or maintaining a favorable nutritional status in cases of the meal delivery service or home-cooking service by helpers not being fully developed.  Furthermore, no motivation to go out implies social withdrawal and isolation which may be one of the symptoms of depression and has been recognized to be associated with the development of malnutrition (10).
The MNA-home has been developed for screening community-dwelling elderly persons at risk of malnutrition.  This nutritional screening tool is intended for use by health-care professionals like public health nurses and dietitians when they visit the elderly at home.  It therefore needs to be easily applied, and sensitivity should be given priority over specificity since more detailed nutritional assessment will follow.  In this respect, it was appropriate for the optimal cutoff points for MNA-SF and MNA-home as nutritional screening tools to respectively be 12 and 14, whereas the accuracy of these cutoff points was one step lower than each maximal value.
We finally compared the predictive ability of both the MNA-SF and MNA-home for age, BMI and nutritional-related biochemical variables, since these parameters have been widely used to evaluate nutritional status.  The result that the MNA-home only showed a significant correlation with serum albumin and hemoglobin suggests that MNA-home would offer more ability to predict malnutrition than MNA-SF.
Modifying MNA or adjusting the cut-off point has been attempted to improve the discriminating ability to find subjects with malnutrition or those at risk of malnutrition.  Since the MNA was created and developed in Western countries, such a method and the selected cut-off points might not be applicable to Asian populations without any change because of cultural and anthropometric differences between them.  Minor modification or adjustment has been therefore attempted to make the original MNA applicable to an Asian population (20, 21).  However, our modification from MNA-SF to MNA-home in the present study was intended to correct the missing aspects of the MNA-SF, especially for community-dwelling elderly persons, so that this modification might also be useful in Western countries.
There are some limitations to the results of the present study.  First, the sample was small and the subjects were only recruited from three areas of Japan.  Since the life style, dietary habits, comorbidity and public service for the community-dwelling elderly are different between regions, the results might be flawed by potential sampling bias.  However, the mean ± SD value of MNA-SF was 9.4 ± 2.4, and the prevalence of being at risk of malnutrition and being malnourished was almost the same at 65.0% by MNA-SF and 64.2% by MNA-home, similar to the results of other previous studies on Japanese community-dwelling elderly people (4-6).  It was also anticipated that the present study would help to develop the MNA-home by a cross-sectional design.  A long-term follow-up study investigating mortality, morbidity or hospitalization is necessary to examine whether the MNA-home is really useful for identifying elderly persons at risk of malnutrition.
In conclusion, we have developed the MNA-home from MNA-SF by adding two items which are closely associated with the nutritional disturbance occurring to community-dwelling elderly people.  The MNA-home has better discriminating ability to identify the elderly at risk of malnutrition than the MNA-SF in the population studied.  This modification enables dietitians or nurses to more accurately screen elderly persons at risk of malnutrition in a home-care setting.  A subsequent study is necessary to validate this MNA-home for correctly discriminating those at risk of malnutrition in any community-dwelling elderly population worldwide.


Conflict of interest: The authors have no conflict interest to declare.

Acknowledgments: The authors thank Dr. Akira Ohi, Dr. Tatsuo Ohishi and all of the community-care dietitians and nurses who collaborated in this study.

Ethical standards: This research was carried out in accordance with the Declaration of Helsinki of the World Medical Association and received ethical approval from the ethics committee of the University of Shizuoka.


References

1.    Annual report on the aging society FY 2014. Cabinet office, Government of Japan. 2014, at http://www8.cao.go.jp/kourei/english/annualreport/2014/2014pdf_e.html.
2.    Campbell JC, Ikegami N. Long-term care insurance comes to Japan. Health Aff (Millwood). 2000; 19: 26-39.
3.    Kaiser MJ, Bauer JM, Rämsch C, Uter W, Guigoz Y, Cederholm T, Thomas DR, Anthony PS, Charlton KE, Maggio M, Tsai AC, Vellas B, Sieber CC; Mini Nutritional Assessment International Group. Frequency of malnutrition in older adults: a multinational perspective using the mini nutritional assessment. J Am Geriatr Soc. 2010; 58: 1734-8.
4.    Izawa S, Kuzuya M, Okada K, Enoki H, Koike T, Kanda S, Iguchi A. The nutritional status of frail elderly with care needs according to the mini-nutritional assessment. Clin Nutr. 2006; 25: 962-7.
5.    Enoki H, Sugiyama M, Izawa S, Hirose T, Hasegawa J, Iguchi A, Kuzuya M. Factors associated with malnutrition in community-dwelling disabled elderly–the KANAGAWA-AICHI Disabled Elderly Cohort (KAIDEC) Study. Nihon Ronen Igakkai Zasshi. 2014; 51: 547-53 (in Japanese).
6.    Morisaki N, Miura H, Hara S. Relationship between the nutritional status and the oral function among community-dwelling dependent elderly persons. Nihon Ronen Igakkai Zasshi. 2015; 52: 233-42 (in Japanese).
7.    Iizaka S, Tadaka E, Sanada H. Comprehensive assessment of nutritional status and associated factors in the healthy, community-dwelling elderly. Geriatr Gerontol Int. 2008; 8: 24-31.
8.    Keller HH, Goy R, Kane SL. Validity and reliability of SCREEN II (Seniors in the community: risk evaluation for eating and nutrition, Version II). Eur J Clin Nutr. 2005; 59: 1149-57.
9.    Ferry M, Sidobre B, Lambertin A, Barberger-Gateau P. The SOLINUT study: analysis of the interaction between nutrition and loneliness in persons aged over 70 years. J Nutr Health Aging. 2005; 9: 261-8.
10.    Boulos C, Salameh P, Barberger-Gateau P. Malnutrition and frailty in community dwelling older adults living in a rural setting. Clin Nutr. 2016; 35: 138-43.
11.    Locher JL, Ritchie CS, Robinson CO, Roth DL, Smith West D, Burgio KL. A multidimensional approach to understanding under-eating in homebound older adults: the importance of social factors. Gerontologist. 2008; 48: 223-34.
12.    Quine S, Morrell S. Food insecurity in community-dwelling older Australians. Public Health Nutr. 2006; 9: 219-24.
13.    Tamiya N, Kobayashi Y, Murakami S, Sasaki J, Yoshizawa K, Otaki J, Kano K. Factors related to home discharge of cerebrovascular disease patients: 1-year follow-up interview survey of caregivers of hospitalized patients in 53 acute care hospitals in Japan. Arch Gerontol Geriatr. 2001; 33: 109-21.
14.    Oyama Y, Tamiya N, Kashiwagi M, Sato M, Ohwaki K, Yano E. Factors that allow elderly individuals to stay at home with their families using the Japanese long-term care insurance system. Geriatr Gerontol Int. 2013; 13: 764-73.
15.    Guigoz Y, Vellas B, Garry PJ. Assessing the nutritional status of the elderly: The Mini Nutritional Assessment as part of the geriatric evaluation. Nutr Rev. 1996; 54: S59-65.
16.    Guigoz Y. The Mini Nutritional Assessment (MNA) review of the literature–What does it tell us? J Nutr Health Aging. 2006; 10: 466-85.
17.    Rubenstein LZ, Harker JO, Salvà A, Guigoz Y, Vellas B. Screening for undernutrition in geriatric practice: developing the short-form mini-nutritional assessment (MNA-SF). J Gerontol A Biol Sci Med Sci. 2001; 56: M366-72.
18.    Kaiser MJ, Bauer JM, Ramsch C, Uter W, Guigoz Y, Cederholm T, Thomas DR, Anthony P, Charlton KE, Maggio M, Tsai AC, Grathwohl D, Vellas B, Sieber CC; MNA-International Group. Validation of the Mini Nutritional Assessment short-form (MNA-SF): a practical tool for identification of nutritional status. J Nutr Health Aging. 2009; 13: 782-8.
19.    Kaiser MJ, Bauer JM, Uter W, Donini LM, Stange I, Volkert D, Diekmann R, Drey M, Bollwein J, Tempera S, Guerra A, Ricciardi LM, Sieber CC. Prospective validation of the modified mini nutritional assessment short-forms in the community, nursing home, and rehabilitation setting. J Am Geriatr Soc. 2011; 59: 2124-8.
20.    Kuzuya M, Kanda S, Koike T, Suzuki Y, Satake S, Iguchi A. Evaluation of Mini-Nutritional Assessment for Japanese frail elderly. Nutrition. 2005; 21: 498-503.
21.    Tsai AC, Chang TL, Chen JT, Yang TW. Population-specific modifications of the short-form Mini Nutritional Assessment and Malnutrition Universal Screening Tool for elderly Taiwanese. Int J Nurs Stud. 2009; 46: 1431-8.
22.    Frid H, Adolfsson ET, Rosenblad A, Nydahl M. Agreement between different methods of measuring height in elderly patients. J Hum Nutr Diet. 2013; 26: 504-11.
23.    Detsky AS, McLaughlin JR, Baker JP, Johnston N, Whittaker S, Mendelson RA, Jeejeebhoy KN. What is subjective global assessment of nutritional status? JPEN J Parenter Enteral Nutr. 1987; 11: 8-13.
24.    Bouillanne O, Morineau G, Dupont C, Coulombel I, Vincent JP, Nicolis I, Benazeth S, Cynober L, Aussel C. Geriatric Nutritional Risk Index: a new index for evaluating at-risk elderly medical patients. Am J Clin Nutr. 2005; 82: 777-83.
25.    Pablo AM, Izaga MA, Alday LA. Assessment of nutritional status on hospital admission: nutritional scores. Eur J Clin Nutr. 2003; 57: 824-31.
26.    Poulia KA, Yannakoulia M, Karageorgou D, Gamaletsou M, Panagiotakos DB, Sipsas NV, Zampelas A. Evaluation of the efficacy of six nutritional screening tools to predict malnutrition in the elderly. Clin Nutr. 2012; 31: 378-85.
27.    da Silva Fink J, Daniel de Mello P, Daniel de Mello E. Subjective global assessment of nutritional status – A systematic review of the literature. Clin Nutr. 2015; 34: 785-92.
28.    Cereda E, Pusani C, Limonta D, Vanotti A. The ability of the Geriatric Nutritional Risk Index to assess the nutritional status and predict the outcome of home-care resident elderly: a comparison with the Mini Nutritional Assessment. Br J Nutr. 2009; 102: 563-70.
29.    Health Quality Ontario. Social isolation in community-dwelling seniors: an evidence-based analysis. Ont Health Technol Assess Ser. 2008; 8: 1-49.

A MINI NUTRITIONAL ASSESSMENT OF THE RISK OF MALNUTRITION IN ELDERLY UNDER THREE NUTRITION SUPPORT MODELS


E. Lindhorst, M. Ramel, P. Kelly, L. Jones


Department of Nutrition and Dietetics, Saint Louis University, Saint Louis, Missouri. 

Corresponding Author: Erin Lindhorst, Department of Nutrition and Dietetics, Saint Louis University, Allied Health Professions Building, 3437 Caroline Street St. Louis, MO 63104, Tel. 816-210-2394, erinlindhorst@gmail.com


Abstract

 Objective:  The aim of this study was to determine which nutritional support setting fostered the best nutritional status in elderly patients using the Mini Nutritional Assessment survey. Design and Participants: The analytical sample included a total of 75 adults aged 60-89 years. Setting: There were three nutrition support settings: a nursing home, an assisted living facility, and independent living with congregate feeding.  Measurements: The Mini Nutritional Assessment was used to examine nutritional status in patients living in one of the three nutritional support settings. Results: Individuals living independently individuals and attending congregate feedings resulted in the most people in the “normal nutritional status” category when compared with nursing home and assisted living residents.  Conclusion: Individuals living independently in their homes who use congregate feeding have reduced risk of malnutrition.


Key words: Mini Nutritional Assessment, nursing home, assisted living, independent living, congregate feeding. 


Introduction 

According to the U.S. Department of Health and Human Services, the elderly population is expected to increase about 19% by the year 2030. Compared to 12.4% increase in the elderly population in 2000, the United States is on a steady climb to having one of the largest elderly populations it has ever encountered (1). As individuals age, cognitive function gradually declines. This cognitive impairment may result in decreased nutrient intake, leading to poor nutritional status and possibly malnutrition. Cognitive decline, commonly known as dementia, can also result in a decrease in daily activities as well as behavioral and physiological changes. (2) It is estimated that by the year 2040, 81 million people will be affected by dementia (2).

As documented in previous studies, weight loss has been shown to increase the rate of functional decline and increase the risk of morbidity and mortality in the elderly (3). The presence of weight loss and physical decline is heavily correlated with increasing age (3). Therefore, malnutrition is prevalent in about 5-15% of the general elderly population.  Studies suggest that institutionalized elderly have even greater rates of malnutrition, where 52-82% of the population may suffer from malnourishment (4). Additionally, malnutrition often goes undetected in elderly living independently at home, with the prevalence of malnutrition ranging from 13-30% (5). Malnutrition is also seen more in adults with co-morbidities and on multiple prescription medications (4).

Increased mortality rates are correlated with malnutrition but can be prevented by nutritional screening and simple nutritional interventions (4). In order to assess malnutrition in elderly patients a multidimensional approach is needed (4). The Mini Nutritional Assessment (MNA) survey includes factors such as anthropometric measures, weight changes, dietary problems, motility issues, and neuropsychological status (4). The MNA survey consists of six questions that cover decline in food intake, weight loss during the last 3 months, mobility, psychological stress or acute disease, neuropsychological problems, and body mass index (BMI). The results of the assessment categorized individuals as “at normal nutritional status,” “at risk of malnutrition,” or “malnourished.” Early detection of elderly individuals at nutritional risk, followed by nutritional intervention, can help to conserve muscle function as well as muscle strength, improve quality of life, and potentially prolong length of survival (6). Using the MNA survey can provide that early detection. 

Nutrition status can vary between elderly patients living in different settings. There are three main settings where elderly tend to reside in as they age. These include: within a nursing home, in an assisted living facility, or within their home. Each of these living settings provides different nutrition support models. Within a nursing home, patients are provided care 24 hours a day. Skilled nurses or nursing aides can assist these patients with feeding, bathing and dressing if needed. These patients typically gather in a central dining area with other residents for meal times, but they are able to eat in their room if they so desire (7). An assisted living facility is for individuals who require minimal assistance and/or care with every day activities such as bathing, dressing and feeding. These individuals have access to a central dining area where they are provided meals, but they also have the option to prepare meals in their own kitchen (8). Elderly individuals who live independently but attend a congregate feeding site are usually able to perform activities of daily living without any assistance. They generally cook for themselves and potentially for other loved ones. Congregate feeding sites provide elderly individuals 60 years or above access to a meal 5 days a week. Along with a meal, these individuals also get social interaction and support from others attending the congregate feeding site. A review of current literature indicated that there was limited research on malnutrition prevalence in elderly living in these 3 nutrition support settings. 


Methods

Design

The principal investigator (PI) found voluntary participants in a nursing home and recruited them during a gathering time where most residents were present. Persons in assisted living were recruited while they were gathered in the communal dining area of the residency. The participants living independently were recruited while they were at their congregate feeding site. Voluntary participants from each site were given a description of the research being conducted. The PI assessed them using the Mini Nutritional Assessment survey and 2 additional nutrition support questions. Surveys and additional questions were anonymous and all information collected throughout this study was kept confidential. The Saint Louis University Institutional Review Board approved the study. 

Sample

Study participants were recruited from each of the following nutrition support settings: nursing home care, assisted living, or congregate feeding. Participants ranged in age from 60-89 years and had good cognitive status. The goal was to recruit 25 seniors from each nutrition support setting, for a total of 75 participants. 

Instrument

The short form of the Mini Nutritional Assessment (MNA) and 2 additional questions were used to gather information during this research study. The MNA is a validated survey and detects whether or not an individual is malnourished or at risk of being malnourished. The survey consists of six questions that look at decline in food intake, weight loss during the past 3 months, mobility, psychological stress or acute disease, neuropsychological problems, and body mass index. The 2 additional questions that were asked depended on the nutrition support setting. The questions for the nursing home and assisted living participants were how long have you been living at this facility? Do you eat in your room or in the communal dining setting? The questions for the congregate feeding participants were how long have you been receiving nutrition support from the congregate feeding site? How many times a week do you receive meals at the facility? These questions were asked to determine if there was an association between nutritional status and length of residency, place where meals were eaten, and frequency of meals received under a nutrition support setting. 

Anthropometrics were also required to complete this assessment. The most recent weight and height for the assisted living and nursing home residents were obtained from the facilities medical records. For congregate feeding participants, calf circumference (CC) was obtained using a standard measuring tape. According to the MNA survey, CC can be used in place of BMI if weight and height are unavailable.

Data Analysis

For the statistical analysis, Statistical Package for the Social Sciences (SPSS, 22.0, 2013) was used. The data were compared using descriptive statistics and analyzed using Chi-square tests of association. These tests were used to determine if there was an association between a participant’s living facility and nutritional status.


Results

Demographic Characteristics


Table 1 Demographic Characteristics of Population Study


Comparison of Results between the Nutrition Support Settings 

This study compared the nutritional status of individuals living in a nursing home, an assisted living facility, and living independently at home but attending a congregate feeding site. The data analysis determined that individuals living independently but attending a congregate feeding site had the best nutritional status of the 3 groups.  The individuals living independently while attending a congregate feeding site had the most participants in the “normal nutritional status” category. There were 20 individuals with “normal nutritional status” and 5 individuals “at risk or malnourished” (Table 2). The nursing home and assisted living participants had the same results. There were 12 individuals in the “normal nutritional status” category and 13 individuals in the “at risk or malnourished” category (Table 2). Using a Chi-square test to compare living facility and nutritional status showed a significant association between individual’s living facility and their nutritional status (chi-square=7.038 (2), p<0.05) (Table 2). 


Table 2 Nutritional Context: Nutritional Status by Type of Living Facility


Discussion

The purpose of this study was to compare nutritional status between elderly in 3 different nutritional support settings: a nursing home, an assisted living facility, and congregate feeding site. This study was conducted to determine which environment supported the best nutritional status as well as overall health status. 

This study showed the independent living setting with access to congregate feeding resulted in lower risk of malnutrition in the elderly than the other two settings.  The results of this study line up with previous studies that determined malnutrition rates increase in elderly that are institutionalized. Previous studies have also concluded that social support settings such as congregate feeding sites provide the greatest nutritional status outcome (9). Congregate feeding sites have been shown to provide the elderly with affordable, healthy food options, resulting in improved nutritional status (9). From these results we can determine that there is an association between independent living while attending a congregate feeding site and good nutritional status. 

Further research is needed to discover what specifically supports good nutritional status in independent living individuals and to pinpoint why institutionalized elderly have higher rates of malnutrition. Individuals in nursing homes and assisted living require a higher level of care than individuals living independently and they typically have more medical concerns that can affect nutritional status. Since institutionalized elderly are cared for daily by a medical team and skilled staff, the results of higher rates of malnutrition were unexpected. 

There were some weaknesses and limitations in this study. One weakness was the limited relevance of the MNA survey. The 3 different nutritional support settings had very different participant characteristics and therefore not all of the survey questions were relevant. In future research, the use of a different malnutrition survey instrument should be considered.  Another potential weakness of this study was its reliance on self-reported information from the participant. Individuals may not tell the truth about their current status when conversing with a medical professional. Using nursing staff and medical chart records could decrease inaccurate self-reporting when collecting data for two of the nutritional settings, but would still prove difficult for individuals living independently with limited medical oversight. Another weakness that could have skewed the results of this study is that the BMI was not used consistently for all participants to determine their final nutritional status score. The independent living group of participants who attended a congregate feeding site had no recorded weight and height on file, resulting in the use of calf circumference in place of BMI. Although this is an acceptable measurement to use according to the MNA, future researchers should standardize the BMI component and directly measure height and weight of all participants for more accurate and consistent results. A limitation of this study was the lack of diversity within the participant group (Table 1). Most of the participants were Caucasian. To ensure that the results are generalizable to the elderly population, future research should incorporate greater diversity in study participants.


Conclusions 

From the results of this study, it was determined that individuals living in a nursing home or assisted living facility could actually be “at risk for malnutrition” or “malnourished” based on the MNA survey. The nursing home residents and assisted living residents showed the highest prevalence of “at risk for malnutrition” or “malnourished” individuals when compared with individuals who live independently, but use congregate feeding. The results of this study help identify the importance of regular nutrition assessments and follow-ups within living institutions to improve the nutritional status among the elderly. This research also sets the framework for future studies to use more variables and compare results at a nominal level. 

Future research can go in-depth and look at variables such as caloric intake, number of meals eaten per day, amount of weight lost over a specific period of time, and number of nutrition supplements consumed per day. Variables such as these will help in understanding why institutionalized elderly have the highest rate of malnourishment. This can also help to determine the main contributors of malnutrition in the growing elderly population. 

References

1. Administration on Aging (AoA). (n.d.). Retrieved November 16,2014, from http://www.Aoa.acl.gov/Aging_Statistics/index.aspx

2. Meijers, J. Malnutrition in Care Home Residents. The Journal of Nutrition, Health & Aging, 18, 2013.

3. Bagshaw, S. M., & McDermid, R. C. The role of frailty in outcomes from critical illness. Curr Opin Crit Care, 2013;19(5), 496-503. doi: 10.1097/MCC.0b013e328364d57

4. Chavarro-Carvajal, D., Reyes-Ortiz, C., Samper-Ternent, R., Arciniegas, A. J., & Gutierrez, C. C. Nutritional Assessment and Factors Associated to Malnutrition in Older Adults: A Cross-Sectional Study in Bogota, Colombia. J Aging Health, 2014. doi: 10.1177/0898264314549661

5. Kozáková, R., & Zeleníková, R. Assessing the nutritional status of the elderly living at home. European Geriatric Medicine, 2014;5(6), 377-381. doi: 10.1016/j.eurger.2014.07.003

6. van Bokhorst-de van der Schueren, M. A., Guaitoli, P. R., Jansma, E. P., & de Vet, H. C. A systematic review of malnutrition screening tools for the nursing home setting. J Am Med Dir Assoc, 2014;15(3), 171-184. doi: 10.1016/j.jamda.2013.10.006

7. Help Guide. A Guide to Nursing Homes, Skilled Nursing Facilities and Convalescent Homes. http://www.helpguide.org/articles/senior-housing/guide-to-nursing-homes.htm. December 2014. Accessed February 2014;17, 2015. 

8. The Assisted Living Federation of America. Assisted Living. http://www.alfa.org/alfa/Assisted_Living_Information.asp. 2013. Accessed February 17, 2015. 

9. Sylvie, A. K., Jiang, Q., & Cohen, N. Identification of environmental supports for healthy eating in older adults. J Nutr Gerontol Geriatr, 2013;32(2), 161-174. doi: 10.1080/21551197.2013.779621