jarlife journal
Sample text

AND option

OR option

METABOLIC SYNDROME OF FREE-LIVING ELDERLY FROM SHARPEVILLE, SOUTH AFRICA: A PROSPECTIVE COHORT STUDY WITH 10-YEAR FOLLOW-UP


W.H. Oldewage-Theron1,2, A.A. Egal2, C. Grobler3


1. Department of Nutritional Sciences, Texas Tech University, 1301 Akron Ave, Lubbock, TX, 79409, USA; 2. Center of Sustainable Livelihoods, Vaal University of Technology, Private Bag X021, Vanderbijlpark, 1900, South Africa; 3. Department of Health Sciences, Vaal University of Technology, Vanderbijlpark, South Africa.

Corresponding Author: Wilna Oldewage-Theron, Professor of Nutrition, Department of Nutritional Sciences, Texas Tech University, 1301 Akron Ave, Lubbock, TX, 79409, USA; Visiting Professor, Center of Sustainable Livelihoods, Vaal University of Technology, Private Bag X021, Vanderbijlpark, 1900, South Africa; Email: wilna.oldewage@ttu.edu


J Aging Res Clin Practice 2018;7:100-106
Published online June 7, 2018, http://dx.doi.org/10.14283/jarcp.2018.18


Abstract

Objective: This study aimed to provide evidence on the prevalence of the metabolic factors contributing to Metabolic Syndrome (MetS) among elderly people in South Africa. Design: An ethically approved, cross-sectional survey study conducted in a cohort of an elderly population in 2004 with follow-up in 2014. Setting: An elderly day-care center. Participants: A total of 170 men and women were randomly selected for the baseline survey (2004). Only 105 of the subjects included in the baseline study were available for the follow-up study (2014). The sample consisted of 83.2% (n=89) women and 16.8% (n=16) men with a mean±SD age of 95.8±6.2 and 71.8±5.7 years in 2014 and 2004 respectively. Measurements: Dietary intakes (24-hour recall questionnaire) were completed for a period of three non-consecutive days, including one weekend day and two week days. Other measurements included waist circumference (WC), blood pressure and fasting (>8 hours) venous blood samples that were analyzed for total cholesterol (TC), high-density lipoprotein-cholesterol (HDL-C), tryglicerides (TGs) and glucose. The Friedewald formula was used to calculate LDL-C (16). Results: The prevalence of MetS was significantly (p=0.000) higher in 2014 (63.4%) compared to 2004 (48.8%). The most prominent risk factors were central obesity (85.9%), low serum HDL-C (71.0%) and high serum TG (68.1%) levels in 2004 compared to central obesity (82.5%), low serum HDL-C (94.3%) and hyperglycaemia (48.1%) in 2014. Conclusions: MetS is highly prevalent and rapidly increasing among these elderly people. A need for identifying preventative and treatment strategies to increase wellness and reduce morbidity has been highlighted by these results..

Key words: Metabolic syndrome, elderly, South African, metabolic risk factors, cohort.


Introduction

Metabolic syndrome (MetS) has become a significant public health issue globally (1). MetS is a complex disorder and includes three or more interconnected metabolic risk factors such as high triglyceride (TG) levels, low high-density lipoprotein-cholesterol (HDL-C) levels, high blood pressure, central obesity and dysglycaemia (1-3).When these risk factors are prevalent simultaneously in individuals, they are in a prothrombotic and pro-inflammatory state that increases the risk of atherosclerotic cardiovascular disease (CVD)and type 2 diabetes (T2DM) (1, 4, 5) and contribute to all-cause mortality (1, 3). Preventable non-communicable diseases (NCDs) such as CVD, T2DM, cancer, and chronic respiratory diseases are responsible for more than 36 million deaths each year, 80% of which are in low- and middle-income countries (6). It was estimated that 37% of all deaths in South Africa (SA) were due to NCDs in 2000 (7). A national prevalence rate of 31.8% for hypertension, 9.5% diabetes, 23.9% abnormal high levels of serum total cholesterol (TC), 24.6% low density lipoprotein-cholesterol (LDL-C), 47.9% abnormally low HDL-C, and central adiposity observed in 9.8% of men and 50.8% of women (8). The prevalence of MetS and the various risk factors increase with age (1, 2). Furthermore, higher morbidity and mortality rates for CVD and T2DM have been reported for the elderly diagnosed with MetS due to the physiological changes and various chronic diseases associated with increased age (1). The general prevalence of MetS of up to 60% among elderly cohorts is high (2), affecting about 40% and 60% of Korean aged men and women respectively (1), 40% of Ecuadorian elderly (9), 33.7% of Chinese adults (10) and 60% of Taiwanese elderly (11). Due to the high prevalence of MetS among the elderly and its associated high risk of disease, it is important to know the prevalence and risk factors contributing to MetS for implementing primary prevention strategies. Many studies have focused on the elderly in SA, but the prevalence of MetS among this vulnerable, resource-poor population (12) has not been reported. Therefore, this study aimed to provide evidence on the prevalence of the metabolic factors contributing to MetS in a cohort of resource-poor elderly people resident in Sharpeville in the Gauteng Province of SA for the period 2004 to 2014.


Methods

Study design

A cross-sectional cohort study with 10 year follow-up design was used. This study was conducted according to the guidelines laid down in the declaration of Helsinki and all procedures involving human subjects were approved by the University of the Witwatersrand’s Medical Ethics Committee for Research on Human Beings (M040835) for 2004 and the Vaal University of Technology Senate Research Innovation and Ethics Committee (20140827ms) for the 2014 data collection. Due to this elderly community being highly illiterate (12), an information letter and consent form was translated into the Sotho Language and verbally explained to the respondents by trained fieldworkers in 2004 and 2014. The letter included a brief introduction, motivation and purpose of the study. The procedures of the study were explained and confidentiality confirmed by allocating a study number to each of the respondents. Participation was voluntary and participants gave consent by signing the consent form in the form of a fingerprint in the presence of a witness.

Location

This study was undertaken in the only elderly care center in Sharpeville in the Gauteng Province of SA. Sharpeville is one of the oldest of six townships situated in the Vaal region, an industrial polluted area in the Gauteng Province of SA. Sharpeville has a poverty rate of 43.1% (13). The center management contacted the researchers in 2004 to undertake the cross-sectional baseline survey to assist them with planning.

Sampling

Baseline study (2004): Participants were recruited from the then newly established (three months old) Sharpeville Care of the Aged day-care center where free-living elderly people visited the center on Mondays and Wednesdays. The purpose of attending the day-care center was to provide skills training (sewing, cooking and gardening), religious activities and free breakfast and lunch for food insecure, low-resource elderly (aged ≥60 years). This is the only elderly care center in Sharpeville. A sample size calculator (14) was used and 169 respondents were needed to obtain statistically representative data for the cross-sectional survey for this elderly community (12). A total of 170 men and women were randomly selected for the survey from an alphabetical list of names (n=350) provided by the care center (every second name selected). No exclusion criteria were applied and thus any person who attended the care center and gave informed consent could be selected for the study. Eight fieldworkers, speaking the various indigenous languages of SA, were recruited and trained using a training manual and participatory facilitating methods (12).
Follow-up study (2014): During 2014, the researchers visited the elderly care center again and only 105 of the 169 original respondents of 2004, thus 63.3% of the original sample, were still voluntarily attending the center and were included in the second investigation. Possible reasons for loss to the follow-up measurements could have been a) mortality during the 10-year period from baseline to follow-up; b) immobility due to disease or sickness making it impossible for the elderly to attend the care center; or c) elderly moving out of the area and not attending the center any longer. All 105 respondents gave consent to be included in the follow-up study. The same measurements, procedures as well as standardized and validated measuring instruments were used in both 2004 and 2014.

Measurements for both 2004 and 2014

Dietary intakes were measured by a 24-hour recall questionnaire completed for a period of three non-consecutive days, including one weekend day and two week days. Trained fieldworkers used the four-stage, multiple-pass one-on-one interviewing procedure described by Gibson (15). Food models were used to assist the fieldworkers in estimating portion sizes. Dietary intake data were analyzed by a registered dietician using the FoodFinder® version 3 software program, developed by the Medical Research Council and based on the South African food composition tables (16). The mean intake of the three days was calculated.
Waist circumference (WC) was measured at the area halfway between lower rib and iliac crest with a non-stretchable measure tape in a horizontal position around the body (15) by a Registered Dietitian. A registered nursing practitioner measured blood pressure after the respondents had sat quietly for at least 15 minutes with feet on the floor and the right arm supported at heart level. A cuff bladder was used and blood pressure measurements taken with a Tensoval Hartmann® duo control monitor. A second measurement was taken within 10 minutes of the first and the average of the two readings were reported. This monitor uses two methods for determining blood pressure, namely the Korotkoff and the oscillometric methods (17) rendering a more accurate measurement.
The same two nursing practitioners and a haematologist used in 2004 and 2014, drew fasting (>8 hours) venous blood samples in a 7 ml clotted tube, 3 ml glucose (sodium fluoride and oxalate) tube and 5 ml sodium citrate blood between 07h00 and 10h00, after the respondents had been seated for 15 minutes. A vacutainer needle with minimal use of tourniquets was used. The blood was placed on ice, protected from direct sunlight, until separation within two hours of blood collection. Serum and plasma were collected by low-speed centrifugation (3000 rpm for 30 seconds) at 4°C and aliquoted into individual tubes. Serum and plasma were stored at -80°C until analyzes were performed. Standard laboratory protocol was adhered to in order to comply with SANAS accreditation requirement by a heamatologist.
The Konelab 20i random access automated clinical chemistry system was used for TC, HDL-C, TGs and glucose. A coefficient of variation (percent CV) between runs of 1.2–2.8% was obtained for all serum variables. The measuring principles of the Konelab 20i are colorimetric and turbudimetric. The Friedewald formula was used to calculate LDL-C (18).

Statistical analyzes

All analyses were done using the IBM SPSS, version 23 and p<0.05 considered significant for all statistical analyses. Linearity regression was used to test all continuous variables for normality. All the variables were normally distributed, except for the dietary intake variables. All normally distributed variables were reported as means and standard deviations (SDs).
Independent t-tests were performed to determine significant differences in baseline MetS risk factors between the cohort of elderly who were present in 2004 and 2014 and those only present in 2004.
Daily nutrient intakes were reported as medians and interquartile frequencies (IQF) and compared to the Dietary Reference Intakes (DRI) (19), specifically, the Estimated Average Requirement (EAR) values.
The respondents were stratified into two groups based on the International Diabetes Foundation MetS classification for both 2004 and 2014. The MetS group consisted of respondents with a presence of three or more of the following MetS criteria:
•    WC ≥ 80 cm for women and ≥94 cm for men
•    TRG >1.7 mmol/L (150 mg/dL)
•    HDL-C < 1.3 mmol/L (50 mg/dL) for women and <1.03 for men
•    Blood pressure ≥130/85 mm Hg
•    Fasting glucose > 5.6 mmol/L (100 mg/dL) (20).

The non-MetS group were respondents with or less than two of the metabolic risk factors.  Paired t-tests were used to determine the significant differences between baseline (2004) and follow-up (2014).  Correlation coefficients were used to examine the association between the study variables (p<0.05). The students t-test was used to determine the mean difference between continuous variables such age, WC, blood pressure and biochemical values. Thus, the Levene’s test for equality of variance was used at p-value of <0.05. Independent samples t-tests were done to determine significant differences between the men and women at baseline and follow-up. Pearson correlations were done for the nominal data. Only significant results are reported.   To understand the predictors of MetS, linear regression (age, systolic and diastolic blood pressure, WC, LDL-C, TRG and serum glucose) was carried out with those dependent variables that had a significant correlation with MetS.

Results

The independent t-tests showed that there were no significant differences in the baseline MetS risk factors between the cohort of elderly who were present in 2004 and 2014 and those only present in 2004 (HDL-C p=0.276, LDL-C p=0.818,  TRG p=0.647, serum glucose p=0.629, WC p=0.294). It is thus assumed that the results were not confounded by those elderly who were not present in 2014.
The sample consisted of 83.2% (n=89) women and 16.8% (n=16) men with a mean±SD age of 95.8±6.2 and 71.8±5.7 years in 2014 respectively.  The results in Figure 1 showed that the prevalence of MetS was significantly (p=0.000) higher in 2014 at 63.4% compared to 48.8% at baseline (2004).   The most prominent risk factors were central obesity (85.9%) and low serum HDL-C (71.0%) and high serum TRG (68.1%) levels at baseline. At follow-up, the most prominent risk factors were central obesity (82.5%), low serum HDL-C (94.3%) and hyperglycaemia (48.1%).  Furthermore, the prevalence of respondents with one and two risk factors decreased at baseline and those with four and five metabolic risk factors progressively increased from baseline to follow-up.
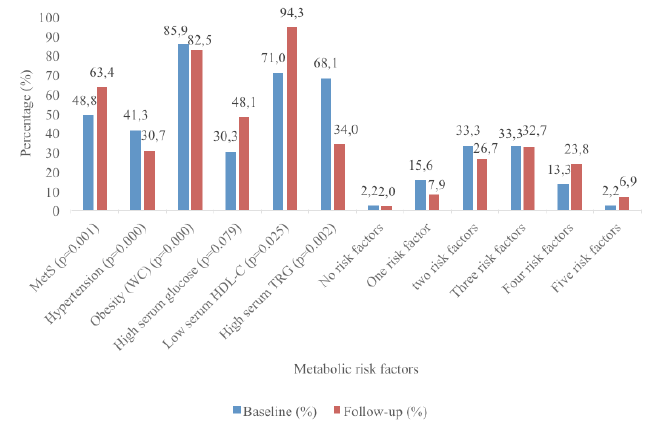
Figure 1 MetS classification of the respondents at baseline (2004) and follow-up (2014)

Figure 1
MetS classification of the respondents at baseline (2004) and follow-up (2014)


The results in Table 1 indicate a statistically significant (p=0.001) decrease in HDL-C from a mean±SD of 1.04±0.43 to 0.84±0.29 mmol/L from baseline to follow-up in the women compared to a statistically significant (p=0.000) increase in LDL-C from 2.02±1.61 to 3.60±1.71 mmol/L. The men showed a significant (p=0.000) increase in LDL-C levels from 1.93±1.57 mmol/L at baseline to 3.17±0.91 mmol/L at follow-up. No other significant changes have been observed. However, a metabolic increase in serum HDL-C and a metabolic decrease in glucose levels were observed in the men at follow-up.
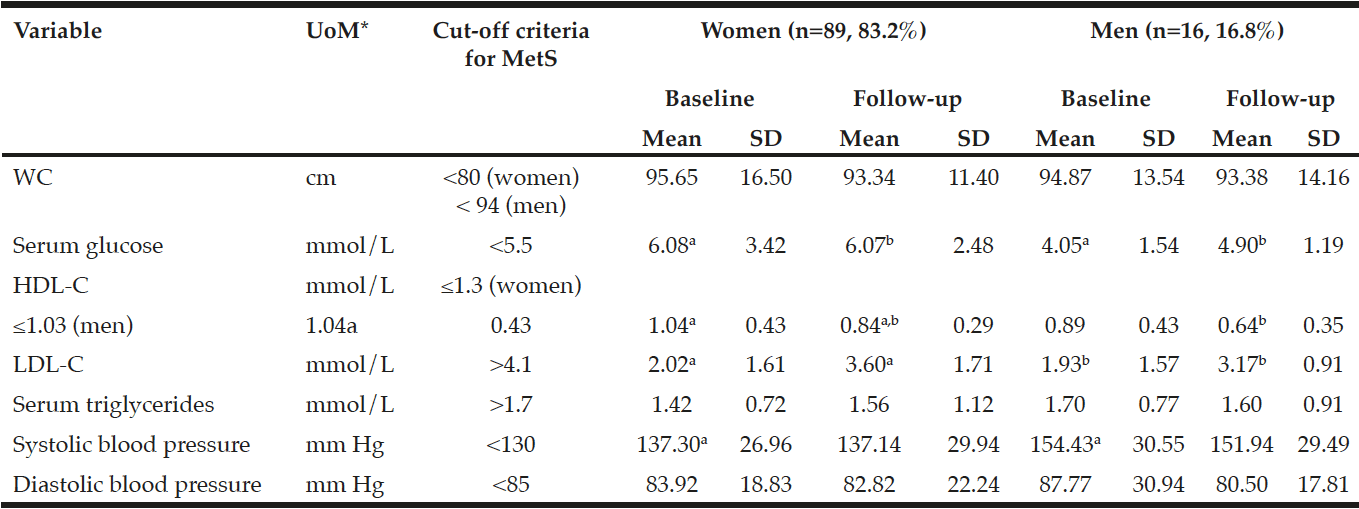
Table 1 Descriptive statistics: anthropometric and biochemical parameters compared across gender

Table 1
Descriptive statistics: anthropometric and biochemical parameters compared across gender

*UoM = Unit of Measure; a,b,c in the same row indicates significant differences at p<0.05


Both men and women had low total energy, dietary fiber, cholesterol and sodium intakes at baseline and follow-up compared to high protein and carbohydrate intakes when compared with the EAR (19). Added sugar intakes were high at baseline, but within the recommended intakes at follow-up. The women showed significantly higher intakes of dietary protein, fat and cholesterol, but significantly lower carbohydrates and sodium at follow-up. The men had significantly higher dietary fat and cholesterol, but reduced sodium intakes at follow-up (Table 2). No significant different dietary intakes were observed between the men and the women.
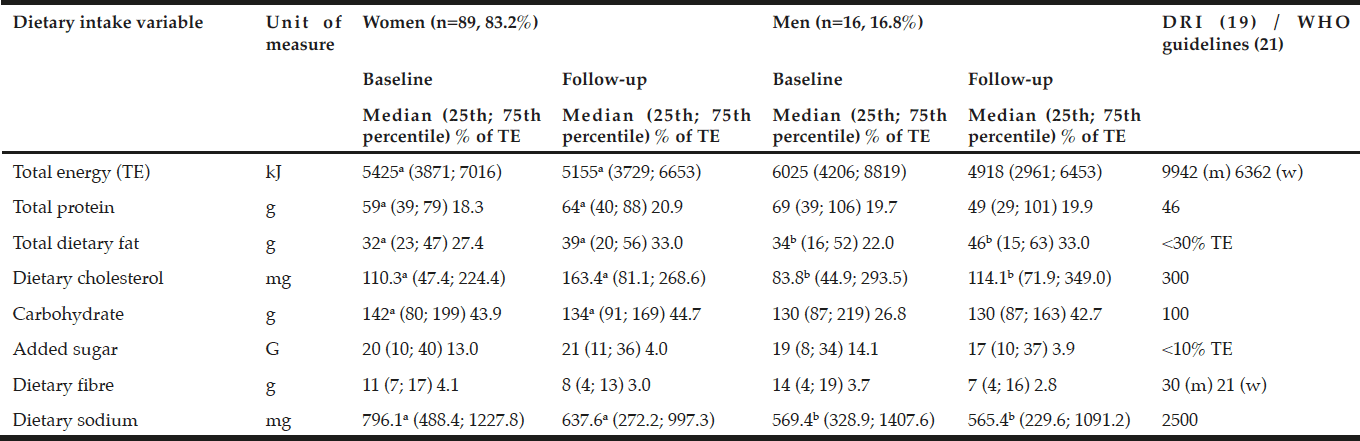
Table 2 Analysis of 24-hour recall: daily mean intakes of the men and women

Table 2
Analysis of 24-hour recall: daily mean intakes of the men and women


Estimated energy requirements (EER) based on mean±SD age for the women was 95 years, with mean±SD height and weight of 1.55±0.08 m and 74.7±14.2 kg and for men aged 72 of mean±SD height and weight of 1.69±0.09 m and 93.7±20.2 kg respectively with sedentary activity levels at baseline (17); a,b,c in the same row refer to statistically significant differences between the variables p<0.05 (Independent [between groups]and paired [within groups] t-test for equality of variances); DRI = Dietary Reference Intakes as represented by the Estimated Average Requirement for females aged 31–50 years old, and Adequate Intake (AI)# where no EAR is available (17); * UoM = Unit of Measure

The Pearson correlation analyses revealed that at baseline MetS was significantly and positively correlated with WC (r=0.325, p=0.030), diastolic blood pressure (r=0.219, p=0.0358) and TRG (r=0.537, p=0.000) levels and inversely related to HDL-C (r=-0.423, p=0.004) levels at baseline. Furthermore, significant relationships existed between WC and diastolic blood pressure (r=0.328, p=0.003) as well as carbohydrate intake with systolic blood pressure (r=-0.233, r=0.021) at baseline. At follow-up, significant associations were observed between MetS and WC (r=0.428, p=0.000), systolic (r=0.271, p=0.006) and diastolic (r=0.435, p=0.000) blood pressure, serum HDL-C (-0.254, p=0.010), TRG (r=0.514, p=0.000) and glucose (0.412, p=0.000) levels as well as added sugar intakes (r=0.221, p=0.028). WC showed significant relationships with systolic (r=0.285, p=0.004) and diastolic (r=0.250, p=0.012) blood pressure and serum TRG (r=0.230, p=0.020). Further associations were shown between systolic blood pressure with serum LDL-C (r=0.274, p=0.005) levels.
At baseline, the linear regression analysis carried out on the MetS variables showed that WC, diastolic blood pressure, serum TRG and glucose levels were predictors of MetS at baseline (R2=0.588, p=0.000, SEE=0.712) and follow-up (R2=0.595, p=0.000, SEE=0.752) in this community.


Discussion

Although the concept of MetS is older than five decades, it is receiving more attention now due to its increasing prevalence globally and in Africa as well as its relationship with cardiovascular morbidity and mortality (22). Not much is documented about the prevalence rate of MetS in SA and only a few studies have reported MetS prevalence ranging from an overall 30.2% in rural women (23) to 60.6% among colored women in Cape Town (24, 25). These rates indicate a high prevalence of MetS in SA, however, limited information about the prevalence of MetS in the elderly exists for SA. This study thus provides the latest estimate of MetS prevalence among elderly in SA and is, to our knowledge, the first study investigating the prevalence of MetS risk factors among a cohort of elderly over a period of 10 years in SA (2004 to 2014).
According to the International Diabetes Foundation (IDF) definition of MetS (26), the prevalence of MetS among the elderly in this study was 48.8% in 2004 and it increased to 63.4% in 2014, which was consistent with the findings among Taiwanese elderly (11), but higher than elderly in the United States of America (US) (27), Ecuador (9) and Korea (1). Despite the increase in MetS over the ten-year period, no association between MetS and age was established. This was inconsistent with other research findings among adults (23, 28), but consistent with the results of de Luis and co-authors for another elderly population (29). The prevalence of MetS was 39.6% among the women in 2004 and increased to 56.3% in 2014 compared to 93.4% and 100.0% among men respectively in this study. Furthermore, the results of this study were inconsistent with the findings of other studies that reported a higher prevalence of MetS among elderly women compared with men (1, 10), but may have been confounded by the small sample of men (n=16). The major differences in MetS risk factors between men and women were dysglycaemia at baseline and follow-up and low HDL-C at follow-up. A significant difference in low serum HDL-C levels for gender was also observed in Chinese elderly (10).
A shift in MetS risk factors was observed among the respondents at follow-up. Furthermore, significant associations existed among the various MetS risk factors at baseline and follow-up. At baseline, 15.6%, 33.3%, 33.3%, 13.3% and 2.2% had one, two, three, four or five MetS risk factors respectively. This changed at follow-up with fewer elderly persons with one (7.9%), two (26.7%) and three (32.7%) risk factors, but significantly more with four (23.8%) and five (6.9%) risk factors at follow-up.  The predictors of MetS at both baseline and follow-up for this study was WC, diastolic blood pressure, and serum HDL-C and TRG levels. Interestingly, low serum HDL-C was the most prominent risk factor for MetS among these elderly cohort with a prevalence of 94.3% followed by obesity (82.5%) at follow-up, but at baseline these were reversed with obesity (WC) being the most prominent risk factor with a prevalence of 85.9% compared to 71.0% for serum HDL-C. These results were consistent with another black population in SA (30). However, among Korean elderly, hypertension was the most prominent risk factor, followed by HDL-C (1). The prevalence of abnormally low HDL-C levels in this study at baseline and follow-up was much higher than the national prevalence rate of 47.9% (8). This result was also consistent with studies from Botswana, Nigeria, Cameroon and Cotonou where it was observed that reduced HDL-C contributed frequently to dyslipidaemia in Africans with MetS (22). A significant difference in HDL-C was observed.
Despite the poor socio-economic status of these elderly (12) and although prevalence decreased significantly (p=0.000) over the 10 years’ cohort study, the prevalence of central obesity (>80%), one of the major factors contributing to MetS (22), was much higher than the national prevalence rate (8) and the global prevalence of 20% among the adult population (28). In recent years, poverty and food insecurity have been linked to obesity and its associated NCDs (31). This paradoxical condition is a result of a poor quality diet consisting of mainly energy-dense, low nutrient food items containing too much fat, salt and sugar that lead to the double burden of disease, thus the co-existence of over- (obesity and NCDs) and under- (micronutrient deficiencies) nutrition, often found in countries undergoing the nutrition transition (32, 33) such as SA. The dietary intake analyzes of the elderly in our study showed an inadequate diet, as the median energy intakes were consistently low, with even lower intakes at follow-up when compared to the EER. Furthermore, the dietary intake of the men and women in this study showed low intakes of dietary fat, fiber and cholesterol. Although the median protein and carbohydrate intakes were high when compared to the EAR, the percentage it contributed to TE was within the guidelines for a balanced and healthy diet. Dietary carbohydrate is strongly related to serum glucose levels and lipid metabolism. A high carbohydrate intake can increase serum TGs and possibly decrease HDL-C levels (34). Although the intakes of carbohydrates were at least 30% higher than the EAR in 2004 and 2014, no significant relationship between carbohydrate intake and serum lipid could be established. However, the relatively high carbohydrate intakes could have contributed to the prevalence of metabolic dyslipidaemia and dysglycaemia found among the elderly men and women in our study. At follow-up, dietary intakes of added sugar was significantly correlated with MetS. This may have contributed to the higher prevalence of dysglycaemia at follow-up. Dietary fiber intakes were considerably lower than recommended and both the men and women consumed less dietary fiber at follow-up, however this was not significant. Dietary fiber, specifically whole grain fiber, is important for cardio-metabolic health due to its proven lowering effect of serum TG and LDL-C (35); however, this association could not be confirmed for this study. However, a lower dietary fiber intake and significantly (p=0.025) higher prevalence of low HDL-C levels were observed at follow-up.
In this study the prevalence of hypertension was 41.3% at baseline and decreased significantly (p=0.000) to a prevalence of 30.7% at follow-up. This was much higher than the national prevalence of hypertension of 10.2% (8). Although a large percentage of the elderly had hypertension, the dietary sodium intake was low. In addition, no association between sodium intake and hypertension could be established. This was consistent with a study undertaken in Ecuadorian elderly (9). Type 2 diabetes is no longer a rare condition in Africa and accounts for almost 90% of all the cases of diabetes mellitus. It is well known that type 2 diabetes increases the probability of developing MetS. A review of MetS in Africa has found that it ranks low in terms of the contributing factors to MetS (22). Similarly, in our study, dysglycaemia ranked the lowest of all the risk factors at baseline with a prevalence of 30.3%. Although the prevalence of dysglycaemia increased to 48.1% at follow-up, this was not significant (p=0.079).
This study contributes to the paucity of data about the prevalence of MetS among the elderly in SA, but had a number of limitations. The first limitation was that this was a cross-sectional survey in 2004 with a 10-year follow-up in the same elderly that were participating in the 2004 baseline and still attending the care center (cohort) in 2014,  lacking the ability to infer causal relationships. Another limitation was the small sample size due to 36.7% (n=64) of the respondents in the original sample in 2004 were not available for measurements in  2014. Furthermore, the respondents were selected from the only elderly care center from one township only. This is thus not a representative sample and the results cannot be generalized. Caution should also be used in interpreting the results of the men due to the small sample size. However, as an exploratory study, the results revealed issues and actions needed for future research. Although different MetS criteria are used in different studies and comparing results can thus be a limitation (22), the information generated are still informative about the burden of MetS among the elderly South African population.


Conclusion and recommendations

This study indicates that MetS is highly prevalent and rapidly increasing among these poor black elderly people residing in urban Sharpeville, SA. Although the prevalence of MetS and its various risk factors increased significantly from baseline to follow-up, no significant association between MetS and age was established in this elderly community. MetS is associated with NCD morbidity and mortality and the high MetS burden thus underscores the need for prevention and treatment strategies to increase wellness and reduce morbidity in the elderly of SA. Health-promoting behaviors should be encouraged among the elderly to prevent the increase in prevalence of MetS risk factors with age. Dietary interventions should include strategies to improve dietary intakes and to normalize dyslipidaemia and dysglycaemia, reduce hypertension and improve weight status. Furthermore, policy makers and local health authorities should design and implement regular screening campaigns to identify and treat individual risk factors as early as possible to avoid progression to MetS. This should reduce expenditure on both capital and human health resources in the country.


Acknowledgements: The authors acknowledge the National Research Foundation (NRF) and the Vaal University of Technology for funding, as well as the women participating in the study and the fieldworkers for their assistance.

Financial support: This research has been funded by the National Research Foundation (NRF) and the grant numbers are nr 62501 & 81280. The sponsors had no role in design and conduct of the study; in the data collection, analysis, and interpretation of data; in the preparation of the manuscript; or in the review or approval of the manuscript.

Conflict of interest: The authors declared that they had no conflict of interests.

Ethical standard: This study was conducted according to the guidelines laid down in the declaration of Helsinki and all procedures involving human subjects were approved by the University of the Witwatersrand’s Medical Ethics Committee for Research on Human Beings (M040835) for 2004 and the Vaal University of Technology Senate Research Innovation and Ethics Committee (20140827ms) for the 2014 data collection. Fingerprint informed consent was obtained from all the subjects.


References

1. Kim S, So WY. Prevalence and correlates of metabolic syndrome and its components in elderly Korean adults. Exp dys 2016;84:107-112.
2. Georgousopoulou EN, Naumovski N, Mellor DD, et al. Association between siesta (daytime sleep), dietary patterns and the presence of metabolic syndrome in elderly living in Mediterranean area (MEDIS study): The moderating effect of gender. J Nutr Health Aging 2016;20:1- 7.
3. Appelhans BM, Baylin A, Huang MH, et al. Beverage Intake and Metabolic Syndrome Risk Over 14 Years: The Study of Women’s Health Across the Nation. J Acad Nutr Diet 2017;117(4):554-562.
4. Cicero AFG, Colletti A. Role of phytochemicals in the management of metabolic syndrome. Phytomedicine 2016;23:1134-1144.
5. López A, Peréz-Rodrigo R. Nutrition and the metabolic syndrome. Nutr clín diet hosp 2012;32(3):92-97.
6. World Health Organization (WHO). New WHO report: Deaths from non-communicable diseases on the rise, with developing world hit hardest. 2011. http://www.who.int/mediacentre/news/releases/2011/ncds_20110427/en/. Accessed 25 October 2017.
7. Bradshaw D, Groenewald P, Laubscher R, et al. Initial burden of disease estimates for South Africa, 2000. S Afr Med J 2003;93(9):682–688.
8. Shisana O, Labadarios D, Rehle T, et al. South African National Health and Nutrition Examination Survey (SANHANES-1). 2014. HSRC Press, Cape Town.
9. Sempértegui F, Estrella B, Tucker KLO, et al. Metabolic syndrome in elderly living in marginal peri-urban communities in Quito, Ecuador. Public Health Nutr 2011;14(5):758-767.
10. Yang F. Prevalence of metabolic syndrome in the middle-aged and older Chinese population. Int J Diabetes Dev Ctries 2017;37(2):176-182.
11. Wu TT, Chen IJ, Cho SL, et al. The relationship between health-promoting behaviors and metabolic syndrome in community-dwelling older adults. Biol Res Nurs 2016;18(5):549-557.
12. Oldewage-Theron WH, Salami L, Zotor FB, et al. Health status of an elderly population in Sharpeville, South Africa. Health SA Gesondheid 2008;13(3):3-17.
13. Sekatane MB. An application of different methodologies for measuring poverty in Sharpeville township. Medit J Soc Sc 2013;4(14). http://www.mcser.org/journal/index.php/mjss/article/view/1577. Accessed 08 January 2018.
14. The Survey System. Sample size calculator. http://www.surveysystem.com/ssformu.htm. Accessed 08 January 2018.
15. Gibson RS. Principles of nutritional assessment, 2nd edn. 2005. Oxford University Press, New York.
16. Langenhoven ML, Kruger ML, Gouws E, et al. Food composition tables. Medical Research Council, Parow, 1991.
17. HARTMANN in South Africa. Tensoval blood pressure monitors. 2017. Available at: http://za.hartmann.info/tensoval_monitor.php. Accessed 24 October 2017.
18. Warnick GR, Knopp RH, Fitzpatrick V, et al. Estimating low-density lipoprotein cholesterol by the Friedewald equation is adequate for classifying patients on the basis of nationally recommended cut points. Clin chem 1990;36:15-19.
19. Institute of Medicine (IoM), Food and Nutrition Board. Dietary Reference Intakes. 2003. National Academy Press, Washington DC.
20. Grundy SM, Cleeman JI, Daniels SR, et al. Diagnosis and management of the metabolic syndrome: an American Heart Association/National Heart, Lung and Blood Institute Scientific Statement. Circulation 2005;112:2735-2752.
21. Food and Agricultural Organization (FAO) and World Health Organization (WHO). Fats and fatty acids in human nutrition. Report of an expert consultation. 2010. FAO, Geneva.
22. Okafor CI. The metabolic syndrome in Africa: current trends. Indian J Endocrinol Metab 2012;16(1):56-66.
23. Motala AA, Esterhuizen T, Pirie FJ, et al. The prevalence of metabolic syndrome and determination of the optimal waist circumference cut-off points in a rural South African community. Diabetes Care 2011;34:1032-1037.
24. Erasmus RT, Soita DJ, Hassan MS, et al. High prevalence of diabetes mellitus and metabolic syndrome in a South African coloured population: Baseline data of a study in Bellville, Cape Town. S Afr Med J 2012;102(11):851-844.
25. Kruger MJ, Nell T. The prevalence of the metabolic syndrome in a farm worker community in the Boland district, South Africa. BMC Public Health 2017;17:61.
26. International Diabetes Foundation (IDF) Clinical Guidelines Task Force. Global guideline for type 2 diabetes: recommendations for standard, comprehensive, and minimal care. Diabet Med 2006;23(6):579-593.
27. Ford ES. Risks for all-cause mortality, cardiovascular disease, and diabetes associated with the metabolic syndrome. Diabetes care 2005;28(7):1769-1778.
28. Lechleitner M. Obesity and the metabolic syndrome – a mini-review. Gerontology 2008;54(5):253-259.
29. De Luis DA, Lopez Mongil R, Gonzalez Sagrado M, et al. Prevalence of metabolic syndrome with International Diabetres Federation Criteria and ATP III Program in patients of 65 years of age or older. J Nutr, Health Aging 2010;14(5):400-404.
30. Peer N, Steyn K, Levitt N. Differential obesity indices identify the metabolic syndrome in black men and women inCape Town: the CRISBA study. J Public Health 2015;38(1):175-82.
31. Tanumihardjo S, Anderson C, Kaufer-Horwitz M, et al. Poverty, obesity, and malnutrition: an international perspective recognizing the paradox. J Am Diet Assoc 2007;107:1966-1972.
32. Olson C. Nutrition and health outcomes associated with food insecurity and hunger. J Nutr 1999;129,Suppl. 2:S521-S524.
33. Haddad L, Hawkes C, Webb P, et al. A new global research agenda for food. Nature 2016;540:30-32.
34. Riccardi G, Rivellese AA. Dietary treatment of the metabolic syndrome – the optimal diet. Br J Nutr 2000;83,Suppl.1:S143-S148.
35. Mozzafarian D, Appel LJ, van Horn L. Components of a cardioprotective diet. New insights. Circulation 2013;123:2870-2891.

METABOLIC SYNDROME PREVALENCE IS NOT ASSOCIATED WITH DIET QUALITY IN THE CHILEAN ELDERLY POPULATION: A CROSS SECTIONAL ANALYSIS FROM THE NATIONAL HEALTH SURVEY 2009-2010


C. Dussaillant1, G. Echeverría1, L. Villarroel2, C.B. Yu3, A. Rigotti1,4, P.P. Marín3,5


1. Centre for Molecular Nutrition and Chronic Diseases (CNMEC-UC), School of Medicine, Pontificia Universidad Católica de Chile; 2. Department of Public Health, School of Medicine, Pontificia Universidad Católica de Chile; 3. Program of Geriatrics, School of Medicine, Pontificia Universidad Católica de Chile; 4. Department of Nutrition, Diabetes and Metabolism, School of Medicine, Pontificia Universidad Católica de Chile; 5. Department of Internal Medicine, School of Medicine, Pontificia Universidad Católica de Chile

Corresponding Author: Dr. Pedro Paulo Marín, Department of Internal Medicine-Geriatrics, School of Medicine, Pontificia Universidad Católica de Chile. Lira 63, Santiago, Chile, ppmarin@med.puc.cl

J Aging Res Clin Practice 2016;5(3):132-138
Published online June 23, 2016, http://dx.doi.org/10.14283/jarcp.2016.104


Abstract

Objectives: To analyze the relationship between the prevalence of metabolic syndrome, food intake, and diet quality in elderly (≥65 years old) Chilean population. Design: Cross sectional analysis based on the last national health survey performed in the years 2009 and 2010 (ChNHS 2009-2010). Setting: Non-institutionalized individuals of 65 years or older were selected and visited at home. Participants: A subsample of 505 elderly adults from the ChNHS 2009-2010 who answered a food questionnaire and had appropriate information to diagnose metabolic syndrome following the ATPIII-NCEP guidelines. Measurements: Fasting blood samples were obtained in order to measure blood lipids and fasting blood glucose. Blood pressure, waist circumference, and body mass index (BMI) were also measured. A 5-item food frequency questionnaire was applied to all the participants of NHS 2009-2010. Results: The overall prevalence of metabolic syndrome in the Chilean adult population was 37.7%, increasing in frequency with advancing age. Among the elderly (≥65 years old), metabolic syndrome was found in 57.2% of the sample. Elevated blood pressure and increased waist circumference were the most prevalent metabolic syndrome components among this group (88% and 80%, respectively). Low intake of fruits, vegetables, whole cereals, fish, and dairy was seen among the elderly, and no association was found between food intake nor diet quality and metabolic syndrome prevalence. Conclusion: Metabolic syndrome is highly prevalent among the Chilean elderly population and its prevalence is not associated with food intake or diet quality in this age group.

Key words: Metabolic syndrome, food intake, diet quality, elderly.


Introduction

Worldwide, the number of elderly people, defined as 65 years of age and over, is consistently growing. In fact, by the year 2025, it is expected that the number of elderly in the world will be more than 1.2 billion, with 840 million of them living in low-income countries (1). As life expectancy increases, age-associated risk conditions and diseases, such as metabolic syndrome (MS) and cardiovascular disease (CVD), have become increasingly prevalent among the elderly. In Latin America, this ongoing epidemiological transition -along with lifestyle changes- in the last decades has increased the prevalence of obesity and other chronic conditions that lead to CVD (2). Thus, CVD has become an enormous public health burden, raising the need of more detailed survey and intervention studies to increase awareness and to facilitate design and implementation of adequate preventive and treatment strategies.
The metabolic syndrome (MS) is a cluster of risk factors known to promote CVD and diabetes (3). Several definitions and diagnostic criteria for this syndrome have been proposed by organizations such as the World Health Organization (WHO) (4), the US National Cholesterol Education Program (NCEP), and the International Diabetes Federation (IDF) (5). The overall definition proposed by the Adult Treatment Panel III (ATP III) of the NCEP, which was updated on 2004, is one of the most influential and widely used in clinical practice (6). It identifies 6 pathophysiological features that characterize MS and relates it to CVD and/or diabetes: abdominal obesity, atherogenic dyslipidemia (elevated triglycerides and low HDL cholesterol), insulin resistance (with or without dysglycemia), high blood pressure, and a proinflammatory and prothrombotic state (7). The underlying mechanism of this syndrome has not been clearly elucidated, but insulin resistance and abdominal obesity are the unifying factors that most likely explain the presence of this cluster as a distinctive entity (8).
Due to multiple age-related physiologic mechanisms, the elderly are at increased risk of developing insulin resistance and MS (9). This explains the higher prevalence of this syndrome among older adults reported in the US (10) and some Latin American populations (11). Furthermore, MS in the elderly has been associated with a more pronounced cognitive decline (12), Alzheimer´s disease (13), and higher all-cause mortality rates (14). Thus, identification and treatment of the risk factors contributing to the development of this condition are crucial to reduce morbidity and death among this group.
Genetic predisposition, obesity, aging, and a sedentary lifestyle are key risk factors involved in the development of MS. Therefore, therapeutic lifestyle changes, such as increased physical activity and weight reduction, are fundamental in the prevention and treatment of this condition (6). The role of the diet as a promoter of MS has not been clearly elucidated, and there are very few reports addressing this issue in the elderly population. For instance, whole grains intake was inversely associated with MS prevalence among older adults in one prospective study (15). Furthermore, some studies suggest an association between certain foods with MS prevalence in the general population (16-21).Additionally, randomized controlled trials using the Mediterranean diet or the DASH (Dietary Approaches to Stop Hypertension) have shown improvement in several MS parameters and reduction in the prevalence of this condition with health benefits that are independent from weight reduction (21, 22).
Modern medicine has managed to successfully treat disease conditions, prolonging life, but further insights into environmental factors that contribute to the onset of chronic diseases is fundamental for the development of adequate treatments and prevention strategies that will lead to healthier aging in the population and, consequently, to a better quality of life with reduced disability among the elderly. Therefore, the aim of this study was to analyze the prevalence of MS among the Chilean elderly population (≥65 years of age) and to further analyze its association with the quality of food intake in this particular group using data from the last National Health Survey performed between 2009 and 2010.


Materials and methods

Sample population

The National Health Survey performed in Chile in 2009-2010 (ChNHS 2009-2010) was designed to assess the population burden and distribution of certain chronic diseases. Non-institutionalized individuals older than 15 years of age were selected using a stratified multistage probability sampling method. This was a cross-sectional household survey study and a detailed report is available at its website (23). Overrepresentation of some groups, including elderly subjects, within the sample was applied in order to increase efficiency and standardize precision of the estimates. Therefore, in order to correct the distortion of the unprocessed sample and to make it coincident with the projected population of the Chilean 2002 census, expansion factors were applied to each individual in the sample.
From the original 5,412 participants in the NHS 2009-2010 sample, 1,007 subjects were ≥65 years old. For MS prevalence, a subsample of 505 older adults that had fasting plasma analysis and all the information required to diagnose MS -using ATP III-NCEP criteria- was analyzed. All participants in ChNHS 2009-2010 had data regarding food intake, so information of the full 1,007 sample of older adults was considered for overall diet characterization. Regarding association analysis between diet and MS prevalence, we considered food intake and MS prevalence of the 505 older adults for whom MS was a feasible diagnosis.
The survey protocol and consent forms were approved by the ethics committees of the School of Medicine at the Pontificia Universidad Católica de Chile and the Chilean Ministry of Health.

Data collection and laboratory analysis

A team of trained nurses and interviewers performed the survey, with measurements done during two home visits. In the first one, health questionnaires comprising sociodemographic characteristics, disease awareness and self-report along with family history and treatment status were fulfilled. In the second visit, a trained nurse performed physical examination, registered drug use and obtained fasting blood samples. All biochemical assays were performed at the central laboratory of the Pontificia Universidad Católica Clinical Hospital (CDC-certified for lipid measurements).
Blood glucose, total cholesterol, HDL cholesterol, and triglycerides were enzymatically measured with an automated clinical analyzer using standard serum controls. Blood pressure was measured in three consecutive occasions after a 5-min rest. Waist circumference (WC) was measured employing the technique proposed by ATP III-NCEP (6).
For MS diagnosis, we applied the criteria proposed by the ATP III-NCEP updated guidelines but using WC cutoff points specifically defined for our Chilean population (data not published). Thus, MS was present if an individual exhibited at least 3 of the following 5 features: (1) waist circumference ≥88 cm in men or ≥83 cm in women; (2) blood pressure ≥130/85 mm Hg or use of antihypertensive medications; (3) fasting triglycerides ≥150 mg/dL or use of lipid-lowering drugs; (4) HDL cholesterol <40 mg/dL in men or <50 mg/dL in women or use of lipid-modifying drugs; and (5) fasting glucose ≥100 mg/dL or use of antidiabetic drugs (6).

Dietary assessment and Healthy Diet Score (HDS)

Food intake information was obtained with a 7-item food frequency questionnaire that included 4 foods comprised in a Mediterranean dietary pattern and that have been associated with benefits for human health. Therefore, data regarding fish, whole grains, fruits, vegetables and dairy intake was gathered and further classified in low, moderate or high intake categories. Additionally, we created a Healthy Diet Score (HDS), which was constructed upon the food intake information collected at ChNHS 2009-2010 with the intention of measuring diet quality by approximation as a whole to the Mediterranean diet recommendations. Therefore, low, moderate and high intake of each food translated into 0, 0.5 and 1 point, respectively. As four types of foods (i.e., fish, fruits, vegetables and whole grains) were considered for score calculation, the addition of each food points resulted in a score that could reach values between 0 (worst diet) to 4 points (best diet quality). Dairy was not considered for score calculation because the Mediterranean diet recommends intake of low fat/fat free and fermented dairy products, but ChNHS 2009-2010 made no distinction between regular versus low fat/fat free dairy consumption. Food frequency intake defining each score item and overall HDS calculation are shown in Table 1.

Table 1 Food intake frequency point counting for Healthy Diet Score (HDS) calculation

Table 1
Food intake frequency point counting for Healthy Diet Score (HDS) calculation


Statistical Analysis

Expansion factors were applied in all the statistical analysis. Continuous variables are shown as mean with 95% confidence interval and categorical variables are shown as number of cases and percentage with 95% confidence interval. Chi-square test was used to analyze differences between proportions, whereas t Student test for independent samples analysis and analysis of variance (ANOVA) were applied to test differences between means. For MS and diet association analysis, complex logistic regression was used, adjusted by age, gender and educational level. A p value <0.05 was considered statistically significant. Data processing and statistical analyses were done with the SPSS statistical software package version 17.0 (SPSS Inc., Chicago, IL, USA).


Results

Subject characteristics

The study sample consisted on 505 Chilean adults ≥ 65 years of age, with a predominance of women (58%, men 42%), and a mean age of 73 years. Most of the participants had low educational level (52%) and showed high rates of CVD (24.7%) and hypertension (75%). The overall demographic and clinical characteristics of these subjects are summarized in Table 2.


Table 2 Demographic and clinical characteristics of Chilean elderly subjects (n=505) evaluated at ChNHS 2009-2010

Table 2
Demographic and clinical characteristics of Chilean elderly subjects (n=505) evaluated at ChNHS 2009-2010


Metabolic syndrome prevalence

The overall prevalence of MS in the Chilean adult population (>18 years-old) was 37.7%, with no difference found between men and women, or different educational levels. The prevalence increased with advancing age, from 10.9% among subjects aged 18 through 29, to 58.2% in the group aged 45 to 65, and 57.2% among the elderly (≥ 65 years-old) (Figure 1). No differences in MS prevalence among the elderly were seen when analyses were performed by gender or educational level.


Figure 1 Metabolic syndrome prevalence in different age groups of the Chilean adult population

Figure 1
Metabolic syndrome prevalence in different age groups of the Chilean adult population


Among the elderly, elevated blood pressure and increased waist circumference were the most prevalent MS components (88% and 80% respectively) and low HDL cholesterol was the least frequent alteration (39%) (Figure 2). No difference in the MS component distributions was seen between elderly men and women.


Figure 2 Prevalence of metabolic syndrome components among Chilean elderly (≥65 years-old) population

Figure 2
Prevalence of metabolic syndrome components among Chilean elderly (≥65 years-old) population

Food intake

A low intake of all the foods studied was seen among the Chilean elderly adult population, with fish being the least consumed item (Figure 3). On the other hand, fruit was the most frequently consumed food, with 35% of the elderly population reaching a fruit intake of ≥2 portions/day. However, only 17% of the adults in this group age consumed the recommended 5 portions of fruits and vegetables per day.


Figure 3 Recommended food intake among Chilean elderly (≥65 years old) subjects

Figure 3
Recommended food intake among Chilean elderly (≥65 years old) subjects

Food intake recommendations: dairy: > 1 portion/day; whole cereal: ≥1 portion/day; fish: >1 portion/week; fruits & vegetables: ≥5 portions/day; fruits ≥2 portions/day; vegetables ≥3 portions/day


Dairy and fruit intake was significantly higher among older women compared to older men. Indeed, 34% of women consumed dairy at least once a day, in contrast to only 20% of older men (p=0.018). On the other hand, fruit was adequately consumed (at least 2 portions of fruits per day) by 39% of women in contrast with 29% of men (p=0.008) aged ≥ 65 years-old.
On the other hand, fish, whole grains and vegetables were more frequently consumed among individuals with higher educational levels, with 85% of older adults in the higher educational level group consuming at least 1 portion/day of vegetables compared to 66% and 82% of individuals in low and middle levels respectively (p=0.029). Fish was consumed at least once a week by 69% of the individuals in high education levels, compared to 30% and 35% among those in low and middle levels, respectively (p<0.001). Finally, whole grains were consumed at least once every two days in 46% of the highly educated individuals, compared with 20 and 33% in those among low and middle educational levels (p=0.006).

Healthy diet score (HDS)

Overall, the HDS was low, reaching the highest mean value of 1.4 points (with 0 representing the worst food intake and 4 points the best diet quality) among older adults aged 65 through 74. The lowest HDS (1.19), i.e., the worst diet quality, was found among adults older than 75 years and was significantly lower than the HDS of older adults between 65 and 74 years of age (p=0.024). When analyzing by gender, women ≥ 65 years showed a better mean HDS than men (1.429 vs. 1.164; p<0.001), and a better diet quality was seen among those with higher educational levels (HDS = 1.914 in high educational level vs 1.127 and 1.428 in low and middle educational levels, respectively; p<0.001)


Figure 4 Healthy Diet Score and metabolic syndrome prevalence in the Chilean elderly population

Figure 4
Healthy Diet Score and metabolic syndrome prevalence in the Chilean elderly population


Associations between food intake, diet quality and MS

No association was found between the intake of any of the foods evaluated and MS prevalence in the elderly population. Moreover, although a tendency towards a low MS prevalence with higher HDS was observed, this association was not statistically significant (Figure 4).


Discussion

This study is, to our knowledge, the first one to report MS prevalence among a nationally representative elderly Chilean population, and to further associate it with food intake and diet quality in this particular group. Indeed, the prevalence of MS has not been adequately explored in older individuals, with very few studies reporting its prevalence in Latin American populations. In Chile, MS prevalence among this group was 57.2%, similar to that found in Brazil (24) and Venezuela (25). It is also comparable to that reported in the US population surveyed in NHANES 3 (10). Nevertheless, since methodological differences between studies (i.e., different waist circumference cut-offs) can heavily influence prevalence rates, comparisons between populations have to be made carefully.
Our study showed an increase in MS prevalence with advancing age, with significantly higher prevalence of this condition among older individuals when compared to younger groups. In fact, age is known to promote MS since several age-related physiologic changes facilitate the development of insulin resistance and other metabolic alterations related to CVD and diabetes (9, 26).
Abdominal obesity and high blood pressure were the most common MS components in the Chilean elderly population (>80% prevalence each one). Hypertension is common among the elderly, with an estimated prevalence of 30-50% worldwide (26). Aging is associated with changes in the vascular system that involve stiffening of the arteries leading to increased systolic blood pressure (9), therefore explaining the high prevalence of hypertension in this group. On the other hand, the prevalence of abdominal obesity in this population is much larger than that reported in other studies (11). This raises the question about the appropriateness of the 83/88 cm cutoff points for detecting abdominal obesity among older individuals in our country. Nevertheless, variability in the prevalence of MS and its components between populations is foreseeable and could also be explained by demographic and epidemiological factors, as well as ethnic differences and environmental influences, including nutrition.
In this report, older adults showed insufficient intake of all the foods studied. This could be explained by modernization and the ongoing nutritional transition in Latin American countries. Indeed, increased food availability, along with greater processing of food supplies, has lead to a nutritional shift in which whole cereal, fruit, vegetable and fiber intake has declined whereas processed and refined food, sugar and fat intake has increased (27). This dietary pattern facilitates the development of obesity and obesity-related conditions such as MS, diabetes, and CVD (17, 20). Hence, the development of population-level strategies and policies oriented to improve the quality of the diet in our population becomes extremely urgent.
Only 17% of older adults in Chile reached the recommended intake of 5 portions of fruits and vegetables per day. Among the elderly, fruit and vegetable consumption has been linked to a better quality of life and a protective role against cognitive decline and other chronic diseases such as hypertension, diabetes, and CVD (28). Therefore, a low intake of fruits and vegetables is a concerning signal that may be contributing to high morbidity rates in this population. On the other hand, fish was the least consumed food, probably due to its high price, which makes it unaffordable for most Chilean families. Omega-3 fatty acids obtained from fatty fish have been linked with multiple positive effects on human health, including cardiovascular benefits (29) and protection against cognitive decline among the elderly (30). Therefore, its low intake is particularly worrisome and highlights the fact that our country is not taking adequate advantage of its local and natural products, which could have large impact in the health status and quality of life not only of the elderly, but also of the whole population.
No association was found between any of the foods surveyed and MS prevalence in this particular age group. High intake of whole grains (31), dairy (32), fruits and vegetables (33) has been associated with lower MS prevalence among adult populations. Indeed, in a previous report by our group, whole grains intake was inversely associated with MS prevalence in the overall Chilean adult population (34), but this relationship was not observed in this older subsample. Nevertheless, similar to our findings, a cross sectional retrospective study did not find associations between food intake and MS prevalence among older women (35). Although their analysis considered nutrients instead of foods, these results and ours suggest that food intake, as an environmental factor influencing the development of MS, has a different and/or lower impact on preventing and treating this condition in a later stage of life. Age-related physiological mechanisms along with long-term exposition to environmental factors, rather than current dietary habits that promote these metabolic alterations, may be much more significant among older individuals. At this stage of the vital cycle, progression of hyperinsulinemia, inflammation, atherosclerosis and other metabolic alterations may be too advanced and difficult to modify by lifestyle changes. Nevertheless, it is important to consider that following a healthy dietary pattern from younger ages brings health benefits that would manifest later in life. Indeed, Barker’s theory of the developmental origins of adult chronic disease emphasizes the large impact that environmental factors during fetal development have on disease incidence in adulthood (36). Additional plausible explanations for the lack of association between food intake and MS prevalence in this study was a low statistical power due to sample size and/or low intake of foods not reaching levels at which their benefits in health would be clinically observable.
On the other hand, overall dietary patterns embrace a useful approach to study the effects of the diet as a whole in human health, providing more information than that attainable with the analysis of single nutrients or foods. In our study, the quality of the diet was established using a HDS, which evaluated intake of four foods that are routinely included in a variety of healthy eating indexes (37). Applying this score, we observed a better diet quality among women and with higher educational levels, which is consistent with findings reported in the US population using the Healthy Eating Index (HEI) (38, 39). The lowest HDS, hence the worse diet, was found among older adults aged 75 or more. At this stage in life, several health related problems, physical impairment, social isolation, as well as physiologic changes that lead to anorexia may be responsible of this poorer diet quality (40).
Even though we expected that MS prevalence would be higher with a worse diet (i.e., lower HDS), as previously found in the overall Chilean adult population (34), this association was not significant among this subsample of older subjects. As mentioned above, different explanations (e.g., low statistical power due to sample size and low intake of foods as well as limited number of food items used in HDS) may explain our finding. Some dietary patterns, such as the Mediterranean diet, have been previously associated with a lower MS prevalence, along with lower rates of atherogenic dyslipidemia (21). Nevertheless, the role of the Mediterranean diet on MS status does not lack of some controversy because some observational studies have not found any association (41). More recently, the PREDIMED randomized clinical trial however showed that adherence to this dietary pattern reversed metabolic syndrome (42).
It is important to consider some limitations of our HDS. First, it includes only four potentially healthy foods and does not consider unhealthy eating habits. Moreover, the intake categories defined in ChNHS 2009-2010 were in some items, such as fish, different from those recommended by other healthy eating indexes (e.g., high consumption of fish meant ≥1 portion/week in our score, whereas the Mediterranean diet recommends ≥ 3 portions/week). Another limitation of our study is that all the eating habits information of the ChNHS 2009-2010 was exclusively based on a brief questionnaire applied to participants. As memory problems and cognitive decline are common features among older adults, information gathered may not be entirely precise and reliable.
In conclusion, MS is very prevalent among the Chilean elderly population, with abdominal obesity and hypertension being the most frequent MS components. Overall, older adults in our country had a deficient diet, with the poorest diet quality found among adults aged 75 years-old or more. Neither intake of some specific food items nor a healthy diet score were associated with MS prevalence in this group. Despite of this lack of association, we still consider that the recommendations for a healthy diet pattern, such as the Mediterranean diet, are suitable for the elderly. Indeed, increasing evidence suggests an important role of a Mediterranean-like dietary pattern in delaying the onset of multiple chronic diseases and health decline with age, as well as prolonging life expectancy not only in Mediterranean countries, but also outside the Mediterranean basin as well (43). Therefore, the development of population-based strategies that would promote this dietary pattern among the elderly is, in our opinion, fundamental for reducing morbidity and disabilities among this group.


Acknowledgments: This work was partially funded by the 2014 Research Program on Elderly and Aging, Office of Research Affairs, Pontificia Universidad Católica de Chile, and Fundación Alimenta. We also acknowledge the Ministry of Health, Government of Chile for sharing the 2009-2010 National Health Survey database.

Conflict of interest: None

Ethics Standard: ChNHS 2009-2010 protocol was reviewed and approved by ethics committees of the School of Medicine at the Pontificia Universidad Católica de Chile and the Chilean Ministry of Health.


References

1.    WHO. Nutrition for older persons. Ageing and nutrition: a growing global challenge  [cited 2015 May]. Available from: http://www.who.int/nutrition/topics/ageing/en/index2.html.
2.    Medina-Lezama J, Chirinos-Pacheco J, Chirinos JA. Cardiovascular disease in Latin America. Am Heart J 2005;149(2):E13. doi: 10.1016/j.ahj.2004.09.002
3.    Alberti KG, Eckel RH, Grundy SM, Zimmet PZ, Cleeman JI, Donato KA, et al. Harmonizing the metabolic syndrome: a joint interim statement of the International Diabetes Federation Task Force on Epidemiology and Prevention; National Heart, Lung, and Blood Institute; American Heart Association; World Heart Federation; International Atherosclerosis Society; and International Association for the Study of Obesity. Circulation 2009;120(16):1640-5. doi: 10.1161/CIRCULATIONAHA.109.192644
4.    Alberti KG, Zimmet PZ. Definition, diagnosis and classification of diabetes mellitus and its complications. Part 1: diagnosis and classification of diabetes mellitus provisional report of a WHO consultation. Diabet Med 1998;15(7):539-53. doi: 10.1002/(SICI)1096-9136(199807)15:7<539::AID-DIA668>3.0.CO;2-S
5.    International Diabetes Federation. The IDF consensus worldwide definition of the metabolic syndrome 2006 [cited 2015 May]. Available from: http://www.idf.org/webdata/docs/MetS_def_update2006.pdf.
6.    Grundy SM, Cleeman JI, Daniels SR, Donato KA, Eckel RH, Franklin BA, et al. Diagnosis and management of the metabolic syndrome: an American Heart Association/National Heart, Lung, and Blood Institute Scientific Statement. Circulation 2005;112(17):2735-52. doi: 10.1161/CIRCULATIONAHA.105.169404
7.    Grundy SM, Brewer HB, Jr., Cleeman JI, Smith SC, Jr., Lenfant C, American Heart A, et al. Definition of metabolic syndrome: Report of the National Heart, Lung, and Blood Institute/American Heart Association conference on scientific issues related to definition. Circulation 2004;109(3):433-8. doi: 10.1161/01.CIR.0000111245.75752.C6
8.    Eckel RH, Grundy SM, Zimmet PZ. The metabolic syndrome. Lancet 2005;365(9468):1415-28. doi: 10.1016/S0140-6736(05)66378-7
9.    Kovacic JC, Moreno P, Nabel EG, Hachinski V, Fuster V. Cellular senescence, vascular disease, and aging: part 2 of a 2-part review: clinical vascular disease in the elderly. Circulation 2011;123(17):1900-10. doi: 10.1161/CIRCULATIONAHA.110.009118
10.    Ervin RB. Prevalence of metabolic syndrome among adults 20 years of age and over, by sex, age, race and ethnicity, and body mass index: United States, 2003-2006. Natl Health Stat Report 2009;(13):1-7.
11.    Medina-Lezama J, Zea-Diaz H, Morey-Vargas OL, Bolanos-Salazar JF, Munoz-Atahualpa E, Postigo-MacDowall M, et al. Prevalence of the metabolic syndrome in Peruvian Andean hispanics: the PREVENCION study. Diabetes Res Clin Pract 2007;78(2):270-81. doi: 10.1016/j.diabres.2007.04.004
12.    Yaffe K, Weston AL, Blackwell T, Krueger KA. The metabolic syndrome and development of cognitive impairment among older women. Arch Neurol 2009;66(3):324-8. doi: 10.1001/archneurol.2008.566
13.    Razay G, Vreugdenhil A, Wilcock G. The metabolic syndrome and Alzheimer disease. Arch Neurol 2007;64(1):93-6. doi: 10.1001/archneur.64.1.93
14.    Forti P, Pirazzoli GL, Maltoni B, Bianchi G, Magalotti D, Muscari A, et al. Metabolic syndrome and all-cause mortality in older men and women. Eur J Clin Invest 2012;42(9):1000-9. doi: 10.1111/j.1365-2362.2012.02688.x
15.    Sahyoun NR, Jacques PF, Zhang XL, Juan W, McKeown NM. Whole-grain intake is inversely associated with the metabolic syndrome and mortality in older adults. Am J Clin Nutr 2006;83(1):124-31.
16.    Babio N, Sorli M, Bullo M, Basora J, Ibarrola-Jurado N, Fernandez-Ballart J, et al. Association between red meat consumption and metabolic syndrome in a Mediterranean population at high cardiovascular risk: cross-sectional and 1-year follow-up assessment. Nutr Metab Cardiovasc Dis 2012;22(3):200-7. doi: 10.1016/j.numecd.2010.06.011
17.    Lutsey PL, Steffen LM, Stevens J. Dietary intake and the development of the metabolic syndrome: the Atherosclerosis Risk in Communities study. Circulation 2008;117(6):754-61. doi: 10.1161/CIRCULATIONAHA.107.716159
18.    Dhingra R, Sullivan L, Jacques PF, Wang TJ, Fox CS, Meigs JB, et al. Soft drink consumption and risk of developing cardiometabolic risk factors and the metabolic syndrome in middle-aged adults in the community. Circulation 2007;116(5):480-8. doi: 10.1161/CIRCULATIONAHA.107.689935
19.    Malik VS, Popkin BM, Bray GA, Despres JP, Willett WC, Hu FB. Sugar-sweetened beverages and risk of metabolic syndrome and type 2 diabetes: a meta-analysis. Diabetes Care 2010;33(11):2477-83. doi: 10.2337/dc10-1079
20.    Esmaillzadeh A, Kimiagar M, Mehrabi Y, Azadbakht L, Hu FB, Willett WC. Dietary patterns, insulin resistance, and prevalence of the metabolic syndrome in women. Am J Clin Nutr 2007;85(3):910-8.
21.    Babio N, Bullo M, Basora J, Martinez-Gonzalez MA, Fernandez-Ballart J, Marquez-Sandoval F, et al. Adherence to the Mediterranean diet and risk of metabolic syndrome and its components. Nutr Metab Cardiovasc Dis 2009;19(8):563-70. doi: 10.1016/j.numecd.2008.10.007
22.    Azadbakht L, Mirmiran P, Esmaillzadeh A, Azizi T, Azizi F. Beneficial effects of a Dietary Approaches to Stop Hypertension eating plan on features of the metabolic syndrome. Diabetes Care 2005;28(12):2823-31.
23.    Ministry of Health, Chile  [cited 2015]. Available from: http://epi.minsal.cl/estudios-y-encuestas-poblacionales/encuestas-poblacionales/descarga-ens/.
24.    Dutra ES, de Carvalho KM, Miyazaki E, Hamann EM, Ito MK. Metabolic syndrome in central Brazil: prevalence and correlates in the adult population. Diabetol Metab Syndr 2012;4(1):20. doi: 10.1186/1758-5996-4-20
25.    Florez H, Silva E, Fernandez V, Ryder E, Sulbaran T, Campos G, et al. Prevalence and risk factors associated with the metabolic syndrome and dyslipidemia in White, Black, Amerindian and Mixed Hispanics in Zulia State, Venezuela. Diabetes Res Clin Pract 2005;69(1):63-77. doi: 10.1016/j.diabres.2004.11.018
26.    Villareal DT, Apovian CM, Kushner RF, Klein S, American Society for N, Naaso TOS. Obesity in older adults: technical review and position statement of the American Society for Nutrition and NAASO, The Obesity Society. Am J Clin Nutr 2005;82(5):923-34.
27.    Bermudez OI, Tucker KL. Trends in dietary patterns of Latin American populations. Cad Saude Publica 2003;19 Suppl 1:S87-99.
28.    Nicklett EJ, Kadell AR. Fruit and vegetable intake among older adults: a scoping review. Maturitas 2013;75(4):305-12. doi: 10.1016/j.maturitas.2013.05.005
29.    Deckelbaum RJ, Torrejon C. The omega-3 fatty acid nutritional landscape: health benefits and sources. J Nutr 2013;142(3):587S-91S. doi: 10.3945/jn.111.148080
30.    van Gelder BM, Tijhuis M, Kalmijn S, Kromhout D. Fish consumption, n-3 fatty acids, and subsequent 5-y cognitive decline in elderly men: the Zutphen Elderly Study. Am J Clin Nutr 2007;85(4):1142-7.
31.    Mozaffarian D, Kumanyika SK, Lemaitre RN, Olson JL, Burke GL, Siscovick DS. Cereal, fruit, and vegetable fiber intake and the risk of cardiovascular disease in elderly individuals. JAMA 2003;289(13):1659-66. doi: 10.1001/jama.289.13.1659
32.    Astrup A. Yogurt and dairy product consumption to prevent cardiometabolic diseases: epidemiologic and experimental studies. Am J Clin Nutr 2014;99(5 Suppl):1235S-42S. doi: 10.3945/ajcn.113.073015
33.    Esmaillzadeh A, Kimiagar M, Mehrabi Y, Azadbakht L, Hu FB, Willett WC. Fruit and vegetable intakes, C-reactive protein, and the metabolic syndrome. Am J Clin Nutr 2006;84(6):1489-97.
34.     Dussaillant C, Echeverría G, Villarroel L, Marín PP, Rigotti A. Unhealthy food intake is linked to higher prevalence of metabolic syndro,me in Chilean adult population. Nutr Hosp 2015;32(5):2098-104
35.    Bruscato NM, Vieira JL, do Nascimento NM, Canto ME, Stobbe JC, Gottlieb MG, et al. Dietary intake is not associated to the metabolic syndrome in elderly women. N Am J Med Sci 2010;2(4):182-8. doi: 10.4297/najms.2010.2182
36.    Barker DJP. The developmental origins of chronic adult disease. Acta Paediatrica 2004;93(s446):26-33.
37.    Martínez-González MA, Fernández-Jarne E, Serrano-Martínez M, Wright M, Gomez-Gracia E. Development of a short dietary intake questionnaire for the quantitative estimation of adherence to a cardioprotective Mediterranean diet. Eur J Clin Nutr 2004;58:1550-2. doi: 10.1038/sj.ejcn.1602004
38.    Ervin RB. Healthy Eating Index scores among adults, 60 years of age and over, by sociodemographic and health characteristics: United States, 1999-2002. Advance Data 2008;20(395):1-16.
39.    Ervin RB. Healthy Eating Index–2005 total and component scores for adults aged 20 and over: National Health and Nutrition Examination Survey, 2003-2004. Natl Health Stat Report 2011;13(44):1-9.
40.    Ahmed T, Haboubi D. Assessment and management of nutrition in older people and its importance to health. Clin Interv Aging 2010;5:207-16.
41.    Alvarez Leon E, Henriquez P, Serra-Majem L. Mediterranean diet and metabolic syndrome: a cross-sectional study in the Canary Islands. Public Health Nutr 2006;9(8A):1089-98. doi: 10.1017/S1368980007668487
42.    Babio N, Toledo E, Estruch R, Ros E, Martinez-Gonzalez MA, Castaner O, et al. Mediterranean diets and metabolic syndrome status in the PREDIMED randomized trial. CMAJ 2014;186(17):E649-57. doi: 10.1503/cmaj.140764
43.    Roman B, Carta L, Martinez-Gonzalez MA, Serra-Majem L. Effectiveness of the Mediterranean diet in the elderly. Clin Interv Aging 2008;3(1):97-109.

CONSIDERATIONS IN FAVOR OF THE USE OF FISH OIL FOR CARDIOVASCULAR DISEASE PREVENTION AND TREATMENT IN OLDER ADULTS

I.M. Muo1, M. Miller2, A.P. Goldberg1


1. Division of Gerontology and Geriatric Medicine; 2. Division of Cardiovascular Medicine, University of Maryland School of Medicine, Baltimore, MD and Baltimore Geriatric Research, Education and Clinical Center, VA Maryland Health Care System, Baltimore, MD 21201

Corresponding Author: I.M. Muo, NICHD, National Institute of Health, 10 Center Drive, Bldg 10, CRC, Room 1-3140, MSC 1109, Bethesda, MD 20814, Email: imuo@grecc.umaryland.edu


Abstract

Omega-3 polyunsaturated fatty acids (fish oils) cause many metabolic benefits such as reductions in hypertriglyceridemia, blood pressure, markers of inflammation that may help to prevent or treat cardiovascular disease (CVD), particularly in older high risk patients. However, recent meta-analyses question these health benefits of fish oil supplementation. Studies show fish oil to be beneficial in cardiovascular health particularly when combined with physical activity and low cholesterol diet even though certain cardiovascular medications can interact with fish oil to affect its clinical response. In this review, we present clinical, behavioral and pharmacological factors such as age, genetics, gender, medications and lifestyle which can influence patients’ biological responses to fish oil supplementation. We conclude that these factors, which are not typically accounted for in many clinical trials, may significantly contribute to the negative findings of these meta-analyses.

Key words: Omega 3 fatty acids, fish oil, cardiovascular disease, metabolic syndrome, aging.


Introduction

Numerous studies have evaluated the effectiveness of omega-3 polyunsaturated fatty acids (fish oil) for primary and secondary prevention of cardiovascular diseases (CVD) in older adults. Fish oils show promise in reducing cardiovascular disease risk due to their modulating effects on several mechanisms implicated in the pathogenesis of CVD. Fish oils reduce the adverse effects of free radicals, cytokines and other metabolites that injure the endothelial wall, cause foam cell formation, and vascular wall remodeling which contribute to atherosclerosis, metabolic syndrome and CVD mortality (Figure 1) (1, 2).

Fish oils are effective in reducing metabolic risk factors for CVD. In individuals with hypertriglyceridemia, fish oils can lower triglycerides (TG) by over 40% by enhancing free fatty acid oxidation (3). Fish oil also reduces markers of inflammation such as TNF-alpha, C-reactive protein, interleukin 6 to reduce vascular stress and reactivity. In obese, older adults with CVD

risk factors, the combination of fish oil and weight loss reduces metabolic risk factors and improves vascular compliance more than with weight loss alone (4). Fish oils may also help to prevent sarcopenia, reduce diabetes incidence, boost physical and cognitive functions and reduce depressive symptoms in older adults (5-9). These pleiotropic effects can translate globally into healthier aging through improved cardiovascular, musculoskeletal and neurologic health. Yet, recent meta-analyses question the cardio-protective effects of fish oils in high-risk older adults (10, 11). In this review, we review known-patient and medication factors that may affect the clinical response of fish oils for prevention and treatment of CVD.


Omega 3-Polyunsaturated Fatty Acid: Sources, Metabolism and Pharmacology

Sources and Metabolism

Omega 3 (n-3 PUFA) is one of the two known types of polyunsaturated fatty acids—the other is Omega 6 (n-6 PUFA) polyunsaturated fatty acids. Both are essential fatty acids for humans, thus they must be consumed in the diet or as nutri-supplements. Both PUFAs are long chain fatty acids whose metabolism start in the cell membrane and continue in the peroxisomes by the same enzymes (12). n-3 PUFA differs from omega-6 polyunsaturated fatty acids by the location of the first double bond. Alpha linoleic acid (ALA), eicosapentaenoic acid (EPA) and docosahexaenoic acid (DHA) are three major known dietary sources of n-3 PUFA. Fish and fish oil supplements are the reliable sources of dietary DHA and EPA because ALA is metabolized, though very inefficiently, to EPA and DHA. Metabolites of omega-3 PUFA are largely anti-inflammatory while metabolites of n-6 PUFA, such as arachidonic acid, are pro- inflammatory when compared to n-3 PUFA metabolites. Dietary sources of 1) n-3 PUFA include salmon, pollock, herring, albacore tuna, 2) ALA include walnuts, flaxseed, soybeans and canola oils and 3) n-6 PUFA include safflower, sunflower, corn, soybean oils (12).

Absorption and distribution of fish oils

Most fish oil supplements are available as over-the- counter nutraceuticals. The absorption and plasma levels of DHA and EPA differ based on formulation. Emulsified fish oils are digested and absorbed faster than encapsulated fish oil (13). Studies conducted in healthy adults show that re-esterified lipid formulations of fish oil have higher n-3 PUFA levels in red blood cell phospholipids than do ethyl ester formulations (14). Further research is needed to determine the effects of EPA and DHA formulation on absorption and CVD risk factors in older adults.

The American Heart Association (AHA) recommends daily intake of 1g EPA + DHA for individuals with coronary artery disease and higher doses (2-4g of combined EPA, DHA) in individuals with hypertriglyceridemia (15, 16). Recently, some investigators have called for revision of these currently recommended daily intakes for omega 3 fatty acids (17). The doses of EPA and DHA in diet and fish oil supplements may affect the degree of and rapidity of their primary and secondary prevention of CVD. Depending on the dosages, the levels of EPA and DHA distribute differently into various cell membranes such as red blood cells, leukocytes, platelets. Furthermore, the rate of saturation of omega-3 fatty acids into these various cell membranes over time depends heavily on the type of cell (18). Within each particular cell group, higher dosing of fish oils leads to faster incorporation; however, the time to maximal incorporation varies across cell types. For instance, full incorporation of EPA or DHA into platelets takes 20 to 30-days, while in lymphocytes it takes 6 to 8-months (18). Since the chronic inflammatory process in atherosclerosis involves various cell types, one can only speculate that the dose and duration of fish oil therapy and patient’s age influence the observed cardiovascular clinical outcomes by affecting the biological cascades resulting from n-3 PUFA incorporation into the different cell membranes.

Thus, it is possible that the relatively low dosage of 1-2g/ day of fish oil supplements administered to patients at high CVD risk in many of the studies referenced in the meta-analyses may explain the poor clinical responses.

Side effects and drug-interactions

A major concern with too much fish and fish oil consumption is toxicity with organic pollutants such as methyl-mercury, polychlorinated biphenyls, organochlorines, polyaromatic hydrocarbons and dioxins (19, 22, 23). One multicenter, case-controlled study found that high levels of plasma methyl-mercury masked the cardio-protective effects of DHA (20, 21). As dietary supplements, most fish oil formulations are unregulated by the Food and Drug Administration. In the over-the- counter supplements studied, mercury and methyl- mercury were found to be within “negligible” levels (<12ng/ml), even with consumption of high doses of the supplements. While these levels may apply to the general public, it is unknown what effects they may have in frail older adults with multiple disease co-morbidities.

Several studies also evaluate the interaction between fish oils and medications used to treat or prevent CVD, such as aspirin, statins and other anticoagulants such as Plavix and warfarin—medications which are frequently used in older adults with cardiovascular diseases. These studies show no life-threatening drug-drug interactions from using fish oils in combination with these cardiac medications. Instead, fish oils seem to provide complementary and even maximum dose of fluoxetine 5ht2c 10 mg effects 4 dollar list. prozac cost per pill prozac purchase uk generic in some cases synergistic effects with these other cardiovascular treatments (24-26). For example, fish oils are shown to improve the anti-platelet effects of aspirin when used in combination with aspirin in individuals with CAD, including those with evidence of aspirin resistance (25).


Clinical Factors affecting response to fish oil supplements

Age, genetics and gender

The level and effects of EPA and DHA appear to differ by gender and age. Younger women tend to have higher DHA levels than men due to higher 17-beta estradiol, which seems to mediate this gender difference in DHA by increasing hepatic production of DHA. In contrast, EPA levels do not differ by gender (27, 28). Men and women also respond differently to DHA and EPA. In men, EPA has a greater antiplatelet effect than DHA, whereas the reverse is true in women (29). Even so, EPA may provide other vascular protective effects in women. Low levels of EPA in women are associated with increased mortality from all causes after acute myocardial infarction (30). Genetic variation in several enzymes involved in the metabolism of PUFA such as delta 5 and delta 6 desaturases, cyclooxygenase and lipooxygenase have significant independent effects on the risk for cardiovascular events (31, 32). The prevalence of these age, gender and genetic variations in response to fish oil preparations and their clinical utility should be considered in future clinical research studies.

Diet, exercise and CVD risk, interactions with fish oils

Diet remains highly relevant in CVD prevention and reduction of morbidity and mortality with aging (33). The Mediterranean diet, which is rich in vegetables, nuts, fish, and legumes, was recently shown in a large prospective study to decrease the risk of cardiovascular events among high cardiovascular risk, dietary compliant individuals (34). Compliance with the AHA’s recommended dietary guidelines improve lipid profiles in overweight and obese older adults—especially when combined with weight loss (35, 36). Moreover, a cross sectional study in middle-aged adults suggests that the beneficial effects of fish oil in reducing cardio- metabolic risk may be present only in individuals with high baseline physical activity (37). Thus, future fish oil studies should consider the participants’ prior diet and physical activity habits when evaluating clinical outcomes of fish oil supplementation.


Summary and future considerations

Cardiovascular disease is the leading cause of mortality in the United States, and age represents a significant variable in deriving 10-year risk, using the Framingham Risk Score. Patients with coronary artery disease (CAD) and hypertriglyceridemia (e.g., TG > 150 mg/dL) remain at increased risk of future CAD events, despite attainment of their LDL treatment goal with statin therapy (38). Yet, despite elevated risk associated with high TG levels in middle and older-aged adults, it is not known whether lowering TGs translates into reduced CVD risk. Currently, the REDUCE-IT trial (clinicaltrials. gov) is evaluating whether a purified EPA derivative, (icosapent ethyl) reduces CVD events beyond standard of care therapy in hypertriglyceridemic patients with or at increased CVD risk. This study is expected to be completed in 2016.

Aging is also associated with changes in body composition, with a predilection for an increase in visceral fat mass and a loss of muscle mass. Fish oils show promising role in preventing or slowing sarcopenia. It is not known whether reducing visceral adiposity in older adults with chronic fish oil supplementation leads to an improvement in cardio-metabolic risk factors and to a reduction in insulin resistance. Research is underway in our laboratory to evaluate the potential of chronic fish oil supplementation to reduce visceral fat accumulation in subjects with metabolic syndrome. Such a finding could have major public health implications.

While the role of fish oils in preventing CVD and CVD mortality remains to be fully established, fish oil supplements are generally well tolerated by older people. Side effects of fish oil supplements are minimal and include symptoms such as bloating and diarrhea, which are dose dependent. At the same time, most available fish oil supplements are from over-the-counter and the levels of toxic substances in them are variable (Table 1). The benefits of fish oil supplementation outweigh the risks due to the pleiotropic effects of fish oils beyond the cardiovascular system These benefits warrant continued research on the actions of fish oils in various clinical phenotypes such as metabolic syndrome, hypertriglyceridemia and cardiovascular disease (Figure 1). Both medication, age and patient-related clinical factors can modify the responses and long-term value of fish oil supplementation for primary and secondary CVD prevention. No studies are known to date which have evaluated the aggregate clinical effects of each of these modifying factors. Patients who wish to take fish oil supplements for cardiovascular risk reduction can optimize the clinical effects of fish oils by following a heart healthy diet and participating in regular physical activity.


Table 1  Caveats with using fish oil supplements for cardiovascular disease prevention and treatment

Table 1: Caveats with using fish oil supplements for cardiovascular disease prevention and treatment


Figure 1  Potential Sites of Fish Oil Modification of Changes that Occur with Aging

Figure 1: Potential Sites of Fish Oil Modification of Changes that Occur with Aging


Acknowledgements: This work was supported by funds from: National Institute on Aging (NIA) grants: 5T32AG000219-19, Claude D. Pepper Older Americans Independence Center (P30 AG028747), NIDDK Mid-Atlantic Nutrition Obesity Research Center (NIH P30 DK072488); Department of Veterans Affairs and Veterans Affairs Medical Center Baltimore Geriatric Research, Education and Clinical Center (GRECC). Special thanks to Seth Crawford of the Baltimore VA Medical Media Service.

Conflict of interest: Author MM is a consultant and steering committee member of REDUCE-IT trial for Amarin.


References

1. Hansson GK. Inflammation, atherosclerosis, and coronary artery disease. N Engl J Med. 2005;352(16):1685-1695.

2. Lakka HM, Laaksonen DE, Lakka TA, et al. The metabolic syndrome and total and cardiovascular disease mortality in middle-aged men. JAMA. 2002;288(21):2709-2716.

3. Phillipson BE, Rothrock DW, Connor WE, Harris WS, Illingworth DR. Reduction of plasma lipids, lipoproteins, and apoproteins by dietary fish oils in patients with hypertriglyceridemia. N Engl J Med. 1985;312(19):1210-1216.

4. Wong AT, Chan DC, Barrett PH, Adams LA, Watts GF. Supplementation with n3 fatty acid ethyl esters increases large and small artery elasticity in obese adults on a weight loss diet. J Nutr. 2013;143(4):437-441.

5. Sinn N, Milte CM, Street SJ, et al. Effects of n-3 fatty acids, EPA v. DHA, on depressive symptoms, quality of life, memory and executive function in older adults with mild cognitive impairment: A 6-month randomised controlled trial. Br J Nutr. 2012;107(11):1682-1693.

6. Rondanelli M, Giacosa A, Opizzi A, et al. Effect of omega-3 fatty acids supplementation on depressive symptoms and on health-related quality of life in the treatment of elderly women with depression: A double-blind, placebo-controlled, randomized clinical trial. J Am Coll Nutr. 2010;29(1):55- 64.

7. Smith GI, Atherton P, Reeds DN, et al. Dietary omega-3 fatty acid supplementation increases the rate of muscle protein synthesis in older adults: A randomized controlled trial. Am J Clin Nutr. 2011;93(2):402-412.

8. Rodacki CL, Rodacki AL, Pereira G, et al. Fish-oil supplementation enhances the effects of strength training in elderly women. Am J Clin Nutr. 2012;95(2):428-436.

9. Djousse L, Gaziano JM, Buring JE, Lee IM. Dietary omega-3 fatty acids and fish consumption and risk of type 2 diabetes. Am J Clin Nutr. 2011;93(1):143- 150.

10. Rizos EC, Ntzani EE, Bika E, Kostapanos MS, Elisaf MS. Association between omega-3 fatty acid supplementation and risk of major cardiovascular disease events: A systematic review and meta-analysis. JAMA. 2012;308(10):1024- 1033.

11. Kwak SM, Myung SK, Lee YJ, Seo HG, Korean Meta-analysis Study Group. Efficacy of omega-3 fatty acid supplements (eicosapentaenoic acid and docosahexaenoic acid) in the secondary prevention of cardiovascular disease: A meta-analysis of randomized, double-blind, placebo-controlled trials. Arch Intern Med. 2012;172(9):686-694.

12. De Caterina R. N-3 fatty acids in cardiovascular disease. N Engl J Med. 2011;364(25):2439-2450.

13. Raatz SK, Redmon JB, Wimmergren N, Donadio JV, Bibus DM. Enhanced absorption of n-3 fatty acids from emulsified compared with encapsulated fish oil. J Am Diet Assoc. 2009;109(6):1076-1081.

14. Neubronner J, Schuchardt JP, Kressel G, Merkel M, von Schacky C, Hahn A. Enhanced increase of omega-3 index in response to long-term n-3 fatty acid supplementation from triacylglycerides versus ethyl esters. Eur J Clin Nutr. 2011;65(2):247-254.

15. Krauss RM, Eckel RH, Howard B, et al. AHA dietary guidelines: Revision 2000: A statement for healthcare professionals from the nutrition committee of the american heart association. Circulation. 2000;102(18):2284-2299.

16. Kris-Etherton PM, Harris WS, Appel LJ, AHA Nutrition Committee. American Heart Association. Omega-3 fatty acids and cardiovascular disease: New recommendations from the american heart association. Arterioscler Thromb Vasc Biol. 2003;23(2):151-152.

17. Flock MR, Harris WS, Kris-Etherton PM. Long-chain omega-3 fatty acids: Time to establish a dietary reference intake. Nutr Rev. 2013;71(10):692-707.

18. Browning LM, Walker CG, Mander AP, et al. Incorporation of eicosapentaenoic and docosahexaenoic acids into lipid pools when given as supplements providing doses equivalent to typical intakes of oily fish. Am J Clin Nutr. 2012;96(4):748-758.

19. Melanson SF, Lewandrowski EL, Flood JG, Lewandrowski KB. Measurement of organochlorines in commercial over-the-counter fish oil preparations: Implications for dietary and therapeutic recommendations for omega-3 fatty acids and a review of the literature. Arch Pathol Lab Med. 2005;129(1):74-77.

20. Guallar E, Sanz-Gallardo MI, van’t Veer P, et al. Mercury, fish oils, and the risk of myocardial infarction. N Engl J Med. 2002;347(22):1747-1754.

21. Wennberg M, Stromberg U, Bergdahl IA, et al. Myocardial infarction in relation to mercury and fatty acids from fish: A risk-benefit analysis based on pooled finnish and swedish data in men. Am J Clin Nutr. 2012;96(4):706-713.

22. Drabova L, Pulkrabova J, Kalachova K, Tomaniova M, Kocourek V, Hajslova J. Polycyclic aromatic hydrocarbons and halogenated persistent organic pollutants in canned fish and seafood products: Smoked versus non-smoked products. Food Addit Contam Part A Chem Anal Control Expo Risk Assess. 2013;30(3):515-527.

23. Ashley JT, Ward JS, Anderson CS, et al. Children’s daily exposure to polychlorinated biphenyls from dietary supplements containing fish oils. Food Addit Contam Part A Chem Anal Control Expo Risk Assess. 2013;30(3):506-514.

24. Harris WS. Expert opinion: Omega-3 fatty acids and bleeding-cause for concern? Am J Cardiol. 2007;99(6A):44C-46C.

25. Lev EI, Solodky A, Harel N, et al. Treatment of aspirin-resistant patients with omega-3 fatty acids versus aspirin dose escalation. J Am Coll Cardiol. 2010;55(2):114-121.

26. Doenyas-Barak K, Berman S, Abu-Hamad R, Golik A, Rahimi-Levene N, Efrati S. N-3 fatty acid supplementation to routine statin treatment inhibits platelet function, decreases patients’ daytime blood pressure, and improves inflammatory status. Eur J Clin Pharmacol. 2012;68(8):1139-1146.

27. Giltay EJ, Gooren LJ, Toorians AW, Katan MB, Zock PL. Docosahexaenoic acid concentrations are higher in women than in men because of estrogenic effects. Am J Clin Nutr. 2004;80(5):1167-1174.

28. Giltay EJ, Duschek EJ, Katan MB, Zock PL, Neele SJ, Netelenbos JC. Raloxifene and hormone replacement therapy increase arachidonic acid and docosahexaenoic acid levels in postmenopausal women. J Endocrinol. 2004;182(3):399-408.

29. Phang M, Lincz LF, Garg ML. Eicosapentaenoic and docosahexaenoic acid supplementations reduce platelet aggregation and hemostatic markers differentially in men and women. J Nutr. 2013;143(4):457-463.

30. Lee SH, Shin MJ, Kim JS, et al. Blood eicosapentaenoic acid and docosahexaenoic acid as predictors of all-cause mortality in patients with acute myocardial infarction–data from infarction prognosis study (IPS) registry. Circ J. 2009;73(12):2250-2257.

31. Lu Y, Vaarhorst A, Merry AH, et al. Markers of endogenous desaturase activity and risk of coronary heart disease in the CAREMA cohort study. PLoS One. 2012;7(7):e41681.

32. Simopoulos AP. Genetic variants in the metabolism of omega-6 and omega-3 fatty acids: Their role in the determination of nutritional requirements and chronic disease risk. Exp Biol Med (Maywood). 2010;235(7):785-795.

33. Samieri C, Sun Q, Townsend MK, et al. The association between dietary patterns at midlife and health in aging: An observational study. Ann Intern Med. 2013;159(9):584-591.

34. Estruch R, Ros E, Martinez-Gonzalez MA. Mediterranean diet for primary prevention of cardiovascular disease. N Engl J Med. 2013;369(7):676-677.

35. Dengel JL, Katzel LI, Goldberg AP. Effect of an american heart association diet, with or without weight loss, on lipids in obese middle-aged and older men. Am J Clin Nutr. 1995;62(4):715-721.

36. Nicklas BJ, Katzel LI, Bunyard LB, Dennis KE, Goldberg AP. Effects of an american heart association diet and weight loss on lipoprotein lipids in obese, postmenopausal women. Am J Clin Nutr. 1997;66(4):853-859.

37. Muldoon MF, Erickson KI, Goodpaster BH, et al. Concurrent physical activity modifies the association between n3 long-chain fatty acids and cardiometabolic risk in midlife adults. J Nutr. 2013;143(9):1414-1420.

38. Miller M, Cannon CP, Murphy SA, et al. Impact of triglyceride levels beyond low-density lipoprotein cholesterol after acute coronary syndrome in the PROVE IT-TIMI 22 trial. J Am Coll Cardiol. 2008;51(7):724-730.