I. Nakamura1,2, T. Yoshida1, H. Kumagai1
1. Department of Clinical Nutrition, School of Food and Nutritional Sciences, University of Shizuoka, Shizuoka, Japan; 2. Division of Home Care Service, Fukuoka Clinic, Tokyo, Japan
Corresponding Author: Hiromichi Kumagai M.D. Professor, Department of Clinical Nutrition, School of Food and Nutritional Sciences, University of Shizuoka, 52-1 Yada, Shizuoka 422-8526, Japan, Fax & phone: +81-54-264-5567, E-mail: kumagai@u-shizuoka-ken.ac.jp
J Aging Res Clin Practice 2017;6:210-216
Published online October 5, 2017, http://dx.doi.org/10.14283/jarcp.2017.28
Abstract
Objectives: The Mini-Nutritional Assessment Short Form (MNA-SF) may be insufficient for screening and assessing the nutritional status of community-dwelling older adults. We modified MNA-SF to improve the ability for discriminating those at risk of malnutrition. Setting and participants: 123 community-dwelling elderly Japanese. Methods: Nutritional status was examined by the subjective global assessment (SGA), the geriatric nutritional risk index (GNRI) and MNA-SF. The reference standard for the diagnosis of “at risk of malnutrition” was composed from the SGA and GNRI. Specific factors associated with malnutrition in community-dwelling older adults were extracted from a literature survey and classified by a principal component analysis. A new 8-item MNA-home was constructed by adding two items from these components to the MNA-SF and compared with the MNA-SF by applying a receiver operating characteristic (ROC) curve. Results: Among the various potential MNA-home scores, the ROC curve revealed that the MNA-SF plus two items, namely an inability to prepare own meals and no motivation to go out, produced the largest area under the curve (AUC), this value being greater than that from the MNA-SF. The score of MNA-home was significantly correlated with serum albumin and hemoglobin, although the score of MNA-SF was not. The cutoff value for predicting at risk of malnutrition was <14 in the MNA-home. Conclusion: The new MNA-home had a better discriminating ability than the MNA-SF to identify those at risk of malnutrition in community-dwelling older adults. A subsequent long-term study is necessary to validate this MNA-home for correctly discriminating community-dwelling older adults at risk of malnutrition.
Key words: Malnutrition, elderly, mini nutritional assessment, home care.
Introduction
The number of people aged 65 and over in Japan has been increasing for the recent 20 years, resulting in the pace of aging being the highest among any other country in the world (1). The rising medical cost caused by this increase of elderly people prompted the Japanese government to develop a policy of substituting a long hospital stay by a community-based service. This policy has been achieved by long-term care insurance (LTCI) that was introduced in 2000 to support the elderly population by integrating health care services and social support services (2). However, a number of problem has become apparent since this long-term care system was introduced. First, many elderly people are insisting to return to their homes without satisfactory health care support. Second, the main caregivers have been family members, and there are consequently a considerable number of cases of care for the elderly by the elderly. Third, the number of elderly living alone has been increased to 11% for males and 20% for females (1). Among these people living alone, many have limited contact with other people or have no person that they can rely on.
It had been thought that community-dwelling elderly people do not tend to be malnourished when compared with other situations. A meta-analysis has shown that the prevalence of malnutrition or at risk of malnutrition was 37.7% when evaluated by the Mini-Nutritional Assessment (MNA) in community dwellers with a mean age of 79.3 yrs (3). This percentage of malnutrition or at risk of malnutrition is much lower than that for elderly in hospitals (86.0%), nursing homes (67.2%) or rehabilitation (91.7%) settings for a similar age. In Japan, however, the prevalence of a poor nutritional status is more common, as 60-72% of the elderly living in a community setting have suffered from malnutrition or at-risk of malnutrition (4-6). The factors associated with malnutrition in the community-living elderly were similar but not equal to those living in hospitals and nursing homes. The conditions of physical health, comorbidity, anorexia and psychological problems seem to be most common causes of malnutrition for both community-dwelling and institutionalized elderly. However, the community-dwelling elderly have other specific problems associated with daily living at home, including food insecurity, human relationships, psychiatric problems and inadequate care (7-14). These circumstances are resulting in increasing demands for nutritional screening and assessment in community-dwelling elderly.
The MNA is a tool specifically developed for assessing the nutritional status of elderly people (15-16). The MNA comprises 18 items presenting an anthropometric assessment, general assessment, dietary assessment and subjective assessment, and the first six items have been used for screening people with undernutrition as the MNA-short form (SF) (17). This MNA-SF was revised in 2009 and proposed as a stand-alone nutritional screening tool by adapting three categories of nutritional classification: well-nourished, at risk of malnutrition and malnutrition (18). While MNA-SF was developed in Western countries for assessing nursing home and hospital-bound elderly people, it has been accepted that a revised MNA-SF can be applicable to a population of community-dwelling elderly (19) and can also be used in Japan (20) and Taiwan (21) by modifying its cutoff point.
However, MNA-SF does not include items related to the foregoing nutritional risks in community-dwelling elderly people. If MNA-SF were to be further modified by incorporating these specific nutritional risks, the discriminating ability for those at risk of malnutrition by this nutritional screening tool may be increased. We attempt in the present study to modify the MNA-SF by including two new items associated with the specific nutritional risks encountered by community-dwelling older adults.
Methods
Subjects
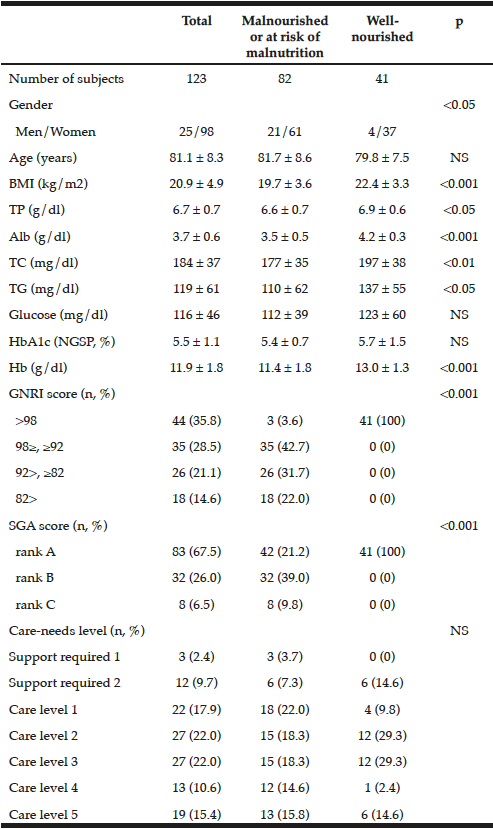
One hundred and twenty-nine community-dwelling elderly Japanese living in Tokyo, Shizuoka and Kochi prefectures (26 men and 103 women; age 81.0 ± 8.3 yr, range 60 – 98 yr) were enrolled in this study. Any subjects diagnosed with acute infection, cancer or renal failure and those who could not take food by the mouth were excluded from the study (n=6). The remaining 123 subjects were eligible for the analysis (Table 1). All the subjects have been receiving various home care services based on public LTCI. Their care needs were graded into seven levels (support level 1, support level 2, care level 1, care level 2, care level 3, care level 4 and care level 5). The study protocol was approved by the ethics committee of the University of Shizuoka. Written consent was obtained from all participants or their legal proxies.
Data are expressed as the mean±SD. Nutritional status was determined by the joint criterion made from GNRI and SGA.
Anthropometric and serum biochemical measurements
Weight and height were measured for calculating the body mass index (BMI, kg/m2). The weight (kg) was measured with a portable digital scale and the height (m) was measured by a portable stadiometer. Those subjects who could not stand up were measured for their recumbent length by a steel measuring tape between two plates placed against the heel and the top of the head (22). The self-reported height was also used in some cases (22).
A blood sample was taken from each subject at the regular health check, and serum albumin was measured for calculating the geriatric nutritional risk index (GNRI)
Nutritional assessment
Subjective global assessment (SGA), GNRI and MNA-SF were examined in all participants. SGA is a valid nutritional assessment tool that has been found to be highly predictive of the nutrition-associated clinical outcome (23). The SGA grade was classified into three levels on the basis of the subject’s history and physical examination: level A, well-nourished; level B, moderately malnourished; level C, severely malnourished.
GNRI is a very simple and objective method for screening the nutritional status of elderly people (24). It can be calculated by a simple equation in which only three nutritional variables, serum albumin, actual body weight and ideal body weight, are used:
GNRI = [1.489×albumin (g/L)] + [41.7×(weight/ideal weight)]
The weight/ideal weight term is set to unity (1) when the weight exceeds the ideal weight in this equation. These GNRI values were applied to define four grades of nutritional level in the present study, similar to the original classification: level 1, no risk of malnutrition (GNRI >98); level 2, low risk of malnutrition (GNRI 92 to ≤98); level 3, moderate risk of malnutrition (GNRI 82 to <92); level 4, major risk of malnutrition (GNRI <82).
MNA-SF has also proven to be a simple, non-invasive and valid screening tool for malnutrition in elderly people (17-19). It comprises six questions chosen from the long form of MNA for identifying individuals at risk of malnutrition. The maximum possible score of the MNA-SF assessment is 14. The cutoff point for being at risk of malnutrition might be different between Western and Asian populations.
These nutritional assessments were performed by one well-trained dietitian.
Factors associated with malnutrition in community-dwelling older adults
A systematic literature search was performed to identify all relevant articles in which the specific factors associated with malnutrition in elderly community-dwelling subjects were included. The bibliographic databases, PubMed and Igaku Chuo Zasshi, were searched from their inception to October 31, 2015. Search terms expressing “malnutrition” were used in combination with search terms for “community-dwelling and home-bound elderly”. The references of the identified articles written in English and Japanese were searched for relevant publications.
Nine items associated with malnutrition in community-dwelling elderly people were found in these references, after excluding items included in the questions of the original MNA-SF. These nine items were 1) inability to obtain preferred foods(7, 8), 2) no helper to cook meals (7, 8), 3) inability to prepare own meals (7, 8), 4) no person to eat with (8), 5) feeling of isolation (9), 6) no motivation to go out (10), 7) low income (11-13), 8) insufficient care by caregivers (11, 14), and 9) long distance to grocery stores (8).
The participants were interviewed by using an interview form containing these 9-item questions. The answers were selected according to three scales: 1, always; 2, sometimes; 3, never or 1, agree; 2, neutral; 3, disagree.
The development of the MNA-home and statistical analyses
A principal component analysis was performed to classify these nine new items associated with malnutrition in community-dwelling elderly people. The number of components was determined by considering the eigenvalues, scree test and their interpretability.
We chose to develop a new nutritional screening tool called MNA-home to identify those subjects most at risk of malnutrition among the community-dwelling elderly by modifying the MNA-SF. Two or three items were chosen from the results of the principal component analysis and added to the MNA-SF. Each item was chosen from the components elicited from the principal component analysis.
A receiver operating characteristic (ROC) curve was generated for various MNA-home candidates to find the best combination of items added to the MNA-SF. The reference standard was created from the combination of SGA, a subjective nutritional assessment, and GNRI, an objective nutritional risk assessment. Since the MNA-home would be a nutritional screening tool capable of identifying community-dwelling elderly at risk of malnutrition, the community-dwelling elderly at risk of malnutrition in the reference standard was defined to include either the SGA grade of levels B and C or the GNRI grade of levels 2, 3 and 4 (the joint criterion by GNRI and SGA). The area under the curve (AUC) for ROC indicates the probability of discriminating a nutritional risk. Various potential MNA-home candidates incorporating several new items were examined in the ROC curve, and one of them with the largest AUC value was finally selected as the MNA-home. The cutoff risk point for nutrition was determined by using the ROC curve. The sensitivity, specificity, accuracy, Youden index (YI, sensitivity + specificity – 1), positive predictive value (PPV) and negative predictive value (NPV) were calculated at various threshold values for both MNA-SF and MNA-home by comparing with the reference standard.
Each variable is presented as the mean ± SD. Differences between groups were determined by an analysis of variance or the chi-squared test. The validity of MNA-home was evaluated by comparing the correlation between the anthropometric and biochemical nutritional variables and MNA-home or MNA-SF, using Spearman’s correlation coefficient. A p-value of less than 0.05 was considered statistically significant. All statistical analyses were performed by SPSS ver. 20 (IBM, Tokyo, Japan).
Results
The participants were classified into two groups according to the joint criterion made from SGA and GNRI; community-dwelling elderly with good nutrition and those with malnutrition or at risk of malnutrition (Table 1). Most of the individual variables, including the anthropometric and biochemical variables, were significantly lower in the subjects with malnutrition or those at risk of malnutrition. Furthermore, the values for BMI, serum albumin, total cholesterol and hemoglobin in the subjects with malnutrition or those at risk of malnutrition suggest that this classification was reasonable as a reference standard for evaluating the MNA-home in this study.
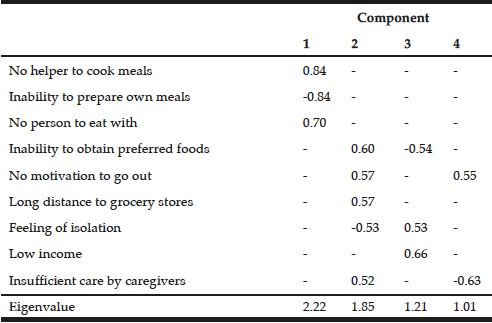
Table 2
Classification of factors associated with malnutrition in community-dwelling elderly people by a principal component analysis
These nine items associated with malnutrition in community-dwelling elderly people were found by the reference survey. A coefficient less than ±0.5 is represented by a dash for simplicity.
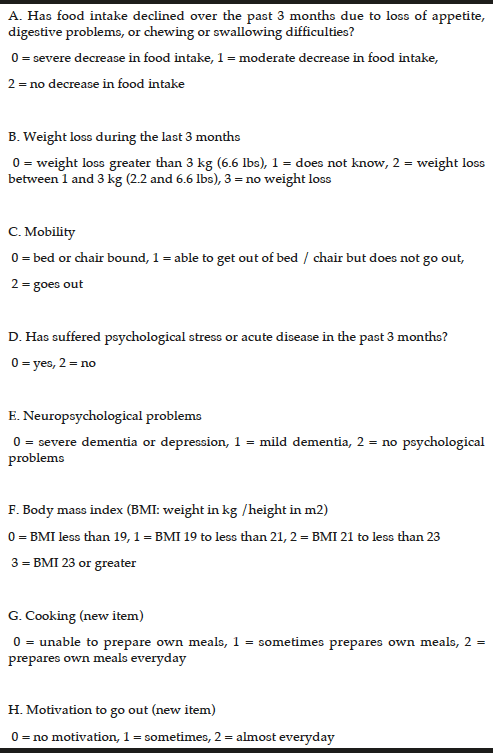
The principal component analysis demonstrated that the nine items specifically associated with malnutrition in community-dwelling elderly people could be classified into four components (Table 2). Since the scree plot showed that the eigenvalue of the first two components was relatively high, the potential MNA-home scores were selected as MNA-SF supplemented with two items chosen from these factors, each item being chosen from different components. Among these potential MNA-home scores, the ROC curve analysis revealed that MNA-SF plus 2 items, “inability to prepare own meals” and “no motivation to go out”, had the largest AUC value when the above-mentioned reference standard was applied, this AUC value being larger than that of MNA-SF (Fig. 1). This result suggested that the new 8-item MNA-home score (Table 3) would offer better ability to identify the nutritional risk in community-dwelling elderly people than the MNA-SF.
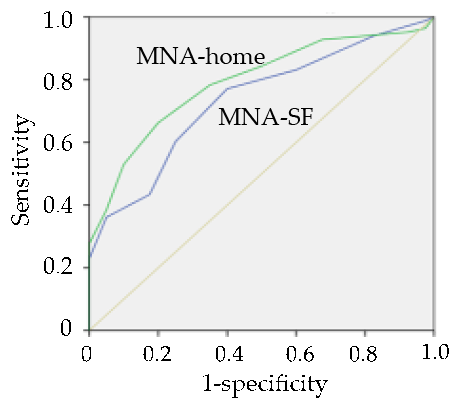
Figure 1
Receiver operating characteristic (ROC) curve for the MNA-SF and MNA-home as compared with the joint criterion for being at risk of malnutrition made from GNRI and SGA. Areas under the curve were 0.795 for MNA-home (green line) and 0.744 for MNA-SF (blue line)
The various cutoff points for discriminating those elderly persons at risk of malnutrition were derived from these ROC curves of MNA-home and MNA-SF (Table 4). The sensitivity, specificity, accuracy, YI, PPV and NPV data were compared between various threshold values for both MNA scores in predicting those at risk of malnutrition evaluated from the joint criterion by SGA and GNRI. Since both the MNA-SF and MNA-home would be used as nutritional screening tools, high sensitivity was given priority over high specificity. The cutoff values for predicting those at risk of malnutrition were considered best with 12 points in the MNA-SF and 14 points in MNA-home. This means that the elderly who scored less than 12 in the MNA-SF or less than 14 in the MNA-home would be considered at risk of malnutrition.
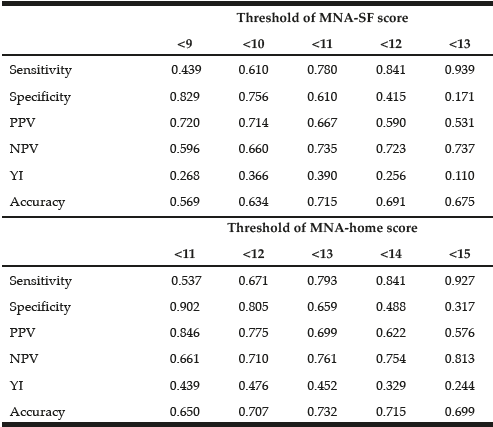
Table 4
Diagnostic characteristics of MNA-SF and MNA-home for being at risk of malnutrition relative to the joint criterion by GNRI and SGA
PPV, positive predictive value; NPV, negative predictive value; YI, Youden index.
The Spearman correlation coefficients (r) of the score for each MNA with age, BMI and nutritional-related biochemical variables were compared between the MNA-SF and the MNA-home (Table 5). The score for MNA-home was significantly correlated with serum albumin and hemoglobin, while the score for MNA-SF was not correlated with these values.
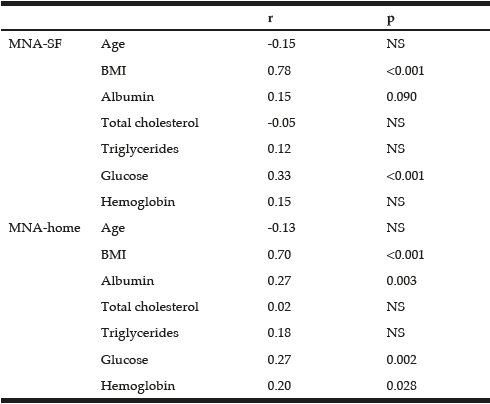
Table 5
Spearman correlation coefficients of MNA-SF or MNA-home with age, BMI and nutritional-related biochemical variables
P-values less than 0.1 are shown in this table.
Discussion
We developed in the present study a modified MNA-SF named MNA-home for Japanese community-dwelling elderly by adding two items to the original MNA-SF. This new 8-item MNA-home had higher discriminating ability for the community-dwelling elderly at risk of malnutrition than MNA-SF when the reference standard of “at risk of malnutrition” was determined by the combination of SGA and GNRI.
There is no accepted standard for the nutritional assessment of community-dwelling elderly people, so we merged the results of SGA and GNRI to devise a reference standard for those at risk of malnutrition. We consider elderly people to be at risk of malnutrition if either the SGA grade was at level B or C, or the GNRI grade was at level 2, 3 or 4 (GNRI≤98). This method is similar to that previously suggested by Pablo et al. (25) and Poulia et al. (26). SGA includes information on weight loss, a change in dietary intake, symptoms from the gastrointestinal tract and functional capacity, all of which were evaluated by the subjective assessment. SGA has been proven to be a reliable way for estimating a nutrition-related clinical outcome. Recent literature has demonstrated SGA to be a similar or superior tool for nutritional diagnosis in both surgical and clinical patients when compared with anthropometric and laboratory data analyses (27). Other instruments, however, might be as capable as or more capable than SGA as a screening tool in detecting important changes in nutritional status related to the occurrence of a worsening clinical outcome (27). On the other hand, GNRI has been calculated only from objective information, including body weight, height and serum albumin (24), and has been proposed and investigated for predicting nutrition-related complications (28). We therefore presume the combination of SGA and GNRI to be a better reference of nutritional status than each separate tool that may be associated with the clinical outcome. We did not use the full version of MNA as a reference standard because it has similar problems, as MNA-SF does not include the nutritional issues that are specifically associated with community-dwelling elderly people.
Two items, “inability to prepare own meals” and “no motivation to go out”, that were added to MNF-SF were chosen by the principal component analysis from nine items that might potentially be associated with malnutrition in community-dwelling elderly people. These 9 items, namely an inability to obtain preferred foods, no helper to cook meals, inability to prepare own meals, no person to eat with, feeling of isolation, no motivation to go out, low income to buy sufficient foods, insufficient care service, long distance to grocery stores, do not seem to be specific to Japanese community-dwelling elderly persons, and are also common among the elderly living in westernized countries, where the number of elderly living alone in the community has been increasing during the most recent one or two decades (29). The two chosen and added items are considered reasonable in the case of community-dwelling elderly people from the author’s perspective as a home-visiting dietitian. The ability to prepare own meals is essential for the community-dwelling elderly persons for survival or maintaining a favorable nutritional status in cases of the meal delivery service or home-cooking service by helpers not being fully developed. Furthermore, no motivation to go out implies social withdrawal and isolation which may be one of the symptoms of depression and has been recognized to be associated with the development of malnutrition (10).
The MNA-home has been developed for screening community-dwelling elderly persons at risk of malnutrition. This nutritional screening tool is intended for use by health-care professionals like public health nurses and dietitians when they visit the elderly at home. It therefore needs to be easily applied, and sensitivity should be given priority over specificity since more detailed nutritional assessment will follow. In this respect, it was appropriate for the optimal cutoff points for MNA-SF and MNA-home as nutritional screening tools to respectively be 12 and 14, whereas the accuracy of these cutoff points was one step lower than each maximal value.
We finally compared the predictive ability of both the MNA-SF and MNA-home for age, BMI and nutritional-related biochemical variables, since these parameters have been widely used to evaluate nutritional status. The result that the MNA-home only showed a significant correlation with serum albumin and hemoglobin suggests that MNA-home would offer more ability to predict malnutrition than MNA-SF.
Modifying MNA or adjusting the cut-off point has been attempted to improve the discriminating ability to find subjects with malnutrition or those at risk of malnutrition. Since the MNA was created and developed in Western countries, such a method and the selected cut-off points might not be applicable to Asian populations without any change because of cultural and anthropometric differences between them. Minor modification or adjustment has been therefore attempted to make the original MNA applicable to an Asian population (20, 21). However, our modification from MNA-SF to MNA-home in the present study was intended to correct the missing aspects of the MNA-SF, especially for community-dwelling elderly persons, so that this modification might also be useful in Western countries.
There are some limitations to the results of the present study. First, the sample was small and the subjects were only recruited from three areas of Japan. Since the life style, dietary habits, comorbidity and public service for the community-dwelling elderly are different between regions, the results might be flawed by potential sampling bias. However, the mean ± SD value of MNA-SF was 9.4 ± 2.4, and the prevalence of being at risk of malnutrition and being malnourished was almost the same at 65.0% by MNA-SF and 64.2% by MNA-home, similar to the results of other previous studies on Japanese community-dwelling elderly people (4-6). It was also anticipated that the present study would help to develop the MNA-home by a cross-sectional design. A long-term follow-up study investigating mortality, morbidity or hospitalization is necessary to examine whether the MNA-home is really useful for identifying elderly persons at risk of malnutrition.
In conclusion, we have developed the MNA-home from MNA-SF by adding two items which are closely associated with the nutritional disturbance occurring to community-dwelling elderly people. The MNA-home has better discriminating ability to identify the elderly at risk of malnutrition than the MNA-SF in the population studied. This modification enables dietitians or nurses to more accurately screen elderly persons at risk of malnutrition in a home-care setting. A subsequent study is necessary to validate this MNA-home for correctly discriminating those at risk of malnutrition in any community-dwelling elderly population worldwide.
Conflict of interest: The authors have no conflict interest to declare.
Acknowledgments: The authors thank Dr. Akira Ohi, Dr. Tatsuo Ohishi and all of the community-care dietitians and nurses who collaborated in this study.
Ethical standards: This research was carried out in accordance with the Declaration of Helsinki of the World Medical Association and received ethical approval from the ethics committee of the University of Shizuoka.
References
1. Annual report on the aging society FY 2014. Cabinet office, Government of Japan. 2014, at http://www8.cao.go.jp/kourei/english/annualreport/2014/2014pdf_e.html.
2. Campbell JC, Ikegami N. Long-term care insurance comes to Japan. Health Aff (Millwood). 2000; 19: 26-39.
3. Kaiser MJ, Bauer JM, Rämsch C, Uter W, Guigoz Y, Cederholm T, Thomas DR, Anthony PS, Charlton KE, Maggio M, Tsai AC, Vellas B, Sieber CC; Mini Nutritional Assessment International Group. Frequency of malnutrition in older adults: a multinational perspective using the mini nutritional assessment. J Am Geriatr Soc. 2010; 58: 1734-8.
4. Izawa S, Kuzuya M, Okada K, Enoki H, Koike T, Kanda S, Iguchi A. The nutritional status of frail elderly with care needs according to the mini-nutritional assessment. Clin Nutr. 2006; 25: 962-7.
5. Enoki H, Sugiyama M, Izawa S, Hirose T, Hasegawa J, Iguchi A, Kuzuya M. Factors associated with malnutrition in community-dwelling disabled elderly–the KANAGAWA-AICHI Disabled Elderly Cohort (KAIDEC) Study. Nihon Ronen Igakkai Zasshi. 2014; 51: 547-53 (in Japanese).
6. Morisaki N, Miura H, Hara S. Relationship between the nutritional status and the oral function among community-dwelling dependent elderly persons. Nihon Ronen Igakkai Zasshi. 2015; 52: 233-42 (in Japanese).
7. Iizaka S, Tadaka E, Sanada H. Comprehensive assessment of nutritional status and associated factors in the healthy, community-dwelling elderly. Geriatr Gerontol Int. 2008; 8: 24-31.
8. Keller HH, Goy R, Kane SL. Validity and reliability of SCREEN II (Seniors in the community: risk evaluation for eating and nutrition, Version II). Eur J Clin Nutr. 2005; 59: 1149-57.
9. Ferry M, Sidobre B, Lambertin A, Barberger-Gateau P. The SOLINUT study: analysis of the interaction between nutrition and loneliness in persons aged over 70 years. J Nutr Health Aging. 2005; 9: 261-8.
10. Boulos C, Salameh P, Barberger-Gateau P. Malnutrition and frailty in community dwelling older adults living in a rural setting. Clin Nutr. 2016; 35: 138-43.
11. Locher JL, Ritchie CS, Robinson CO, Roth DL, Smith West D, Burgio KL. A multidimensional approach to understanding under-eating in homebound older adults: the importance of social factors. Gerontologist. 2008; 48: 223-34.
12. Quine S, Morrell S. Food insecurity in community-dwelling older Australians. Public Health Nutr. 2006; 9: 219-24.
13. Tamiya N, Kobayashi Y, Murakami S, Sasaki J, Yoshizawa K, Otaki J, Kano K. Factors related to home discharge of cerebrovascular disease patients: 1-year follow-up interview survey of caregivers of hospitalized patients in 53 acute care hospitals in Japan. Arch Gerontol Geriatr. 2001; 33: 109-21.
14. Oyama Y, Tamiya N, Kashiwagi M, Sato M, Ohwaki K, Yano E. Factors that allow elderly individuals to stay at home with their families using the Japanese long-term care insurance system. Geriatr Gerontol Int. 2013; 13: 764-73.
15. Guigoz Y, Vellas B, Garry PJ. Assessing the nutritional status of the elderly: The Mini Nutritional Assessment as part of the geriatric evaluation. Nutr Rev. 1996; 54: S59-65.
16. Guigoz Y. The Mini Nutritional Assessment (MNA) review of the literature–What does it tell us? J Nutr Health Aging. 2006; 10: 466-85.
17. Rubenstein LZ, Harker JO, Salvà A, Guigoz Y, Vellas B. Screening for undernutrition in geriatric practice: developing the short-form mini-nutritional assessment (MNA-SF). J Gerontol A Biol Sci Med Sci. 2001; 56: M366-72.
18. Kaiser MJ, Bauer JM, Ramsch C, Uter W, Guigoz Y, Cederholm T, Thomas DR, Anthony P, Charlton KE, Maggio M, Tsai AC, Grathwohl D, Vellas B, Sieber CC; MNA-International Group. Validation of the Mini Nutritional Assessment short-form (MNA-SF): a practical tool for identification of nutritional status. J Nutr Health Aging. 2009; 13: 782-8.
19. Kaiser MJ, Bauer JM, Uter W, Donini LM, Stange I, Volkert D, Diekmann R, Drey M, Bollwein J, Tempera S, Guerra A, Ricciardi LM, Sieber CC. Prospective validation of the modified mini nutritional assessment short-forms in the community, nursing home, and rehabilitation setting. J Am Geriatr Soc. 2011; 59: 2124-8.
20. Kuzuya M, Kanda S, Koike T, Suzuki Y, Satake S, Iguchi A. Evaluation of Mini-Nutritional Assessment for Japanese frail elderly. Nutrition. 2005; 21: 498-503.
21. Tsai AC, Chang TL, Chen JT, Yang TW. Population-specific modifications of the short-form Mini Nutritional Assessment and Malnutrition Universal Screening Tool for elderly Taiwanese. Int J Nurs Stud. 2009; 46: 1431-8.
22. Frid H, Adolfsson ET, Rosenblad A, Nydahl M. Agreement between different methods of measuring height in elderly patients. J Hum Nutr Diet. 2013; 26: 504-11.
23. Detsky AS, McLaughlin JR, Baker JP, Johnston N, Whittaker S, Mendelson RA, Jeejeebhoy KN. What is subjective global assessment of nutritional status? JPEN J Parenter Enteral Nutr. 1987; 11: 8-13.
24. Bouillanne O, Morineau G, Dupont C, Coulombel I, Vincent JP, Nicolis I, Benazeth S, Cynober L, Aussel C. Geriatric Nutritional Risk Index: a new index for evaluating at-risk elderly medical patients. Am J Clin Nutr. 2005; 82: 777-83.
25. Pablo AM, Izaga MA, Alday LA. Assessment of nutritional status on hospital admission: nutritional scores. Eur J Clin Nutr. 2003; 57: 824-31.
26. Poulia KA, Yannakoulia M, Karageorgou D, Gamaletsou M, Panagiotakos DB, Sipsas NV, Zampelas A. Evaluation of the efficacy of six nutritional screening tools to predict malnutrition in the elderly. Clin Nutr. 2012; 31: 378-85.
27. da Silva Fink J, Daniel de Mello P, Daniel de Mello E. Subjective global assessment of nutritional status – A systematic review of the literature. Clin Nutr. 2015; 34: 785-92.
28. Cereda E, Pusani C, Limonta D, Vanotti A. The ability of the Geriatric Nutritional Risk Index to assess the nutritional status and predict the outcome of home-care resident elderly: a comparison with the Mini Nutritional Assessment. Br J Nutr. 2009; 102: 563-70.
29. Health Quality Ontario. Social isolation in community-dwelling seniors: an evidence-based analysis. Ont Health Technol Assess Ser. 2008; 8: 1-49.

