jarlife journal
Sample text

AND option

OR option

FACTORS ASSOCIATED WITH DIMINISHED COUGH INTENSITY IN COMMUNITY-DWELLING ELDERLY USING DAY CARE SERVICES: A PILOT STUDY


R. Mikiya1, C. Momoki2, D. Habu3


1. Department of Physical Therapy, Faculty of Health Sciences, Morinomiya University of Medical Sciences, Suminoe-ku, Osaka-shi, Osaka, Japan; 2. Department of Food and Nutrition, Faculty of Contemporary Human Life Science, Tezukayama University, Nara-shi, Nara, Japan ; 3. Department of Medical Nutrition, Graduate School of Life Science, Osaka City University, , Sumiyoshi-ku Osaka-shi, Osaka, Japan

Corresponding Author: Ryosuke Mikiya, Department of Physical Therapy, Faculty of Health Sciences, Morinomiya University of Medical Sciences, 1-26-16 Nankokita, Suminoe-ku, Osaka-shi, Osaka 559-8611, Japan, Email: mikiya@morinomiya-u.ac.jp (06-6616-6911, FAX06-6616-6912)
J Aging Res Clin Practice 2019;8:57-62
Published online July  10, 2019, http://dx.doi.org/10.14283/jarcp.2019.10


Abstract

Purpose: We investigated factors affecting diminished cough intensity in community-dwelling elderly using day care services. Participants and Methods: A total of 61 elderly males and females aged ≥65 years who were certified to receive long-term adult day care services were enrolled in this study. Assessments included: Cough intensity (assessed using cough peak flow measurements, as well as possible determinants of cough intensity, lifestyle, and demographic characteristics), nutritional status (using the Mini Nutritional Assessment-Short Form), dietary intake (using the Dietary Variety Score), routine activity (using the Japanese version of the International Physical Activity Questionnaire), care-related factors (including day care services utilization and an oral exercise regimen) as well as age, need for long-term care, gender, sarcopenia status, the Charlson Comorbidity Index, and body mass, limb skeletal mass, and respiratory indices. Results: A reduced cough peak flow (odds ratio 4.46, 95% confidence interval: 1.08–18.43) was associated with sarcopenia and was weakly (not significantly) associated with age, gender, and the Mini Nutritional Assessment-Short Form score. Conclusion: A reduced cough peak flow was independently associated with sarcopenia and associated with age, gender, and nutritional status.

Key words:  Elderly, cough intensity, sarcopenia.


Introduction

Dysphagia is associated with diminished cough intensity (assessed using cough peak flow [CPF] measurements) and impaired airway clearance. Such individuals are predisposed to aspiration pneumonia (1). A study performed by Bach et al. showed that in patients with a neuromuscular disorder who show CPF ≤270 L/min, inadequate expectoration of sputum could cause respiratory insufficiency (2). Previous studies have reported that a reduced CPF in elderly is associated with age, lifestyle, and the maximal inspiratory pressure (MIP) (3, 4). Kim et al. reported that age-related reduction in routine activity accelerates respiratory muscle weakness (5). Expiratory muscle weakness causes generation of inadequate pleural pressure during coughing, thereby reducing the expiratory flow rate. This diminishes the cough intensity in elderly and can predispose these individuals to respiratory diseases.
Sarcopenia is an age-related reduction in muscle strength associated with reduced activity and loss of skeletal muscle mass. Recently, sarcopenia has gained attention as a major factor causing frailty in the elderly. The reduction in muscle mass in patients with sarcopenia can occur even in the respiratory muscles; thus, elderly with sarcopenia demonstrate decreased respiratory muscle strength and endurance (6). Sarcopenia is primarily an age-related condition; however, disuse atrophy secondary to malnutrition and reduced physical activity and disease-induced cachexia can cause sarcopenia (7-9). A study has reported that the prevalence of sarcopenia in elderly Japanese (aged ≥65 years) is approximately 20% for both males and females (10). Thus, a significant number of community-dwelling elderly may have sarcopenia and diminished cough intensity. Previous studies (5, 6) have reported that sarcopenia may be closely associated with a reduced CPF secondary to respiratory muscle weakness.
Adult day care service (day care) in Japan is a system in which community-dwelling elderly with diminished physical or cognitive function who are certified as needing support or long-term care visit facilities specified by ordinances of the Ministry of Health, Labor, and Welfare or day care centers catering to elderly. These facilities provide assistance with bathing, toileting, eating, and other routine activities, as well as functional training to such individuals. An individual must have a formal certification of their need for long-term care in order to avail themselves of the day care services under long-term care insurance. A few studies have identified an association between CPF and respiratory function in community-dwelling elderly who are certified as needing support or long-term care and who use day care services. However, no studies have examined the multifaceted effects of lifestyle (including physical activity and nutritional status) and baseline physical characteristics (age, gender, and body composition) on CPF. Thus, we investigated the effect of the aforementioned factors on the CPF in elderly who are certified as needing support or long-term care and who avail themselves of day care services.


Participants and methods

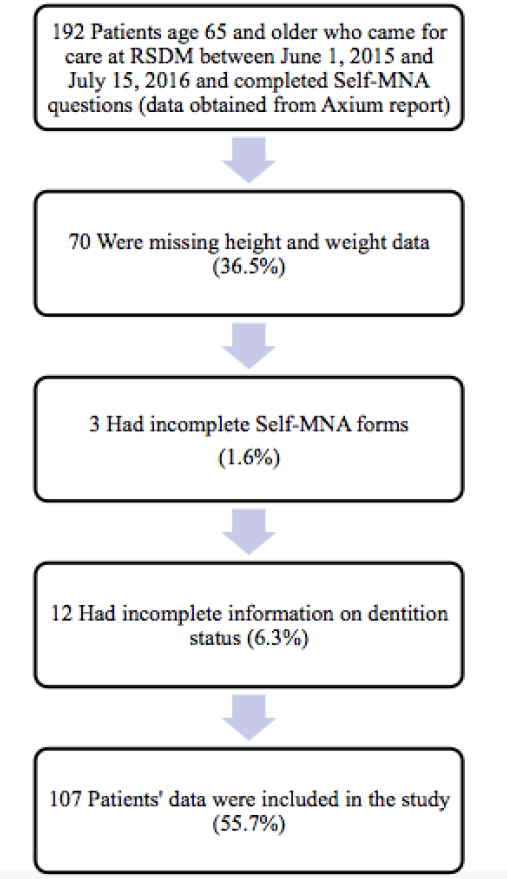
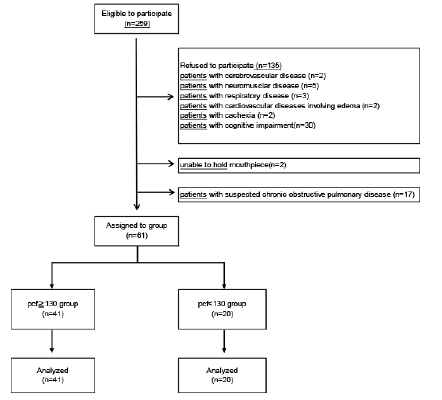
This study is a cross-sectional research design. We investigated 259 elderly who were certified as needing support or long-term care and who used day care services across 4 adult day care centers. The purpose of this study was well explained to potential participants prior to enrollment, and 61 elderly aged ≥65 years (15 males, 46 females) provided written consent to participate in this study. The mean age of participants was 80.4 (±6.2) years. Individuals with cerebrovascular, neuromuscular, respiratory, or cardiovascular disorders with pedal edema, those with cancer or any other condition causing cachexia, individuals previously diagnosed with dementia, and those who were unable to appropriately use the mouthpiece of the spirometer were excluded from the study. Additionally, individuals with a forced expiratory volume <70% in 1 s (based on spirometry evaluation) with suspected chronic obstructive pulmonary disease (COPD) were excluded (Fig. 1).

Figure 1 Study participants flow

Figure 1
Study participants flow


CPF was used as an indicator of voluntary cough intensity. CPF was ranked in tertile, with a flow rate ≥130 L/min indicating a high CPF and a flow rate <130 L/min indicating a low CPF. CPF was measured with a spirometer (Autospiro AS-507, Minato Medical Science, Co., LTD, Osaka, Japan). CPF evaluation was performed with all participants seated in an upright position. Each participant was instructed to firmly hold the mouthpiece to their lips and cheeks to prevent air from escaping, and a nose clip was used to prevent the escape of air from the nose. After participants had attained their maximal inspiratory level, they were instructed to cough thrice, and the maximum value was used. Additionally, respiratory function indices such as the forced vital capacity (FVC) were assessed. A respiratory dynamometer was connected to the aforementioned device, and the maximal expiratory pressure (MEP) and the MIP were measured thrice, and the maximum value recorded during the 3 attempts was used. A previous study has reported the usefulness of the Mini Nutritional Assessment (MNA) instrument to assess nutritional status, particularly in elderly (11). The MNA is an effective screening tool for nutritional status assessment, and the short form of the MNA (MNA-SF) includes the first 6 items present in the MNA (diminished food intake over the past 3 months, weight loss over the past 3 months, mobility, the presence or absence of psychological problems, body mass index (BMI), and calf circumference). A previous study has reported the usefulness of the MNA-SF (12). In the current study, the MNA-SF was used as a screening tool for nutritional status assessment. Participants were divided into 2 groups—adequately nourished individuals (MNA-SF score ≥12 points) and those at risk of being malnourished (MNA-SF score ≤11 points). The Dietary Variety Score (DVS) was used to assess participants’ dietary variety. The DVS assesses the frequency of weekly consumption of 10 types of foods including the following: meat, fish and shellfish, eggs, dairy, soybean products, green and yellow vegetables, seaweed, fruits, potatoes, and foods containing fats and oils (13). A response of “I eat this food almost every day” for a given food group was scored as 1 point and other responses were scored as 0 points. The total score was considered the DVS. Based on a study performed by Kumagai et al, individuals were categorized as those with marked dietary variety (indicated by a DVS score ≥4 points) and those with lesser dietary variety (indicated by a DVS score ≤3 points) (13). The International Physical Activity Questionnaire (IPAQ) is an internationally standardized questionnaire used across 12 countries to assess routine physical activity in adults aged 18–65 years (14). The Japanese version of the IPAQ was used to assess physical activity. The long and short forms of the IPAQ obtain information regarding the number of days a participant performs intense and moderate physical activity on a weekly basis. The energy expended during the weekly physical activity can be calculated (in Kcal). The Japanese version of the IPAQ short form (IPAQ-SF) was used in the current study to calculate the energy expended during physical activity based solely on the intensity of that activity. Based on a study reported by Murase et al., physical activity can be categorized as moderate level activity with energy expenditure ≥600 metabolic equivalents (METs)/week and low level activity with energy expenditure <600 METs/week (15).
The Asian Working Group for Sarcopenia (AWGS) defines sarcopenia as a condition characterized by loss of muscle strength (grip strength: <26.0 kg in males, <18.0 kg in females), diminished limb function (usual gait speed <0.8 m/s), loss of muscle strength and concomitant diminished limb function, as well as a low limb skeletal muscle mass index (SMI) based on bioelectrical impedance analysis (BIA) (<7.0 kg/m2 for males, <5.7 kg/m2 for females) (16). Grip strength was measured using a Smedley hand dynamometer (DT-2177, Toei Light, Sōka, Japan). Grip strength of the dominant hand was measured thrice, and the maximum value among the 3 recordings was used. The usual gait speed (m/s) was calculated based on the time needed to walk 10 m in a straight line with a build-up and a slow-down. Limb skeletal muscle mass was measured with an electrical impedance plethysmograph (InBody S10, InBody Japan, Inc., Tokyo, Japan) using BIA. In participants with some metallic device in their body, the limb skeletal muscle mass was calculated using Sanada’s predictive formula. The result was divided by the square of the height (in m2) to calculate the SMI (17). Participants were categorized as those who performed oral exercises (massaging the salivary glands, stretching from the shoulders to the fingers, cheek and tongue movements, and vocal cord exercises) and those who did not perform oral exercises. Other demographic characteristics evaluated included age, gender, need for long-term care, day care service utilization (in h), the Charlson Comorbidity Index (indicating the type and severity of the comorbidity), and BMI. Continuous variables were categorized as binary categorical variables. Age was categorized as ≥75 years and <75 years, the level of long-term care needed in participants was categorized as need for ≥level 2 long-term care or the need for level 1 long-term care/support, and the use of day care services (in h) was categorized as prolonged use of 7 h or brief use of ≤3 h. The Charlson Comorbidity Index was ≥1 point or 0 points=no comorbidity (18). Similar to the protocol followed by the National Health and Nutrition Examination Survey, elderly aged ≥65 years were categorized as those with BMI ≤20 kg/m2 (indicating that the individual is underweight) and those with BMI >20 kg/m2 (19). Based on the AWGS definition, males were categorized as those with SMI ≥7.0 kg/m2 and those with SMI <7.0 kg/m2. Females were categorized as those with SMI ≥5.7 kg/m2 and those with SMI <5.7 kg/m2.
The CPF was ranked in tertiles for statistical analysis. A Mann–Whitney U test was used for an intergroup comparison (those with a CPF ≥130 L/min and those with a CPF <130 L/min) of participants’ quantitative variables related to demographic characteristics. Univariate analysis was performed with CPF ≥130 L/min and CPF <130 L/min as the outcomes. Subsequently, we performed multiple logistic regression analysis to analyze 4 factors without multicollinearity and with a high odds ratio (age, gender, sarcopenia status, and the MNA-SF score) in univariate analysis. All statistical analyses were performed using SAS, version 9.4 (SAS Institute Inc., Cary, NC USA), and a p value <0.05 was considered statistically significant. This study was approved by the Ethical Review Board of Morinomiya University (approval no.: 2016-097).


Results

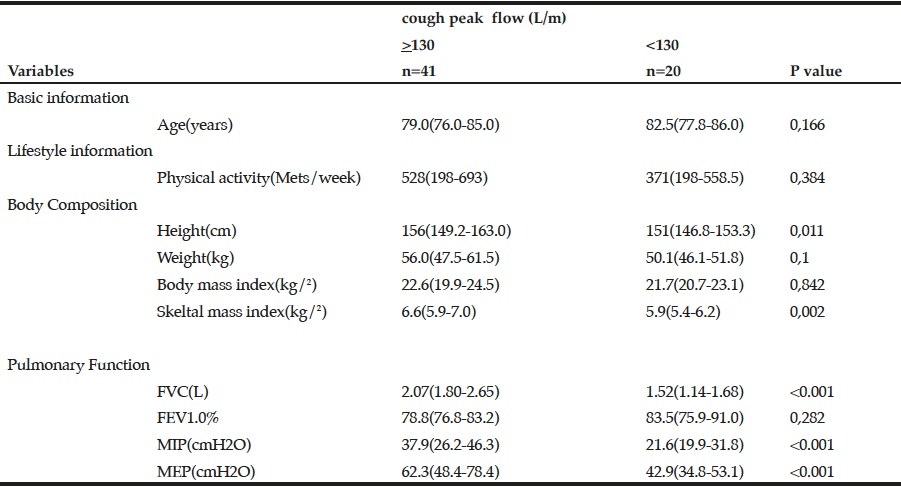
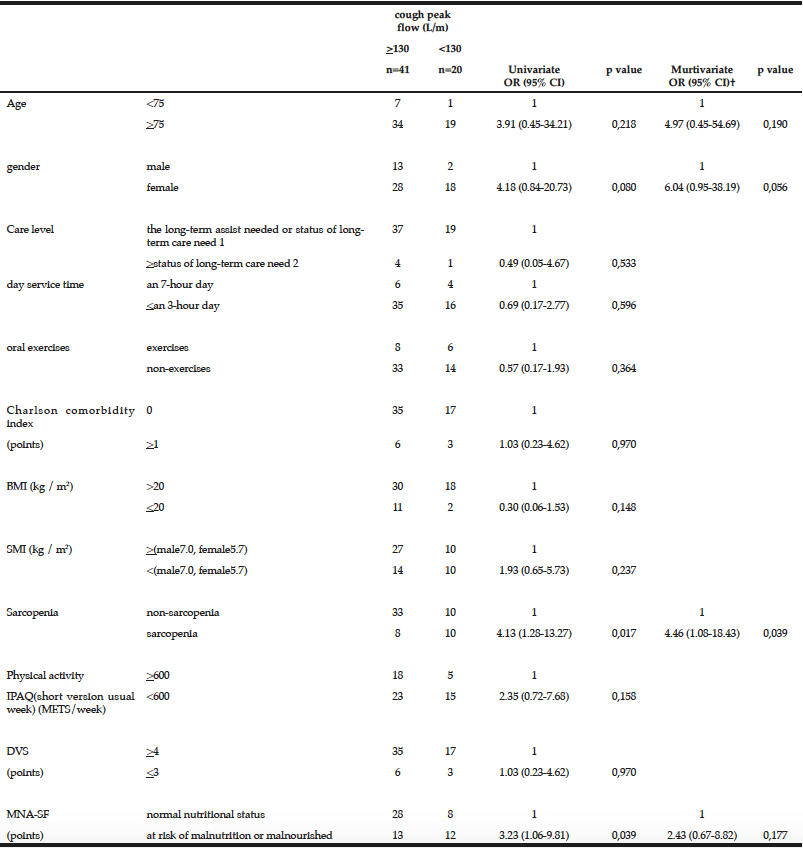
Demographic characteristics of the participants in this study are shown in Table 1. Comparison between 41 participants with a high CPF (≥130 L/m) and 20 participants with a low CPF (<130 L/m) showed significant statistical differences in height, SMI, and respiratory indices (FVC, MIP, and MEP). All these parameters were higher in participants with a high CPF. As a result of univariate and multivariate regression analyses, reduced CPF as the response variable and individual factors as independent variables indicated that sarcopenia (odds ratio [OR] 4.46, 95% confidence interval [CI] 1.08–18.43) was independently associated with a reduced CPF. Additionally, a reduced CPF was weakly associated with age (OR 4.97, 95% CI 0.45–54.69), gender (OR 6.04, 95% CI 0.95–38.19), and the MNA-SF score (OR 2.43, 95% CI 0.67–8.82) (Table 2).

Table 1 The characteristics of analysis participants

Table 1
The characteristics of analysis participants

The values were described as median interquartile range (IQR), and Mann-Whitney U test was performed. FVC: Forced Vital Capacity, FEV: Forced expiratory volume 1.0(s)%, MIP: Maximum inspiratory pressure, MEP: Maximum expiratory pressure


Table 2 Univariate and multivariate OR and 95% CI for cough peak flow

Table 2
Univariate and multivariate OR and 95% CI for cough peak flow

† Model included age, gender, sarcopenia and MNA-SF, ADL: activities of daily living, OR: odds ratio, CI: Confidence interval, BMI: Body mass index, SMI: skeletal muscle mass index, IPAQ: International Physical Activity Questionnaire


Discussion

The results of our study revealed that sarcopenia was independently and significantly associated with a reduced CPF in elderly who used day care services and needed support or long-term care. Additionally, sarcopenia was weakly associated with MNA-SF score (<11 points was malnutrition), as well as with age and gender.
Sarcopenia is typically an age-related condition, although it can occur secondary to diminished activity, malnutrition, or cachexia (7-9). Sarcopenia can affect the respiratory muscles with consequent reduction in respiratory muscle strength and endurance (6). Diminished respiratory muscle strength secondary to sarcopenia was significantly associated with a reduced CPF in our current study. A recent study indicated that the capacity of the pectoralis major observed on chest computed tomography may serve as a predictor of aspiration pneumonia (20). A previous study has reported that sarcopenia is associated with the aspiration pneumonia-related mortality rate in elderly patients. Another study has reported that sarcopenia is a risk factor for postoperative respiratory complications (21, 22). Our current study investigated the factors associated with aspiration pneumonia in elderly who needed support or long-term care, and our results suggested that sarcopenia may contribute to the mechanism of diminished cough intensity.
An association (albeit weak) between CPF and MNA-SF score could be explained by a presumed association between malnutrition and diminished muscle strength. Malnutrition reduces respiratory muscle strength and maximal voluntary ventilation. Arora et al. reported that improved nutrition reduces the occurrence of pulmonary disease (23). Malnutrition reduces respiratory muscle mass, and the lack of energy reduces respiratory muscle activity. Age was also weakly associated with a reduced CPF. A previous study has reported that expiratory and inspiratory muscle strength decrease with age (24), and a similar trend was noted in our current study. Another previous study indicated that respiratory muscle strength is greater in males than in females (6), and this gender difference presumably explains the reduced CPF. Notably, this gender difference was evident even when male and female participants having the same physique were investigated. However, the exact cause that explains this difference remains unclear.
Comparison of participants with a high CPF (≥130 L/m) and participants with a low CPF (<130 L/m) revealed significant differences in respiratory indices—these indices were higher in participants with a high CPF. This finding concurs with a previous study, which reported that CPF was associated with respiratory indices (25). Significant differences between two groups were observed in height and SMI in that these parameters were higher in participants with a high CPF; however, no significant differences were observed in BMI between the 2 groups. This finding could be attributed to the fact that a few participants were diagnosed with obesity and sarcopenia, i.e., they demonstrated a large amount of fat and sarcopenia but a short stature. We intend to investigate this issue in future studies.
A limitation of this study was its small sample size. We preliminarily investigated CPF in a limited sample, and the statistical power of the study was limited. However, sarcopenia was significantly and independently associated with a reduced CPF, which suggests that sarcopenia is a relatively potent contributor to a reduced CPF. Nonetheless, other potent factors cannot be ruled out. We intend to perform large-scale studies in future to clarify the association between a reduced CPF and the aforementioned individual factors.
As stated, we intend to study the aforementioned association followed by a longitudinal evaluation of day care services. If a cause-and-effect relationship can be identified, it would help in determining the factors that require intervention to prevent reduction in CPF and consequent aspiration pneumonia. This finding could lead to new findings with regard to community efforts to obviate the need for long-term care.
In conclusion, this study reveals that sarcopenia is a potent risk factor for diminished cough intensity, which is known to predispose patients to aspiration pneumonia. In our view, our current findings are highly significant in that they provide specific quantitative data highlighting the association between sarcopenia and the development of aspiration pneumonia via the mechanism of “diminished cough intensity.” Additionally, a reduced CPF was observed to be weakly associated with nutritional status by MNA-SF, age, and gender. A reduced CPF is significantly associated with sarcopenia.


Funding and Conflict of interest: None to disclose.

Ethical standard: This study was approved by the Ethical Review Board of Morinomiya University of Medical Sciences (approval no: 2016-097). Data were only collected from those repondants who signed informed consent. This study was conducted in accordance with the Declaration of Helsinki.


References

1.    Marik PE, Kaplan D: Aspiration pneumonia and dysphagia in the elderly. Chest, 2003, 124: 328–336.
2.     Bach JR, Ishikawa Y, Kim H: Prevention of pulmonary morbidity for patients with Duchenne muscular dystrophy. Chest, 1997, 112: 1024–1028.
3.    Freitas FS, Ibiapina CC, Alvim CG, et al.: Relationship between cough strength and functional level in elderly. Rev Bras Fisioter, 2010, 14: 470–476.
4.    Bahat G, Tufan A, Ozkaya H, et al.: Relation between hand grip strength, respiratory muscle strength and spirometric measures in male nursing home residents. Aging Male, 2014, 17: 136–140.
5.    Kim J, Davenport P, Sapienza C: Effect of expiratory muscle strength training on elderly cough function. Arch Gerontol Geriatr, 2009, 48: 361–366.
6.    Chen HI, Kuo CS: Relationship between respiratory muscle function and age, gender, and other factors. J Appl Physiol, 1989, 66: 943–948.
7.    Delmonico MJ, Harris TB, Lee JS, et al.: Alternative definitions of sarcopenia, lower extremity performance, and functional impairment with aging in older men and women. J Am Geriatr Soc, 2007, 55: 769–774.
8.    Goodpaster BH, Park SW, Harris TB, et al.: The loss of skeletal muscle strength, mass, and quality in older adults: The health, aging and body composition study. J Gerontol A Biol Sci Med Sci, 2006, 61: 1059–1064.
9.    Cruz-Jentoft AJ, Baeyens JP, Bauer JM, et al.: Sarcopenia: European consensus on definition and diagnosis: Report of the European Working Group on Sarcopenia in Older People. Age Ageing, 2010, 39: 412–423.
10.    Yamada M, Nishiguchi S, Fukutani N, et al.: Prevalence of sarcopenia in community-dwelling Japanese older adults. J Am Med Dir Assoc, 2013, 14: 911–915.
11.    Izawa S, Kuzuya M, Okada K, et al.: The nutritional status of frail elderly with care needs according to the mini-nutritional assessment. Clin Nutr, 2006, 25: 962–967.
12.    Rubenstein LZ, Harker JO, Salvà A, et al.: Screening for malnutrition in geriatric practice: Developing the Short-form Mini Nutritional Assessment (MNA-SF). J Gerontol A Biol Sci Med Sci, 2001, 56: 366–372.
13.    Kumagai S, Watanabe S, Shibata H, et al.: Effects of dietary variety on declines in high-level functional capacity in elderly people living in a community. Nihon Koshu Eisei Zasshi, 2003, 50: 1117–1124. In Japanese.
14.    Craig CL, Marshall AL, Sjöström M, et al.: International physical activity questionnaire: 12-country reliability and validity. Med Sci Sports Exerc, 2003, 35: 1381–1395.
15.    Murase N, Katsumura T, Ueda C, et al.: Validity and reliability of Japanese version of the International Physical Activity Questionnaire. J Health Welfare Stat, 2002, 49: 1–9. In Japanese.
16.    Chen LK, Liu LK, Woo J, et al.: Sarcopenia in Asia: Consensus report of the Asian Working Group for Sarcopenia. J Am Med Dir Assoc, 2014, 15: 95–101.
17.     Sanada K, Miyachi M, Yamamoto K, et al.: Prediction models of sarcopenia in Japanese adult men and women. Jpn J Phys Fitness Sport, 2010, 59: 291–302.
18.    Charlson ME, Pompei P, Ales KL, et al.: A new method of classifying prognostic comorbidity in longitudinal studies: development and validation. J Chronic Dis, 1987, 40: 373–383.
19    National Health and Nutrition Survey, Retrieved September 30, 2018, from https://www.mhlw.go.jp/content/10904750/000351576.pdf
20.     Sakaguchi K, Hara S: Capacity of the pectoralis major muscle may be a prognostic factor for aspiration pneumonia. Adv Aging Res, 2017, 6: 101–117.
21.    Maeda K, Akagi J: Muscle mass loss is a potential predictor of 90-day mortality in older adults with aspiration pneumonia. J Am Geriatr Soc, 2017, 65: e18–e22.
22.    Soma D, Kawamura YI, Yamashita S, et al.: Sarcopenia, the depletion of muscle mass, an independent predictor of respiratory complications after oncological esophagectomy. Dis Esophagus, 2018.
23.    Arora NS, Rochester DF. Respiratory muscle strength and maximal voluntary ventilation in undernourished patients. Am Rev Respir Dis, 1982, 126: 5–8.
24.    Enright PL, Kronmal RA, Manolio TA, et al.: Respiratory muscle strength in the elderly. Correlates and reference values. Cardiovascular Health Study Research Group. Am J Respir Crit Care Med, 1994, 149: 430–438.
25.    Kang SW, Bach JR. Maximum insufflation capacity: vital capacity and cough flows in neuromuscular disease. Am J Phys Med Rehabil, 2000, 79: 222–227.

EVALUATION OF INPATIENTS’ NUTRITIONAL STATUS AND PROGNOSTIC INVOLVEMENT


J. Ares Blanco1,*, L. Moreno Díaz1, E. Fernández-Fernández1, A.J. López-Alba1


1. Endocrinology and Nutrition section, Hospital of Jove, Gijón; * Principality of Asturias Health Investigation Institute (ISPA)

Corresponding Author: Jessica Ares Blanco, C/ Bernardino Guardado 30, 33403 Avilés Asturias, Spain, Tel 652157275, jessiaresb@gmail.com.

J Aging Res Clin Practice 2019;8:15-19
Published online January 24, 2019, http://dx.doi.org/10.14283/jarcp.2019.3


Abstract

Background: There is an association between malnutrition and mortality. However, it is unclear if this association is truly independent of confounding factors. Objectives: The objective of this study is to evaluate nutritional status, defined according to the three categories defined in the Nutritional Screening Tool “Mini Nutritional Assessment”, and to investigate its prognostic involvement. Design, Setting and Participants: Single cohort retrospective observational study in hospitalized patients between December 2013 and January 2014, who were placed under observation until September 2015 (21 months) (n=144). Nutritional status was determined by MNA short form at the beginning of the study, as well as clinical and epidemiological data. Results: Based on categories defined by MNA SF, 59 (40.97%) were well nourished, 55 (38.19%) were at risk of malnutrition, and 30 (20.83%) patients showed malnutrition. 45 patients died during follow up (31.25%). Of them, 40% (18) were malnourished, 38% (17), at risk of malnutrition, and 22% (9), well nourished. After adjusting for confounding factors, hazard ratio (95% CI) for all-cause mortality was significantly greater in the malnourished group (3.44 (1,27-9,31: p 0,015)), comparing to the reference group (well-nourished patients). Conclusions: Nutritional status defined according to the 3 categories defined in MNA short form predicts the probability of mid-term death in hospitalized patients, after adjusting for confounding factors as age and comorbidities. These data show the importance of knowing nutritional status during hospitalization for avoiding potential complications and helping the patient to overcome them

Keywords: Malnutrition, nutrition screening tool, survival, comorbidities, elderly.


Introduction

It is widely described that there is a direct relationship between malnutrition and life expectance in elderly people (1). In fact, in Europe one out of three elderly patients who is admitted to the hospital shows malnutrition (2-4). This leads to longer hospital stays, higher number of hospital admissions and functional cognitive impairment (5, 6).
European Society for Clinical Nutrition and Metabolism (ESPEN) has defined malnutrition as a complex interaction between consequences of and underlying disease and its metabolic disturbance, and reduction of availability of nutrients (reduction of food intake and/or its absorption and/or increased losses) or a combination of them (7).
A review article published in 2012 about nutritional screening in hospitalized patients concluded that malnutrition was associated with increased mortality (8), although it is still unclear if this association is independent of confounding factors such as age and comorbidities.
On the recommendation of ESPEN (9), the most used nutritional screening tool in elderly people is MNA (2, 8). To facilitate data collection, we used MNA short form, which was based on the former tool, and validated in 2009 (10). According to the score, population is divided in 3 groups: well nourished ((≥12), at risk of malnutrition (8-11), and malnourished ((≤7)
The objective of the study is to confirm the importance of nutritional status in hospitalized patients as an independent prognostic factor, having previously adjusted for confounders (Charlson comorbidity index).


Methods

Study design and participants

Cohort of hospitalized patients in Jove Hospital between December 2013 and January 2014, who were placed under observation until September 2015 (21 months) (n=144). Nutritional status (based on MNA short form) and epidemiological and clinical data were determined.
Jove Hospital is located in Gijón, Asturias, and is provided with 261 beds, mostly distributed in the departments of Internal Medicine, General Surgery, Gynecology and Orthopedics.
The study was approved by the ethics committee of the hospital. Informed consent was obtained from the patient prior to testing.

Data collection

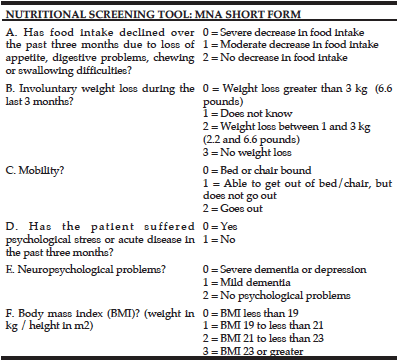
The initial phase of the project (December 2013-January 2014) collected baseline nutritional status during hospitalization determined by MNA short form (table 1). This tool consist of 6 items and classifies patients in 3 categories depending on nutritional status: 0-7 malnutrition, 8-11 at risk of malnutrition, and 12-14 well-nourished. In order to analyze the relationship between nutritional status and mortality, digital medical history was consulted (Selene®), according to our hospital protocol. During hospital stay, we collected data about comorbidities associated to the cause of hospitalization according to CIE-10 classification, as well as anthropometrical characteristics like weight, height or body mass index (BMI). The second phase of the study took place in September 2016, when cohort’s vital state was determined (through direct visualization in Selene®). We also searched for the number of hospital readmissions and emergency visits.

Table 1 Nutritional Screening Tool: MNA Short Form, performed in this study

Table 1
Nutritional Screening Tool: MNA Short Form, performed in this study

Screning Score: maximum 14 points 12-14 points: Normal nutritional status 8-11 points: At risk of malnutrition; 0-7 points: Malnourished


Statistical analysis

The main objective of this study was to examine the association between nutritional status according to MNA (malnourished, at risk of malnutrition and well-nourished) and survival during follow up. Time to death was calculated from the date MNA was done and the time of death.
Regarding descriptive statistics, data from categorical variables have been shown as frequencies and percentages (%), while discrete and quantitative variables have been shown as arithmetical medias and standard deviations.
Differences between the three groups were analyzed in Pearson test for categorical variables, Kruskal-Wallis for quantitative discrete variables and ANOVA for continuous quantitative variables.
The hazard ratio for median overall survival was calculated using the Cox regression model. Nutritional status was included as a categorical variable with 3 levels: well-nourished, at risk of malnutrition and malnourished. As confounding factors, age and Charlson comorbidity index (ChCI) were included.   ChCI comprises 17 comorbidity categories obtained through anamnesis and/or the patient’s medical history. Each category was assigned a score based on 1-year mortality risk. Patient’s score was the result of the sum of comorbidities contemplated in ChCI.
Cox regression model was conducted in two steps. First step was comprised of nutritional status and possible confounders (age, ChCI, sex, BMI). Age and BMI were considered quantitative continuous variables; ChCI and sex, quantitative discrete. Thus, statistically significant variables (age and ChCI) were included in second step, using a multivariable logistic statistical model. Data were analyzed by IBM SPSS Statistics v 21.0®.


Results

Patient’s characteristics

144 patients were first evaluated. Average age was 67.8±2.9 years, with female predominance (54.1%).
Patients hospitalized in Short Stay Unit were excluded.
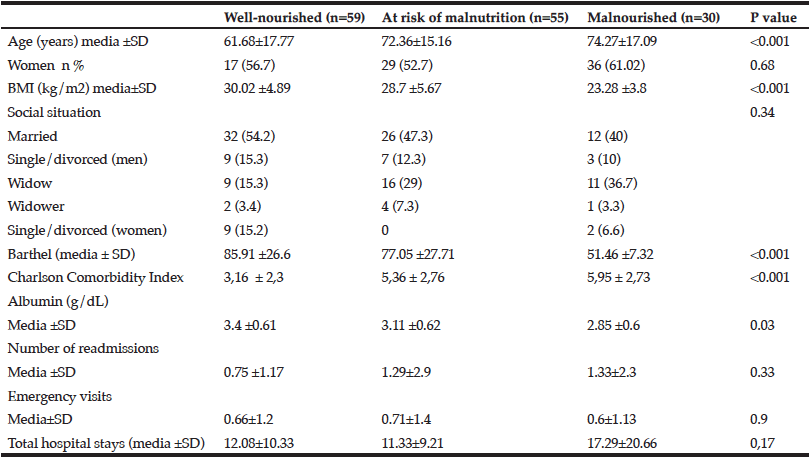
Table 1 shows baseline characteristics related to previous nutritional status. According to basal MNA, 59 (40.97%) were well nourished, 55 (38.19%) were at risk of malnutrition and 30 (20.83%) were malnourished. Malnourished patients were statistically older, with lower body mass and Barthel Indexes, and higher comorbidity index according to Charlson Classification.
Re-evaluation of our population showed greater number of readmissions in the group of patients with MNASF lower than 7, not statistically significant. Malnourished patients showed longer hospital stays (including subsequent admissions). Due to small sample size, this differences did not reach statistical significance (Table 2).

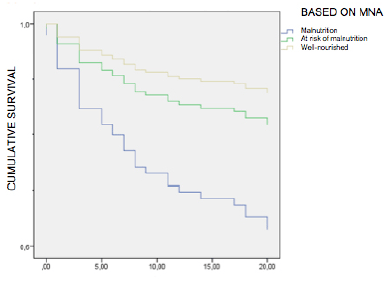
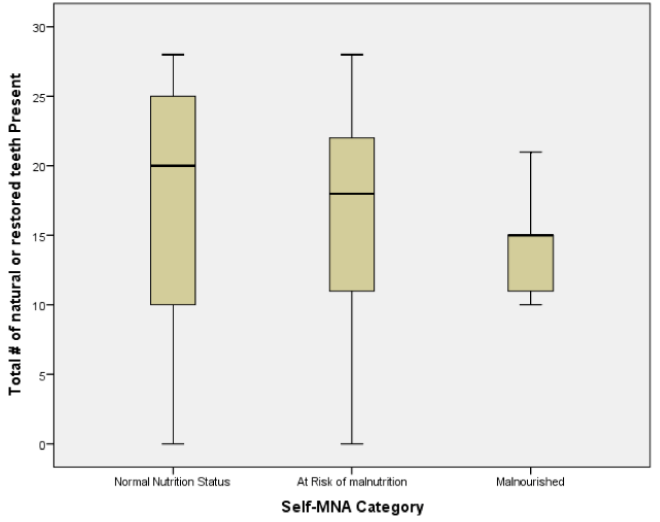
Figure 1 Survival curve determined by nutritional status adjusted for confounders

Figure 1
Survival curve determined by nutritional status adjusted for confounders


Table 2 Baseline clinical and anthropometrical characteristics during follow-up

Table 2
Baseline clinical and anthropometrical characteristics during follow-up


Survival analysis

Follow-up period was 21 months. Over that time, 45 patients died (31.25%). Survival rate was different depending on nutritional status. For well-nourished people, it was 78%; malnourished, 60%, and at risk of malnutrition, 62% (p<0.001).
The hazard ratio (HR) (95% CI) for all-cause mortality was calculated using the univariate Cox regression model. For people at risk of malnutrition, it was  2.47 (0.91-6.76) (p 0.077); malnourished, 6.44 (2.34-17.72), compared to well-nourished patients (reference group).
After adjusting for confounders (age and ChCI) in a multivariate Cox regression model, HR (95% CI) for all-cause mortality was significantly higher in malnourished group: 3.44 (1.27-9.31: p 0.015), compared to reference group. These data are shown on Figure 1.


Discussion

From a physical point of view, malnutrition can result in loss of muscle and fat mass, reduction of respiratory musculature and cardiac function, and organ atrophy (11-13). 15% of unintended weight loss can result in reduction of muscle and respiratory strength, while a 23% loss is associated with a 70% decrease of physical abilities, 30% decrease of muscle mass and 30% increase in depression incidence (14).
From a psychological point of view, malnutrition is associated with asthenia and apathy, which leads to a delay in the disease recovery and further exacerbates anorexia and increases time for convalescence (13).
It is widely described that malnutrition is associated with an increase of hospital stay (15, 16). As stated in an US study about hospitalized patients for a minimum of 7 days with the aim to studying the negative impact of hospital stay in nutritional status. Results showed that patients who were malnourished at the time of admission and those who experienced deterioration in their nutritional status had longer hospital stays (an average of 4 extra days) than patients who were well nourished at the time of admission and discharge (17). Similarly, an Australian study found statistically significant differences between hospital stays of malnourished and well-nourished patients (5 days extra) (18).
PREDyCES® (19) study was developed in 2011 and included 1,576 patients attended at 31 health centers in the Spanish National Health System. According to this study, 23.7% of patients showed malnutrition at the time of hospital admission (using NRS-2002 screening tool). This percentage is similar to that found in our study, which also shows longer hospital stay in malnourished patients.
Therefore, we can interpret that, as in this metacentric study, expenditure per patient is increased according to nutritional status.
Despite evidence indicates that nutritionally-compromised patients suffer from more complications during hospital stay, it is difficult to isolate the influence of confounders and demonstrate that malnutrition on its own is related to increase of mortality. The fact that numerous international studies, in a wide variety of groups of patients and areas, describe similar findings, reinforces the idea that malnutrition consists in a decrease in survival. Thus, health authorities must concern population nutritional status.
According to our data, we can finally state that nutritional status acts as an independent risk factor for mortality (having previously adjusted by comorbidities and age).
Main weakness of this study is sample size, as hospital characteristics did not allow larger sample size. In fact, we were successful in knowing data of 80% inpatients in that moment (261 beds).
Malnutrition prevalence resulted in 20% of inpatients analyzed. There are multiple causes of malnutrition at hospital, those regarding hospitalization, disease itself, lack of dietitians or a Hospital Nutrition Unit, as occurs in our case (20).
There are several studies published about the relationship between malnutrition and mortality, most them being made without Logistical regression (5, 21-23), and only reporting hospital mortality, but two studies, the one published by Söderström et al (23) in 2014, which directly relates malnutrition in 1,767 patients aged 65 or over, and increase of 50-month mortality (HR 3.71 (2.28-6.04)); and other retrospective Australian study of 476 patients which found a HR for malnourished group of 3.4 (1.07-10.87), having previously adjusted for comorbidities at the time of admission (24). Moreover, a small Scandinavian study with prospective data analyzed 3 categories in MNA to predict malnutrition in 101 hospital inpatients aged 65 or more. After adjusting for age, sex and Charlson Comorbidity Index, they did not find any association between malnutrition and mortality after one year follow-up (25).


Conclusion

Our results show that performing nutritional screening at the time of hospital admission is a useful tool to determine the probability of having complications and poor outcome in a short period of time.
According to our data, MNA short form can be considered as a valid test to differentiate which patients are well-nourished from malnourished. There is no big difference between being at risk of malnutrition and malnourished regarding mortality.
We believe that we must encourage health authorities to worry more about this fact, by improving the access to nutritional screening tools in every hospital in order to provide the best patient care and decrease further costs.


Acknowledgements: I express my gratitude to Dr. López Alba for giving me the opportunity to do this study, and to Nutricia (particularly, Gonzalo Álvarez), for the resources they provided.

Funding: This study has been funded by Nutricia®.

Conflict of interest: This study has been funded by Nutricia®, but it has not been observed any attempt to access to confidential information by them.

This manuscript has been presented as a poster in SENPE (Sociedad Española de Nutrición Enteral y Parenteral) 2016 congress.

Ethical standard: All procedures followed were in accordance with the ethical standards of Jove Hospital and with the Helsinki Declaration of 1975, as revised in 2000. Informed consent was obtained from all patients for being included in the study.


References

1.    Norman K, Pichard C, Lochs H, Pirlich M. Prognostic impact of disease-related malnutrition. Clin Nutr 2008;27(1):5-15.
2.     Guigoz Y. The Mini Nutritional Assessment (MNA) review of the literature. What does it tell us? J Nutr Health Aging 2006;10(6):466-85.
3.     Kaiser MJ, Bauer JM, Ramsch C, Uter W, Guigoz Y, Cederholm T, et al. Frequency of malnutrition in older adults: a multinational perspective using the mini nutritional assessment. J Am Geriatr Soc 2010;58(9):1734-8.
4.     Meijers JM, Schols JM, van Bokhorst-de van der Schueren MA, Dassen T, Janssen MA, Halfens RJ. Malnutrition prevalence in The Netherlands: results of the annual Dutch national prevalence measurement of care problems. Br J Nutr 2009;101(3):417-23.
5.     Amaral TF, Matos LC, Teixeira MA, Tavares MM, Alvares L, Antunes A. Undernutrition and associated factors among hospitalized patients. Clin Nutr 2010;29(5):580-5.
6.     Saka B, Kaya O, Ozturk GB, Erten N, Karan MA. Malnutrition in the elderly and its relationship with other geriatric syndromes. Clin Nutr 2010;29(6):745-8.
7.     Muscaritoli, M.; Anker, S.D.; Argiles, J.; Aversa, Z.; Bauer, J.M.; Biolo, G.; Bioirie, Y.; Bosaeus, I.; Cederholm, T.; Costelli, P.; Fearon, K.C.; Laviano, A.; Maggio, M.; Rossi Fanelli, F.; Schneider, S.M.; Schols, A.; Sieber, C.C. Consensus definition of sarcopenia, cachexia and pre-cachexia: Joint document elaborated by Special Interest Groups (SIG) ―cachexia-anorexia in chronic wasting diseases‖ and ―nutrition in geriatrics‖. Clin. Nutr. 2010, 29, 154-159.
8.     Dent E, Visvanathan R, Piantadosi C, Chapman I. Nutritional screening tools as predictors of mortality, functional decline, and move to higher level care in older people: a systematic review. J Nutr Gerontol Geriatr 2012;31(2):97-145.
9.     Kondrup J, Allison SP, Elia M, Vellas B, Plauth M. ESPEN guidelines for nutrition screening 2002. Clin Nutr 2003;22(4):415-21.
10.     Kaiser MJ, Bauer JM, Ramsch C, et al. Validation of the Mini Nutritional Assessment Short-Form(MNA®-SF): A practical tool for identification of nutritional status. J Nutr Health Aging. 2009;13: 782-788
11.     Chandra, R.K. Nutrition and the immune system: an introduction. Am. J. Clin. Nutr. 1997, 66, 460S-463S.
12.     Holmes, S. The effects of undernutrition in hospitalised patients. Nurs. Stand. 2007, 22, 35-38.
13.     Kubrack, C.; Jensen, L. Malnutrition in acute care patients. Int. J. Nurs. Stud. 2007, 44, 1036-1054.
14.     Allison, S.P. Malnutrition, disease and outcome. Nutrition 2000, 16, 590-593.
15.     Braunschweig, C.; Gomez, S.; Sheean, P.M. Impact of declines in nutritional status on outcomes in adult patients hospitalized for more than 7 days. J. Am. Diet. Assoc. 2000, 100, 1316-1322
16.     Thomas, D.R.; Zdrowski, C.D.; Wilson, M.-M.; Conright, K.C.; Lewis, C.; Tariq, S.; Morley, J.E. Malnutrition in subacute care. Am. J. Clin. Nutr. 2002, 75, 308-313.
17.     Kruizenga, H.M.; Tulder, M.W.V.; Seidell, J.C.; Thijs, A.; Ader, H.J.; van Bokhurst-de van der Schueren, M.A.E. Effectiveness and cost-effectiveness of early screening and treatment of malnourished patients. Am. J. Clin. Nutr. 2005, 82, 1082-1089.
18.     Middleton, M.H.; Nazarenko, G.; Nivison-Smith, I.; Smerdely, P. Prevalence of malnutrition and 12-month incidence of mortality in two Sydney teaching hospitals. Int. Med. J. 2001, 31, 455-461.
19.     J. Álvarez-Hernández , M. Planas Vila , M. León-Sanz , A. García de Lorenzo , S. Celaya-Pérez , P. García-Lorda , K. Araujo , B. Sarto Guerri. Prevalence and costs of malnutrition in hospitalized patients; the PREDyCES® Study. Nutr Hosp. 2012; 27(4):1049-1059
20.     Ulibarri JI, Burgos R, Lobo G, Martínez MA, Planas M, Péres de la Cruz A, et al. Recomendaciones sobre la evaluación del riesgo de desnutrición en los pacientes hospitalizados. Nutr Hosp 2009; 24(4): 467-472
21.     Donini LM, Savina C, Rosano A, De Felice MR, Tassi L, De Bernardini L, et al. MNA predictive value in the follow-up of geriatric patients. J Nutr Health Aging 2003;7(5):282-93.
22.     Van Nes MC, Herrmann FR, Gold G, Michel JP, Rizzoli R. Does the Mini Nutritional Assessment predict hospitalization outcomes in older people? Age Ageing 2001;30(3):221-6.
23.     Lisa Söderström a,b,*, Andreas Rosenblad a,d, Eva Thors Adolfsson a,e, Anja Saletti b, f,Leif Bergkvist. Nutritional status predicts preterm death in older people: A prospective cohort study. Clinical Nutrition 33 (2014) 354-359
24.    Charlton K, Nichols C, Bowden S, Milosavljevic M, Lambert K, Barone L, et al. Poor nutritional status of older subacute patients predicts clinical outcomes and mortality at 18 months of follow-up. Eur J Clin Nutr 2012;66(11):1224-8
25.     Holst M, Yifter-Lindgren E, Surowiak M, Nielsen K, Mowe M, Carlsson M, et al. Nutritional screening and risk factors in elderly hospitalized patients: association to clinical outcome? Scand J Caring Sci. 2013 Dec;27(4):953-61

EFFECT OF β-HYDROXY-β-METHYLBUTYRATE (HMB) ON MUSCLE STRENGTH IN OLDER ADULTS WITH LOW PHYSICAL FUNCTION


K. Kinoshita1, S. Satake1,2, Y. Matsui3, S. Kawashima2, H. Arai1,2,4


1. Section of Frailty Prevention, Department of Frailty Research, Center for Gerontology and Social Science, National Center for Geriatrics and Gerontology, Obu, Japan; 2. Department of Geriatric Medicine, Hospital, National Center for Geriatrics and Gerontology, Obu, Japan; 3. Department of Orthopedics, Hospital, National Center for Geriatrics and Gerontology, Obu, Japan; 4. Director, Hospital, National Center for Geriatrics and Gerontology, Obu, Japan

Corresponding Author: Kaori Kinoshita, R.D., M.S. National Center for Geriatrics and Gerontology, 7-430 Morioka, Obu, Aichi, Japan 474-8511, TEL: +81-562-46-2311, FAX: +81-562-44-8518, E-mail address: kino4ta@ncgg.go.jp

J Aging Res Clin Practice 2019;8:1-6
Published online January 2, 2019, http://dx.doi.org/10.14283/jarcp.2019.1


Abstract

Objectives: To evaluate the effects of β-hydroxy-β-methylbutyrate (HMB) on muscle strength, physical performance, and muscle mass without additional exercise training in older adults with low physical function. Design: Randomized, controlled trial (Open-label study). Setting: Outpatients. Participants: 34 senior outpatients with low physical function who do not exercise regularly. Intervention: 2.4 g of HMB (3.0 g of calcium β-hydroxy-β-methylbutyrate [CaHMB]) per day was given for 60 days, and subjects in the control group were asked to engage in daily activities as normal. Measurements: Weakness or low function was defined by the Asian Working Group for Sarcopenia criteria, then the participants were assigned to the HMB group or the control group. All participants underwent several evaluations such as grip strength, the timed up and go test, the 5-times chair stand test (5CS), and skeletal muscle mass index by the bioimpedance method at baseline and at the end of intervention or control period. Results: An intragroup comparison of pre- to post-treatment values showed significant improvement in grip strength and the 5CS in the HMB group (grip strength: HMB, 16.6±6.1 kg to 18.2±6.4 kg, P=.001; control, 16.5±4.3 kg to 16.7±4.7 kg, P=.729; 5CS: HMB, 11.0 [8.8-13.0] s to 10.1 [8.5-12.6] s, P=.011; control, 11.1 [8.6-13.8] s to 10.0 [8.8-11.3] s, P=.246). Two-way repeated measures analysis of variance (ANOVA) used to compare the HMB and control groups showed a significant improvement in grip strength in the HMB group compared with the control group (P=.029). Conclusion: A supplementation of HMB without additional exercise may improve muscle strength in older patients with low muscle strength.

Key words: Randomized controlled trial, elderly, Asian Working Group for Sarcopenia, dynapenia, low muscle strength.


Introduction

One of the important cause of disability in the later lives is thought to be frailty. Frailty, characterized primarily by malnutrition and sarcopenia (a condition featuring loss of muscle mass with either muscular weakness or low physical performance) (1), is reversible (2), meaning that proper evaluation and intervention could bring improvement.
Maintaining skeletal muscle mass by consuming sufficient caloric content and protein and maintaining muscle strength through adequate exercise are effective ways to prevent malnutrition and sarcopenia. Food consumption generally induces protein synthesis and reduces protein catabolism in the skeletal muscles (3), but muscle synthesis in the skeletal muscles of older people appears to be less responsive to amino acids (4), which is called as anabolic resistance. To overcome such a condition, enough consumption of protein or essential amino acids is required, with leucine particularly playing a central role in protein synthesis in the body (5, 6).
The β-hydroxy-β-methylbutyrate (HMB) is a natural metabolic product of leucine (7), but only 5% of the leucine consumed is reportedly converted in the body to HMB. The HMB stimulates body protein synthesis (8) with anabolic effects more powerful than those of leucine (9) and may therefore have a potential effect on muscle growth and performance (10). These findings suggest that HMB may be effective in sarcopenia and dynapenia (11), but research in people with sarcopenia or poor physical performance is currently lacking. The findings of systematic reviews suggest that HMB consumption plus exercise may increase muscular strength in older persons, however there are no firm conclusions on the effects of HMB alone (12, 13). No randomized, controlled trial of HMB in sarcopenia or low physical function has been conducted under the Asian Working Group for Sarcopenia (AWGS) criteria (14).
To address this deficit, we decided to evaluate the effects of HMB consumption without additional exercise and within activities of daily living on physical performance of older people with low physical function.


Methods

Participants and informed consent

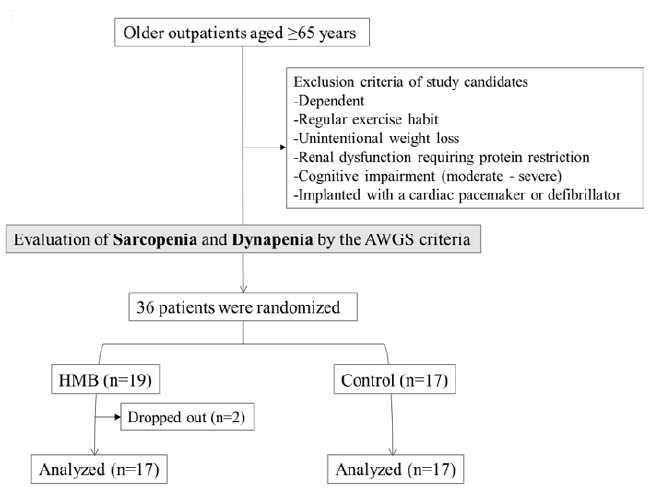
The participants were independent men and women aged 65 years and over who regularly visited the outpatient clinic of the department of geriatrics of the National Center for Geriatrics and Gerontology of Japan on an outpatient basis and were found to have weakness or low physical function according to the criteria of the AWGS (14) (Figure 1). Candidate participants were those who did not regularly exercise or undergo rehabilitation and had to be available for 2 months of the intervention/control period (the study period).


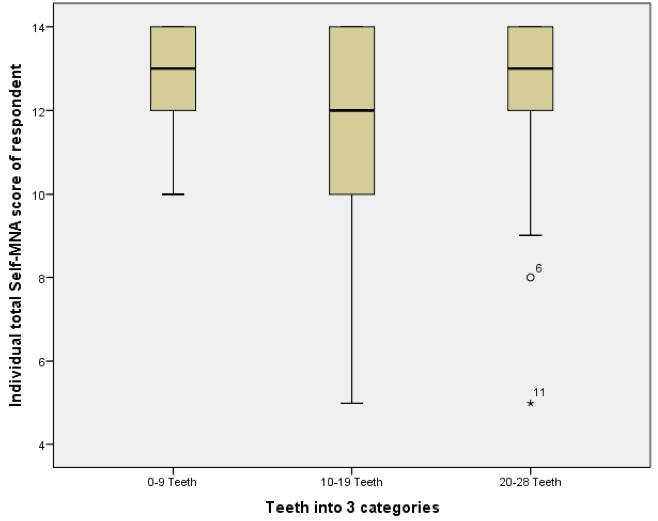
Figure 1 A flow chart of participants

Figure 1
A flow chart of participants


Candidates were excluded if they had experienced unintentional weight loss of 3 kg or more over the past 3 months, had an acute medical condition, had renal impairment requiring protein restriction, had moderate or greater cognitive impairment as shown by a Mini-Mental State Evaluation (MMSE) score of 18 or less, were certified as requiring assistance under Japan’s Long-term Care Insurance System, had a cardiac pacemaker, or were unsuited to physical performance evaluation because of visual or auditory impairment, quadriplegia, or a similar condition.
This study, which was grounded in the principles of the Declaration of Helsinki, was approved by the Ethics Committee of the National Center for Geriatrics and Gerontology of Japan. All participants were provided information about the purpose and procedures of the study and expected risks and benefits. Those who acknowledged the information and signed the informed consent form were enrolled.

Evaluation of low physical function

Weakness or low physical function was evaluated using the AWGS criteria (14). Grip strength and usual gait speed were first measured, and then muscle mass was evaluated. Men with a grip strength of less than 26 kg and women with a grip strength of less than 18 kg were considered to have muscular weakness. Participants with a gait speed of 0.8 m/s or below in a 5-m usual gait speed test (the middle 5 meters over an 11-meter walk) were considered to have decreased physical performance. A bioimpedance method was used to determine skeletal muscle mass. Men with a skeletal muscle mass index (SMI) of less than 7.0 kg/m² and women with an SMI of less than 5.7 kg/m² were considered to have low skeletal muscle mass. Sarcopenia was defined as low skeletal muscle mass and either muscle weakness or decreased physical performance. The low physical function was defined as either muscular weakness or decreased physical performance.

Randomization and intervention

Candidate participants who satisfied the criteria were examined by a physician and then informed about the study. Nutritional status was assessed with the Mini-Nutritional Assessment-Short Form (MNA®-SF) at the start of study period to confirm that none of the participants was malnourished. Those participants consenting to participate in the study were randomized by lottery to the intervention or control group.
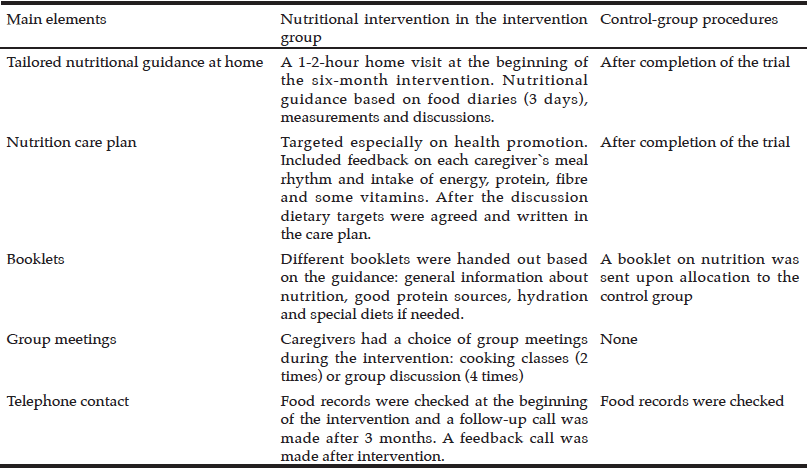
The participants assigned to the interventional group were given 2 packets per day of a supplement containing 1.5 g of calcium HMB (1.2 g of HMB) (7 g of L-glutamine, 7 g of L-arginine, 1.5 g of calcium HMB; Abound™; Abbott Japan Co., Ltd., Tokyo) for 60 days. The participants were instructed to dissolve this powdered supplement in cold water before taking it because dissolving the supplement in hot water could have degraded its ingredients. The participants were given a calendar to use to record the amount consumed each day for 60 days.
The participants assigned to the control group were asked to conduct daily activities as normal for 60 days.
All participants underwent evaluations at baseline and at the end of study period (i.e., after 60 days). These evaluations were performed by a single trained nurse in the present study (Figure 1).
Participants were considered to have dropped out on becoming unable to undergo physical performance evaluations because of an acute illness, hospitalization, or injury during the study or when HMB compliance was less than 60%. This study was conducted in the full analysis set.

Outcome measures

All outcome measures were evaluated at baseline and at the end of study period. Grip strength was measured with a Smedley handgrip dynamometer (Matsumiya Ikaseiki Seisakusho Co., Ltd., Tokyo, Japan) facing outwards and the grip distance adjusted so that the second knuckle of the index finger was bent at a 90° angle. The participants were instructed to stand with their feet normally spaced and squeeze the dynamometer with their arm hanging so that the dynamometer did not touch their body or clothes. The grip strength of each hand was measured twice, with the highest measurement recorded.
The 5-times chair stand test (5CS) was used to evaluate leg strength. The participants, seated in a chair, were asked to stand and sit 5 times as quickly as possible with their arms folded in front of them. The time required was measured.
Skeletal muscle mass was measured with the Inbody 720 precision body composition analyzer (Inbody Japan Inc. Tokyo). Limb skeletal muscle mass (in kilograms) determined using the bioimpedance method was divided by the square of body height (in meters) to determine the SMI.
Functional mobility was evaluated with the timed up and go (TUG) test. The TUG test comprehensively evaluates functional mobility in terms of walking ability, dynamic balance, and agility. The time required for the participants to stand from a seated position, walk around a pylon 3 meters from the chair, return, and touch their pelvis to the chair was measured. The participants walked around the left and right sides of the pylon once. The shorter time was recorded. A time of 10 s or less is considered normal. Those with a time of 20 s or more are considered to require assistance in daily life (15).
Blood samples were taken to measure serum levels of IGF-1, DHEA-S, and 25(OH)D at baseline and at the end of the study period.

Sample size and statistical analyses

The required sample size was determined according to the calculations of a statistician. Based on the results of previous research (16), 2 groups of 17 participants each for a total of 34 participants were found to be necessary for a level of significance of 5% and power of 80% in statistical testing to evaluate the difference in the mean change in the primary outcome measure of grip strength.
SPSS 23.0 (IBM Japan, Tokyo, Japan) was used for all statistical analyses. A paired t-test was used to compare the pre- and post-treatment values in each group. Two-way repeated measures analysis of variance (ANOVA) was used to compare the changes between the groups. A t-test was used to compare mean differences from before to after treatment when a non-normal distribution was present. P-values less than .05 constituted a significant difference.


Results

The participants were sequentially randomized to the HMB group (n=19) and the control group (n=17). Two of the 19 participants in the HMB group were considered to have dropped out because they consumed less than the required amount of HMB (participant A: 54.2%, participant B: 50.0%). In the HMB group, 15 participants had sarcopenia. In the control group, 13 participants had sarcopenia.
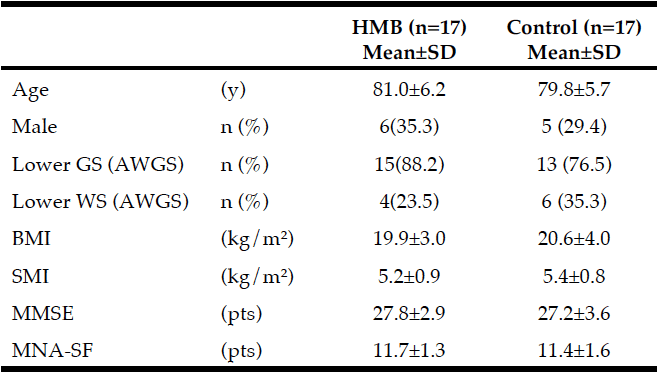
The baseline characteristics of the participants are shown in Table 1. Their mean age was 80.4±5.9 years. According to the AWGS criteria, 15 participants in the HMB group and 13 participants in the control group had decreased grip strength, and 4 participants in the HMB group and 6 participants in the control group had decreased gait speed. MNA®-SF scores were 11.7±1.3 in the HMB group and 11.4±1.6 in the control group. No participant in either group was malnourished.

Table 1 Baseline characteristics

Table 1
Baseline characteristics

Average intake of HMB in subjects: 2.21 g/day (2.76 g/day CaHMB); GS: grip strength, WS: walking speed, SMI: skeletal muscle mass index, AWGS: Asian Working Group for Sarcopenia, MMSE: Mini Mental State Examination, MNA®-SF: Mini Nutritional Assessment-Short Form


Mean HMB consumption was 2.21 g/day (7.6 g/day as CaHMB). Compliance was 92.1%.
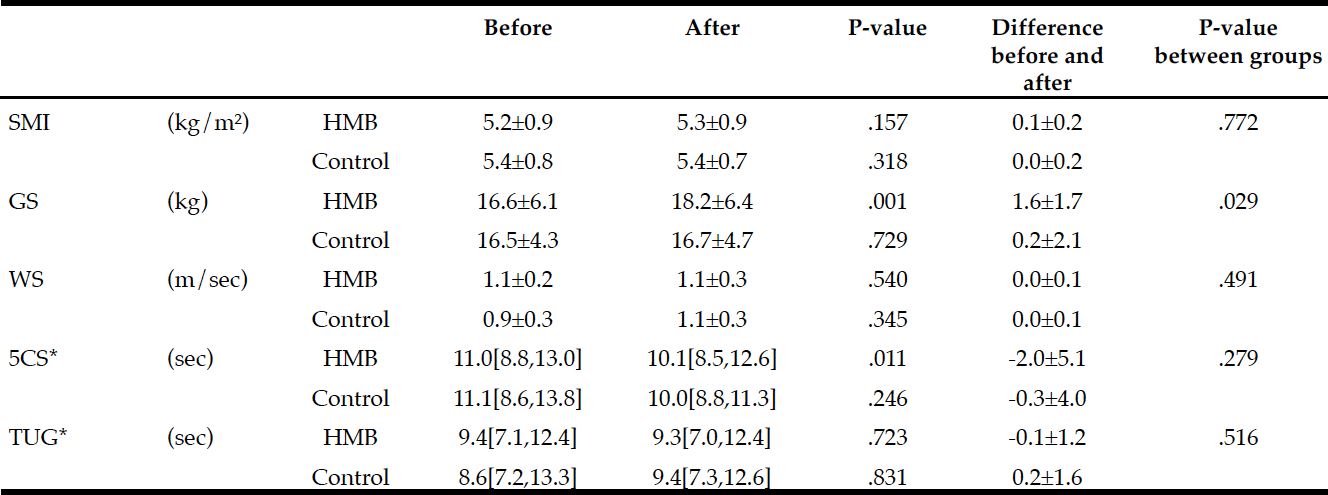
Changes in physical performance during the study period in each group are shown in Table 2. The HMB group achieved significant improvements in grip strength (P=.001) and 5CS (P=.011) with 60 days of intervention. SMI, however, did not change from before to after intervention. Gait speed and TUG scores as indicators of leg performance also showed no significant changes. No measure in the control group changed from before to after follow-up.
Intergroup comparisons of the changes using two-way repeated measures ANOVA showed a significant difference only in grip strength (P=.029).
Changes in blood test values during the follow-up period in each group are shown in Table 3. The only significant difference from before to after treatment was seen in serum 25(OH)D levels, which were significantly lower after 60 days in the HMB group.
Any adverse events on HMB supplement intervention were not observed in this study.

Table 2 Changes in physical functions before and after HMB supplementation

Table 2
Changes in physical functions before and after HMB supplementation

Average intake of HMB in subjects: 2.21 g/day (2.76 g/day CaHMB); Difference within group : * Wilcoxon Signed-rank test, otherwise paired t-test; Difference between groups: * t-test, otherwise two-way repeated measures ANOVA; SMI: skeletal muscle mass index, GS: grip strength, WS: walking speed; 5CS: 5 times Chair Stand test, TUG: Timed Up and Go test


Table 3 Changes in serum biomarkers before and after HMB supplementation

Table 3
Changes in serum biomarkers before and after HMB supplementation

Average intake of HMB in subjects: 2.21 g/day (2.76 g/day CaHMB); Difference within group: Paired t-test; Difference between groups: Two-way repeated measures ANOVA


Discussion

This study evaluated the effects of intervention with 60 days of 2.4 g of HMB (3.0 g of CaHMB) consumption without additional exercise in older people with low physical function. Grip strength improved significantly in the HMB group compared with the control group.
This finding supports the findings of a previous study conducted by Flakoll and colleagues (16). In their study, free- and assisted-living older women (mean age: 76.7 years) who were assigned to the intervention group were given 2.0 g of HMB daily for 12 weeks. Grip strength improved significantly in the present study, which featured intervention for 60 days (about 8 weeks). The duration of intervention in the present study, however, may have been too short to capture the effects of intervention on physical performance and muscle mass. Flakoll and colleagues (16) observed significant improvements in grip strength and leg strength, as well as a tendency of improvement in lean mass, after 12 weeks of intervention. Another study of the effects of consuming 2.0 g of CaHMB daily for 1 year found a significant increase in skeletal muscle mass, and in participants whose blood 25(OH)D level was at least 30 ng/mL, a significant improvement was found in leg strength (17). In the present study, 5CS in the HMB group was significantly shorter after 60 days of follow-up, but it did not differ significantly compared with the control group. Physical performance of the legs depends not only on muscular strength, but also pain caused by motor disorders. Such effects were not considered when selecting the participants, which means that the effects of HMB consumption on leg strength may not have been accurately assessed.
Recent studies have found plasma HMB levels in older people to be positively correlated with grip strength and percent appendicular lean mass (18). Although HMB levels in the blood were not measured, increased blood levels of HMB resulting from regular HMB consumption of a certain amount may have contributed to the increase in grip strength that was observed, given that 82.4% of the participants had low skeletal muscle mass (sarcopenia).
Poor grip strength has been associated with negative outcomes in older people. A survey of hospitalized patients found higher hospitalization costs among patients with poor grip strength (19). Separately, grip strength was found to be significantly predictive of quality of life and the condition requiring assistance after 1 year (20). Known to be associated with several measures of muscular strength, grip strength was recently found to be associated with tongue strength, which contributes to chewing and swallowing function (21, 22). Poor chewing and swallowing function contributes to nutritional imbalance and low food consumption, which in turn contribute to sarcopenia and malnutrition. People whose decline in chewing and swallowing function has progressed such that they can no longer eat regular meals require the support of a caregiver to prepare special meals that they can chew and swallow. When further progression of malnutrition and sarcopenia is present, physical performance also decreases to a level at which further assistance is required. Under the assumption that the improvement in grip strength following HMB consumption that was observed is associated with improved tongue strength, consuming HMB may help prevent declines in chewing and swallowing function.
In this study, blood 25(OH)D levels were significantly lower in the HMB group after 60 days than in the control group. Vitamin D, which binds to receptors in the skeletal muscle, may play a central role in regulating the growth, differentiation, and myotube size of skeletal muscle cells (23). Fuller and colleagues (17) observed a significant improvement in leg strength associated with HMB consumption only in participants with a blood 25(OH)D level of 30 ng/mL or greater. This finding, taken together with the findings of the present study, suggests that synergy between HMB and vitamin D may have certain effects on skeletal muscle synthesis and muscular strength enhancement, but further analysis is required because no studies have considered this speculation.
Nevertheless, there is a limitation regarding the blood vitamin D levels measured in this study. Vitamin D is normally synthesized in the body through the action of ultraviolet light, but the effects of ultraviolet light in the present study are unknown, because the participants’ exposure to sunlight was not measured. Other study limitations include the facts that the control group was not given a placebo, leg strength may not have been accurately assessed because the effects of leg pain and other conditions were not considered when selecting the participants, and the 60-day period of intervention was short. Further research that addresses these limitations is needed to better characterize the effects of HMB on low physical function.


Conclusions

The findings of the present study suggest that daily consumption of 2.4 g of HMB (3.0 g of CaHMB) for 60 days (about 8 weeks) without additional exercise may improve muscular strength in older people with low physical function. Although the present study identified no gain in skeletal muscle mass or improvement in physical performance, and no association with blood vitamin D levels was found, it indicated that HMB may be a viable treatment for older adults with low physical function.


Acknowledgments: Satomi Furuzono and Yayoi Sakuraba kindly assisted with participant measurements and visit scheduling throughout the study, and the authors would like to express their gratitude to them. The authors also deeply appreciate the kind help of our managerial dietician colleagues Noriko Kojima, Kayoko Hattori, and Saki Tomita for working with the participants and supporting this work.

Author Contributions: Study concept and design: Kaori Kinoshita, Shosuke Satake, and Hidenori Arai. Acquisition of data: Kaori Kinoshita, Shosuke Satake, Yasumoto matsui, Shuji Kawashima, and Hidenori Arai. Analysis and interpretation of data: Kaori Kinoshita, Shosuke Satake, and Hidenori Arai. Drafting of the manuscript: Kaori Kinoshita. Critical revision of the manuscript for important intellectual content: Shosuke Satake, Yasumoto Matsui, Shuji Kawashima, and Hidenori Arai.

Conflicts of interest: This work was supported by grants from the Honjo International Scholarship Foundation and the Chukyo Longevity Foundation, and with funds from Abbott Japan Co., Ltd. The funders had no role in study design, data collection, analysis and interpretation, decision to publish, or preparation of the manuscript. Furthermore, none of the authors have any commercial or financial involvement in connection with this study that represent or appear to represent any conflicts of interest.

Ethical standards: This study has been approved by the research ethics committee of National Center for Geriatrics and Gerontology, Japan.

Funding Sources: Abbott Japan, Honjo International Scholarship Foundation, and Chukyo Longevity Foundation. The funders had no role in study design, data collection and analysis, decision to publish, or preparation of the manuscript.


References

1.    Xue Q L, Bandeen-Roche K, Varadhan R, Zhou J, Fried L P. Initial manifestations of frailty criteria and the development of frailty phenotype in the Women’s Health and Aging Study II. J Gerontol A Biol Sci Med Sci, 2008; 63(9): 984-90.
2.    Gill T M, Gahbauer E A, Allore H G, Han L. Transitions between frailty states among community-living older persons. Arch Intern Med, 2006; 166(4): 418-23.
3.    Bolster D R, Jefferson L S, Kimball S R. Regulation of protein synthesis associated with skeletal muscle hypertrophy by insulin-, amino acid- and exercise-induced signalling. Proc Nutr Soc, 2004; 63(2): 351-6.
4.    Volpi E, Mittendorfer B, Rasmussen B B, Wolfe R R. The response of muscle protein anabolism to combined hyperaminoacidemia and glucose-induced hyperinsulinemia is impaired in the elderly. J Clin Endocrinol Metab, 2000; 85(12): 4481-90.
5.    Volpi E, Kobayashi H, Sheffield-Moore M, Mittendorfer B, Wolfe R R. Essential amino acids are primarily responsible for the amino acid stimulation of muscle protein anabolism in healthy elderly adults. Am J Clin Nutr, 2003; 78(2): 250-8.
6.    Katsanos C S, Kobayashi H, Sheffield-Moore M, Aarsland A, Wolfe R R. A high proportion of leucine is required for optimal stimulation of the rate of muscle protein synthesis by essential amino acids in the elderly. Am J Physiol Endocrinol Metab, 2006; 291(2): E381-7.
7.    Van Koevering M,Nissen S. Oxidation of leucine and alpha-ketoisocaproate to beta-hydroxy-beta-methylbutyrate in vivo. Am J Physiol, 1992; 262(1 Pt 1): E27-31.
8.    Wilkinson D J, Hossain T, Hill D S, et al. Effects of leucine and its metabolite beta-hydroxy-beta-methylbutyrate on human skeletal muscle protein metabolism. J Physiol, 2013; 591(11): 2911-23.
9.    Giron M D, Vilchez J D, Salto R, et al. Conversion of leucine to beta-hydroxy-beta-methylbutyrate by alpha-keto isocaproate dioxygenase is required for a potent stimulation of protein synthesis in L6 rat myotubes. J Cachexia Sarcopenia Muscle, 2016; 7(1): 68-78.
10.    He X, Duan Y, Yao K, et al. beta-Hydroxy-beta-methylbutyrate, mitochondrial biogenesis, and skeletal muscle health. Amino Acids, 2016; 48(3): 653-64.
11.    Cruz-Jentoft A J. Beta-hydroxy-beta-methyl butyrate (HMB): From experimental data to clinical evidence in sarcopenia. Curr Protein Pept Sci, 2017.
12.    Holecek M. Beta-hydroxy-beta-methylbutyrate supplementation and skeletal muscle in healthy and muscle-wasting conditions. J Cachexia Sarcopenia Muscle, 2017; 8(4): 529-541.
13.    Wu H, Xia Y, Jiang J, et al. Effect of beta-hydroxy-beta-methylbutyrate supplementation on muscle loss in older adults: a systematic review and meta-analysis. Arch Gerontol Geriatr, 2015; 61(2): 168-75.
14.    Chen L K, Liu L K, Woo J, et al. Sarcopenia in Asia: consensus report of the Asian Working Group for Sarcopenia. J Am Med Dir Assoc, 2014; 15(2): 95-101.
15.    Podsiadlo D,Richardson S. The timed “Up & Go”: a test of basic functional mobility for frail elderly persons. J Am Geriatr Soc, 1991; 39(2): 142-8.
16.    Flakoll P, Sharp R, Baier S, et al. Effect of beta-hydroxy-beta-methylbutyrate, arginine, and lysine supplementation on strength, functionality, body composition, and protein metabolism in elderly women. Nutrition, 2004; 20(5): 445-51.
17.    Fuller J C, Jr., Baier S, Flakoll P, et al. Vitamin D status affects strength gains in older adults supplemented with a combination of beta-hydroxy-beta-methylbutyrate, arginine, and lysine: a cohort study. JPEN J Parenter Enteral Nutr, 2011; 35(6): 757-62.
18.    Kuriyan R, Lokesh D P, Selvam S, et al. The relationship of endogenous plasma concentrations of beta-Hydroxy beta-Methyl Butyrate (HMB) to age and total appendicular lean mass in humans. Exp Gerontol, 2016; 81: 13-8.
19.    Guerra R S, Amaral T F, Sousa A S, et al. Handgrip strength measurement as a predictor of hospitalization costs. Eur J Clin Nutr, 2015; 69(2): 187-92.
20.    Chan O Y, van Houwelingen A H, Gussekloo J, Blom J W, den Elzen W P. Comparison of quadriceps strength and handgrip strength in their association with health outcomes in older adults in primary care. Age (Dordr), 2014; 36(5): 9714.
21.    Mendes A E, Nascimento L, Mansur L L, Callegaro D, Jacob Filho W. Tongue forces and handgrip strength in normal individuals: association with swallowing. Clinics (Sao Paulo), 2015; 70(1): 41-5.
22.    Butler S G, Stuart A, Leng X, et al. The relationship of aspiration status with tongue and handgrip strength in healthy older adults. J Gerontol A Biol Sci Med Sci, 2011; 66(4): 452-8.
23.    Girgis C M, Clifton-Bligh R J, Mokbel N, Cheng K, Gunton J E. Vitamin D signaling regulates proliferation, differentiation, and myotube size in C2C12 skeletal muscle cells. Endocrinology, 2014; 155(2): 347-57.

DOES TAILORED NUTRITIONAL GUIDANCE ENCOURAGE OLDER CAREGIVERS TO INCREASE THEIR PROTEIN INTAKE? THE CARENUTRITION TRIAL (RCT)


S. Kunvik1,2, R. Valve2, M. Salonoja1, M.H. Suominen3


1. The Social Services and Healthcare Centre of Pori, Finland; 2. Department of Food and Nutrition, University of Helsinki, Finland; 3. Unit of Primary Health Care, Helsinki University Central Hospital, Finland.

Corresponding Author: S. Kunvik, The Social Services and Healthcare Centre of Pori, Finland, susanna.kunvik@gmail.com

J Aging Res Clin Practice 2018;7:136-142
Published online October 15, 2018, http://dx.doi.org/10.14283/jarcp.2018.23


Abstract

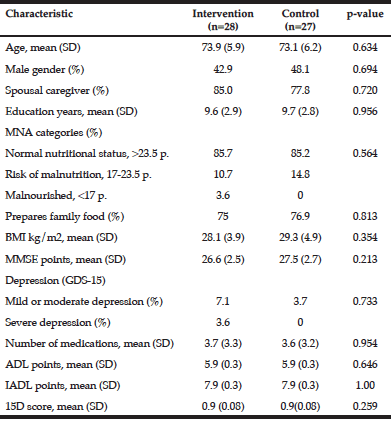
Background: Older caregivers, males especially, are vulnerable to nutritional problems. Low intake of protein is common and can affect their nutrition and health. Objectives: The aim in this RCT was to investigate the effect of tailored nutritional guidance on protein intake among caregivers aged ≥65 years with protein intake under recommendations (≤1.2 g/kgBW/d). Subgroup analysis were made with male caregivers. Design: Data from the CareNutrition randomized controlled trial (RCT). Setting: Community-dwelling caregivers from the Western part of Finland. Participants: Total of 55 caregivers (n=28 intervention group (IG), n=27 control group (CG)) with protein intake of under 1.2 g/kgBW/d at baseline. 45.5% were male (n=12 male intervention group (MIG), n=13 male control group (MCG)). Intervention: During the six-month intervention tailored nutritional guidance was given to the intervention group during home visit (once) and in group meetings (2-4 times), complemented with written material. Written material was offered to control group. Measurements: Protein intake was assessed with three-day food diary at baseline and final measurements. Main outcome measure was change in protein intake (g/kg bodyweight (BW)/d), analysed among participants with protein intake under 1.2 g/kgBW/d at baseline. Participant characteristics were evaluated with validated methods. Results: Mean protein intake was 0.86 g/kgBW/d in IG and 0.85 g/kgBW/d in CG and among males, 0.89 g/kgBW/d in MIG and 0.79 g/kgBW/d in MCG. There was no significant difference in the change in protein intake between IG and CG. Protein intake increased among MIG by 0.11 g/kgBW/d and decreased in MCG group by -0.07 g/kgBW/d, p=0.007. There was also a significant increase in protein intake within the IG (+0.10 g/kgBW/d, p=0.038). Conclusions: Tailored nutritional guidance resulted in improved protein intake among older male caregivers. Group-based nutritional guidance may boost nutrition among older caregivers, especially males.

Key words: Caregivers, elderly, protein intake, nutritional guidance.


Introduction

Older caregivers are at an increased risk for nutritional problems, such as decreased nutritional status and poor nutrient intake (1-3). Heavy burden, depression, health problems and changes in appetite and food preferences may result in malnutrition (4-8). A low intake of protein is common and can affect caregivers` nutrition and health (1, 2).
Protein is a key nutrient in maintaining muscle health in older people (9). Progressive loss of muscle mass can lead to muscle weakness and physical limitations (10). Given the particularly important role of physical performance in caregiving, carers need sufficient protein in their diets. The consumption of protein-rich foods may decrease with advancing age and reduced food intake (11). Hence, there is a need to find ways of encouraging older people to increase their protein intake in their daily diets (12).
Even though caregivers are prone to nutritional problems, only few interventions have targeted this group of individuals (13), and nutrition education has only occasionally been a component of caregiver education and support programmes (14). Nutritional guidance could be effective in improving well-being and health (14), as well as nutrient intake (15). Male caregivers have been identified as a special group needing guidance. Weak cooking skills and lack of nutritional knowledge have been associated with a poor dietary quality among older males (16, 17). Being male is also known to be associated with poor nutrient intake and increased concern about nutrition among caregivers (18, 19).
The purpose of this article was to assess the effectiveness of tailored nutritional guidance on nutrient intake, especially of proteins, among caregivers aged ≥65 years with protein intake under recommendations (≤1.2 g/kgBW/d). Special attention was given to male caregivers based on subgroup analysis.


Methods

In this article we used the data of CareNutrition randomized controlled intervention trial, which explores the effectiveness of tailored nutritional counselling on protein intake among older caregivers (≥65) with normal cognition. The six-month intervention included tailored nutritional guidance during home visits and in group meetings, complemented with written material. The main outcome measure was the change in protein intake (g/kgBW)/d). Our focus in this article is on participants with a protein intake of under 1.2 g/kgBW/d (nutrition recommendation in Finland and intervention target) at baseline according to three-day food diaries. Special concerns arose among male caregivers based on subgroup analysis.
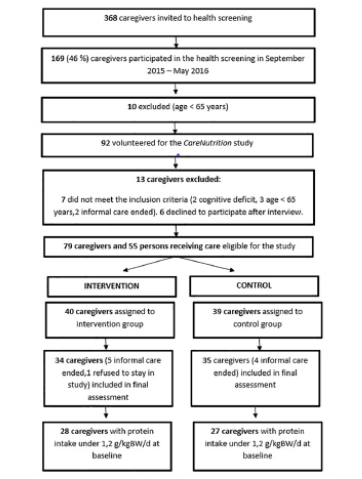
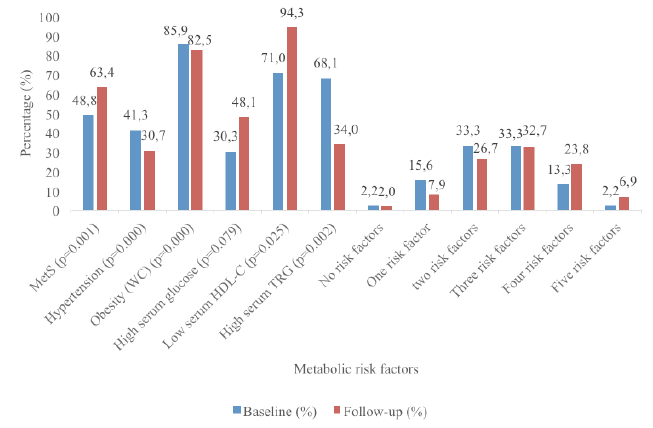
The participants were recruited following the health screening of caregivers. The recruitment procedure and inclusion criteria in CareNutrition trial are described in Figure 1, and in a previous article (2). The inclusion criteria were: age of ≥65, officially confirmed caregiver status, living at home, and normal cognition (MMSE points ≥25 geriatric assessment). The study was approved by the Ethics Committee of the Hospital District of Southwest Finland. Informed consent was obtained from each participant. The trial was described and registered at Australian New Zealand Clinical Trials Registry, Trial Id: ACTRN12615001254583.

Figure 1 Study flow chart

Figure 1
Study flow chart

Measurements

Baseline measurements were taken during two different appointments: the nurse’s health screening and the nutritionist’s home visit. The following measures were used: the MMSE (20) for cognition; the Katz index (21) for activities of daily living (ADL); the Lawton-Brody questionnaire (22) for instrumental activities of daily living (IADL); the 15D instrument (23) for health-related quality of life (HRQol); the Geriatric Depression Scale (GDS-15) (24) for depression; and an open question for information on medication. An experienced geriatrician reviewed the health-screening papers and recommended examinations if needed. Following the appointment with the nurse, a nutritionist made a home visit to screen nutritional status in line with the MNA (25). Nutrient intake was measured via three-day food diaries at baseline and at final measurements. The Finnish National Food Composition Database was used to analyse food intake. Check calls were made to confirm the amounts and types of food being consumed and to assess possible underreporting. Ideal bodyweight was used to calculate protein intake g/kgBW/d: if body mass index (BMI) was 20 – 30 kg/m2 we used the actual BMI, if under 20 kg/m2 we adjusted it to 20, and if above 30 kg/m2 we adjusted it to 30. Post-intervention feedback was gathered from intervention group by means of a structured questionnaire by mail.

Randomization

After baseline measurements and inclusion, the caregivers were randomly allocated one by one to the intervention (IG) or the control group (CG) according to a computer-generated, blocked randomization list. The person who carried out the randomization was unrelated to the investigation and unfamiliar with the procedure. From this sample, subgroup analysis was made with male intervention group (MIG) and male control group (MCG).

Intervention

The intervention continued for six months. During this period members of the intervention group were given tailored nutritional guidance in their homes on one occasion (1 – 2 hours), and they had the opportunity to attend between two and four group meetings (Table 1). The key person in the intervention, who gave tailored nutritional guidance at the caregiver’s home and arranged the group meetings, was a trained nutritionist.
The nutritionist visited the caregivers’ homes at the beginning of the intervention. Nutritional guidance was based on the participant’s nutritional status, nutrient intake and background information, and on discussion with the nutritionist. An ideal level of protein intake was then calculated for each participant, who was given a written nutritional care plan and other material.
The nutritional care plan and guidance highlighted the positive factors in the participants’ diets, such as adequate energy intake and the use of good protein sources (e.g. quality, quantity, distribution during the day). The nutritionist and the caregiver discussed appropriate nutritional aims, which were included in the care plan.  The main aims usually related to finding easy and practical ways of increasing protein intake. The participants were given booklets about healthy nutrition.
Each caregiver had the opportunity to attend between group discussions (held 4 times) and cooking courses (held 2 times) during the six-month period. The aim of the discussions was to provide peer support and to reinforce the nutritional message. The nutritionist guided the conversations as the caregivers discussed their situations at home, with a view to focusing on cooking and nutrition. Each discussion lasted for 1.5 – 2 hours. The cooking sessions (2.5 hours) focused on protein-rich and traditional foods.  Each session included a short 15-minute discussion about healthy nutrition. Dishes were prepared and enjoyed together.
Members of the control group received normal community care if necessary and were given a booklet about healthy nutrition. Nutritional guidance in the form of a home visit and a nutrition care plan was offered after the final measurements.

Table 1 Overview of the tailored nutritional intervention and the procedures followed in the control group

Table 1
Overview of the tailored nutritional intervention and the procedures followed in the control group

Statistical analyses

CareNutrition trial sample size was calculated based on the participants` expected change in protein intake. With a standard deviation (SD) of 0.3 (1) and type-1 error of 5% and at a power of 80% per cent and an expected change in protein intake from 1 g/kgBW/d (1) to 1.2 g/kgBW/d in the intervention group, and with no change in the control group, each group would require 51 persons (accounting for drop-out) to show statistical significance. From this sample we analysed participants with protein intake under 1.2 g/kgBW/d at baseline in this article. Subgroup analyses were made with male caregivers.
The results are presented as means with SDs or as percentages, with 95% confidence intervals for the major outcomes. Statistical differences between the groups (IG vs. CG and MIG vs. MCG) were determined by t-tests, Mann Whitney U-test, Chi Square test or Fisher´s exact test. The main outcome measures were subjected to an analysis of covariance (ANCOVA): age, gender, BMI and value at baseline were added to model as covariates. In the case of violation of the assumptions (e.g. non-normality), a bootstrap-type test was used. SPSS version 22.0 (SPSS, Inc., Chicago, IL) and STATA 14.1 were used in statistical analyses.


Results

Baseline characteristics

A total of 69 caregivers completed the CareNutrition trial (Figure 1) of whom 55 caregivers (n=28 IG, n=27 CG) had protein intake of under 1.2 g/kgBW/d at baseline (sample in this article). Table 2 gives the baseline characteristics of the IG and CG. The mean age of the participants was 73.5 (SD 6.0) years, and most (81.8%) were spousal caregivers. 45.5% were male (n=12 MIG, n=13 MCG) with a mean age of 74.4 years (SD 6.4).

Table 2 Baseline characteristics of the caregivers in the IG and CG

Table 2
Baseline characteristics of the caregivers in the IG and CG

Most of the caregivers (85.5%) had a good nutritional status (MNA points >23.5), 12.7% were at risk of malnutrition (MNA points 17–23.5) and one person (1.8%) suffered from malnutrition (MNA points <17).   Of all the caregivers, 75.7% prepared their family meals themselves, but only half (50%) of the males did so (difference between females, p=0.001). Levels of cognition were good (mean MMSE score 27.1, SD 2.6), as was physical functioning according to the ADL and IADL scores. The male caregivers had lower IADL scores than female, indicating weaker instrumental activities of daily living (7.8 (0.4) points vs. 8.0 (SD 0.0) points, p=0.003). Most participants were of normal weight (mean BMI 28.7 kg/m2, SD 4.4), the mean number of medications was 3.6 (SD 3.2) and HRQoL was good (15D score 0.9, SD 0.08). According to the GDS-15, 5.5% suffered from mild or moderate depression and one person from severe depression. There were no differences between the groups at baseline (IG vs. CG and MIG vs. MCG).

Protein and energy intake at baseline

Mean protein intake was 0.86 (SD 0.17) g/kgBW/d in IG and 0.85 (SD 0.17) g/kgBW/d in CG, p=0.73. Among males, protein intake was 0.89 (SD 0.18) g/kgBW/d in MIG and 0.79 (SD 0.16) g/kgBW/d in MCG, p=0.18. There were no statistical differences between groups.
The mean energy intake among IG was 1433 (SD 295) kcal/d and among CG 1642 (SD 340) kcal/d, p=0.18 (Table 3). Among males, energy intake at baseline in the MIG was 1558 (SD 256) kcal/d and among MCG 1800 (SD 296) kcal/d. MCG had greater energy intake (p=0.004).

Table 3 Mean levels of energy and protein intake and changes from baseline to six months in the IG and CG

Table 3
Mean levels of energy and protein intake and changes from baseline to six months in the IG and CG

*p-value for statistical test between IG and CG; adjusted for age, gender, BMI and value at baseline

Changes in protein and energy intake after six months

The mean change in protein intake from baseline to six months was +0.10 (SD 0.2) g/kgBW/d in the IG and +0.04 (SD 0.2) g/kgBW/d in the CG. There were no significant differences between the groups (p=0.26), but there was a significant increase within IG from baseline to the final measurements; from 0.86 (SD 0.17) g/kgBW/d to 0.96 (SD 0.25) g/kgBW/d, p=0.038.
There was a significant difference in the change in protein intake between the two groups of male caregivers: it increased in the MIG 0.11 (SD 0.22, CI -0.01 – 0.22) g/kgBW/d and decreased in the MCG -0,07 (SD 0.19, CI -0.19 – 0.04) g/kgBW/d (p=0.007). Total intake in the MIG was thus 1.0 g/kgBW/d at the final measurement, compared with 0.72 g/kgBW/d in the MCG.
The mean change in energy intake from baseline to six months was +102 kcal/d (SD 254) in the IG and +37 (SD 430) kcal/d in the CG, with no statistical difference between groups (p=0.49), (Table 3). Within IG there was a statistical increase in energy intake (p=0.043). Among males, there was a significant difference in the change in energy intake: an increase of 97 (SD 254) kcal/d in the MIG and a decrease of -192 (SD 426) kcal/d in the MCG, (p = 0.05).
Related to energy intake, the BMI in the CG decreased from 29.3 kg/m2 to 28.8 kg/m2 (- 0.5 (SD 1.0) kg/m2, p=0.014). There were no changes in other groups.

Feedback from the intervention

All intervention group caregivers received nutritional guidance at home once during the intervention. According to feedback 70.4% of caregivers in the IG though the nutritionist`s home visit was useful (males 83.3%) as well as nutritional guidance (74.7%, males 83.3%). A total of 75% of the caregivers went to the group meetings and they were considered useful (60%, males 66.7%). We found no statistical differences between males and females in the feedback.


Discussion

We found in this study that tailored nutritional guidance seems to encourage increased protein intake in older (≥65) caregivers, although there were no statistically significant differences between the intervention and the control group. However, the intervention was effective among male caregivers who received tailored nutritional guidance in that their intake of protein and energy increased during the six-month intervention.
We selected change in protein intake as the main outcome measure based on previous studies indicating a protein intake among older caregivers of less than the recommended level (1). The protein intake at baseline among the caregivers we studied was only 0.85 – 0.86 g/kg IBW/d, which is lower than the 1.2–1.4 g/kg/d recommended in Finland (26). The amount of dietary protein tends to decline progressively with advancing age due to reduced energy needs and intake, the loss of appetite and difficulties in acquiring and preparing food, although the caregivers in this study were in quite good physical shape (ADL, IADL). Our intervention target was to increase the protein intake to ≥1.2 g/kg BW/d on the grounds that it may help older caregivers to retain the muscle mass and good physical functioning required for taking care of another person (12,27-29,36,37). We found statistically significantly increased protein intake in the IG, from 0.86 g/kgBW/d to 0.96 g/kgBW/d, after the six-month nutritional intervention, but the difference between IG and CG was not significant.
Nutritional intervention was especially effective among male caregivers, whose protein intake increased in MIG from 0.89 g/kgWB/d to 1.0 g/kgBW/d and decreased in MCG from 0.79 g/kgBW/d to 0.72 g/kg/BW/d. There are several factors that could explain why male benefitted more from the nutritional guidance. Only half of these male caregivers prepared their family meals, and hence may need more guidance. Taking on a caregiver`s role changes the situation at home if the person concerned is not familiar with household activities. Cooking and shopping have traditionally been women`s work in this age group (30), hence older males may have weak cooking skills and inadequate nutritional knowledge (17,30): both factors have been associated with a poor-quality diet (16,17). Male gender is also known to be associated with poor nutrient intake and increased concerns about nutrition in caregivers (18,19). According to the feedback in our study, male caregivers were satisfied with the nutritional intervention. It has been suggested that community-based nutrition and cooking guidance are beneficial educational activities among older male (31). Our results support findings implying that older male caregivers need special support to cope with household activities, and that combining nutritional guidance with practical learning may be an effective way of doing this.
We did not reach the intervention target of 1.2 g/kg BW/d in protein intake. One reason for this may be that the protein intake of the caregivers at baseline was lower than expected. Also, we were not able to recruit enough participants in each group, which weakens the statistical power of the sample: with sample-size calculations of 102 participants, only 69 caregivers completed CareNutrition trial, of whom 55 had protein intake under 1.2 g/kgBW/d at baseline. Therefore, the sample in this article is quite small. In addition, protein intake also increased slightly in CG, even though not statistically significantly. This may have been because at the beginning of the trial CG also received written nutritional material, which highlighted the importance of proper protein intake. Control-group contamination could also explain the increase in protein intake, in that the trial was conducted in a small city and the participants may have known each other from the caregivers’ peer-support groups and events. Adequate protein intake was highlighted in the guidance and this message may have spread. Moreover, the Hawthorne effect, meaning that individuals modify some aspects of their behaviour in response to their awareness of being observed, is typical in intervention studies (32). Nevertheless, there is a notable benefit of an increase in protein intake among the caregivers in this study: a protein intake of 1.0 g/kg BW/d has several positive effects, including protection against weight loss and the maintenance of physical functioning (12,33,38).
The mean increase in protein intake in IG and MIG was 0.1 g/kgBW/d, which is in line with results reported earlier in similar interventions conducted among people with Alzheimer`s disease (13). A systematic review and meta-analysis of individualized dietary counselling for nutritionally at-risk older patients reported a mean increase in total protein intake of 10.13 g/d (34). The mean increase of 0.1 g/kgBW/d in protein intake in our study means about 7.0 – 7.7g total increase among persons weighing 70 kg, which corresponds to two decilitres of milk or yoghurt, one egg or four slices of meat for example. Our results indicate that the total increase in protein intake following nutritional guidance could be compared to one snack. Effective way of increasing protein intake among older persons is to offer familiar protein-rich foods. Interventions targeted at older people should be achievable and acceptable in the long term and should be easily incorporated into their dietary pattern. It is for this reason that food-based strategies rather than supplemental drinks could be recommended as an initial approach to optimising protein intake (12). The caregivers in our study were advised on how to add familiar protein-rich foods to their daily diets. Nutritional aims were discussed with them, which increased their motivation to make dietary changes.
The six-month intervention also led to an increase in energy intake in the IG and the MIG of 102 and 97 kcal, respectively. In addition, the energy intake of those in MCG decreased by almost 200 kcal/d. We observed a decrease in BMI only in the CG, which also indicates sufficient energy intake in the intervention groups. Even though the increase in energy intake is small, it is significant in terms of protein bioavailability: if there is insufficient energy intake, protein is used as an energy source (12). It is also noteworthy that the caregivers in this study did not seem to increase their protein intake at the cost of sufficient energy intake, which could have happened if energy-dense foods had been replaced with protein-rich foods such as dairy products that tend not to contain a lot of energy.
The strength of our study is that it provides important information on protein intake and the effectiveness of tailored nutritional counselling targeted at older caregivers. A few similar studies (13) have been conducted, but to our knowledge this is the first RCT reporting the effects of nutritional guidance on protein intake among older caregivers. Our study was conducted as a randomized controlled trial, which is an efficient method for determining cause-effect relationships. Tailored nutritional guidance facilitated the giving of personal nutritional advice, which is important given the dietary heterogeneity. Nutrient intake was assessed by means of a three-day food diary, which is considered a good way of evaluating nutrition among older people (35).
Nevertheless, our study has some potential limitations. Because of the specificity of our recruitment and the fact that many caregivers did not have the energy or the interest to participate, the number of informants was small, and the study population was selective. This weakens the generalizability of the findings. Selection bias is also possible because the participants were in quite good physical shape and were keen to be involved. This may indicate that they were more health conscious than the average older population and could affect the efficacy of the intervention. Nutrient intake was assessed from three-day food diaries, which could have affected the results through over- or underreporting. Three days may not be long enough to show actual food intake over a longer period. However, we made check calls to confirm the amounts and types of food being consumed and participants had fairly stable food habits, as older people usually do.


Conclusion

Our results show that tailored nutritional guidance was effective in terms of enhancing protein and energy intake among older (≥65 y) male caregivers, and thus may be useful for all older caregivers. These findings highlight the importance of and need for preventive nutritional guidance. Further studies are required to obtain more information about nutrient intake among older caregivers, and there is a need for more targeted interventions, especially for male.


Funding: The CareNutrition study received funding from the National Institute for Health and Welfare (THL) in Finland. The funder had no role in the design and conduct of the study; in the collection, analysis, and interpretation of data; in the preparation of the manuscript; or in the review or approval of the manuscript.The authors are independent researchers and are not associated with the funders.

Conflict of interest: Mrs. Kunvik reports grant from Satakunta Hospital District, Finland, during the conduct of this article. Other authors declare that they have no conflicts of interest directly relevant to this report. However, Dr Suominen reports co-operating professionally with Nutricia Medical and Verman.

Ethical standard: This study was conducted according to the guidelines laid down in the declaration of Helsinki and all procedures were approved by the Ethics Committee of the Hospital District of Southwest Finlan. Informed consent was obtained from each participant.


References

1.    Puranen T, Jyvakorpi S, Pitkala K et al. Nutritional intervention of patients with Alzheimer’s disease living at home with their spouse: a randomized controlled trial: baseline findings and feasibility. J Aging Res Clin Practice. 2013;2:236-241.
2.    Kunvik S, Valve R, Salminen K et al. Baseline findings of CareNutrition intervention (RCT) among older caregivers – risk of malnutrition and insufficient protein intake. Journal of Aging Research & Clinical Practice. 2017;6.
3.    Torres MJ, Dorigny B, Kuhn M et al. Nutritional Status in Community-Dwelling Elderly in France in Urban and Rural Areas. 2014;9:e105137.
4.    Schulz R, Martire LM. Family caregiving of persons with dementia: prevalence, health effects, and support strategies. Am J Geriatr Psychiatry. 2004;12:240-249.
5.    Doran T, Drever F, Whitehead M. Health of young and elderly informal carers. BMJ. 2003;327:1388.
6.    Sörensen, S, Pinquart M, & Duberstein P. How effective are interventions with caregivers? An updated meta-analysis. The gerontologist. 2002;42(3):356-372.
7.    Aggarwal B, Liao M, Christian A, Mosca L. Influence of caregiving on lifestyle and psychosocial risk factors among family members of patients hospitalized with cardiovascular disease. J Gen Intern Med. 2009;24(1):93-8.
8.    Alzheimer’s Disease International. World Alzheimer Report. The global economic impact of dementia.2010. http://www.alz.co.uk/research/files/ WorldAlzheimerReport2010.pdf. (Accessed 6 January 2018).
9.    Baum JI, Kim IY, Wolfe RR. Protein Consumption and the Elderly: What Is the Optimal Level of Intake? Nutrients. 2016;8.6:359.
10.     Forbes SC, Little JP, Candow DG. Exercise and nutritional interventions for improving aging muscle health.Endocrine. 2012;42.1:29-38.
11.    Volpi E, Campbell W, Dwyer JT et al. Is the optimal level of protein intake for older adults greater than the recommended dietary allowance?. Journals of Gerontology Series A: Biomedical Sciences and Medical Sciences. 2012;68(6):677-681.
12.    Nowson C & O’Connell S. Protein requirements and recommendations for older people: a review. Nutrients. 2015;7.8:6874-6899.
13.    Suominen MH., Puranen TM, Jyväkorpi S et al. Nutritional guidance improves nutrient intake and quality of life,and may prevent falls in aged persons with Alzheimer disease living with a spouse (NuAD trial). The journal of nutrition, health & aging. 2015;19.9:901-907.
14.    Silver HJ, & Wellman NS. Nutrition education may reduce burden in family caregivers of older adults. Journal of nutrition education and behavior. 2002;34:S53-S58.
15.    Baldwin C, & Weekes CE. Dietary counselling with or without oral nutritional supplements in the management of malnourished patients: a systematic review and meta-analysis of randomised controlled trials. Journal of Human Nutrition and Dietetics. 2012;25.5:411-426.
16.    Baker AH, Wardle J. Sex differences in fruit and vegetable intake in older adults. Appetite. 2003;40.3:269-275.
17.    Hughes G, Bennett KM & Hetherington MM. “Old and alone: barriers to healthy eating in older men living on their own”. Appetite. 2004;43.3:269-276.
18.    Puranen TM, Pietila SE, Pitkala K et al. Caregivers’ male gender is associated with poor nutrient intake in AD families (NuAD-trial). J.Nutr.Health Aging. 2014;18.7:672-676.
19.    Fjellstrom C, Starkenberg A, Wesslen A et al. To be a good food provider: an exploratory study among spouses of persons with Alzheimer’s disease.American Journal of Alzheimer’s Disease and Other Dementias. 2010;25.6:521-526.
20.    Folstein MF, Folstein SE, McHugh PR.  “Mini-mental state”. A practical method for grading the cognitive state of patients for the clinician. J Psychiatr Res. 1975;12:189-198.
21.    Katz S, Ford AB, Moskowitz RW et al. Studies of Illness in the Aged. the Index of Adl: a Standardized Measure of Biological and Psychosocial Function. JAMA. 1963;185:914-919.
22.    Lawton MP, Brody EM. Assessment of older people: self-maintaining and instrumental activities of daily living. Gerontologist. 1969;9:179-186.
23.    Sintonen H. The 15D instrument of health-related quality of life: properties and applications. Ann Med 2001;33:328-336.
24.    Yesavage JA, Brink TL, Rose TL et a. Development and validation of a geriatric depression screening scale. J Psychiatr Res. 1983;17:37-49.
25.    Vellas B, Guigoz Y, Garry PJ et al. The Mini Nutritional Assessment (MNA) and its use in grading the nutritional state of elderly patients. Nutrition. 1999;15:116-122.
26.    Finnish Nutrition Recommendations.  National Nutrition Council. Health from food – The Finnish Dietary Guidelines.2014.
27.    Pedersen AN, Cederholm T. Health effects of protein intake in healthy elderly populations: a systematic literature review. Food Nutr Res. 2014;58.
28.    Lancha AH,Jr, Zanella R,Jr, Tanabe SG et al.Dietary protein supplementation in the elderly for limiting muscle mass loss. Amino Acids. 2017;49:33-47.
29.    Genaro Pde S, Pinheiro Mde M, Szejnfeld VL, Martini LA. Dietary protein intake in elderly women: association with muscle and bone mass. Nutr Clin Pract. 2015;30.2:283-289.
30.    Roos G, Prattala R & Koski K. Men, masculinity and food: interviews with Finnish carpenters and engineers. Appetite. 2001;37.1:47-56.
31.    Keller HH, Gibbs A, Wong S et al. Men can cook! Development, implementation, and evaluation of a senior men’s cooking group. J Nutr Elder. 2004;24.1:71-87.
32.    Koh ET & Owen WL. Introduction to nutrition and health research. Springer Science & Business Media. 2012.
33.    Gray-Donald K, Arnaud-McKenzie DS, Gaudreau et al. Protein Intake Protects against Weight Loss in Healthy Community-Dwelling Older Adults, 2. The Journal of nutrition. 2013;144.3:321-326.
34.    Munk T, Tolstrup U, Beck AM et al. Individualised dietary counselling for nutritionally at-risk older patients following discharge from acute hospital to home: a systematic review and meta-analysis. Journal of human nutrition and dietetics. 2016;29.2:196-208.
35.    Thompson, FE & Byers T. Dietary assessment resource manual. Journal of Nutrition.1994; 2245S-2317S.
36.    Wolfe RR. The role of dietary protein in optimizing muscle mass, function and health outcomes in older individuals. Br J Nutr. 2012;108::S88-93.
37.    Morley JE, Argiles JM, Evans WJ et al. Nutritional recommendations for the management of sarcopenia. J Am Med Dir Assoc. 2010;11:391-396.
38.    Bauer J, Biolo G, Cederholm T et al. Evidence-based recommendations for optimal dietary protein intake in older people: a position paper from the PROT-AGE Study Group. J Am Med Dir Assoc. 2013;14:542-559.

THE NOVEL FRAILTY INDEX (NFI) CORRELATES WITH A VALUE OF PHASE ANGLE AND MNA IN HOSPITALISED AND FREELIVING ELDERLY – PRELIMINARY REPORT


E. Wernio1, J.A. Dardzińska1, H. Kujawska-Danecka2, A. Hajduk2, Z. Zdrojewski2, S. Małgorzewicz1


1. Department of Clinical Nutrition and Dietetics, Medical University of Gdańsk, Poland; 2. Department of Internal Medicine, Connective Tissue Diseases and Geriatrics, Medical University of Gdańsk, Poland

Corresponding Author: Jolanta Anna Dardzińska M.D., Ph. D. Department of Clinical Nutrition, Medical University of Gdańsk, Dębinki St. 7, 80-211 Gdańsk, Poland, e-mail: annadar@gumed.edu.pl, Tel/Fax: +48 58 349 27 23

J Aging Res Clin Practice 2018;7:123-127
Published online October 15, 2018, http://dx.doi.org/10.14283/jarcp.2018.21


Abstract

Introduction: To improve the quality of life and health of the elderly, attention is paid to the early detection of frailty syndrome. Unfortunately, one simple and practical screening tool has not been established yet. Recently came the proposal of the Novel Frailty Index (NFI) created by Yamada and Arai. Therefore, the purpose of this study was to assess the relationship between nutritional status and NFI of the elderly. Materials and methods: In a group of 67 elderly patients (27 hospitalised and 40 living in the home environment) we used the NFI and evaluated nutritional status with the use of full-MNA together with SNAQ (appetite questionnaire), manual dynamometry and bioimpedance analysis. Results: Based on the NFI results, frailty syndrome was diagnosed in more than half of hospitalised elderly. The syndrome was significantly less prevalent in free-living older people (15% vs 63%, p<0.001).We found the significant correlations of NFI values with age (r=0.031, p=0.03), co-morbidity(r=0.295, p=0.016), phase angle (r=-0.407, p<0.001), full-MNA score (r=-0.515, p<0.001). Conclusions: Our preliminary results suggest the relevant association between NFI results and age, phase angle as well comorbidity and nutritional status. So further evaluation of NFI as a screening tool for frailty syndrome diagnose is needed.

Key words: Novel frailty index, elderly, nutritional status, malnutrition.

Abbreviations: BIA: Bioelectrical impedance analysis; BMI: Body Mass Index; ESPEN: European Society for Clinical Nutrition and Metabolism; MNA: Mini Nutritional Assessment; MM: Muscle mass; MMI: Muscle mass index; NFI: the Novel Frailty Index by Yamada and Arai; SNAQ: Simplified Nutritional Appetite Questionnaire.


Introduction

The life expectancy is constantly increasing. By the end of 2014, the number of people reaching the advanced age constituted 22.2% of the Polish population. This percentage will increase and probably in 2050 more than 40% of all Poles will reach at least 60 years (1). To the important medical problems in the elderly populations belong also the frailty syndrome. It has recently attracted the attention of both scientists and clinicians. Unfortunately, there is still lacking a widely accepted definition of this state and, what is even more important, simple criteria for recognition (2). Recently a new tool to screen for frailty was developed by Yamada and Arai.  It is the 5-question self-report questionnaire, that includes nutrition/shrinking, physical function, physical activity, forgetfulness and emotion/exhaustion.  The answers are scored 0/1 points, so the total score is from 0 to 5 points.  Obtaining 3 or more points by the respondent is intended for the presence of the frailty syndrome (3). The new index was presented at the ESPEN (European Society for Clinical Nutrition and Metabolism) Congress in 2016 by Suzuki et al. as Novel Frailty Index (NFI) and frailty assessment based on it was associated with malnutrition and predicted prognosis in outpatients with chronic heart failure (4).
The inseparable characteristics of the frailty syndrome include the risk of developing malnutrition or existing malnutrition and related loss of muscle mass and function. For many years, the MNA has met expectations for a simple, useful tool for assessing the nutritional status of the elderly in clinical practice (5).  Both parts of MNA (Short Form and Assessment) are characterised by high sensitivity and specificity (6).
So the aim of our study was to compare the results of the NFI evaluation with the effects of the traditional nutritional assessment using the Full-MNA, SNAQ, manual dynamometry and bioimpedance analysis in the group of elderly people.


Material

The study group consisted of 67 elderly patients, including 27 patients hospitalised at the clinical hospital in Gdańsk, in the Department of Pneumology and Allergology and in the Department of Geriatrics. The control group was composed of 40 healthy volunteers in age >65 years old. The study was conducted in October 2016 y.
In Table 1 the characteristic of the study group is presented.

Table 1 Characteristics of the studied population

Table 1
Characteristics of the studied population

Legend: BMI-body mass index.


The average age of hospitalised elderly was notably higher compared to those living in the environment (73.9 vs 69.0,  p=0.012), they had also more chronic disease than control group (3 vs 2, p=0.006) (Tab.1).
Main causes of hospitalisation of studied group were chronic obstructive pulmonary disease (in 25% of women, 53% of men). The other reasons for admitting to a hospital ward were hypertension (in 17% of women, 8% of men), diabetes type 2 (in 17% of women and 17% of men), asthma (in 17% of women, 8% of men). Furthermore, in the female group – psoriasis (7%), acute myeloid leukaemia (7%), Sjögren’s syndrome (7%) and in male group coronary artery disease (8%), rheumatic polymyalgia (8%) constituted reasons for hospitalisation.
Free-living elderly suffered mainly from hypertension (in 57% of women, 80% of men), hypercholesterolemia (in 43% of women, 30% of men), coronary artery disease (in 7% of women, 10% of men), hypothyroidism (in 17% of women). In addition gastritis (7% of women), hiatus hernia (in 3% of women, 20% of men), Sjögren’s syndrome (in 3% of women), celiac disease (in 3% of women), prostatic hyperplasia (in 10% of men), chronic obstructive pulmonary disease (in 10% of men) were present in free-living elderly.
The inclusion criteria were: age ≥65 and informed consent to participate in the study.
The exclusion criteria were: disagreement and lack of ability to cooperate, a severe condition of the patient making impossible to answer questions. People with cardioverter defibrillator were also excluded due to the inability to evaluate body composition by electric bioimpedance.
The work was performed as part of the research number 02-0048 and conducted in the Department of Clinical Nutrition, Medical University of Gdansk. The study was approved by the University Ethics Committee.


Methods

The medical history was taken from all participants. Body height (cm) and body weight (kg) were examined. Based on the obtained data BMI [kg/m2] as weight [kg] /height [m] were calculated.
The measurement of hand grip strength was carried out using an analog hand-held dynamometer (Baseline 12-0240, USA) in the upright position, with the arm lowered along the torso and the dynamometer firmly in the palm of the hand. Norms for HGS >20kg for women and >30kg for men were adopted from The European Working Group on Sarcopenia in Older People (27).
Body composition was assessed by electric bioimpedance using the Maltron BioScan 920-2 analyser, which is a four-frequency device (5 kHz, 50 kHz, 100 kHz and 200 kHz). Four self-adhesive electrodes were placed on the right hand and right-hand skin. The measurement was done in the fasting state. The phase angle was tested at 50 kHz (the value ≥8° was considered as a norm).
For the evaluation of nutritional status, the full version of Mini Nutritional Assessment (f-MNA) was used. The patient was considered as well nourished when their f-MNA ranged between 24 and 30, as being at risk of malnutrition between 17 and 23.5 points and as having malnutrition if the score was less than 17 (25).
Appetite was evaluated by the Simplified Nutrition Assessment Questionnaire (SNAQ). Obtaining ≤14 points indicated the risk of weight loss within 6 months (26).
Novel Frailty Index was used to assess frailty syndrome. This 5-question self-report questionnaire includes nutrition/shrinking, physical function, physical activity, forgetfulness and emotion/exhaustion. The answers are scored 0/1 points, so the total score is from 0 to 5 points. When the patient received ≥ 3points, the syndrome was diagnosed (3).

Statistical analysis

Statistical analysis was performed with Statistica 12.0 for Windows. Distribution of variable was assessed with the Shapiro-Wilk test. The differences were tested with t-Student test or U-Mann Whitney test depending on the distribution of variables. Data are presented as the mean ± standard deviation (SD) or median and ranges. χ2 Pearson test was also used. Analysis of correlations was performed using Spearman test. P-value of <0.05 was considered as statistically significant.

Figure 1 Comparison of parameters of nutritional status, appetite in elderly with and without frailty syndrome according to Novel Frailty Index (NFI)

Figure 1
Comparison of parameters of nutritional status, appetite in elderly with and without frailty syndrome according to Novel Frailty Index (NFI)


Results

In Table 2 comparative analysis of hand grip strenght and phase angle value are presented.  Hospital patients had lower phase angle (7.8º vs. 8.8º, p=0.003). Hand grip strenght did not differ among groups (Tab.2).

Table 2 Comparison of hand grip strenght and phase angle value among hospitalised and free-living elderly

Table 2
Comparison of hand grip strenght and phase angle value among hospitalised and free-living elderly

Legend: HGS- hand grip strength.


Nutritional Status and NFI

In Table 3 results of full-MNA, SNAQ and NFI are summarized.
According to full-MNA results, 85% in the hospitalised group were malnourished or at risk of malnutrition. On the other hand, in the group of patients in the home environment, only 2% (n=2) of the women and none of the men were affected (Tab.3).
The risk for significant weight loss (>5% in 6 months) assessed by the SNAQ (≤14p) was also significantly higher in hospitalised patients.
Based on the NFI, the frailty syndrome was more common in hospitalised older patients than in free-living elderly, regardless of gender (respectively 63% vs. 15%, χ2=22.3, df=7, p=0.002).
Considering all studied elderly 34% of all subjects were recognized as a frail and 66%  as a non-frail according to NFI. Significant differences between frail and non-frail elderly have been observed solely in age (respectively 73.9±7 vs 69±6, p=0.01,), phase angle value (7.8±1.8 vs 8.7±1.2, p=0.001), MNA [21 (6-29) vs 27 (18.5=30), p=<0.001] and SNAQ [ 15 (6-19) vs 17 (12-20) p=0.01] results. Frail elderly were older and in poorer nutritional status, had worse appetite and lower phase angle in comparison with non-frail (Fig.1).

Table 3 The results of the nutritional status and NFI

Table 3
The results of the nutritional status and NFI

Legend: MNA- Mini Nutritional Assessment, SNAQ- Simplified Nutritional Appetite Questionnaire, NFI- Novel Frailty Index


Analysis of the correlation

Analysis of the correlation in the group of 67 elderly participants showed statistically significant associations of NFI score with age, the number of reported diseases, phase angle value and nutritional status (full-MNA). The age and number of reported diseases correlated positively. Conversely, the negative relationship was demonstrated for the value of the phase angle and the MNA score (data are shown in Table 4).

Table 4 The relationship between the Novel Frailty Index and components of the assessment of nutritional status

Table 4
The relationship between the Novel Frailty Index and components of the assessment of nutritional status

NFI- Novel Frailty Index , HGS- hand grip strength, BMI- body bass index, SNAQ- Simplified Nutritional Appetite Questionnaire, MNA- Mini Nutritional Assessment


Discussion

Frailty in one of most burning problems in countries with aging populations and this issue recently focus more attention of both scientists and clinicians. There is no doubt that frailty implies increased morbidity and mortality and is connected with the need for long-term care (7-9). Despite all these unrelenting facts, we still didn’t have a good screening tool to diagnose frailty or pre-frail state. Current methods of recognizing this syndrome require a number of tests, which often need to be performed by specialists (2, 13). That is why this study investigated the usefulness newly proposed by Yamada and Arai, self-reported 5-question screening index in association with markers of nutritional status, muscle mass, and strength.
The risk of developing frailty syndrome increases with age and it is often described as a physiological decline in late life (14, 15). Data from the Cardiovascular Health Study (n=5317) demonstrated that discussed syndrome is more common in advanced age people. According to mentioned study, 3.2% of free-living elderly in 65-70 age and 25.7% of those ≥ 85 years were frail (7). Results of research presented in the paper show similar relationship. There was a statistically significant positive association of NFI values with age. Moreover, in comparative analysis, frail elderly were older than non-frail (respectively 73.9±7 vs 69±6) and the percentage of people ≥75 years was higher (43% vs 14%).
It should be highlighted that among hospitalised older people, the prevalence of frailty syndrome may be properly higher, due to often severe clinical condition, comorbidities, advanced age (16). Our study demonstrated that frailty syndrome was significantly more common in hospitalised older people than in community-dwelling elderly (respectively 15% vs 63%). Furthermore, hospitalized respondents were affected with more chronic diseases, had a worse appetite and nutritional status, also men were older in comparison with free-living older people.
Many studies emphasize the strong correlation between malnutrition and frailty which were assessed by various diagnostic criteria (10-12). To our knowledge, the NFI has been used so far only by Suzuki et al. own to screen for frailty and its relationship with malnutrition in the elderly patients with chronic heart failure (4). Researchers have shown a statistically significant relationship between the NFI results and the MNA score (r= -0,590, p<0,001). In our study group, we also found strong relationships between NFI and MNA ( r = -0.515, p <0.001). Moreover, frail respondents were in worse nutritional status than non-frail elderly. It is worth pointing out, that 22% of frail elderly were well-nourished according to the full-MNA, which might indicate that the exclusive use of this assessment tool may be insufficient to identify the frail person. Boulos et al. published similar findings, where in a group of 399 frail participants 36.1% were well-nourished (17). Many authors describe malnutrition and frailty as related, but distinct conditions and both should be detecting (17-19).
Frailty syndrome is associated with decreased not only muscle mass but also muscle strength and power. Diagnostic criteria of this syndrome involve also evaluation of muscle function (20, 21). In the presented study, hand grip strength was assessed and the relationship between NFI and HGS was not recorded. However, a frequent decreased of HGS in both groups has been noticed. This may indicate the great need for nutritional status assessment not only hospitalized but also free-living elderly people.
The most important parameter measured in BIA is the phase angle (PA), which reflects the quantity of the cellular mass in the body, as well cell membrane function. The prognostic value of PA has been well established especially in severe health conditions i.a. in COPD, HIV, lung cancer or in dialysis patients and in relation to poor nutritional status (22, 23). In the Third National Health and Nutritional Examination Survey, in a sample of 4.667 older participants, showed that low phase angle was related to a four-fold higher odds of frailty among women and a three-fold higher odds of frailty among men (24). In the presented study the phase angle appears to be the most valuable parameter. PA positively correlates with NFI and is significantly lower in frail and hospitalized older adults in both genders.
In our opinion Novel Frailty Index is undoubtedly a simple tool for rapid screening and might be important in clinical practice in the future. The use of NFI does not require any special equipment for diagnostics. On the other hand, the tool requires a validation process. So far, there is too little data indicating the predictive value of this tool. Yamada and Arai examined 5852 elderly people living in the community and showed that the NFI can be a predictor of disability (3). Furthermore Suzuki et. al. indicated that NFI may predict poor outcome in chronic heart failure outpatients (4). Our study shows that the Novel Frailty Index is associated with a poor health condition, advanced age, poor nutritional status, lack of appetite and impairment of body cell mass. The important limitation of our study is the small sample of enrolled patients. Hence results of our study should be taken with caution.


Conclusions

Early diagnosis of frailty syndrome could be helpful to clinicians to potentially reduce the risk of complications connected with the implemented treatment, so we decided to assess in our study the new screening tool NFI. Preliminary results of our research indicate the relationship between the NFI score and the relevant parameters associated with the frailty syndrome (age, comorbidities, nutritional status, phase angle). Therefore, we highlight the need for further evaluation of NFI as a useful tool for screening of frailty syndrome.


Conflict of Interest: Nothing to disclose.


References

1. Główny Urząd Statystyczny. Ludność w wieku 60+. Struktura demograficzna i zdrowie.(http://stat.gov.pl/obszary-tematyczne/ludnosc/ludnosc/ludnosc-w-wieku-60-struktura-demograficzna-i-zdrowie,24,1.html),downloaded 10.07.17r.
2. Stoicea N, Baddigam R, Wajahn J, Sipes AC, Arias-Morales CE, Gastaldo N, Bergese SD. The Gap Between Clinical Research and Standard of Care: A Review of Frailty Assessment Scales in Perioperative Surgical Settings. Front Public Health. 2016;21;4:150.
3. Yamada M1, Arai H2. Predictive Value of Frailty Scores for Healthy Life Expectancy in Community-Dwelling Older Japanese Adults. J Am Med Dir Assoc. 2015; 1;16(11):1002.e7-11
4. Suzuki N., Kida K., Watanabe S., Kawashima Y., Ito C., Ashikaga K., Suzuki K., Omiya K., Harada T., Akashi Y.J.: Novel Frailty Index is Closely Related to Malnutrition in Outpatients with Chronic Heart Failure. Clinical Nutrition 2016; 35(S1): s.208
5. Vellas B., Villars H., Abellan G., Soto M.E., Rolland Y., Guigoz Y., Morley J.E., Chumlea W., Salva A., Rubenstein L.Z., Garry P.: Overview of the MNA – Its history and challenges. The Journal of Nutrition, Health & Aging 2006; 10(6): s.456-463.
6. Cereda E.: Mini nutritional assessment. Current Opinion in Clinical Nutrition and Metabolic Care 2012; 15(1): s.29-41.
7. Fried LP, Tangen CM, Walston J, Newman AB, Hirsch C, Gottdiener J, Seeman T, Tracy R, Kop WJ, Burke G, McBurnie MA; Cardiovascular Health Study Collaborative Research Group. Frailty in older adults: evidence for a phenotype. J Gerontol A Biol Sci Med Sci. 2001 Mar;56(3): M146-56. PMID: 11253156.
8. Furtado G, Patrício M, Loureiro M, Teixeira AM, Ferreira JP. Physical Fitness and Frailty Syndrome in Institutionalized Older Women. Percept Mot Skills. 2017;124(4):754-776.
9. Mandelblatt JS, Cai L, Luta G, Kimmick G, Clapp J, Isaacs C et al. Frailty and long-term mortality of older breast cancer patients: CALGB 369901 (Alliance). Breast Cancer Res Treat. 2017;164(1):107-117.
10. Ferriolli E, Pessanha FPADS, Moreira VG, Dias RC, Neri AL, Lourenço RA. Body composition and frailty profiles in Brazilian older people: Frailty in Brazilian Older People Study-FIBRA-BR. Arch Gerontol Geriatr. 2017;71:99-104.
11. Artaza-Artabe I, Sáez-López P, Sánchez-Hernández N, Fernández-Gutierrez N, Malafarina V. The relationship between nutrition and frailty: Effects of protein intake, nutritional supplementation, vitamin D and exercise on muscle metabolism in the elderly. A systematic review. Maturitas. 2016;93:89-99
12. Cruz-Jentoft AJ, Kiesswetter E, Drey M, Sieber CC. Nutrition, frailty, and sarcopenia. Aging Clin Exp Res. 2017;29(1):43-48.
13. Laur CV, McNicholl 1, Valaitis R, Keller HH. Malnutrition or frailty? Overlap and evidence gaps in the diagnosis and treatment of frailty and malnutrition. Appl Physiol Nutr Metab. 2017;42(5):449-458.
14. Clegg A, Young J, Iliffe S, Rikkert MO, Rockwood K. Frailty in elderly people. Lancet. 2013;381:752–762.
15. Chen X, Mao G, Leng SX. Frailty syndrome: an overview. Clinical Interventions in Aging. 2014;9:433-441. doi:10.2147/CIA.S45300.
16. Oliveira DR1, Bettinelli LA, Pasqualotti A, Corso D, Brock F, Erdmann AL. Prevalence of frailty syndrome in old people in a hospital institution. Rev Lat Am Enfermagem. 2013;21(4):891-8.
17. Boulos C, Salameh P, Barberger-Gateau P. Malnutrition and frailty in community dwelling older adults living in a rural setting. Clin Nutr. 2016;35(1):138-43.
18. Laur CV, McNicholl T, Valaitis R, Keller HH. Malnutrition or frailty? Overlap and evidence gaps in the diagnosis and treatment of frailty and malnutrition. Appl Physiol Nutr Metab. 2017;42(5):449-458.
19. Bollwein J, Volkert D, Diekmann R, Kaiser MJ, Uter W, Vidal K, et al. Nutritional status according to the mini nutritional assessment (MNA®) and frailty in community dwelling older persons: a close relationship. J Nutr Health Aging.2013;17(4):351e6.
20. Frailty in Older People. Lancet. 2013;381(9868):752-762. doi:10.1016/S0140-6736(12)62167-9.
21. Cesari M, Leeuwenburgh C, Lauretani F, et al. Frailty syndrome and skeletal muscle: results from the Invecchiare in Chianti study. The American journal of clinical nutrition. 2006;83(5):1142-1148.
22. Gupta D1, Lis CG, Dahlk SL, Vashi PG, Grutsch JF, Lammersfeld CA. Bioelectrical impedance phase angle as a prognostic indicator in advanced pancreatic cancer. Br J Nutr. 2004;92(6):957-62.
23. Kyle UG1, Genton L, Pichard C. Low phase angle determined by bioelectrical impedance analysis is associated with malnutrition and nutritional risk at hospital admission. Clin Nutr. 2013 Apr;32(2):294-9.
24. Wilhelm-Leen ER1, Hall YN, Horwitz RI, Chertow GM. Phase angle, frailty, and mortality in older adults. J Gen Intern Med. 2014 Jan;29(1):147-54.
25. A guide to completing the Mini Nutritional Assessment. (http://www.mna-elderly.com/forms/mna_guide_english_sf.pdf), downloaded 20.07.2017r.
26. Wilson MM, Thomas DR, Rubenstein LZ, Chibnall JT, Anderson S, Baxi A, Diebold MR, Morley JE. Appetite assessment: simple appetite questionnaire predicts weight loss in community-dwelling adults and nursing home residents. Am J Clin Nutr 2005; 82: 1074-1081.
27. Cruz-Jentoft AJ, Baeyens JP, Bauer JM, et al. Sarcopenia: European consensus on definition and diagnosis: Report of the European Working Group on Sarcopenia in Older People. Age and Ageing. 2010;39(4):412-423. doi:10.1093/ageing/afq034

DENTITION AND MALNUTRITION RISK IN COMMUNITYDWELLING OLDER ADULTS


R. Zelig1,2, L. Byham-Gray1, S.R. Singer2, E.R. Hoskin3, A. Fleisch Marcus1, G. Verdino1, D.R. Radler1,2, R. Touger-Decker1,2


1. School of Health Professions’ Department of Nutritional Sciences at Rutgers University; 2. School of Dental Medicine, Department of Diagnostic Sciences, at Rutgers University; 3. School of Dental Medicine, Department of Restorative Dentistry, at Rutgers University

Corresponding Author: Rena Zelig, DCN, RDN, CDE, CSG, 65 Bergen Street #157, Newark, NJ 07107, (973)-972-5956, zeligre@shp.rutgers.edu

J Aging Res Clin Practice 2018;7:107-114
Published onlineAugust 7, 2018, http://dx.doi.org/10.14283/jarcp.2018.19


Abstract

Background and Objective: Older adults are at risk for both impaired oral health and suboptimal nutritional status. The objective of this study was to explore the relationships between malnutrition risk and missing teeth in community-dwelling older adults. Design: This was a retrospective cross-sectional analysis of data obtained from the electronic health records of 107 patients aged 65 and older who attended an urban northeast US dental school clinic between June 1, 2015 and July 15, 2016. Odontograms and radiographs were used to identify teeth numbers and locations; malnutrition risk was calculated using the Self-Mini Nutritional Assessment (Self-MNA). Relationships between numbers of teeth and malnutrition risk were assessed using bivariate logistic regression. Results: Participants (N=107) were 72.6 years (SD=5.6) of age; 50.5% were female. Mean Self-MNA score was 12.3 (SD=2.0) reflective of normal nutrition status; 20.6% were at risk for malnutrition, 4.7% were malnourished. Greater than 87% were partially or completely edentulous. Those with 10-19 teeth had lower Self-MNA scores (mean=11.6, SD=2.5) than those with 0-9 teeth (mean=12.7, SD=1.3) or 20 or more teeth (mean=12.6, SD=1.8) and had an increased risk for malnutrition (OR=2.5, p=0.076). Conclusion: The majority of this sample of older adults were partially edentulous and of normal nutritional status. Those with 10-19 teeth were more likely to be at risk for malnutrition. Further studies are needed to examine relationships between tooth loss and malnutrition risk and the impact of impaired dentition on the eating experience in a larger sample and to inform clinical practice.

Key words: Nutrition, Nutrition Assessment), MNA, Self-MNA, malnutrition, dentition, tooth loss, elderly.


Introduction

The relationships between nutrition and oral health are synergistic. The mouth is the entry way for food and fluid intake. If its integrity is impaired, the functional ability of an individual to consume an adequate diet may be adversely impacted. Older adults are a vulnerable population at high risk for both impaired oral health and malnutrition (1-4). Petersen (1) et al reported that 30% of older adults ages 65-74 globally were completely edentulous and many more were missing some of their natural teeth. Data from the United States (US) National Health and Nutrition Examination Survey (NHANES) 2011–2012, revealed that approximately 13% of those aged 65–74 and 26% of those aged 75 and over were edentulous (2).
Tooth loss may affect the ability of an individual to consume an adequate diet (5-9). Prior research has demonstrated relationships between nutritional status, nutrient intake, oral health and diet quality (5-9). The number and distribution of teeth impact masticatory function. Large population studies (5-9) have found that partial and complete edentulism are associated with changes in food and nutrient intake in older adults including decreased consumption of fruit, vegetables, dietary fiber, calcium, iron, and other vitamins.  Independent of its cause, inadequate intake in older adults leads to weight loss, malnutrition, and ultimately increased morbidity and mortality (10, 11).
The etiology of malnutrition in older adults is multifaceted and may be related to physiological and psychological changes that contribute to variable food and nutrient intake (12-14). Kaiser and colleagues (3) pooled analyses from multinational studies which used the Mini Nutritional Assessment (MNA) to evaluate malnutrition prevalence and risk and reported that 22.8% of the older adults studied were malnourished and 46.2% were at risk for malnutrition. Huhmann et al (4) explored malnutrition risk in community dwelling older adults using the Self-MNA , a validated self-administered version of the MNA and found that 27% of subjects were malnourished, 38% were at risk of malnutrition, and 35% had normal nutrition status (4).
A systematic review by Zelig et al (15) exploring the associations between missing teeth and nutritional status (determined by MNA score) in community dwelling older adults revealed conflicting findings. Significant associations were found in five of eight studies between missing teeth (16-18) or the use of dental prostheses (19, 20) and malnutrition risk. MNA scores were significantly lower in those with fewer teeth/limited occlusion as compared to those with more teeth and/or more posterior occluding teeth pairs.  However, other researchers did not report significant associations between occlusal status (21) or dental status (22) and MNA score.
Similarly, Toniazzo et al (23) systematically explored associations between malnutrition risk assessed by MNA or Subjective Global Assessment (SGA), and oral health status in elders and found that individuals with or at risk for malnutrition had significantly fewer teeth than those with normal nutritional status (23). However, similar to Zelig et al, a significant relationship between edentulism and malnutrition risk was not consistently identified.
Given the heterogeneity of the findings in this area (15, 23), the aim of this study was to explore the associations between nutritional status (as defined by the Self-MNA) and dentition status (missing teeth and edentulism with and without denture replacement) in older adults (=>65 years old) who came to the Rutgers School of Dental Medicine (RSDM) clinics in Newark, New Jersey (NJ), between June 1, 2015 and July 15, 2016.  Analyses from the NHANES surveys conducted from 1999-2010 have consistently shown that partial and complete edentulism are more common in females, in persons who are Black or Hispanic, and in those who are of a lower socio-economic status (24, 25). The population of patients treated at the RSDM provided a convenience sample of vulnerable individuals at high risk for impaired dentition status and malnutrition given their racial diversity and low socio-economic status (24-26). We hypothesized that Self-MNA scores will be significantly lower in those with fewer teeth/limited occlusion as compared to those with more teeth and/or more posterior occluding teeth pairs (15, 23).


Materials and Methods

Sample Design and Sample Selection

This was a retrospective cross-sectional analysis of data obtained from the electronic health records (EHR), (Axium, EXAN, Vancouver, BC, Canada) of patients who attended the RSDM clinic in Newark, NJ between June 1, 2015 and July 15, 2016. The EHR report contained select data provided by patients (n=192) during initial screening which included demographic characteristics, medical and dental history, and Self-MNA data. Patients were excluded (n=85) if they were younger than 65 years, height and/or weight were not available in the dental record, Self-MNA data were incomplete, and/or the number and location of teeth could not be accurately mined from the EHR. This study was approved by the Rutgers University Biomedical and Health Sciences Institutional Review Board.

Assessment of Nutritional Status

Data regarding nutritional status were obtained from the EHR using patient responses to the Self-MNA tool (Nestle Nutrition, available at http://www.mna-elderly.com/forms/Self_MNA_English_Imperial.pdf).
The original 18-item Mini Nutritional Assessment (MNA) was developed and validated in 1994 by Nestle Nutrition to detect risk for malnutrition in adults aged 65 and older (27).  A condensed version of the MNA, the Mini Nutritional Assessment Short Form (MNA-SF), containing only six questions, was validated to further facilitate rapid nutritional screening in older adults, as it takes only three to five minutes to administer and retains the diagnostic accuracy of the full MNA (28, 29). In 2013, the Self-Administered MNA (Self-MNA) was adapted from the MNA-SF and validated by Huhmann et al (4) to allow the patient to provide a self-assessment of their nutritional status (4). The Self-MNA requires that the patient or their caregiver complete the assessment prior to their appointment with the healthcare provider; it can then be reviewed with the healthcare provider to identify risk factors for malnutrition (4). The Self-MNA contains six questions which address recent changes in intake and weight, mobility, recent stress, illness, dementia and sadness, as well as body mass index (BMI). A score of 0-7 is considered malnourished, 8-11 is at risk of malnutrition and 12-14 reflects normal nutritional status (4).

Assessment of Dentition Status

Number and location of teeth were mined from the EHR using patient digital radiography and odontogram data. A research assistant, trained and calibrated with a prosthodontist, recorded tooth numbers as either “present” or “missing”. If the tooth surface had been restored with a permanent crown, implant, or fixed bridge the tooth was reported as “present.” The four third molars/wisdom teeth were not included as they are not consistently present in all individuals. The presence and location of these permanent natural or restored tooth surfaces was also used to categorize the number of anterior and posterior occluding pairs of teeth (AOP and POP, respectively), defined as the “presence of a natural (or restored permanent) tooth on the maxilla and corresponding mandible, excluding remaining roots or root caps (page 316)” (30). Number of natural or restored teeth was categorized in a manner similar to prior research into those with 0-9 teeth, 10-19 teeth and 20 or more teeth (17, 31, 32).

Data Analysis

All statistical analyses were conducted using the Statistical Package for Social Sciences (version 22.0, SPSS Inc., Chicago, IL). A sample size of 85 was determined to be needed to establish if a correlation existed between the number of remaining teeth and Self-MNA score, based on a two-tailed test with an a priori alpha of p≤0.05 and 80% power to detect  an small-moderate effect of at least 0.3 (33). Statistical significance was set at p<0.05.
Descriptive statistics were used to summarize all of the study variables. To test the hypothesis that Self-MNA scores will be significantly lower in those with fewer teeth / limited occlusion as compared to those with more teeth and/or more posterior occluding teeth pairs, Spearman’s Correlation Coefficient was used. Associations between categorical variables were evaluated using the chi-squared test; non-parametric Mann-Whitney and Kruskal-Wallis tests were used to compare groups. Simple logistic regression was used to assess the odds of being at risk for malnutrition or malnourished related to number of teeth present. To determine potential confounding by demographic characteristics, bivariate analyses were conducted in accordance to age, gender, race and ethnicity as well as prior medical history.


Results

Characteristics of the study sample

Records from 107 community dwelling older adults who came for care to the RSDM clinics in Newark, NJ between June 1, 2015 and July 15, 2016 were included in the analyses (Figure 1). Their mean age was 72.6 years (SD=5.6) with a range of 65-91 years. Table 1 describes demographic and clinical characteristics of participants.
The mean Self-MNA score of this sample was 12.3 (SD=2.0) reflective of normal nutrition status. Twenty percent (20.6%, n=22) were at risk for malnutrition and 4.7% (n=5) were malnourished according to their Self-MNA responses. A moderate to severe decrease in food intake was reported by 27.1% (n=29) of the patients; 32.7% (n=35) indicated a weight loss of two or more pounds in the past three months (Table 2). Of those who reported a weight loss of more than seven pounds in three months (n=14), all were either at risk for malnutrition (n=10) or malnourished (n=4).
Of the five who were categorized as having malnutrition; 80% (n=4) reported a severe or moderate decrease in food intake, a weight loss greater than seven pounds in three months, and that they had been stressed or severely ill in the past three months; 60% (n=3) of these also had positive responses for severe dementia and/or prolonged sadness; 40% (n=2) were unable to get out of bed or a chair without assistance.
Using the Centers of Disease Control and Prevention (34) (CDC) BMI categories, 21.5% (n=23) were in the normal weight range, 43.0% (n=46) were overweight and 35.5% (n=38) were obese. All those whose Self-MNA score reflected malnutrition (n=5) were obese (mean BMI = 31.6, SD =4.5) with higher BMI values than those who had a normal nutritional status (mean BMI = 29.0, SD=5.0) or who were at risk for malnutrition (mean BMI = 27.6, SD=4.7).


Table 1 Select demographic and clinical characteristics of the study sample (N=107)

Table 1
Select demographic and clinical characteristics of the study sample (N=107)

Note: Sample size for each question varied as participants were able to choose to not answer questions on the registration forms.

Table 2 Responses to Self-MNA questions by nutritional status category (N=107)

Table 2
Responses to Self-MNA questions by nutritional status category (N=107)


The majority of participants were partially edentulous (n=94, 87.8%); 4.7% (n=5) were completely edentulous and 7.5% (n=8) were fully dentate. Fifty-one (47.7%) had at least 20 teeth, 29.9% (n=32) had 10-19 teeth and 22.4% (n=24) had 0-9 teeth. Approximately one-third (35.5%, n=38) of the sample had no posterior occlusion and 7.5% (n=8) had complete posterior occlusion; approximately one quarter (26.2%, n=28) had no anterior occlusion and 43.0% (n=46) had complete anterior occlusion.
The mean number of natural or restored teeth decreased from 17.4 among those with normal nutritional status to 14.4 among those classified as having malnutrition; however, these differences were not statistically significant (p=0.656). Median values of teeth declined in a similar pattern, from 20 among those with normal nutritional status to 18 among those at risk for malnutrition and 15 among those categorized as having malnutrition (Figure 2).


Figure 1 Flow chart of study sample

Figure 1
Flow chart of study sample


Figure 2 Boxplot of number of natural or restored teeth by nutritional status category (N=107)

Figure 2
Boxplot of number of natural or restored teeth by nutritional status category (N=107)


Analyses of the relationships between dental and occlusal status and Self-MNA Score revealed no linear relationships between the Self-MNA score and the number of natural teeth (r=0.104, p=0.285), posterior occluding pairs (POP) of teeth (r=0.173, p=0.074) or anterior occluding pairs (AOP) of teeth (r=0.049, p=0.619).   Although mean differences were not significant (Kruskal-Wallis, p=0.116), those with 10-19 teeth had lower Self-MNA scores (mean=11.6, SD=2.5) than those with 0-9 teeth (mean=12.7, SD=1.3) or 20 or more teeth (mean=12.6, SD=1.8) (Figure 3). When MNA Score was dichotomized into those who were at risk for malnutrition or malnourished (25.2%, n=27) compared to those with normal nutritional status (74.8%, n=80), those with 10-19 teeth had 2.5 times the odds of being at risk for malnutrition/malnourished than those with 20 or more teeth (OR=2.5, p=0.076). Bivariate analyses yielded no statistically significant confounding effects of age, gender, race/ethnicity or medical history.

Figure 3 Boxplot of Self-MNA scores among those with different categories of natural or restored teeth (N=107)

Figure 3
Boxplot of Self-MNA scores among those with different categories of natural or restored teeth (N=107)


Discussion

The aim of this study was to explore the associations between nutritional status and dentition status among older adults who presented for care at the RSDM clinics in Newark, NJ.  The study hypothesis that Self-MNA scores will be significantly lower in those with fewer teeth / limited occlusion as compared to those with more teeth and/or more posterior occluding teeth pairs was not supported as a significant direct relationship between Self-MNA score and number of natural or restored teeth was not found.
The majority of the sample had some degree of tooth loss (87.8% partially edentulous; 4.7% completely edentulous). Although not statistically significant, there was a trend whereby the mean number of natural or restored teeth decreased from 17.4 in those with normal nutritional status to 14.4 in those classified as having malnutrition, suggesting a link between having fewer teeth and an increased risk of malnutrition. Those with 10-19 teeth had lower Self-MNA scores than those with 0-9 teeth or 20 or more teeth and, among those with 10-19 teeth the odds of being at risk for malnutrition/malnourished were 2.5 times those with 20 or more teeth. Interestingly, the patients with malnutrition had 10-19 teeth; none were fully dentate or fully edentulous.   Furuta et al (17) also noted a similar trend whereby those with 10-19 teeth had the lowest MNA-SF scores as compared to those with 0-9 teeth or greater than 20 teeth. While not significant, this finding suggests that those who are missing one third to two thirds of their natural teeth may be most at risk for becoming malnourished.
In contrast to our findings, Kikutani et al (16), Starr et al (18), and Furuta et al (17), reported significant associations between MNA scores and number of missing teeth whereby MNA scores were significantly lower in those with fewer teeth / limited occlusion as compared to those with more teeth and/or more posterior occluding teeth pairs of teeth. Kikutani et al found that individuals with more missing teeth and inadequate occlusion were more likely to be at risk for malnutrition, and those with functionally inadequate occlusion and no dentures had a 3.189 fold greater malnutrition risk than those with natural dentition and adequate function (16). Similarly, Starr et al demonstrated that individuals who were completely edentulous had significantly lower MNA scores than those who were partially or completely dentate (p = 0.028) (18). In bivariate models, Furuta et al found that those with 0-19 teeth had lower MNA scores than those with 20 or more teeth (p = 0.041), however, in a multivariate path analysis, no direct relationship was noted between oral health status and MNA score (17).
While the results of the current study showed similar trends they did not reach the level of statistical significance reported by others. Possible explanations for the variation in results lie in the differences in the populations studied. The subjects in our study were all patients of an urban northeast US dental school clinic in Newark, NJ, and were younger than participants in other studies (16-18). The combined 25% prevalence of malnutrition and risk for malnutrition was relatively lower than the 13.3% malnourished and additional 51.7% at risk for malnutrition reported by Kikutani et al (16), and 14.0% malnourished / 55.2% at risk of malnutrition reported by Furuta et al (17). Participants in the current study had more teeth (mean of 17.0 ±8.5 compared to 8.6 +/- 9.9) (17) and were less likely to be edentulous then those studied by Furuta et al (17). In contrast, the population studied by Starr et al represented healthy older adults who were free of medical conditions and medications at baseline, and as a whole had relatively high MNA scores with a mean of 8.0 or greater out of a maximum score of 9 using their version of the MNA tool (18).
Our findings are consistent with preceding studies, which were unable to find statistically significant relationships between number of teeth (35), occlusal status (21) or dental status (22) and MNA score. Systematic reviews of the evidence (15, 23), have similarly found much conflicting results due in part to the heterogeneity of the studies comparing these variables. Nutritional status and dentition status can be assessed in a variety of ways.  Varying clinical and demographic characteristics of the populations sampled such as age, health status and country of origin add to the complexity of this area of research.
Natural dentition and adequate function are important to maintain nutritional status. Missing teeth and inadequate occlusion affect masticatory function and can result in a decline in overall quality and quantity of intake (5-9) and/or replacement of difficult to chew foods with softer foods that may be more calorically dense and/or nutrient poor which could lead to changes in weight and overall nutritional status (36, 37). Further studies that address diet quality and quantity are necessary to better understand these relationships and guide implications for practice.

Strengths and Limitations

Although the study sample was adequately powered and representative of the population of older adults who attend the RSDM clinic, the majority were overweight/obese and of normal nutrition status. The findings are limited to a single institution and not generalizable to other community dwelling dental settings. Given the retrospective design of this study, a cause and effect relationship between variables could not be established.   Risk for malnutrition may be better assessed using a tool such as the MNA-SF, which considers oral health factors specifically when looking at inadequate intake.
Strengths include data collection over a 13-month timespan to assure an adequate sample size, the availability of all of the data in the EHR, and the verification of dentition status by a research assistant, who was trained and calibrated with a prosthodontist, using digital radiography and the patient’s odontogram. The subjective nature of all self-reported data, including all demographic characteristics, height, weight, and Self-MNA data is a potential limitation. Although the Self-MNA is a validated tool to assess malnutrition prevalence and risk, it lacks the details found in the MNA-SF  that prompts the healthcare professionals to assess the etiology behind a decline in food intake such as loss of appetite, digestive problems, chewing or swallowing difficulties (4).


Conclusion

The findings of this study did not support relationships between the number of natural or restored teeth and Self-MNA score in this sample of community dwelling older adults. Although not statistically significant, the mean number of natural or restored teeth declined as nutritional status declined, which may be clinically relevant. Those classified as having malnutrition had higher rates of weight loss, decreased intake and more frequently reported dementia and/or depression, and severe illnesses than those with a normal nutritional status. Similarly, those classified as being at risk of malnutrition were more likely to experience weight loss and a moderate decline in intake than those who were classified as being of normal nutritional status.

Implications for Research

Our findings add to the heterogeneity of research outcomes in this area. The conflicting findings between studies is in part due to the use of different measures of nutrition and dental status as well as variations in demographic characteristics. Further research with larger samples, in different populations of community dwelling older adults with varying health conditions is needed to better understand the associations between nutrition and oral health and increase the generalizability of results. Prospective studies to determine and compare changes in nutritional status over time with changes in dentition and denture usage can help to determine cause and effect. Qualitative research aimed at understanding how impaired dentition affects intake, the eating experience and overall nutritional status can also help to shed light on these relationships, and can provide the necessary data upon which to develop practice based interventions and guidelines for this vulnerable population.  Although the Self-MNA has been validated as a self-administered tool to determine malnutrition prevalence and risk in community dwelling older adults, research in this area may benefit from using the MNA-SF, which is administered by a healthcare professional as older adults may require more clarification of questions to elicit more accurate results. The MNA-SF also includes a question related to decline in intake attributed to chewing or swallowing difficulties.

Implications for Practice

The dental clinic setting may be an ideal location to perform nutritional status screenings. As reported by Greenberg et al, both oral healthcare professionals and patients were receptive to screening for various medical conditions at the time of a dental visit (38, 39). This could be expanded to include nutritional status screening to identify patients at risk for malnutrition who may not regularly attend visits with a primary care provider. The results of the current study revealed that over 25% of the sample of older adults in this research who came for care at the RSDM clinic had malnutrition or were at risk for malnutrition. Based on these results and previous studies that estimated the prevalence of malnutrition to be over one third in older adults (3, 4), the use of nutritional screening tools by oral healthcare professionals could help to provide timely referrals to primary care physicians or Registered Dietitian Nutritionists for these individuals. Referrals to community assistance programs (such as Meals on Wheels) could also be made as appropriate to prevent decline in nutrition status.


Ethical standards: This study was approved by the Rutgers University Biomedical and Health Sciences Institutional Review Board.

Funding agency: Sackler Institute for Nutritional Sciences. PI Rena Zelig received an early career investigator’s grant from the Sackler Institute for Nutrition Sciences for a project entitled “Exploring the Associations between Dentition Status, Nutritional Status, and the Eating Experience in Older Adults – A Mixed Methods Study.” The sponsors had no role in the design and conduct of the study; in the collection, analysis, and interpretation of data; in the preparation of the manuscript; or in the review or approval of the manuscript.

Acknowledgements: Funding for this project was provided by the Sackler Institute for Nutritional Sciences of the New York Academy of Sciences. The authors wish to acknowledge Dr. Michael Conte and the Office of Clinical Affairs and the Information Technology Department at the Rutgers School of Dental Medicine, Newark, NJ as well as Steven Britton, DMD, and Veronica Jones, MPH, Research Assistants for their help with this study.

Conflict of Interest Disclosure: All authors report that they have no conflicts of interest to disclose related to this research and manuscript.


References

1.    Petersen PE, Kandelman D, Arpin S, Ogawa H. Global oral health of older people–call for public health action. Community Dent Health 2010;27(4 Suppl 2):257-67
2.     Dye BA, Thornton-Evans G, Li X, Iafolla TJ. Dental Caries and Tooth Loss in Adults in the United States, 2011–2012. NCHS data brief, no 197. Hyattsville, MD. National Center for Health Statistics. 2015. Available at:
https://www.cdc.gov/nchs/data/databriefs/db197.pdf. Accessed January 12, 2018.
3.     Kaiser MJ, Bauer JM, Ramsch C, et al. Frequency of malnutrition in older adults: a multinational perspective using the mini nutritional assessment. J Am Geriatr Soc  2010;58(9):1734-8 doi: 10.1111/j.1532-5415.2010.03016.
4.     Huhmann MB, Perez V, Alexander DD, Thomas DR. A self-completed nutrition screening tool for community-dwelling older adults with high reliability: a comparison study. J Nutr Health Aging 2013;17(4):339-44 doi: 10.1007/s12603-013-0015-x
5.     Sahyoun NR, Lin CL, Krall E. Nutritional status of the older adult is associated with dentition status. J Am Diet Assoc 2003;103(1):61-6 doi: 10.1053/jada.2003.50003
6.     Sheiham A, Steele J. Does the condition of the mouth and teeth affect the ability to eat certain foods, nutrient and dietary intake and nutritional status amongst older people? Public Health Nutr 2001;4(3):797-803
7.     Zhu Y, Hollis JH. Tooth loss and its association with dietary intake and diet quality in American adults. J Dent 2014;42(11):1428-35 doi: 10.1016/j.jdent.2014.08.012
8.     Iwasaki M, Taylor GW, Manz MC, et al. Oral health status: relationship to nutrient and food intake among 80-year-old Japanese adults. Community Dent Oral Epidemiol 2014;42(5):441-50
9.     Ervin RB, Dye BA. Number of natural and prosthetic teeth impact nutrient intakes of older adults in the United States. Gerodontology 2012;29(2):e693-702 doi: 10.1111/j.1741-2358.2011.00546.x
10.     Zajacova A, Ailshire J. Body Mass Trajectories and Mortality Among Older Adults: A Joint Growth Mixture-Discrete-Time Survival Analysis. Gerontologist 2013 doi: 10.1093/geront/gns164
11.     Lundin H, Saaf M, Strender LE, Mollasaraie HA, Salminen H. Mini nutritional assessment and 10-year mortality in free-living elderly women: a prospective cohort study with 10-year follow-up. Eur J Clin Nutr 2012;66(9):1050-3 doi: 10.1038/ejcn.2012.100
12.     Lorenzo-Lopez L, Maseda A, de Labra C, Regueiro-Folgueira L, Rodriguez-Villamil JL, Millan-Calenti JC. Nutritional determinants of frailty in older adults: A systematic review. BMC Geriatr 2017;17(1):108 doi: 10.1186/s12877-017-0496-2
13.     Favaro-Moreira NC, Krausch-Hofmann S, Matthys C, et al. Risk Factors for Malnutrition in Older Adults: A Systematic Review of the Literature Based on Longitudinal Data. Adv Nutr 2016;7(3):507-22 doi: 10.3945/an.115.011254
14.     van der Pols-Vijlbrief R, Wijnhoven HA, Schaap LA, Terwee CB, Visser M. Determinants of protein-energy malnutrition in community-dwelling older adults: a systematic review of observational studies. Ageing Res Rev 2014;18:112-31 doi: 10.1016/j.arr.2014.09.001
15.     Zelig R, Touger-Decker R, Chung  M, Byham-Gray L. Associations between Tooth Loss, with or without Dental Prostheses, and Malnutrition Risk in  Older Adults: A Systematic Review. Top Clin Nutr 2016;31(3):232-47
16.     Kikutani T, Yoshida M, Enoki H, et al. Relationship between nutrition status and dental occlusion in community-dwelling frail elderly people. Geriatr Gerontol Intl 2013;13(1):50-4 doi: 10.1111/j.1447-0594.2012.00855.x
17.     Furuta M, Komiya-Nonaka M, Akifusa S, et al. Interrelationship of oral health status, swallowing function, nutritional status, and cognitive ability with activities of daily living in Japanese elderly people receiving home care services due to physical disabilities. Community Dent Oral Epidemiol 2013;41(2):173-81 doi: 10.1111/cdoe.12000
18.     Starr JMH, R. J.;Macintyre, S.;Deary, I. J.;Whalley, L. J. Predictors and correlates of edentulism in the healthy old people in Edinburgh (HOPE) study. Gerodontology 2008;25(4):199-204
19.     Cousson PY, Bessadet M, Nicolas E, Veyrune JL, Lesourd B, Lassauzay C. Nutritional status, dietary intake and oral quality of life in elderly complete denture wearers. Gerodontology 2012;29(2):e685-92 doi: 10.1111/j.1741-2358.2011.00545.x
20.     McKenna G, Allen PF, Flynn A, et al. Impact of tooth replacement strategies on the nutritional status of partially-dentate elders. Gerodontology 2012;29(2):e883-90 doi: 10.1111/j.1741-2358.2011.00579.x
21.     Soini H, Routasalo P, Lauri S, Ainamo A. Oral and nutritional status in frail elderly. Spec Care Dent 2003;23(6):209-15
22.     Soini H, Routasalo P, Lagstrom H. Nutritional status in cognitively intact older people receiving home care services–a pilot study. J Nutr Health Aging 2005;9(4):249-53
23.     Toniazzo MP, Amorim PS, Muniz FW, Weidlich P. Relationship of nutritional status and oral health in elderly: Systematic review with meta-analysis. Clin Nutr 2017 doi: 10.1016/j.clnu.2017.03.014
24.     Dye BA, Li X, Thornton-Evans G. Oral Health Disparities as Determined by Selected Healthy People 2020 Oral Health Objectives for the United States, 2009–2010. NCHS data brief: US Department of Health and Human Services, Centers for Disease Control and Prevention, National Center for Health Statistics, 2012.
25.     National Institutes of Health. National Institute of Dental and Craniofacial Research. Tooth Loss in Seniors (Age 65 and Over). Tooth Loss in Seniors (Age 65 and Over)  March 11, 2014. Available at: https://www.nidcr.nih.gov/DataStatistics/FindDataByTopic/ToothLoss/ToothLossSeniors65andOlder.htm. Accessed January 12, 2018.
26.     Bureau USC. QuickFacts. Newark city, New Jersey. Available at: https://www.census.gov/quickfacts/table/PST045215/3451000,34. Accessed January 12, 2018.
27.     Guigoz Y, Vellas B. The Mini Nutritional Assessment (MNA) for grading the nutritional state of elderly patients: presentation of the MNA, history and validation. Nestle Nutrition workshop series. Nestle Nutr Workshop Ser Clin Perform Programme 1999;1:3-11; discussion 11-2.
28.     Rubenstein LZ, Harker JO, Salva A, Guigoz Y, Vellas B. Screening for undernutrition in geriatric practice: developing the short-form mini-nutritional assessment (MNA-SF). J Gerontol A Biol Sci Med Sci 2001;56(6):M366-72
29.     Kaiser MJ, Bauer JM, Ramsch C, et al. Validation of the Mini Nutritional Assessment short-form (MNA-SF): a practical tool for identification of nutritional status. J Nutr Health Aging 2009;13(9):782-8
30.     Yoshida M, Kikutani T, Yoshikawa M, Tsuga K, Kimura M, Akagawa Y. Correlation between dental and nutritional status in community-dwelling elderly Japanese. Geriatr Gerontol Intl 2011;11(3):315-9 doi: 10.1111/j.1447-0594.2010.00688.x
31.     Ostberg AL, Nyholm M, Gullberg B, Rastam L, Lindblad U. Tooth loss and obesity in a defined Swedish population. Scand J Public Health 2009;37(4):427-33
32.     Syrjala AMY, P.;Hartikainen, S.;Sulkava, R.;Knuuttila, M. Number of teeth and selected cardiovascular risk factors among elderly people. Gerodontology 2010;27(3):189-92
33.     Portney L, Watkins M. Foundations of Clinical Research, Applications to Practice. 3 ed. Upper Saddle River, NJ: Pearson Education, Inc, 2009.
34.     Centers for Disease Control and Prevention. Healthy Weight. Secondary Healthy Weight. Available at: http://www.cdc.gov/healthyweight/assessing/bmi/adult_bmi/index.html. Accessed January 12, 2018.
35.     Lopez-Jornet P, Saura-Perez M, Llevat-Espinosa N. Effect of oral health dental state and risk of malnutrition in elderly people. Geriatr Gerontol Int 2013;13(1):43-49 doi: 10.1111/j.1447-0594.2012.00853.x
36.     Musacchio EP, E.;Binotto, P.;Sartori, L.;Silva-Netto, F.;Zambon, S.;Manzato, E.;Corti, M. C.;Baggio, G.;Crepaldi, G. Tooth loss in the elderly and its association with nutritional status, socio-economic and lifestyle factors. Acta Odontol Scand 2007;65(2):78-86
37.     Ikebe KM, K.;Morii, K.;Nokubi, T.;Ettinger, R. L. The relationship between oral function and body mass index among independently living older Japanese people. Int J Prosthodont 2006;19(6):539-46
38.     Greenberg BL, Glick M, Frantsve-Hawley J, Kantor ML. Dentists’ attitudes toward chairside screening for medical conditions. J Am Dent Assoc 2010;141(1):52-62
39.     Greenberg BL, Kantor ML, Jiang SS, Glick M. Patients’ attitudes toward screening for medical conditions in a dental setting. J Public Health Dent 2012;72(1):28-35 doi: 10.1111/j.1752-7325.2011.00280.x

METABOLIC SYNDROME OF FREE-LIVING ELDERLY FROM SHARPEVILLE, SOUTH AFRICA: A PROSPECTIVE COHORT STUDY WITH 10-YEAR FOLLOW-UP


W.H. Oldewage-Theron1,2, A.A. Egal2, C. Grobler3


1. Department of Nutritional Sciences, Texas Tech University, 1301 Akron Ave, Lubbock, TX, 79409, USA; 2. Center of Sustainable Livelihoods, Vaal University of Technology, Private Bag X021, Vanderbijlpark, 1900, South Africa; 3. Department of Health Sciences, Vaal University of Technology, Vanderbijlpark, South Africa.

Corresponding Author: Wilna Oldewage-Theron, Professor of Nutrition, Department of Nutritional Sciences, Texas Tech University, 1301 Akron Ave, Lubbock, TX, 79409, USA; Visiting Professor, Center of Sustainable Livelihoods, Vaal University of Technology, Private Bag X021, Vanderbijlpark, 1900, South Africa; Email: wilna.oldewage@ttu.edu


J Aging Res Clin Practice 2018;7:100-106
Published online June 7, 2018, http://dx.doi.org/10.14283/jarcp.2018.18


Abstract

Objective: This study aimed to provide evidence on the prevalence of the metabolic factors contributing to Metabolic Syndrome (MetS) among elderly people in South Africa. Design: An ethically approved, cross-sectional survey study conducted in a cohort of an elderly population in 2004 with follow-up in 2014. Setting: An elderly day-care center. Participants: A total of 170 men and women were randomly selected for the baseline survey (2004). Only 105 of the subjects included in the baseline study were available for the follow-up study (2014). The sample consisted of 83.2% (n=89) women and 16.8% (n=16) men with a mean±SD age of 95.8±6.2 and 71.8±5.7 years in 2014 and 2004 respectively. Measurements: Dietary intakes (24-hour recall questionnaire) were completed for a period of three non-consecutive days, including one weekend day and two week days. Other measurements included waist circumference (WC), blood pressure and fasting (>8 hours) venous blood samples that were analyzed for total cholesterol (TC), high-density lipoprotein-cholesterol (HDL-C), tryglicerides (TGs) and glucose. The Friedewald formula was used to calculate LDL-C (16). Results: The prevalence of MetS was significantly (p=0.000) higher in 2014 (63.4%) compared to 2004 (48.8%). The most prominent risk factors were central obesity (85.9%), low serum HDL-C (71.0%) and high serum TG (68.1%) levels in 2004 compared to central obesity (82.5%), low serum HDL-C (94.3%) and hyperglycaemia (48.1%) in 2014. Conclusions: MetS is highly prevalent and rapidly increasing among these elderly people. A need for identifying preventative and treatment strategies to increase wellness and reduce morbidity has been highlighted by these results..

Key words: Metabolic syndrome, elderly, South African, metabolic risk factors, cohort.


Introduction

Metabolic syndrome (MetS) has become a significant public health issue globally (1). MetS is a complex disorder and includes three or more interconnected metabolic risk factors such as high triglyceride (TG) levels, low high-density lipoprotein-cholesterol (HDL-C) levels, high blood pressure, central obesity and dysglycaemia (1-3).When these risk factors are prevalent simultaneously in individuals, they are in a prothrombotic and pro-inflammatory state that increases the risk of atherosclerotic cardiovascular disease (CVD)and type 2 diabetes (T2DM) (1, 4, 5) and contribute to all-cause mortality (1, 3). Preventable non-communicable diseases (NCDs) such as CVD, T2DM, cancer, and chronic respiratory diseases are responsible for more than 36 million deaths each year, 80% of which are in low- and middle-income countries (6). It was estimated that 37% of all deaths in South Africa (SA) were due to NCDs in 2000 (7). A national prevalence rate of 31.8% for hypertension, 9.5% diabetes, 23.9% abnormal high levels of serum total cholesterol (TC), 24.6% low density lipoprotein-cholesterol (LDL-C), 47.9% abnormally low HDL-C, and central adiposity observed in 9.8% of men and 50.8% of women (8). The prevalence of MetS and the various risk factors increase with age (1, 2). Furthermore, higher morbidity and mortality rates for CVD and T2DM have been reported for the elderly diagnosed with MetS due to the physiological changes and various chronic diseases associated with increased age (1). The general prevalence of MetS of up to 60% among elderly cohorts is high (2), affecting about 40% and 60% of Korean aged men and women respectively (1), 40% of Ecuadorian elderly (9), 33.7% of Chinese adults (10) and 60% of Taiwanese elderly (11). Due to the high prevalence of MetS among the elderly and its associated high risk of disease, it is important to know the prevalence and risk factors contributing to MetS for implementing primary prevention strategies. Many studies have focused on the elderly in SA, but the prevalence of MetS among this vulnerable, resource-poor population (12) has not been reported. Therefore, this study aimed to provide evidence on the prevalence of the metabolic factors contributing to MetS in a cohort of resource-poor elderly people resident in Sharpeville in the Gauteng Province of SA for the period 2004 to 2014.


Methods

Study design

A cross-sectional cohort study with 10 year follow-up design was used. This study was conducted according to the guidelines laid down in the declaration of Helsinki and all procedures involving human subjects were approved by the University of the Witwatersrand’s Medical Ethics Committee for Research on Human Beings (M040835) for 2004 and the Vaal University of Technology Senate Research Innovation and Ethics Committee (20140827ms) for the 2014 data collection. Due to this elderly community being highly illiterate (12), an information letter and consent form was translated into the Sotho Language and verbally explained to the respondents by trained fieldworkers in 2004 and 2014. The letter included a brief introduction, motivation and purpose of the study. The procedures of the study were explained and confidentiality confirmed by allocating a study number to each of the respondents. Participation was voluntary and participants gave consent by signing the consent form in the form of a fingerprint in the presence of a witness.

Location

This study was undertaken in the only elderly care center in Sharpeville in the Gauteng Province of SA. Sharpeville is one of the oldest of six townships situated in the Vaal region, an industrial polluted area in the Gauteng Province of SA. Sharpeville has a poverty rate of 43.1% (13). The center management contacted the researchers in 2004 to undertake the cross-sectional baseline survey to assist them with planning.

Sampling

Baseline study (2004): Participants were recruited from the then newly established (three months old) Sharpeville Care of the Aged day-care center where free-living elderly people visited the center on Mondays and Wednesdays. The purpose of attending the day-care center was to provide skills training (sewing, cooking and gardening), religious activities and free breakfast and lunch for food insecure, low-resource elderly (aged ≥60 years). This is the only elderly care center in Sharpeville. A sample size calculator (14) was used and 169 respondents were needed to obtain statistically representative data for the cross-sectional survey for this elderly community (12). A total of 170 men and women were randomly selected for the survey from an alphabetical list of names (n=350) provided by the care center (every second name selected). No exclusion criteria were applied and thus any person who attended the care center and gave informed consent could be selected for the study. Eight fieldworkers, speaking the various indigenous languages of SA, were recruited and trained using a training manual and participatory facilitating methods (12).
Follow-up study (2014): During 2014, the researchers visited the elderly care center again and only 105 of the 169 original respondents of 2004, thus 63.3% of the original sample, were still voluntarily attending the center and were included in the second investigation. Possible reasons for loss to the follow-up measurements could have been a) mortality during the 10-year period from baseline to follow-up; b) immobility due to disease or sickness making it impossible for the elderly to attend the care center; or c) elderly moving out of the area and not attending the center any longer. All 105 respondents gave consent to be included in the follow-up study. The same measurements, procedures as well as standardized and validated measuring instruments were used in both 2004 and 2014.

Measurements for both 2004 and 2014

Dietary intakes were measured by a 24-hour recall questionnaire completed for a period of three non-consecutive days, including one weekend day and two week days. Trained fieldworkers used the four-stage, multiple-pass one-on-one interviewing procedure described by Gibson (15). Food models were used to assist the fieldworkers in estimating portion sizes. Dietary intake data were analyzed by a registered dietician using the FoodFinder® version 3 software program, developed by the Medical Research Council and based on the South African food composition tables (16). The mean intake of the three days was calculated.
Waist circumference (WC) was measured at the area halfway between lower rib and iliac crest with a non-stretchable measure tape in a horizontal position around the body (15) by a Registered Dietitian. A registered nursing practitioner measured blood pressure after the respondents had sat quietly for at least 15 minutes with feet on the floor and the right arm supported at heart level. A cuff bladder was used and blood pressure measurements taken with a Tensoval Hartmann® duo control monitor. A second measurement was taken within 10 minutes of the first and the average of the two readings were reported. This monitor uses two methods for determining blood pressure, namely the Korotkoff and the oscillometric methods (17) rendering a more accurate measurement.
The same two nursing practitioners and a haematologist used in 2004 and 2014, drew fasting (>8 hours) venous blood samples in a 7 ml clotted tube, 3 ml glucose (sodium fluoride and oxalate) tube and 5 ml sodium citrate blood between 07h00 and 10h00, after the respondents had been seated for 15 minutes. A vacutainer needle with minimal use of tourniquets was used. The blood was placed on ice, protected from direct sunlight, until separation within two hours of blood collection. Serum and plasma were collected by low-speed centrifugation (3000 rpm for 30 seconds) at 4°C and aliquoted into individual tubes. Serum and plasma were stored at -80°C until analyzes were performed. Standard laboratory protocol was adhered to in order to comply with SANAS accreditation requirement by a heamatologist.
The Konelab 20i random access automated clinical chemistry system was used for TC, HDL-C, TGs and glucose. A coefficient of variation (percent CV) between runs of 1.2–2.8% was obtained for all serum variables. The measuring principles of the Konelab 20i are colorimetric and turbudimetric. The Friedewald formula was used to calculate LDL-C (18).

Statistical analyzes

All analyses were done using the IBM SPSS, version 23 and p<0.05 considered significant for all statistical analyses. Linearity regression was used to test all continuous variables for normality. All the variables were normally distributed, except for the dietary intake variables. All normally distributed variables were reported as means and standard deviations (SDs).
Independent t-tests were performed to determine significant differences in baseline MetS risk factors between the cohort of elderly who were present in 2004 and 2014 and those only present in 2004.
Daily nutrient intakes were reported as medians and interquartile frequencies (IQF) and compared to the Dietary Reference Intakes (DRI) (19), specifically, the Estimated Average Requirement (EAR) values.
The respondents were stratified into two groups based on the International Diabetes Foundation MetS classification for both 2004 and 2014. The MetS group consisted of respondents with a presence of three or more of the following MetS criteria:
•    WC ≥ 80 cm for women and ≥94 cm for men
•    TRG >1.7 mmol/L (150 mg/dL)
•    HDL-C < 1.3 mmol/L (50 mg/dL) for women and <1.03 for men
•    Blood pressure ≥130/85 mm Hg
•    Fasting glucose > 5.6 mmol/L (100 mg/dL) (20).

The non-MetS group were respondents with or less than two of the metabolic risk factors.  Paired t-tests were used to determine the significant differences between baseline (2004) and follow-up (2014).  Correlation coefficients were used to examine the association between the study variables (p<0.05). The students t-test was used to determine the mean difference between continuous variables such age, WC, blood pressure and biochemical values. Thus, the Levene’s test for equality of variance was used at p-value of <0.05. Independent samples t-tests were done to determine significant differences between the men and women at baseline and follow-up. Pearson correlations were done for the nominal data. Only significant results are reported.   To understand the predictors of MetS, linear regression (age, systolic and diastolic blood pressure, WC, LDL-C, TRG and serum glucose) was carried out with those dependent variables that had a significant correlation with MetS.

Results

The independent t-tests showed that there were no significant differences in the baseline MetS risk factors between the cohort of elderly who were present in 2004 and 2014 and those only present in 2004 (HDL-C p=0.276, LDL-C p=0.818,  TRG p=0.647, serum glucose p=0.629, WC p=0.294). It is thus assumed that the results were not confounded by those elderly who were not present in 2014.
The sample consisted of 83.2% (n=89) women and 16.8% (n=16) men with a mean±SD age of 95.8±6.2 and 71.8±5.7 years in 2014 respectively.  The results in Figure 1 showed that the prevalence of MetS was significantly (p=0.000) higher in 2014 at 63.4% compared to 48.8% at baseline (2004).   The most prominent risk factors were central obesity (85.9%) and low serum HDL-C (71.0%) and high serum TRG (68.1%) levels at baseline. At follow-up, the most prominent risk factors were central obesity (82.5%), low serum HDL-C (94.3%) and hyperglycaemia (48.1%).  Furthermore, the prevalence of respondents with one and two risk factors decreased at baseline and those with four and five metabolic risk factors progressively increased from baseline to follow-up.

Figure 1 MetS classification of the respondents at baseline (2004) and follow-up (2014)

Figure 1
MetS classification of the respondents at baseline (2004) and follow-up (2014)


The results in Table 1 indicate a statistically significant (p=0.001) decrease in HDL-C from a mean±SD of 1.04±0.43 to 0.84±0.29 mmol/L from baseline to follow-up in the women compared to a statistically significant (p=0.000) increase in LDL-C from 2.02±1.61 to 3.60±1.71 mmol/L. The men showed a significant (p=0.000) increase in LDL-C levels from 1.93±1.57 mmol/L at baseline to 3.17±0.91 mmol/L at follow-up. No other significant changes have been observed. However, a metabolic increase in serum HDL-C and a metabolic decrease in glucose levels were observed in the men at follow-up.

Table 1 Descriptive statistics: anthropometric and biochemical parameters compared across gender

Table 1
Descriptive statistics: anthropometric and biochemical parameters compared across gender

*UoM = Unit of Measure; a,b,c in the same row indicates significant differences at p<0.05


Both men and women had low total energy, dietary fiber, cholesterol and sodium intakes at baseline and follow-up compared to high protein and carbohydrate intakes when compared with the EAR (19). Added sugar intakes were high at baseline, but within the recommended intakes at follow-up. The women showed significantly higher intakes of dietary protein, fat and cholesterol, but significantly lower carbohydrates and sodium at follow-up. The men had significantly higher dietary fat and cholesterol, but reduced sodium intakes at follow-up (Table 2). No significant different dietary intakes were observed between the men and the women.

Table 2 Analysis of 24-hour recall: daily mean intakes of the men and women

Table 2
Analysis of 24-hour recall: daily mean intakes of the men and women


Estimated energy requirements (EER) based on mean±SD age for the women was 95 years, with mean±SD height and weight of 1.55±0.08 m and 74.7±14.2 kg and for men aged 72 of mean±SD height and weight of 1.69±0.09 m and 93.7±20.2 kg respectively with sedentary activity levels at baseline (17); a,b,c in the same row refer to statistically significant differences between the variables p<0.05 (Independent [between groups]and paired [within groups] t-test for equality of variances); DRI = Dietary Reference Intakes as represented by the Estimated Average Requirement for females aged 31–50 years old, and Adequate Intake (AI)# where no EAR is available (17); * UoM = Unit of Measure

The Pearson correlation analyses revealed that at baseline MetS was significantly and positively correlated with WC (r=0.325, p=0.030), diastolic blood pressure (r=0.219, p=0.0358) and TRG (r=0.537, p=0.000) levels and inversely related to HDL-C (r=-0.423, p=0.004) levels at baseline. Furthermore, significant relationships existed between WC and diastolic blood pressure (r=0.328, p=0.003) as well as carbohydrate intake with systolic blood pressure (r=-0.233, r=0.021) at baseline. At follow-up, significant associations were observed between MetS and WC (r=0.428, p=0.000), systolic (r=0.271, p=0.006) and diastolic (r=0.435, p=0.000) blood pressure, serum HDL-C (-0.254, p=0.010), TRG (r=0.514, p=0.000) and glucose (0.412, p=0.000) levels as well as added sugar intakes (r=0.221, p=0.028). WC showed significant relationships with systolic (r=0.285, p=0.004) and diastolic (r=0.250, p=0.012) blood pressure and serum TRG (r=0.230, p=0.020). Further associations were shown between systolic blood pressure with serum LDL-C (r=0.274, p=0.005) levels.
At baseline, the linear regression analysis carried out on the MetS variables showed that WC, diastolic blood pressure, serum TRG and glucose levels were predictors of MetS at baseline (R2=0.588, p=0.000, SEE=0.712) and follow-up (R2=0.595, p=0.000, SEE=0.752) in this community.


Discussion

Although the concept of MetS is older than five decades, it is receiving more attention now due to its increasing prevalence globally and in Africa as well as its relationship with cardiovascular morbidity and mortality (22). Not much is documented about the prevalence rate of MetS in SA and only a few studies have reported MetS prevalence ranging from an overall 30.2% in rural women (23) to 60.6% among colored women in Cape Town (24, 25). These rates indicate a high prevalence of MetS in SA, however, limited information about the prevalence of MetS in the elderly exists for SA. This study thus provides the latest estimate of MetS prevalence among elderly in SA and is, to our knowledge, the first study investigating the prevalence of MetS risk factors among a cohort of elderly over a period of 10 years in SA (2004 to 2014).
According to the International Diabetes Foundation (IDF) definition of MetS (26), the prevalence of MetS among the elderly in this study was 48.8% in 2004 and it increased to 63.4% in 2014, which was consistent with the findings among Taiwanese elderly (11), but higher than elderly in the United States of America (US) (27), Ecuador (9) and Korea (1). Despite the increase in MetS over the ten-year period, no association between MetS and age was established. This was inconsistent with other research findings among adults (23, 28), but consistent with the results of de Luis and co-authors for another elderly population (29). The prevalence of MetS was 39.6% among the women in 2004 and increased to 56.3% in 2014 compared to 93.4% and 100.0% among men respectively in this study. Furthermore, the results of this study were inconsistent with the findings of other studies that reported a higher prevalence of MetS among elderly women compared with men (1, 10), but may have been confounded by the small sample of men (n=16). The major differences in MetS risk factors between men and women were dysglycaemia at baseline and follow-up and low HDL-C at follow-up. A significant difference in low serum HDL-C levels for gender was also observed in Chinese elderly (10).
A shift in MetS risk factors was observed among the respondents at follow-up. Furthermore, significant associations existed among the various MetS risk factors at baseline and follow-up. At baseline, 15.6%, 33.3%, 33.3%, 13.3% and 2.2% had one, two, three, four or five MetS risk factors respectively. This changed at follow-up with fewer elderly persons with one (7.9%), two (26.7%) and three (32.7%) risk factors, but significantly more with four (23.8%) and five (6.9%) risk factors at follow-up.  The predictors of MetS at both baseline and follow-up for this study was WC, diastolic blood pressure, and serum HDL-C and TRG levels. Interestingly, low serum HDL-C was the most prominent risk factor for MetS among these elderly cohort with a prevalence of 94.3% followed by obesity (82.5%) at follow-up, but at baseline these were reversed with obesity (WC) being the most prominent risk factor with a prevalence of 85.9% compared to 71.0% for serum HDL-C. These results were consistent with another black population in SA (30). However, among Korean elderly, hypertension was the most prominent risk factor, followed by HDL-C (1). The prevalence of abnormally low HDL-C levels in this study at baseline and follow-up was much higher than the national prevalence rate of 47.9% (8). This result was also consistent with studies from Botswana, Nigeria, Cameroon and Cotonou where it was observed that reduced HDL-C contributed frequently to dyslipidaemia in Africans with MetS (22). A significant difference in HDL-C was observed.
Despite the poor socio-economic status of these elderly (12) and although prevalence decreased significantly (p=0.000) over the 10 years’ cohort study, the prevalence of central obesity (>80%), one of the major factors contributing to MetS (22), was much higher than the national prevalence rate (8) and the global prevalence of 20% among the adult population (28). In recent years, poverty and food insecurity have been linked to obesity and its associated NCDs (31). This paradoxical condition is a result of a poor quality diet consisting of mainly energy-dense, low nutrient food items containing too much fat, salt and sugar that lead to the double burden of disease, thus the co-existence of over- (obesity and NCDs) and under- (micronutrient deficiencies) nutrition, often found in countries undergoing the nutrition transition (32, 33) such as SA. The dietary intake analyzes of the elderly in our study showed an inadequate diet, as the median energy intakes were consistently low, with even lower intakes at follow-up when compared to the EER. Furthermore, the dietary intake of the men and women in this study showed low intakes of dietary fat, fiber and cholesterol. Although the median protein and carbohydrate intakes were high when compared to the EAR, the percentage it contributed to TE was within the guidelines for a balanced and healthy diet. Dietary carbohydrate is strongly related to serum glucose levels and lipid metabolism. A high carbohydrate intake can increase serum TGs and possibly decrease HDL-C levels (34). Although the intakes of carbohydrates were at least 30% higher than the EAR in 2004 and 2014, no significant relationship between carbohydrate intake and serum lipid could be established. However, the relatively high carbohydrate intakes could have contributed to the prevalence of metabolic dyslipidaemia and dysglycaemia found among the elderly men and women in our study. At follow-up, dietary intakes of added sugar was significantly correlated with MetS. This may have contributed to the higher prevalence of dysglycaemia at follow-up. Dietary fiber intakes were considerably lower than recommended and both the men and women consumed less dietary fiber at follow-up, however this was not significant. Dietary fiber, specifically whole grain fiber, is important for cardio-metabolic health due to its proven lowering effect of serum TG and LDL-C (35); however, this association could not be confirmed for this study. However, a lower dietary fiber intake and significantly (p=0.025) higher prevalence of low HDL-C levels were observed at follow-up.
In this study the prevalence of hypertension was 41.3% at baseline and decreased significantly (p=0.000) to a prevalence of 30.7% at follow-up. This was much higher than the national prevalence of hypertension of 10.2% (8). Although a large percentage of the elderly had hypertension, the dietary sodium intake was low. In addition, no association between sodium intake and hypertension could be established. This was consistent with a study undertaken in Ecuadorian elderly (9). Type 2 diabetes is no longer a rare condition in Africa and accounts for almost 90% of all the cases of diabetes mellitus. It is well known that type 2 diabetes increases the probability of developing MetS. A review of MetS in Africa has found that it ranks low in terms of the contributing factors to MetS (22). Similarly, in our study, dysglycaemia ranked the lowest of all the risk factors at baseline with a prevalence of 30.3%. Although the prevalence of dysglycaemia increased to 48.1% at follow-up, this was not significant (p=0.079).
This study contributes to the paucity of data about the prevalence of MetS among the elderly in SA, but had a number of limitations. The first limitation was that this was a cross-sectional survey in 2004 with a 10-year follow-up in the same elderly that were participating in the 2004 baseline and still attending the care center (cohort) in 2014,  lacking the ability to infer causal relationships. Another limitation was the small sample size due to 36.7% (n=64) of the respondents in the original sample in 2004 were not available for measurements in  2014. Furthermore, the respondents were selected from the only elderly care center from one township only. This is thus not a representative sample and the results cannot be generalized. Caution should also be used in interpreting the results of the men due to the small sample size. However, as an exploratory study, the results revealed issues and actions needed for future research. Although different MetS criteria are used in different studies and comparing results can thus be a limitation (22), the information generated are still informative about the burden of MetS among the elderly South African population.


Conclusion and recommendations

This study indicates that MetS is highly prevalent and rapidly increasing among these poor black elderly people residing in urban Sharpeville, SA. Although the prevalence of MetS and its various risk factors increased significantly from baseline to follow-up, no significant association between MetS and age was established in this elderly community. MetS is associated with NCD morbidity and mortality and the high MetS burden thus underscores the need for prevention and treatment strategies to increase wellness and reduce morbidity in the elderly of SA. Health-promoting behaviors should be encouraged among the elderly to prevent the increase in prevalence of MetS risk factors with age. Dietary interventions should include strategies to improve dietary intakes and to normalize dyslipidaemia and dysglycaemia, reduce hypertension and improve weight status. Furthermore, policy makers and local health authorities should design and implement regular screening campaigns to identify and treat individual risk factors as early as possible to avoid progression to MetS. This should reduce expenditure on both capital and human health resources in the country.


Acknowledgements: The authors acknowledge the National Research Foundation (NRF) and the Vaal University of Technology for funding, as well as the women participating in the study and the fieldworkers for their assistance.

Financial support: This research has been funded by the National Research Foundation (NRF) and the grant numbers are nr 62501 & 81280. The sponsors had no role in design and conduct of the study; in the data collection, analysis, and interpretation of data; in the preparation of the manuscript; or in the review or approval of the manuscript.

Conflict of interest: The authors declared that they had no conflict of interests.

Ethical standard: This study was conducted according to the guidelines laid down in the declaration of Helsinki and all procedures involving human subjects were approved by the University of the Witwatersrand’s Medical Ethics Committee for Research on Human Beings (M040835) for 2004 and the Vaal University of Technology Senate Research Innovation and Ethics Committee (20140827ms) for the 2014 data collection. Fingerprint informed consent was obtained from all the subjects.


References

1. Kim S, So WY. Prevalence and correlates of metabolic syndrome and its components in elderly Korean adults. Exp dys 2016;84:107-112.
2. Georgousopoulou EN, Naumovski N, Mellor DD, et al. Association between siesta (daytime sleep), dietary patterns and the presence of metabolic syndrome in elderly living in Mediterranean area (MEDIS study): The moderating effect of gender. J Nutr Health Aging 2016;20:1- 7.
3. Appelhans BM, Baylin A, Huang MH, et al. Beverage Intake and Metabolic Syndrome Risk Over 14 Years: The Study of Women’s Health Across the Nation. J Acad Nutr Diet 2017;117(4):554-562.
4. Cicero AFG, Colletti A. Role of phytochemicals in the management of metabolic syndrome. Phytomedicine 2016;23:1134-1144.
5. López A, Peréz-Rodrigo R. Nutrition and the metabolic syndrome. Nutr clín diet hosp 2012;32(3):92-97.
6. World Health Organization (WHO). New WHO report: Deaths from non-communicable diseases on the rise, with developing world hit hardest. 2011. http://www.who.int/mediacentre/news/releases/2011/ncds_20110427/en/. Accessed 25 October 2017.
7. Bradshaw D, Groenewald P, Laubscher R, et al. Initial burden of disease estimates for South Africa, 2000. S Afr Med J 2003;93(9):682–688.
8. Shisana O, Labadarios D, Rehle T, et al. South African National Health and Nutrition Examination Survey (SANHANES-1). 2014. HSRC Press, Cape Town.
9. Sempértegui F, Estrella B, Tucker KLO, et al. Metabolic syndrome in elderly living in marginal peri-urban communities in Quito, Ecuador. Public Health Nutr 2011;14(5):758-767.
10. Yang F. Prevalence of metabolic syndrome in the middle-aged and older Chinese population. Int J Diabetes Dev Ctries 2017;37(2):176-182.
11. Wu TT, Chen IJ, Cho SL, et al. The relationship between health-promoting behaviors and metabolic syndrome in community-dwelling older adults. Biol Res Nurs 2016;18(5):549-557.
12. Oldewage-Theron WH, Salami L, Zotor FB, et al. Health status of an elderly population in Sharpeville, South Africa. Health SA Gesondheid 2008;13(3):3-17.
13. Sekatane MB. An application of different methodologies for measuring poverty in Sharpeville township. Medit J Soc Sc 2013;4(14). http://www.mcser.org/journal/index.php/mjss/article/view/1577. Accessed 08 January 2018.
14. The Survey System. Sample size calculator. http://www.surveysystem.com/ssformu.htm. Accessed 08 January 2018.
15. Gibson RS. Principles of nutritional assessment, 2nd edn. 2005. Oxford University Press, New York.
16. Langenhoven ML, Kruger ML, Gouws E, et al. Food composition tables. Medical Research Council, Parow, 1991.
17. HARTMANN in South Africa. Tensoval blood pressure monitors. 2017. Available at: http://za.hartmann.info/tensoval_monitor.php. Accessed 24 October 2017.
18. Warnick GR, Knopp RH, Fitzpatrick V, et al. Estimating low-density lipoprotein cholesterol by the Friedewald equation is adequate for classifying patients on the basis of nationally recommended cut points. Clin chem 1990;36:15-19.
19. Institute of Medicine (IoM), Food and Nutrition Board. Dietary Reference Intakes. 2003. National Academy Press, Washington DC.
20. Grundy SM, Cleeman JI, Daniels SR, et al. Diagnosis and management of the metabolic syndrome: an American Heart Association/National Heart, Lung and Blood Institute Scientific Statement. Circulation 2005;112:2735-2752.
21. Food and Agricultural Organization (FAO) and World Health Organization (WHO). Fats and fatty acids in human nutrition. Report of an expert consultation. 2010. FAO, Geneva.
22. Okafor CI. The metabolic syndrome in Africa: current trends. Indian J Endocrinol Metab 2012;16(1):56-66.
23. Motala AA, Esterhuizen T, Pirie FJ, et al. The prevalence of metabolic syndrome and determination of the optimal waist circumference cut-off points in a rural South African community. Diabetes Care 2011;34:1032-1037.
24. Erasmus RT, Soita DJ, Hassan MS, et al. High prevalence of diabetes mellitus and metabolic syndrome in a South African coloured population: Baseline data of a study in Bellville, Cape Town. S Afr Med J 2012;102(11):851-844.
25. Kruger MJ, Nell T. The prevalence of the metabolic syndrome in a farm worker community in the Boland district, South Africa. BMC Public Health 2017;17:61.
26. International Diabetes Foundation (IDF) Clinical Guidelines Task Force. Global guideline for type 2 diabetes: recommendations for standard, comprehensive, and minimal care. Diabet Med 2006;23(6):579-593.
27. Ford ES. Risks for all-cause mortality, cardiovascular disease, and diabetes associated with the metabolic syndrome. Diabetes care 2005;28(7):1769-1778.
28. Lechleitner M. Obesity and the metabolic syndrome – a mini-review. Gerontology 2008;54(5):253-259.
29. De Luis DA, Lopez Mongil R, Gonzalez Sagrado M, et al. Prevalence of metabolic syndrome with International Diabetres Federation Criteria and ATP III Program in patients of 65 years of age or older. J Nutr, Health Aging 2010;14(5):400-404.
30. Peer N, Steyn K, Levitt N. Differential obesity indices identify the metabolic syndrome in black men and women inCape Town: the CRISBA study. J Public Health 2015;38(1):175-82.
31. Tanumihardjo S, Anderson C, Kaufer-Horwitz M, et al. Poverty, obesity, and malnutrition: an international perspective recognizing the paradox. J Am Diet Assoc 2007;107:1966-1972.
32. Olson C. Nutrition and health outcomes associated with food insecurity and hunger. J Nutr 1999;129,Suppl. 2:S521-S524.
33. Haddad L, Hawkes C, Webb P, et al. A new global research agenda for food. Nature 2016;540:30-32.
34. Riccardi G, Rivellese AA. Dietary treatment of the metabolic syndrome – the optimal diet. Br J Nutr 2000;83,Suppl.1:S143-S148.
35. Mozzafarian D, Appel LJ, van Horn L. Components of a cardioprotective diet. New insights. Circulation 2013;123:2870-2891.

FRAILTY, LOSS OF NATURAL TEETH AND QUALITY OF LIFE


I.-C. Lee1, S.-F. Weng1, P.-S. Ho2


1. Department of Healthcare Administration and Medical Informatics, Kaohsiung Medical University, Kaohsiung, Taiwan; 2. Department of Oral Hygiene, Kaohsiung Medical University, Kaohsiung, Taiwan.

Corresponding Author: Pei-Shan Ho, Department of Oral Hygiene, Kaohsiung Medical University, Kaohsiung, Taiwan, 100,Shih-Chuan 1st Road, Kaohsiung 807, Taiwan, Email: psho@kmu.edu.tw, Tel: 886-7-3121101 ext.2159,
Fax: 886-7-3157024

J Aging Res Clin Practice 2018;7:85-90
Published online May 24, 2018, http://dx.doi.org/10.14283/jarcp.2018.16


Abstract

Objective: This study investigates whether the loss of natural teeth associate with elderly frailty, as well as their connection with quality of life. Design: This study collected data from January 2012 to April 2013, and the subjects were the elderly over the age of 65 living in community. Setting: Loss of natural teeth and frailty are common issues in elderly and it is noteworthy to address these issues while the investigation of healthy ageing. Participants: The research included 543 elderly people over the age of 65. Measurements: The face-to-face interviews with a structured questionnaire were performed. Results: Elderly people with no natural teeth are more likely to become frail (OR=1.87); the relationship between frailty and quality of life is more significant. After adjusting for all the independent variables, results showed that frailty in elderly leads to poorer quality of life, and oral health status is not correlated with quality of life (P>0.05). The remain of natural teeth is correlated with occurrence of frailty in the elderly. Conclusions: Frailty has a significant and strong influence on oral health-related quality of life. For the elderly, frailty shall be early diagnosed to ensure provision of proper preventive health care.

Key words: Elderly, frailty, loss of natural teeth, OHIP.


Introduction

At present, various countries all around the world are facing the increase of elderly population, and the problem of ageing population structure has been increasingly severe. As of the end of 2012, the proportion of the elderly over the age of 65 in total population in the countries in the Europe and the U.S. was as follows: U.S. (13.7%), U.K. (17.0%), Germany (20.7%), Sweden (19.1%), and Finland (18.8%); and that in Asia is: Japan (24.1%), Korea (11.8%), and Taiwan (11.2%) (1). Among all of the above countries, the speed of population ageing in Taiwan has been considered as the top 1, and Ageing Index has also rapidly increased 32% in 10 years. The problems caused by elderly population certainly will become a trend that cannot be ignored in the society in Taiwan.
Many studies indicated that, the occurrence of loss of natural teeth in the elderly is very common, and 30-40% of the elderly are edentulous (2-4).During food intake, edentulous people tend to experience bradymasesis or fail to chew carefully and swallow slowly, which leads to malnutrition or diseases of digestive system (5-9). After a long period of time, their overall health functions will also be worsened (10-12), and their oral health-related quality of life will be lowered (13-16). In addition to oral health problems, in recent years, there has also been a research trend of investigation on elderly frailty. “Frailty” is not a disease, but merely an alert of loss of balance of health functions. Hamerman indicated that, as long as an elderly person who lives independently experiences the symptoms of frailty, his/her risk of death will be multiplied (17). Many studies found that, the proportion of the elderly with frailty suffering from chronic illness is higher, their overall health functions are poorer (18-19). A consensus on diagnostic criteria for elderly frailty has not been reached. The indices and criteria proposed by Fried et al. are most frequently adopted by experts and scholars internationally (20). The 5 indices include unexpected weight loss (weight loss of 10 pounds within the past year), self-perceived fatigue, weakness, slow walking speed, and reduced physical activities.
In sum, loss of natural teeth and frailty are common health issues in elderly. The association of health problems and quality of life in elderly is also highly focused in research (21-23). Among various assessments of oral health-related quality of life (OHRQoL), Oral Health Impact Profile (OHIP) developed by Slade and Spencer is the most popular evaluation within the field of dentistry research (24). The evaluation content includes the questions asking the subjects whether dental problems, oral problems or dentures affect their activities of daily living, as well as the questions on perceived level of distress. However, in order to increase the convenience and accuracy of clinical evaluation, subsequent researchers continuously developed shortened versions of evaluation tools, such as OHIP-14 and OHIP-EDENT (25-26). OHIP-14 is the short version (14-item) of original OHIP (49-item). OHIP-EDENT is based on OHIP and chooses appropriate questionnaire items for edentulous people, with a total of 19 items.
Frailty is the emerging trend of health issues. The literatures of whether the frailty associates with oral health status or whether the frailty affects oral health-related quality of life still remains limited. Therefore, the main purpose of this study is to investigate the correlation among loss of natural teeth, frailty, and oral health-related quality of life (OHRQoL) and provide the research results as reference for promotion of elderly oral health and planning of healthy ageing policies.


Material and Methods

Healthy ageing means to extend the life of being independent and to decrease the probability of being dysfunction and relying on others in elderly. The elderly aged over 65 years and walk independently, with or without cane, were enrolled as targeted subjects; whereas the elderly with diagnosed dementia were excluded. This study collected data from January 2012 to April 2013, and the subjects were the elderly over the age of 65 in San-Ming district of Kaohsiung City. This study selected the places where the elderly usually gather to engage in activities, such as parks and community activity centers. It is hoped to screen the high risk individuals from health elderly population. Researchers recruited the targeted subjects from the locations mentioned above to obtain their health-related information.  The researchers who had received the training of questionnaire interviews performed face-to-face interviews with the elderly individually. The inter-rater agreement of these results reaches 94%. After the interviews, the researchers measured the subjects’ objective data, such as walking speed and grip strength. Under certain conditions, the questionnaire might be completed by interviewers based on subjective responses of elderly who have low vision and cannot fill out the forms independently. This study enrolled a total of 543 subjects. This study was approved by the Institutional Review Board of Kaohsiung Medical University Chung-Ho Memorial Hospital (KMUH-IRB-20120196). The study design, methodological procedure and administrative protocol were carried out in “accordance” with the approved guidelines. Informed consent was obtained from all subjects prior to data collection.
This study used a structured questionnaire to perform interviews. There are 135 items which derived from many validated assessments (e.g., ADL, and MNA) in this questionnaire to assess the health functional status in elderly. It takes 20 minutes to complete this questionnaire. According to the main research objectives, this study extracted some of the data for analysis. The detailed explanations on variables analyzed are given as follows:
(1) Demographic characteristics: age, gender, province of family register, educational background, economic status, and number of chronic diseases.
(2) Oral health status: this variable was mainly used to understand whether there were natural teeth in the mouths of the elderly. Due to the good accessibility of medical services in Taiwan and the welfare policy of “Dentures for the Elders Using Public Funding” provided by the government, elderly people with loss of natural teeth would usually obtain prosthetic treatment for free. The participants were categorized as dentulous group and edentulous group in this study. The dentulous group consists of the elderly who have natural teeth remained in the mouth, with unknown number of the natural teeth remained;  whereas the edentulous group consists of the elderly who have no natural teeth remained in the mouth and these with complete denture.
(3) Frailty status: Fried (2001) used indices, such as weight loss, perceived fatigue, weakness, slow walking speed, and reduced physical activities to evaluate whether the elderly are frail. Because it is difficult to collect questionnaires on physical activities, this study used other 4 indices to understand the status of elderly frailty. In literatures, the indicators of frailty have not been standardized yet. Thus, the indicators of frailty that used in this study, described as follows, were modified from the indicators proposed by Fried et al. (2001).
This study asked the subjects about “whether he/she experienced weight loss within the last three months” and “whether they perceived fatigue within the last three months.” If the answers were “Yes,” the subjects experienced the signs of frailty. This study used electronic gripping device to measure the value of grip strength, in order to understand whether the elderly experienced the sign of weakness. Because the performance of grip strength varies with gender, this study divided the subjects into two groups: male subjects and female subjects. The 20% of subjects with the lowest value in each group were deemed weak subjects, namely, the high risk group of frailty. For the index of slow walking speed, this study asked the elderly to walk back and forth for 3 meters, and measured the time it took. Because the height of subjects might affect step size and waking speed, this study used the average height of all of the subjects as the baseline for division of groups. This study divided the elderly into two groups: tall and short groups. The 20% of subjects with the slowest walking speed were classified as frail subjects. The signs reflected by the said 4 indices were elderly frailty. This study summed up the total number of items of frailty. The subjects whose number of items of frailty ≥2 were deemed the subjects “with” frailty. These ways of discriminants are considerably valid that people with diagnosed frailty are comparatively unhealthy (27).
(4) Quality of life: This study used the short form version of OHIP-EDENT developed by Allen and Locker (2002) (Oral Health Impact Profile appropriate for use in edentulous patients) for measurement. This version can be used to understand the influence of general oral health problems on daily living. Moreover, some items were added to evaluate the influence of edentulousness on activities of daily living. The reliability and validity of testing of version in Chinese are very good as well(28). The higher the score was, the higher the perceived distress and influence of oral problems on daily living were and the poorer the quality of life was.

This study used the statistical software SPSS19.0 version to perform statistical analyses, and used Chi-square, t-test, and one-way ANOVA to understand the differences in demographic characteristics, frailty status, oral status, and quality of life (OHIP-EDENT). In addition, this study used logistic regression model to assess whether the oral health status associates with frailty; and used multiple linear regression model to investigate the influence of frailty status and oral status on quality of life.


Results

Table 1 shows that compared with those in non-frail group, frail group has higher percentage of subjects over the age of 80 years (40.4% vs. 14.4%), higher percentage of subjects with illiteracy and with educational level under elementary school (70.3% v.s 54.5%), and higher percentage of edentulous subjects (44.1% v.s 24.0%)(P<0.05).

Table 1 Demographic characteristics, oral status and frailty

Table 1
Demographic characteristics, oral status and frailty

Note: This table is the results of Chi-square analysis


There are no relationship between the gender, native place with the scores of quality of life, whereas other variables demonstrate the significant difference on the scores of quality of life (P<0.05), as shown on Table 2.

Table 2 Demographic characteristics, oral status, numbers of diseases, frailty and OHIP-edent

Table 2
Demographic characteristics, oral status, numbers of diseases, frailty and OHIP-edent

Note: This table is the results of t-test, one-way ANOVA and Scheffes’ post-hoc method


Tables 3 and 4 investigated the correlation among oral status, frailty and quality of life. After demographic variables were adjusted, compared with subjects with natural teeth in their mouth, edentulous elderly were much easier to turn into being frail (OR=1.87). In the regression model of exploring quality of life and relevant factors, any signs of being frail in elderly correlates positively with the scores of quality of life, whereas no significant difference on scores of quality of life no matter any of natural teeth remains in elderly (Table 4). After all of the independent variables were adjusted, frail group of elderly has much poorer quality of life than those in non-frail group of elderly. This study compared the correlation between two variables, frailty and oral health status, and quality of life, and found that, the correlation between frailty and quality of life was stronger (β=0.21) and significant (P<0.05). Oral health status correlates much less with quality of life (β=0.05) and did not reach the significant level (P>0.05).

Table 3 Logistic regression model of frailty

Table 3
Logistic regression model of frailty

Table 4 The multiple linear regression model of OHIP-edent

Table 4
The multiple linear regression model of OHIP-edent

R2=0.200


Discussion

This study found that, age, province of family register, and oral status were correlated with the occurrence of frailty (Table3). Elderly with increased age might much easier become frailty. Literature(18,29)indicates that physical functions also decline day by day with the increase of age, and the elderly may easily experience symptoms of frailty, such as fatigue, weakness, and slow walking speed. Elderly with no natural teeth remained might much easier turn into being frailty. Some literature(6,30-31)show that elderly with poor oral health status may demonstrate malnutrition, weight loss, and frailty due to their poor chewing capability. The elderly whose province of family register is not Taiwan are also less likely to experience symptoms of frailty. This phenomenon is the same as ethnic factor abroad. In Chinese society, living styles and dietary culture of people vary with their province of family register, which may lead to the difference in health status (32).
The main objective of this study was to investigate the correlation among frailty, oral health status, and quality of life. The association of frailty and oral health status was previously mentioned. The frailty and oral health were served as variables within the regression model of quality of life scores to clarify their associations with quality of life. As results shown that the elderly with frailty have poor quality of life whereas the oral health status has not related with quality of life. Even though frailty and oral health problems are the common issues in elderly population, their impacts on quality of life is different. “Frailty” is only a health alert. In the field of clinical medicine, diagnostic criteria and treatment guidelines for signs of frailty have not been developed. Therefore, medical therapeutic intervention usually will not be immediately implemented for the symptoms of frailty in the elderly. The quality of life may get worse if individual’s frailty status does not improve (18, 33). In contrast, this study divided oral health status into two groups, edentulous subjects and dentulous subjects. Due to the development of current medical technology, dental materials have been gradually stabilized. Also, there is the welfare policy for funding the free denture placement of elderly in Taiwan, thus, most edentulous elderly may wear the whole set of removable denture. Therefore, the perceived distress and influence of oral problems in daily living were less significant. Compared with the strength of influence of frailty, the correlation between edentulousness and quality of life was weaker. Therefore, quality of life was not affected by it (14, 34).
In addition to frailty and oral health status, the results also demonstrated the difference in age, educational background, economic status, and the numbers of diagnosed chronic diseases  would lead to the difference in score of OHIP-EDENT (Table 4). It is suggested taking the above variables into consideration in the future study for further investigation of oral-related quality of life. The associations of these variables and quality of life were synthesized as follows. The score increased with the increase of age, suggesting that, the subjects’ quality of life was poorer and they perceived increased distress in daily living due to oral health problems. In addition to the loss of natural teeth, other oral health-related problems increase with age, and lead to the gradual decline of quality of life (19, 35-36). People with better education may comprehend health-related knowledge better (37-39), leads to the oral health problems not affect their activities of daily living that much. The people with poorer economic status tend to experience economic barriers and fail to obtain sufficient medical care services. Thus, the daily living of these people might be disturbed by the oral health related problems, then further affects their quality of life (35-36). The oral health status of people suffering from chronic illness may become poorer due to side effects of drugs or the influence of illness(37,40). Therefore, they will perceive distress in activities of daily living, which affects their quality of life.


Conclusions

The health care issues in elderly population are important and shall be addressed in the future. In order to slow down the speed of growth of medical expenses and enrich the quality of life, the concept of healthy ageing shall be globally promoted. It is highly important that clinical professionals can early detect the high risk elderly population.  Frailty is the alert of unbalanced health functions. Although it is not deemed a disease, it will trigger a series of negative health outcomes and further affect oral health-related quality of life. Dentists and oral health care-related personnel shall devote themselves to the oral health treatments in order to maintain and improve the oral health-related quality of life in elderly population. The extra attention shall also be paid on whether the elderly experience symptoms of frailty. This could be beneficial to the early detection of these elderly with frailty. Furthermore, it is hope that the proper preventive cares and health promotion services can be provided in advance to ensure the achievement of healthy ageing.


Ethics approval: This study was approved by the Institutional Review Board of Kaohsiung Medical University Chung-Ho Memorial Hospital (KMUH-IRB-20120196). The study design, methodological procedure and administrative protocol were carried out in accordance with the ethical approved guidelines. Informed consent was obtained from all subjects prior to data collection.

Availability of data and materials: All datasets on which the conclusions of the manuscript presented in the main paper.

Competing interests: The authors declare no conflict of interest.

Funding: Not applicable.

Authors’ contributions: I-Chen Lee defined the research theme and mainly contributed to study design, literature synthesis, data collection, statistical analysis, manuscript-writing and formation; Shih-Feng Weng mainly contributed to study design, statistical analysis, manuscript-writing and formation; served as consultants in advanced statistical analysis, data interpretation ; Pei-Shan Ho served as consultants in data interpretation and manuscript refinement. All authors read and approved the final version of the manuscript submitted for publication.

Acknowledgements: Sincere appreciation will be given to all individuals who participate in this study.


References

1.    Ministry of the Interior , Department of Statistics. Available at  http://sowf.moi.gov.tw/stat/national/list.htm (accessed 17 October 2015).
2.    Montal S, Tramini P, Triay JA , Valcarce J. Oral hygiene and the need for  treatment of the dependent institutionalized elderly. Gerodontology. 2006;23:67-72.
3.    Islas-Granillo H., Borges-Yañez S.A., Lucas-Rincón S.E.et al. Edentulism risk  indicators among Mexican elders 60-year-old and older. Arch Gerontol Geriatr. 2011;53:258-262.
4.    Gaio EJ, Haas AN, Carrard VC, Oppermann RV, Albandar J, Susin C. Oral health  status in elders from South Brazil: a population-based study. Gerodontology.  2012;29:214-223.
5.    Pouyssegur V, Brocker P, Schneider SM et al. An innovative solid oral nutritional   supplement to fight weight loss and anorexia: open, randomised controlled trial of  efficacy in institutionalized, malnourished older adults. Age Ageing. 2015;44:245-51.
6.    Saarela, R. K., Lindroos, E., Soini, H., Hiltunen, K., Muurinen, S., Suominen, M. H., & Pitkälä, K. H. Dentition, nutritional status and adequacy of dietary intake among  older residents in assisted living facilities. Gerodontology. 2016;33(2):225-232.
7.    Han, S. Y., & Kim, C. S. Does denture-wearing status in edentulous South Korean elderly persons affect their nutritional intakes?. Gerodontology. 2016;33(2): 169-176.
8.    Hunt RJ, Beck JD, Lemke JH, Kohout FJ, Wallace RB. Edentulism and Oral Health  Problems among Elderly Rural Iowans: The Iowa 65+ Rural Health Study. Am J Publ  Health. 1985;75:1177-1181.
9.    Picos AM, Picos A, Nicoara P, Craitoiu MM. Dental Erosion In a Partially  Edentulous Patient With Gastroesophageal Reflux Disease: A Case Report. Clujul  Medical. 2014;87:284-287.
10.    Slade GD, Akinkugbe AA, Sanders AE. Projections of U.S. Edentulism prevalence following 5 decades of decline. J Dent Res. 2014;93:959-965.
11.    Yu YH, Lai YL, Cheung WS, Kuo HK. Oral Health Status and Self-Reported Functional Dependence in Community-Dwelling Older Adults. J Am Geriatr Soc. 2011;59: 519-523.
12.    Medina-Solís CE, Pontigo-Loyola AP, Pérez-Campos E et al. Edentulism and other variables associated with self-reported health status in Mexican adults. Med Sci Monit. 2014;2:843-852.
13.    Lee IC, Yang YH, Ho PS, Lee IC. Chewing ability, nutritional status and quality of life. J Oral Rehabil. 2014;41:79-86.
14.    Sivakumar I, Sajjan S, Ramaraju AV, Rao B. Changes in oral health-related quality of life in elderly edentulous patients after complete denture therapy and possible role of their initial expectation: a follow-up study. J Prosthodont. 2015;24:452-456.
15.    Makhija SK, Gilbert GH, Boykin MJ et al. The relationship between  sociodemographic factors and oral health–related quality of life in dentate and edentulous community-dwelling older adults. J Am Geriatr Soc. 2006;54:1701-1712.
16.    Visscher CM, Lobbezoo F, Schuller AA. Dental status and oral health-related quality of life. A population-based study. J Oral Rehabil. 2014;41: 416-422.
17.    Hamerman D. Toward an understanding of frailty. Ann Intern Med. 1999;130:945-950.
18.    Bagshaw SM, Stelfox HT, Johnson JA et al. Long-term association between frailty and health-related quality-of-life among survivors of critical illness: a prospective multicenter cohort study. Crit Care Med. 2015;43:973-982.
19.    Byard RW. Frailty syndrome – Medicolegal considerations. J Forensic Leg Med. 2015;30: 34-38.
20.    Fried LP, Tangen CM, Walston J et al. Frailty in older adults: evidence for a phenotype. J Gerontol A Biol Sci Med Sci. 2001;56:M146-156.
21.    Ngoenwiwatkul Y, Chatrchaiwiwatana S, Chaiprakarn K. Dental status and its impact on the quality of life of elderly in Phon Sawan, Nakhon Phanom Province. Southeast Asian J Trop Med Public Health. 2014;45:236-243.
22.    Clijmans, M., Lemiere, J., Fieuws, S., & Willems, G. Impact of self-esteem and personality traits on the association between orthodontic treatment need and oral health-related quality of life in adults seeking orthodontic treatment. European journal of orthodontics. 2015;37(6), 643-650.
23.    Vel Aacute Zquez-Olmedo LB, Ort Iacute Z-Barrios LB, Cervantes-Velazquez A, C Aacute Rdenas-Bahena AN, Garc Iacute A-Pe Ntilde A C, S Aacute Nchez-Garc Iacute A S. Quality of life related to oral health in older people. Evaluation instruments. Rev Med Inst Mex Seguro Soc. 2014;52:448-456.
24.    Slade GD, Spencer AJ. Development and evaluation of the Oral Health Impact Profile. Community Dent Health.  1994;11:3-11.
25.    Slade GD. Derivation and validation of a short-form oral health impact profile. Community Dent Oral Epidemiol. 1997;25:284–290.
26.    Allen F, Locker D. A modified short version of the oral health impact profile for assessing health-related quality of life in edentulous adults. Int J Prosthodont. 2002;15:446–450.
27.    Lee, I. C., Chiu, Y. H., & Lee, C. Y. Exploration of the importance of geriatric frailty on health-related quality of life. Psychogeriatrics. 2016;16(6):368-375.
28.    Kuo HC, Kuo YS, Lee IC, Wang JC, Yang YH. The association of responsiveness in oral and general health related quality of life with patients’ satisfaction of new  complete dentures. Qual Life Res. 2013;22:1665-1674.
29.     Lin CH, Chou CY, Liu CS, Huang CY, Li TC, Lin CC. Association between frailty and subclinical peripheral vascular disease in a community-dwelling geriatric population: Taichung Community Health Study for Elders. Geriatr Gerontol Int. 2015;15: 261-267.
30.     Madhuri S, Hegde SS, Ravi S, Deepti A, Simpy M. Comparison of chewing ability, oral health related quality of life and nutritional status before and after insertion of complete denture amongst edentulous patients in a Dental College of Pune. Ethiop J Health Sci. 2014;24, 253-260.
31.     Gil-Montoya JA, Ponce G, Sánchez LI, Barrios R, Llodra JC, Bravo M. Association of the oral health impact profile with malnutrition risk in Spanish elders. Arch Gerontol Geriatr. 2013;57:398-402.
32.     Tung HJ, Mutran EJ. Ethnicity and Health Disparities Among the Elderly in Taiwan. Res Aging. 27:327-354.
33.     Kanauchi M, Kubo A, Kanauchi K, Saito Y. Frailty, health-related quality of life and mental well-being in older adults with cardiometabolic risk factors. Int J Clin Pract. 2008;62:1447-1451.
34.     Kuoppala R, Näpänkangas R, Raustia A. Quality of Life of Patients Treated With Implant-Supported Mandibular Overdentures Evaluated With the Oral Health Impact Profile (OHIP-14): a Survey of 58 Patients. J Oral Maxillofac Res. 2013;4: 1-6.
35.     Maida CA, Marcus M, Spolsky VW, Wang Y, Liu H. Socio-behavioral predictors of self-reported oral health-related quality of life. Qual Life Res. 2013;22:559-566.
36.     Silva AE, Demarco FF, Feldens CA. Oral health-related quality of life and associated factors in Southern Brazilian elderly. Gerodontology. 2015;32: 35-45.
37.     Saltnes SS, Storhaug K, Borge CR, Enmarker I, Willumsen T. Oral health-related quality-of-life and mental health in individuals with chronic obstructive pulmonary disease (COPD). Acta Odontol Scand. 2015;73: 14-20.
38.     Gabardo MC, Moysés SJ, Moysés ST, Olandoski M, Olinto MT, Pattussi MP. Multilevel analysis of self-perception in oral health and associated factors in Southern Brazilian adults: a cross-sectional study. Cad Saude Publica. 2015;31:49-59.
39.     Gabardo, Marilisa Carneiro Leão, Simone Tetu Moysés, and Samuel Jorge Moysés. Self-rating of oral health according to the Oral Health Impact Profile and associated factors: a systematic review. Rev Panam Salud Publica. 2013;33:439-445.
40.     Abnet CC, Qiao YL, Dawsey SM, Dong ZW, Taylor PR, Mark SD. Tooth loss is associated with increased risk of total death and death from upper gastrointestinal cancer, heart disease, and stroke in a Chinese population-based cohort. Int J Epidemiol. 2005;34: 467-474.

INADEQUACY OF N-3 POLYUNSATURATED FATTY ACID DIETARY INTAKES IN THE GENERAL FRENCH POPULATION OF ELDERLY (65 TO 79 YEARS OLD): THE INCA 2 SURVEY


B. Buaud1, J. Tressou2, P. Guesnet3, N. Simon4, S. Pasteau5


1. ITERG – Institut des Corps Gras, Canéjan, France; 2. UMR MIA-Paris, AgroParisTech, INRA, Université Paris-Saclay, Paris, France; 3. PG Consulting, Bures sur Yvette, France; 4. Terres Univia, Paris, France; 5. Phasme Consulting, Paris, France.

Corresponding Author: Benjamin Buaud, ITERG – Institut des Corps Gras, Canéjan, France, E-mail: b.buaud@iterg.com; Phone: (33)557575728; Fax: (33)557575732.

J Aging Res Clin Practice 2018;7:69-74
Published online April 5, 2018, http://dx.doi.org/10.14283/jarcp.2018.13


Abstract

Objectives: The aim of this study was to explore polyunsaturated fatty acid (PUFA) intakes in the French elderly population (65 to 79 years old). Design: The study used data on French food consumption issued from 348 elderly of the cross-sectional national French INCA 2 dietary survey performed in 2006 and 2007, combined with the nutritional content of food consumed updated in 2013 by the French Information Center on Food Quality. Results: It was observed for the French elderly population an adequate total fat daily intake and a linoleic acid (LA) daily intake close or superior to the recommended dietary intake (RDI) by the French authorities (from 4.1 to 4.4% of the total energy intake excluding alcohol (EIEA) vs 4% EIEA). By contrast, the French elderly have, regardless of age and gender, a low mean dietary alpha-linolenic acid (ALA) intake equal half of the RDI (0.5% EIEA vs 1% EIEA), and a mean dietary docosahexaenoic acid (DHA) intake close to two-thirds of the RDI (i.e. from 154 to 167 mg/d vs 250 mg/d). These translated into a LA/ALA ratio between 9.5 and 9.9, twice as high as the recommended threshold inferior to 5, and a mean dietary eicosapentaenoic acid (EPA) plus DHA intake (from 267 to 293 mg/d) slightly more than half of the RDI (500 mg/d). Conclusion: This study supports the need to promote higher intakes of n-3 PUFAs, as well as the setting of specific intake recommendations for these fatty acids for the French elderly population.

Key words: n-3 polyunsaturated fatty acids, dietary intakes, dietary recommendations, INCA 2 survey, elderly.


Introduction

Polyunsaturated fatty acids (PUFAs) include n-6 and n-3 fatty acids. Linoleic acid (18:2n-6, LA), and alpha-linolenic acid (18:3n-3, ALA), the precursors of n-6 and n-3 series respectively, are both essential fatty acids that cannot be synthesized by humans and must be supplied with the diet. Beneficial effects of LA have been reported on blood lipid profile, and its association with a lower risk of coronary heart disease (CHD) events and reduced risk of type 2 diabetes (1). Although clinical benefits have not been observed across all studies, several experimental and prospective observational studies support that ALA consumption reduces the incidence of CHD (2). N-3 long-chain PUFAs eicosapentaenoic (20:5n-3, EPA) and docosahexaenoic acids (22:6n-3, DHA), that are essentially derived from marine sources, and to a lesser extent issued from the conversion of ALA which occurs at a very low rate in humans, have demonstrated physiological benefits on blood pressure, heart rate, triglycerides, and likely inflammation, endothelial function, and cardiac diastolic function (3). In France, where life expectancy is among the highest in the world, the older population has specific nutritional requirements in order to avoid malnutrition and also more subtle deficiencies due to the current imbalanced Western diets. To this end, there is a growing interest in the putative protective effects of n-3 PUFAs against cardiovascular disease, cancer and neuro-psychiatric disorders, whose incidence sharply increases with age (4). But although n-3 PUFAs seem essential as enhancers to be consumed for the promotion of healthy aging, no specific dietary recommendations are formulated for elderly in France as in many European countries. Several international and national organizations have indeed proposed recommended dietary intakes (RDIs) for PUFAs for specific population groups (such as pregnant and lactating women, infants, children and adolescents) and for the general adult population, while specifying that the RDI of adults could also be valid for the elderly (5). As reported by a recent review, the intake of PUFAs, notably n-3 PUFAs, is suboptimal in many European countries (5), like it has been showed in France by the data from  the cross-sectional national French INCA 2 dietary survey (2006-2007) (6). Evaluated against the French Agency for Food, Environmental and Occupational Health & Safety (ANSES) recommendations (7), only 2.3, 7.8, and 14.6% of the French adult population met RDIs for ALA, EPA, and DHA respectively. Since very few studies have focused on PUFA intake of French elderly, the objective of our study was to explore PUFA intakes in French elderly (≥ 65 and ≤ 79 years old, both genders) using the data on French food consumption issued from the French National Survey INCA 2 performed in 2006 and 2007, combined with the nutritional content of food consumed updated in 2013 by the French Information Center on Food Quality (8).


Material and methods

Following the same methodology as in Tressou et al. (6), INCA 2 data was combined to the ANSES Ciqual 2013 composition database (https://pro.anses.fr/TableCIQUAL/) to compute intakes of all fatty acids for the 348 adults aged from 65 to 79 years old. The group was further divided into 3 subgroups 65-69, 70-74, and 75-79 years old with sizes 150, 114, 84, respectively, and a mean female ratio of 56.6% (60% for 65-69 y, 55.3% for 70-74 y, and 52.4% for 75-79 y). This is sufficient to compute statistics by age group and by gender. As in Tressou et al. (6) and as recommended by ANSES, results are balanced using the weights provided in the INCA 2 database to get results that are representative of the French population. Calculations are performed with survey package of the R software. For each age group, daily intakes are expressed in grams per day (g/d) and as a percentage of the energy intake excluding alcohol (EIEA) for LA and ALA, and in milligrams per day (mg/d) for EPA and DHA. These intakes are compared to the current ANSES recommendations, and the percentages of elderly people meeting these RDIs are calculated. Moreover, the percentages of elderly people ingesting the adequate levels of LA and ALA required for a healthy entire organism functioning are also calculated.
Similar to European Food Safety Authority (EFSA) and Food and Agriculture Organisation (FAO) / World Health Organisation (WHO), no specific dietary recommendations were formulated for elderly in France as in many European countries (5). Japan is the worldwide only country to define specific recommendations for total n-3 PUFAs for elderly, stratified by age (50-69 y, and over 70 y) and gender (9). Although France discussed the specific dietary needs of the elderly at the early 2000s, the current French RDIs for lipid and PUFA intake in elderly are similar to those for the adult population, as no specific needs for any of the PUFAs were deemed evident for this age group according to the updated ANSES recommendations (10).
The current French RDIs for lipid and PUFA intake in adult (> 18 years old) differ in terms of disease prevention towards the metabolic syndrome, diabetes and obesity, cardiovascular diseases, breast and colon cancers, neurological diseases and age-related macular degeneration. For the healthy adult population, the mean French RDIs for total lipid fat intake are included between 35 and 40% EIEA. The mean RDIs for LA and ALA are 4% EIEA and 1% EIEA respectively, with a recommended LA/ALA ratio lower than 5. The mean RDIs for DHA and EPA+DHA are 250 mg/d and 500 mg/d, respectively. Based on scientific data which generally deal with the effects of EPA+DHA, a 250 mg/d RDI-like figure is derived from the DHA and EPA+DHA RDIs to evaluate the adequacy of EPA intake. ANSES has also defined adequate intakes for LA, ALA and DHA as adequate n-6 and n-3 PUFA requirements to prevent dietary deficit in essential fatty acids and to ensure a proper functioning of the body. These intakes are 2 and 0.8% EIEA, respectively for LA and ALA, and 250 mg/d for DHA.


Results

Results are presented in Table 1 for the three age groups (65-69 y, 70-74 y, and 75-79 y), regardless of gender.

Table 1 Mean daily intakes of main polyunsaturated fatty acids of the French elderly population (INCA 2–Ciqual) (Mean values and standard deviations; percentages, and 95% confidence intervals)

Table 1
Mean daily intakes of main polyunsaturated fatty acids of the French elderly population (INCA 2–Ciqual) (Mean values and standard deviations; percentages, and 95% confidence intervals)

LA, linoleic acid; ALA, alpha-linolenic acid; EPA, eicosapentaenoic acid; DHA, docosahexaenoic acid; * % EIEA, percentage of total energy intake excluding alcohol; † ANSES RDIs, French Agency for Food, Environmental and Occupational Health & Safety (ANSES) recommended dietary intakes (RDIs). ANSES RDIs for adults are expressed as % EIEA for LA and ALA (4 and 1% EIEA, respectively), with a recommended LA/ALA ratio lower than 5, and as mg/d for DHA (250 mg/d), EPA+DHA (500 mg/d), and EPA (250 mg/d RDI-like figure derived from the DHA and EPA+DHA RDIs); ‡ Adequate intakes of LA and ALA (2 and 0.8% EIEA, respectively) to avoid any essential fatty acid dietary deficit-related syndrome and to satisfy n-6 and n-3 PUFA human requirements for the proper functioning of the organism, notably development and brain functioning; § Percentage of elderly meeting ANSES RDIs (considered as ≥ 4% for LA, ≥ 1% for ALA, ≥ 250 mg for EPA and DHA and ≥ 500 mg for EPA+DHA for the calculation of percentages meeting the respective RDIs) or ingesting adequate levels of LA and ALA (considered as ≥ 2% and ≥ 0.8% for the calculation of percentages meeting the respective adequate intakes for LA and ALA); || Population size is given as weighted first (w) and raw after. For example, there were 150 elderly aged 65-69 in the survey but they are counted as 181 in the statistics presented so that the proportion of elderly at this age is representative of the French population.


French elderly mean total fat intake figures meet the RDIs defined by ANSES (10), i.e. 35-40% EIEA: figures are 37.8% EIEA (SD 6.2%) for the 65 to 69 years old, 37.3% EIEA (SD 6.8%) for the 70 to 74 years old, and 39.3% EIEA (SD 6.2%) for the 75 to 79 years old.
Mean intake of LA (4.2% EIEA) was ranging from 4.1 to 4.4% EIEA, slightly higher than the ANSES RDI value (4% EIEA). This intake increases with age, the 75 to 79 years old group having the highest mean intake. About 95% of the elderly of the 65-69 and 75-79 years old groups met as a minimum LA intake recommendation (i.e. 2% EIEA), compared to over 98% for the 70-74 years old elderly.
Average daily intake of ALA was 0.5% EIEA for all age groups, half of the RDI value (1% EIEA). Regarding the adequate daily intake for this PUFA (0.8% EIEA), from 5% to 8.8% of the elderly satisfy this intake, this percentage increasing with age. The low intake of ALA associated with an intake of LA in accordance with the RDI leads to a LA/ALA ratio between 9 and 10, whereas ANSES recommendation is inferior to 5.
The average daily intakes of DHA and EPA were 159 and 118 mg/d, respectively, ranging from 157 (65-69 y) to 164 (70-74 y) mg/d for DHA (RDI: 250 mg/d), and from 110 (75-79 y) to 129 (70-74 y) mg/d for EPA (RDI: 250 mg/d).
Despite these variations, there was no difference in LA, ALA, EPA and DHA dietary intakes based on age.
According to gender (data not shown), elderly men have a higher total energy intake than elderly women (from 21 to 28.5% higher depending on the age group). The mean daily intakes of LA, ALA, and EPA expressed in grams per day were higher in men than in women, but no differences were observed when expressed as a percentage of EIEA. The only recorded significant difference concerned the mean daily intake of ALA of the 65- to 69-year-old women (0.48 % EIEA, SD 0.18%) compared to men of the same group age (0.42 % EIEA, SD 0.16%).
Taken together our data show that the overall elderly population (over than 95%) for ALA and between 83% (75-79 y) and 88% (70-74 y) of the elderly population for EPA+DHA do not meet ANSES RDIs for n-3 PUFAs.


Discussion

From this study, it emerges an inadequacy of the n-3 PUFA intakes of the French elderly population (65-79 y) with the RDIs. Specifically, besides an adequate total fat daily intake and a LA daily intake close or superior to the RDI (from 4.1 to 4.4% EIEA vs 4% EIEA), the French elderly have, regardless of age and gender, a low mean dietary ALA intake equal half of the RDI (0.5% EIEA vs 1% EIEA), and a mean dietary DHA intake close to two-thirds of the ANSES recommendation (i.e. from 154 to 167 mg/d vs 250 mg/d). These translated into a LA/ALA ratio between 9.5 and 9.9, twice as high as the recommended threshold inferior to 5, and a mean dietary EPA+DHA intake (from 267 to 293 mg/d) slightly more than half of the RDI (500 mg/d). These mean dietary intakes are slightly higher than those described for the French adult population (6). The major food contributors to PUFA intake in French elderly are vegetable oils (25.5%) and condiments and sauces (12.9%) for LA, vegetable oils (14.7%) and margarine (11.1%) for ALA. Concerning the n-3 long chain PUFAs, the main contributor for DHA and EPA was fish (60.1% and 54.3%, respectively). Although vegetable oils and fish are the main dietary sources of ALA, and DHA+EPA, respectively, it seems that the inadequacy of the mean n-3 PUFA dietary intakes of elderly with the RDIs may be due to a not sufficient dietary intake of these foods, even if elderly have higher mean intakes for these foods than adults (11).
To date, very few studies have focused on PUFA intake of the European and French elderly population (5). In France, only two studies prior to INCA 2 study have reported such data. The first one concerned 1 786 elderly community dwellers (age range 67.7-94.9 years old) from Bordeaux, included in the Three-City cohort, in which mean dietary intakes were stratified in age (65-74 y, 75-84 y, and ≥ 85 y), and gender (4, 12). From data collected in 2001/2002, regardless of age and gender, the mean dietary intakes of the 1 786 elderly were 3.35% of energy intake (EI) (SD 2.35%), and 0.40% EI (SD 0.32%), respectively for LA and ALA, leading to a LA/ALA ratio of 9.9 (SD 7.05). Concerning n-3 long chain PUFAs, mean dietary intakes of EPA and DHA were 140 mg/d (SD 340 mg/d) and 280 mg/d (SD 690 mg/d), respectively. The intake of EPA was below recommended levels by ANSES (250 mg/d), while the mean consumption of DHA was close to the recommended intake. Gender only affects the total fat intake (lower in men than in women when expressed in proportion of EI), and no impact on the mean dietary intakes of LA, ALA, EPA and DHA. This cohort of elderly of southwestern France had higher mean EPA and DHA dietary intakes than those observed in the INCA 2 study but with very large ranges of intakes due to great inter-individual variability. Knowing that the main source of EPA and DHA is fish, a food not consumed daily in the Three-City cohort, the authors argued that these results might probably due to the single 24 h recall used which allows a good estimation of the mean but not of the variance of the consumption. Besides, compared to the present results, the mean dietary intakes of LA and ALA were slightly lower, but leading to a similar LA/ALA ratio. In conclusion, it emerged from this study that these elderly have an unbalanced fatty acid intake, characterized notably by a deficit of n-3 PUFAs.
The second French study is the CALIPSO survey which was conducted in four French coastal regions, in 1 011 high seafood consumers (fish and seafood at least twice weekly) aged 18 years old and over, among which 123 older subjects (≥ 65 years old) (13). The mean EPA and DHA dietary intakes of the 123 older subjects were 467 mg/d (SD 468 mg/d) and 819 mg/d (SD 737 mg/d), respectively, three to four times higher than the mean dietary intakes observed in the INCA 2 study. Concerning ALA, the mean dietary intakes of elderly (from 43 mg/d (SD 27 mg/d) to 95 mg/d (SD 88 mg/d) according to the coastal region) covered between 2 to 4.3% of the RDI for this PUFA. These values are much lower than those observed for the elderly in the INCA 2 study (half of the RDI value), due to the fact that the CALIPSO survey only studied the fish and seafood consumption and its contribution to n-3 long chain PUFA intakes (including ALA). Although the comparison with our results is rather difficult, these results show however that consumption of fish and seafood twice weekly allowed elderly to reach the n-3 long chain PUFA RDIs.
In Europe, in addition of the two French studies, nine studies from eight other countries have reported intake data for elderly aged ≥ 65 years old (for eight of them, the last one reporting data in elderly ≥ 60 years old) with different levels of accuracy according to the different PUFAs (5). From these studies, it emerges that mean LA and ALA intakes can be higher (6-7% EI for LA, 0.6% EI for ALA), lower (2.6% EI for LA, 0.2% EI for ALA) or close to that which are observed in the present study. Concerning EPA and DHA, a variability has also been observed between countries, with a mean dietary intake of EPA ranging from 50 to 283 mg/d and a mean dietary intake of DHA ranging from 80 to 631 mg/d. As mentioned by Sioen et al., the heterogeneity of the n-3 PUFA dietary intakes between the different studies could be due to the different methods used for dietary assessments (e.g. 24 h recall, food frequency questionnaires, dietary record) which may not capture the intake of foods that are not consumed on a daily basis such as fish and seafood, hence leading to n-3 PUFA intakes incorrectly estimated (5).
According to notices of AFSSA (former name of ANSES), about dietary requirements of elderly people suffering from some specific diseases, and WHO, about aging, elderly constitute a heterogeneous population in terms of health with altered nutrient requirements. These specific requirements are driven by modifications in body composition, physical activity, altered nutrient intake because of low variety of food consumed, reduced appetite, loss of sensory appreciation of food, dentition and swallowing problems, the presence of disease and social issues. Taken together, these changes may expose elderly to a high risk of inadequate PUFA intake, besides other important micronutrients (14, 15).
In the elderly, nutrition is one of the major determinants of successful aging, defined as the ability to maintain low risk of disease and disease-related disability, high mental and physical function and active engagement of life (16). Knowledge of nutrient requirements of older adults is growing yet is still inadequately documented. Older adults may have unique nutrients needs. The quantity of food and energy intake usually decreases substantially across the spectrum of aging, as observed in our study. Surprisingly, there is a lack of information about fatty acids, mainly n-3 long-chain PUFAs.
As proof, no recommendations from international and European organizations exist for elderly, as no specific needs for any of the PUFAs were deemed evident. As already mentioned, Japan is the only country to have PUFA dietary intake recommendations for elderly (9). These RDIs are based on the following considerations that for the elderly, weakening of their masticatory function, deterioration of digestive and absorptive function, and reduction in food intake due to less physical activities exist. Characteristics of this age group include frequent and wide variation of their individual food intake and the fact that many aged individuals are affected by an illness. The last update of the RDIs for Japanese elderly people, regarding the importance of issues involved with under-nutrition, nutritional deficiency as well as over-nutrition, reviewed scientific data about associations between energy or nutrients and frailty or sarcopenia. Japan set RDIs for total n-3 PUFA four to five times higher that French RDIs with mean dietary intakes higher for Japanese men than for women due to studies reporting that male older adults are more vulnerable in terms of nutrient intake compared with females. This is not only to prevent energy or nutrient deficiency that may be caused by inadequate nutrient intake, but also for the primary prevention of lifestyle-related diseases (9).
In France, the previous update of the French RDIs had set specific recommendations for the elderly (> 75 y) (17). These recommendations were based on in vivo data (n-3 PUFA blood status), on the described roles of the n-3 PUFAs, and on the fact that n-3 PUFA deficiency was associated with skin, ocular, metabolic and cognitive disorders, and that the occurrence of thrombotic, inflammatory, immune disorders and several pathological conditions (osteoporosis, sarcopenia, neurodegenerative diseases) increases with age. Taken together, and due to the fact that the activity of the desaturase enzyme, which converts essential precursors in longer-chain PUFAs, might be decreased in ageing, these data were in favor of n-3 PUFA RDIs for elderly. However, the last update of the French RDIs did not maintain specific recommendations for this age group. ANSES indeed reassessed the ALA and DHA RDIs for adult with increased mean dietary intakes, and, due to the lack of specific data for elderly suggesting that dietary needs of aged people may be different from adult ones, concluded that RDIs for adults also apply to elderly (10).
In conclusion, data collected from the INCA 2 survey evidence that 97% of the elderly population do not meet the RDIs for ALA versus more than 80% the RDIs for EPA+DHA. Detailed data of the third study on the food consumption and eating habits of the French population (INCA 3) (performed in 2014 and 2015) are expected in the next few months and will allow monitoring the evolution of PUFA dietary intakes for the different age groups of the French elderly population.
Nevertheless, the lack of specific RDIs for elderly raises questions about the importance of n-3 PUFAs for this age group. More and more scientific data reported that optimal nutrition is one of the most important determinants of healthier ageing, reducing the risk of disability, maintaining mental and physical functions, thus preserving and ensuring a better quality of life. Among the specific nutrients able to play a key role, n-3 PUFAs might have the potential of preventing and reducing co-morbidities in older adults, including rheumatoid arthritis, depression and macular degeneration. More precisely, n-3 PUFA status and dietary intake may have beneficial effects on cardiovascular system (atherosclerosis, arrhythmias), immune function (immune cell proliferation, pro-inflammatory cytokines, other cellular effects), muscle performance (muscle mass and function) and bone health in older adults. In addition, given their beneficial effects on brain function (dementia, depression and cognitive function), n-3 long-chain PUFAs appear to be neuroprotective and may also have unique properties in affecting neurobiology, both of critical interest during the aging process. Indeed, in contrast to their proposed actions in childhood, where they are required for healthy development of brain tissue, in older age n-3 PUFAs are more like to act in a protective and health maintaining manner (16, 18, 19).
N-3 PUFAs are so now identified as potential key nutrients, safe and effective in the treatment and prevention of several negative consequences of ageing. The available data encourage higher intakes of n-3 PUFAs, and recommendations for intake of these fatty acids should be developed for the elderly population.


Funding: This work was supported by grants of Terres Univia (France).
Author contributions: BB, JT, PG, NS, and SP conceptualized the study. BB wrote the manuscript. JT processed the statistical analysis. All authors read and approved the final version.

Conflict of interest statement: JT and SP reported grants from Terres Univia during the conduct of the study. BB, PG, and NS have no conflicts of interest to declare.

Ethical standards: The French INCA 2 dietary survey was approved by the French Data Protection Authority (Commission Nationale de l’Informatique et des Libertés n°2003X727AU) and the French National Council for Statistical Information (Conseil National de l’Information Statistique).


References

1.    Skeaff CM, Miller J. Dietary fat and coronary heart disease: summary of evidence from prospective cohort and randomised controlled trials. Ann Nutr Metab 2009; 55(1-3):173-201. doi: 10.1159/000229002
2.    Mozaffarian D. Does alpha-linolenic acid intake reduce the risk of coronary heart disease? A review of the evidence. Altern Ther Health Med 2005; 11(3):24-30; quiz 31, 79
3.    Aranceta J, Pérez-Rodrigo C. Recommended dietary reference intakes, nutritional goals and dietary guidelines for fat and fatty acids: a systematic review. Br J Nutr 2012; 107 Suppl 2:S8-22. doi: 10.1017/S0007114512001444
4.    Féart C, Jutand MA, Larrieu S, Letenneur L, Delcourt C, Combe N, et al. Energy, macronutrient and fatty acid intake of French elderly community dwellers and association with socio-demographic characteristics: data from the Bordeaux sample of the Three-City Study. Br J Nutr 2007; 98(5):1046-57
5.    Sioen I, van Lieshout L, Eilander A, Fleith M, Lohner S, Szommer A, et al. Systematic Review on N-3 and N-6 Polyunsaturated Fatty Acid Intake in European Countries in Light of the Current Recommendations – Focus on Specific Population Groups. Ann Nutr Metab 2017; 70:39-50. doi: 10.1159/000456723
6.    Tressou J, Moulin P, Vergès B, Le Guillou C, Simon N, Pasteau S. Fatty acid dietary intake in the general French population: are the French Agency for Food, Environmental and Occupational Health & Safety (ANSES) national recommendations met? Br J Nutr 2016; 116:1966–1973. doi: 10.1017/S000711451600413X
7.    French Agency for Food, Environmental and Occupational Health & Safety. Actualisation des apports nutritionnels conseillés pour les acides gras. Rapport d’expertise collective 2011. 2011. https://www.anses.fr/fr/system/files/NUT2006sa0359Ra.pdf. Accessed 30 Aug 2017
8.    French Agency for Food, Environmental and Occupational Health & Safety. Avis et rapport de l’Anses relatifs aux «Apports en acides gras de la population vivant en France. Comparaison aux apports nutritionnels conseillés définis en 2010». 2015. https://www.anses.fr/fr/system/files/NUT2014sa0117Ra.pdf. Accessed 30 Aug 2017
9.    National Institute of Health and Nutrition. Overview of Dietary Reference Intakes for Japanese (2015). 2015. http://www.mhlw.go.jp/file/06-Seisakujouhou-10900000-Kenkoukyoku/Overview.pdf Accessed 14 November 2017
10.    French Agency for Food, Environmental and Occupational Health & Safety. Avis et rapport de l’ANSES relatifs aux «Apports en acides gras de la population vivant en France. Comparaison aux apports nutritionnels conseillés définis en 2010». 2015. https://www.anses.fr/fr/system/files/NUT2014sa0117Ra.pdf. Accessed 14 November 2017
11.    French Food Safety Agency. Rapport de l’Agence française de sécurité sanitaire des aliments sur l’Etude Individuelle Nationale des Consommations Alimentaires 2 (INCA 2) (2006-2007). 2009. https://www.anses.fr/fr/system/files/PASER-Ra-INCA2.pdf. Accessed 14 November 2017
12.    Feart C, Alles B, Merle B, Samieri C, Barberger-Gateau P. Adherence to a Mediterranean diet and energy, macro-, and micronutrient intakes in older persons. J Physiol Biochem 2012; 68(4):691-700. doi: 10.1007/s13105-012-0190-y
13.    Bemrah N, Sirot V, Leblanc JC, Volatier JL. Fish and seafood consumption and omega 3 intake in French coastal populations: CALIPSO survey. Public Health Nutr 2008; 12(5):599-608. doi: 10.1017/S1368980008002681
14.    World Health Organization Nutrition for Older Persons. 2015. http://www.who.int/nutrition/topics/ageing/en/index1.html. Accessed 14 November 2017
15.    French Food Safety Agency. Avis de l’Agence française de sécurité sanitaire des aliments sur l’évaluation des besoins nutritionnels chez les personnes âgées fragiles ou atteintes de certaines pathologies afin de définir des références nutritionnelles permettant d’adapter leur prise en charge nutritionnelle. 2009. https://www.anses.fr/fr/system/files/NUT2008sa0279.pdf. Accessed 14 November 2017
16.    Ubeda N, Achón M, Varela-Moreiras G. Omega 3 fatty acids in the elderly. Br J Nutr 2012; 107 Suppl 2:S137-51. doi: 10.1017/S0007114512001535
17.    Martin A. Apports nutritionnels conseillés pour la population française, 3rd edn. 2001. TEC & DOC, Paris
18.    Molfino A, Gioia G, Rossi Fanelli F, Muscaritoli M. The role for dietary omega-3 fatty acids supplementation in older adults. Nutrients 2014; 6(10):4058-73. doi: 10.3390/nu6104058
19.    de Groot CP, van Staveren WA. Nutritional concerns, health and survival in old age. Biogerontology 2010; 11(5):597-602. doi: 10.1007/s10522-010-9284-5

MIDLIFE FACTORS THAT INFLUENCE THE AGING PROCESS: AN INDIAN PERSPECTIVE


S. Puri1, M. Shaheen2, D.H. Pai Panandiker3, R. Sinha4


1. Associate Professor; 2. Research Fellow, Department of Food & Nutrition, Institute of Home Economics, University of Delhi; 3. Chairman, ILSI-India;
4 . Executive Director, ILSI-India

Corresponding Author:  Seema Puri, Department of Food & Nutrition, Institute of Home Economics, University of Delhi, dr.seemapuri@gmail.com

J Aging Res Clin Practice 2017;6:246-251
Published online November 30, 2017, http://dx.doi.org/10.14283/jarcp.2017.33


Abstract

 Increasing number of oldest old worldwide has made human longevity a major area of scientific research. It is a well-established fact that the health of an individual and the population in general are the result of interactions between genetics and a number of environmental factors; nutrition and physical activity being of major importance. The Asian Indian phenotype predisposes Indians to NCDs, more so at an earlier age. Indian diets are in a state of transition with increasing amounts of refined carbohydrates and fats being consumed. Physical activity levels are markedly low. Concomitantly, a sharp rise in the prevalence of non-communicable diseases (NCDs) like diabetes, hypertension, cardiovascular diseases and cancers has been observed. Although some of the physiological changes experienced by older adults occur primarily as a result of the biological process of aging, lifestyle factors – such as diet and physical activity – are important modulators of the risk factors associated with chronic disease and even age related decline.

Keywords: Elderly, aging, midlife factors, NCDs.


Introduction

The physiological aging process starts once one reaches adulthood and continues throughout the middle age. While every individual ages at a different rate, the exposure to various environmental factors during this period can contribute not only to accelerating the aging process but may also influence the onset of chronic degenerative diseases which when superimposed on the aging process lead to further deterioration in the quality of life of the elderly. India is currently undergoing a rapid transition in its demographics as well as socioeconomic milieu. With better access to nutrition and health care and an increase in life expectancy to over 65 years, more Indians are living to an older age, often with chronic ailments. All those diseases which were characteristic of westernized societies in the past are now emerging as major health problems in developing and middle-income countries like India.
It is well established that at any Body Mass Index (BMI) and age, Asian Indians have higher body fat, visceral fat and waist circumference; lower skeletal muscle mass; thinner hips; short legs; profoundly higher rates of insulin resistance, metabolic syndrome, diabetes, dyslipidemia, hypoadiponectinemia, and increased cardiovascular risk than Europeans (1) which correlates with insulin resistance and adiponectin levels (2). These unique clinical and biochemical characteristics among Asian Indians in particular and South Asians in general are collectively referred to as the “Asian Indian Phenotype” or thin–fat phenotype. Hence, not only is the prevalence of NCDs greater among Indians but also the onset is at a much younger age. Moreover, the relationship of poor foetal growth with the development of NCDs in early adulthood is well known. There is evidence that low birth weight as well as ‘‘catch-up growth’’ are associated with an increased risk of hypertension, insulin resistance, Type 2 Diabetes Mellitus, and Coronary Heart Disease (CHD) in adults (3, 4).


Nutrition transition

India is presently undergoing a nutrition transition in three stages. In stage 1, consumers moved away from traditional staple items to food products more prevalent in ‘‘westernized’’ diets. In stage 2, the influences of globalization were much more marked and the consumers have access to a variety of convenience foods often high in salt, fat, sugar, preservatives etc. In stage 3, some people (especially those belonging to the high socioeconomic stratum) tend to realize adverse eating habits and try to adapt a healthy lifestyle.  Most Indians are currently in the second stage of nutrition transition (5). This transition over the past 30 years (1973–2004), has resulted in a 7% decrease in energy derived from carbohydrates and a 6% increase in energy derived from fats. A decreasing intake of coarse cereals, pulses, fruits and vegetables, an increasing intake of meat products and salt, coupled with declining levels of physical activity due to rapid urbanization have resulted in escalating levels of obesity, atherogenic dyslipidemia, subclinical inflammation, metabolic syndrome, type 2 diabetes mellitus, and coronary heart disease in Indians (5).


Dietary factors that influence aging in India

High carbohydrate consumption

Energy intake from carbohydrates (particularly cereals) is higher in Asian Indians as compared to other ethnic groups (6). Cereals are the staple diet in India, and carbohydrate consumption constitutes the bulk of the total calorie intake. The decreasing consumption of cereals in the past two decades (7) may indicate a shift towards (more) energy-dense ‘‘fast’’ foods (highly processed, deep-fried, unhealthy foods, devoid of adequate nutrients) as a source of energy in the diets but it still contributes approximately 73% of the energy intake in rural areas and 68% in urban areas. It is known that a high intake of carbohydrate (>55% of energy), even with a low fat intake, may lead to high serum triglyceride levels, hyperinsulinemia, and low levels of high density lipoprotein-cholesterol (HDL-C) (8). In addition, recent studies indicate that several dietary carbohydrates directly influence lifespan in various organisms through diverse signaling pathways (9, 10). It is seen that glucose consumption decreases the activity of AMP-activated protein kinase (AMPK), an energy sensor that regulates an organism’s lifespan.

High dietary fats

Indian diets are primarily vegetarian, and plant foods being low in ‘‘invisible’’ fat content, do not contribute significantly to total fat intake. The ‘‘visible fats’’ are derived from animal sources such as ghee (clarified butter having a high content of saturated fat), butter, and vegetable oils (11). ICMR has recommended a total fat intake between 20en% and 30en% for Indian adults (12).  Importantly, total fat intake has increased over the last three decades (1973–2005) in both rural (24– 35.5 g ⁄ day) and urban (36–47.5 g ⁄ day) populations in India (7, 13-15) due to an increase in the supply of fats and oils as well as an increase in the availability and consumption of energy-dense, high-fat diets (5). A recent report by NIN (2011) has shown the average intake of fats and oils among adult men to be 20g/day and among adult women 17 g/day (16). A high-fat diet (HFD) is generally associated with increased mortality and increased incidence of many metabolic diseases, including type 2 diabetes and cardiovascular problems (17). It is seen that dietary lipids may affect mammalian health and longevity by altering the compositions of body fat and cellular membranes (18).

Saturated fatty acids

In the Indian diets, saturated fatty acids (SFAs) are mostly derived from butter and ghee in north, middle, and west India, and coconut oil in south India. The SFA intake is increasing in the middle SES. Indian foods such as parantha (Indian bread prepared on a griddle using fat), bhatura (Indian bread prepared by deep frying), samosa (snack prepared by stuffing potato in refined wheat flour dough cones and deep frying), and suji halwa (dessert prepared using refined wheat flour [semolina] and fried in oil) are prime sources of SFAs in Indian diets, particularly when ghee or vanaspati (obtained from partially hydrogenated vegetable oil), are used in their preparation (19). Coconut fat accounts for 80% of the fat intake among Indians residing in south India. Kerala has not only the highest level of blood cholesterol, but also the highest rate of CHD in India (20).

Unsaturated fatty acids

Diets enriched in natural unsaturated fatty acids lower blood pressure, improve insulin sensitivity, and reduce the risks of cardiovascular and metabolic diseases (21).

Polyunsaturated fatty acids

Studies indicate that polyunsaturated fatty acids (PUFAs) prevent aging-associated diseases and promote longevity. For example, arachidonic acids, which are omega (Ω)-6 PUFAs, induce apoptosis of cancer cells (22). Saturated fatty acids and monounsaturated fatty acids are generally more resistant to oxidative damage than that of PUFAs with multiple double bonds (18). Thus, opposite from their potential role as dietary lipids, low levels of PUFAs in the membranes may be beneficial for longevity and health. Intake of n–3 PUFAs and long chain n–3 PUFAs is low in some South Asian populations, particularly among vegetarians (11). However, longitudinal cohort studies are needed in Indians to assess whether the ratio of n–6: n–3 or their absolute amounts play a role for the prevention and management of atherosclerosis (5).

Monounsaturated fatty acids

The MUFAs are present in the following oils: mustard, palm, olive, groundnut, rice bran, and soybean (all available in India), and some seeds (coriander, groundnut, sesame, and mustard) (23). Diets deficient in Monounsaturated fatty acid (MUFA) are reported to have detrimental effects on diastolic blood pressure (24) and lipid metabolism (25), particularly when the total fat intake is above the median (>37% of energy) (23). Data show that Indians belonging to low SES consume low amounts of MUFAs: males 4.7% and females 5.7% (26).  Rastogi et al (2004) compared persons consuming sunflower oil with those using mustard oil (the traditional cooking oil used in India, containing 70% MUFA, 10% ALNA and 12% LA) for cooking and frying and found that the latter had a significant lower risk for CVD after adjustment for age, sex, and smoking (27); however, dietary intervention to study the effects of MUFA-rich diets has not been attempted with Indians and needs investigation (5).

Trans-fatty acids

A high intake of trans-fatty acids (TFAs) has been associated with dyslipidemia and an increased risk of T2DM and CHD (28). Dietary trans-fats (unsaturated fatty acids with trans-isomers) trigger inflammatory responses, which increase the risks of developing cardiovascular and metabolic diseases (29). Indian diets as well as commercially fried, processed, baked, ready-to eat foods, and foods made by street vendors in India derive TFAs from partially hydrogenated vegetable oil, vanaspati due to its convenience of handling, low cost, and long shelf life (5). A TFA intake (percent energy) of 1.13 and 1.11 amongst adolescent and young adults in north India, respectively, has been reported by Misra et al (19).

Low protein intake

Protein intake among Indians is influenced by the vegetarian status of the majority of Indians whose protein is derived, apart from milk, from a combination of cereals and pulses, such as pulses and rice, and pulse and whole wheat unleavened bread (5). The NIN report (2011) revealed that the average intake of protein was around 60 g/day among 18-60 year old rural and urban men in India, while the average intake of protein was approximately 50 g/day among 18-60 year old women in rural and urban India (16). The consumption pattern of meat and related products is linked to the SES of the family in India. As Indians are becoming more affluent, animal foods are increasingly being consumed, both among rural and urban areas.  Interestingly, plant proteins contain considerably lower methionine than animal proteins (30), and this low methionine content may underlie the beneficial effects of dietary plant on longevity.

Dietary fibre, fruits and vegetables

The intake of coarse cereals and millets, such as whole wheat flour, pearl millet, barley, sorghum, and maize (corn), along with husked pulses, fruits and vegetables have been the most important contributors towards dietary fibre in Indian diets (5). A dose-dependent inverse association is seen between vegetable intake and CHD in the metropolitan Indian cities (27). Nationally representative surveys in India, however, indicate a very low per capita consumption of fruits and vegetables both among rural and urban adults (16).  In a study in south India, a higher intake of fruits and vegetables explained 48% of the protective effect against cardiovascular risk factors (31).

Indian spices and dietary salt

Spices have been an integral part of the Indian diets since ancient times. Some Indian spices have been reported to possess antioxidant and antimicrobial properties. In a natural mutant model of obese mice, turmeric (haldi) has been demonstrated to reduce the oxidation of LDL-C, lipid levels, blood glucose, and renal lesions (32); however, these beneficial effects of turmeric remain to be tested in human studies (5). Consumption of 25 g fenugreek seed powder in the daily diet has been shown to decrease blood glucose levels and has potential as an adjunctive therapy in the management of diabetes (33).  Garlic,  ginger, cloves  and mustard may also have some antioxidant, antimicrobial, anti-thrombotic, anti-inflammatory, and anti-cancer activities, as reported in (in vivo and in vitro) animal models in anecdotal studies (34).
Importantly, salt consumption has been found to be a significant predictor of hypertension in urban as well as in rural communities in north India (35). Population salt consumption, a strong determinant of high blood pressure and associated CVD, is very high across different regions with the average intake ranging between 8.5-9 grams/day (6, 36), with the intake being higher in urban compared to rural areas.

Nuts and oilseeds

Nuts and oilseeds are complex plant foods that are not only rich sources of unsaturated fat but also contain several non-fat constituents, such as protein, fibre, micronutrients (e.g. copper and magnesium), plant sterols, and phytochemicals (37). Long-term nut consumption has been associated with lower body weight and lower risk of obesity (38).  The frequency and quantity of nut consumption has been documented to be higher in vegetarian than in non-vegetarian populations.

Other Dietary Components

Kumar et al (39) found that low vitamin B12 levels is linked with higher incidence of CAD in this population recruited from a tertiary care centre in New Delhi, India. Another observational study by Chahal, Raina and Kaur (40) showed low mean serum Vitamin B12 levels in both study groups of employees as well as students. There is widespread prevalence of varying degrees (50- 90%) of Vitamin D deficiency with low dietary calcium intake in Indian population according to various studies published earlier (41, 42). Tuohimaa (43) showed that Calcidiol (pre-cursor of vitamin D), an active circulating hormone, is associated with an increased risk of aging-related chronic diseases more directly than calcitriol.
A study by Dherani et al (44) showed that the mean levels of serum vitamin C in a north Indian population was 0.22 mg/dl and that of vitamin E (α Tocopherol) is 0.23 mg/dl. Such low concentrations are said to cause age-related diseases in long-term (45).


Lifestyle factors that affect aging in India

When centenarians and other long-lived individuals are studied, their longevity is often attributed to a healthy lifestyle. Three characteristic behaviours are routinely reported; these include exercising regularly, maintaining a social network, and maintaining a positive mental attitude (46).

Physical Inactivity

The impact of physical activity on primary aging processes is difficult to study in humans because cellular aging processes and disease mechanisms are highly intertwined (47). Rather, regular physical activity increases average life expectancy through its influence on chronic disease development (via reduction of secondary aging effects) (48).
Few studies have estimated the physical activity levels in Indian population so far. In a study by Ramachandran et al (49) on temporal changes associated with pattern of life style (1989-2003) there had been a decline in levels of physical activity. Moreover, fewer subjects were engaged in manual work (22.8% in 2003 vs. 80% in 1989).  Rastogi et al (27) conducted a hospital-based case-control study and collected data from 350 cases of acute myocardial infarction and 700 controls matched on age, gender, and hospital in New Delhi and Bangalore. They observed a positive association between non-work sedentary activity and CHD risk; leisure-time exercise, as much as 35-40 minutes per day of brisk walking, was protective for CHD risk and sedentary lifestyles were positively associated with risk of CHD.

Tobacco Use

Tobacco use is also a leading risk factor for premature NCD associated death and disability  and accounts for more than two-third of all new cases of NCDs. Tobacco smoke has been linked to cause premature skin aging (50). A recent national data from the Global Adult Tobacco Survey (51) indicated the overall prevalence of tobacco use to be 35%, with increases noted in women compared to earlier surveys (48% in men and 20% in women). Nearly two in five (38%) adults in rural areas and one in four (25%) adults in urban areas use tobacco in some form (52). Furthermore, over half of all adults are being exposed to second-hand smoke (51).

Alcohol Consumption

Alcohol consumption has both health and social consequences via intoxication and alcohol dependence. Pattern of alcohol consumption varies with geographical location in the country. In India, the estimated numbers of alcohol users in 2005 was 62.5 million, with around 17% of them, which translates into 10.6 million, being dependant users (53). According to NFHS-3, 35% of ever married males report consumption of alcohol (54). Although moderate consumption of alcohol appears to be protective for heart attacks in western populations it appears to be either neutral or conferring higher risk among South Asians (55) possibly related to the binge drinking practices in India.


Diseases that affect aging in India

Obesity

The causes of profound accumulation of adipose tissue in an organism are primarily a combination of excessive caloric intake and a lack of physical activity (56). Studies in humans show that high total and abdominal adiposity are directly related to decreased telomere length, suggesting that obesity may accelerate the aging process (57).
The NFHS-3 (54) reported that among men, 8% were overweight and 1% obese. The highest rates of overweight and obesity have been observed in the epidemiologically and nutritionally advanced states, which, incidentally, also have higher rates of NCD risk and disease burden (58). Misra et al (26) reported 25% prevalence of obesity in the slums of Delhi.

Dyslipidemia

High serum lipid levels are major risk factors of coronary heart diseases that are influenced by lifestyle transition and urbanization. Limited information exists regarding the changing time-trends in lipid levels and the prevalence of dyslipidaemia in Indian subjects. ICMR study (59) reported 36.8% and 39.8% prevalence of hypercholesterolemia in the urban Delhi and rural Haryana respectively during 1991-94. Repeat cross- sectional surveys among urban subjects in Jaipur showed 37% vs. 43% prevalence among men and women during 2001 and 33% vs. 29% during 2002-03 (60, 61).

Frailty and Sarcopenia

There has been wide agreement amongst experts in the field that frailty is a distinct clinical entity, with a recent consensus statement defining frailty as (62): ‘….a medical syndrome with multiple causes and contributors that is characterised by diminished strength, endurance and reduced physiologic function that increases an individual’s vulnerability for developing increased dependency and/or death.’ Frailty has shown to predict the negative health outcomes that we associate with vulnerable older people such as disability, institutionalisation, hospitalisation, falls and death (63). Sarcopenia was first described by Rosenberg as the age-related loss of skeletal muscle mass (64). Regardless of the definition used, prevalence increases with age but women do not always have a higher prevalence than men (65). The prevalence of sarcopenia was found to be 17.5 % in a study by Tyrovolas et al (66). A multi-country study by WHO in community-dwelling older adults aged 50 years and above reported the incidence of frailty to be 55.5 % (67).

Non Communicable Diseases (NCDs)

Non-communicable diseases (NCDs) contribute to around 5.87 million deaths that account for 60 % of all deaths in India. India shares more than two-third of the total deaths due to NCDs in the South-East Asia Region (SEAR) of WHO. Major metabolic risk factors are obesity, raised blood pressure, raised blood glucose and raised blood total cholesterol levels. Besides being the leading cause of death globally, NCDs also cause impairments that, due to physical, environmental, social and/or attitudinal factors, can lead to disability. This reflects the accumulated effects of disease and injury during a person’s life, as well as declining physical strength in older age (68).


Conclusion

Adverse perinatal events due to maternal nutritional deprivation may cause low-birth weight infants, which, coupled with early childhood ‘‘catch-up growth’’, leads to obesity in early childhood, thus predisposing to NCDs later in life. The nutrition transition in India has resulted in a decreasing intake of coarse cereals, pulses, fruits and vegetables, an increasing intake of meat products and salt, coupled with declining levels of physical activity due to rapid urbanization. This has resulted in escalating levels of obesity, atherogenic dyslipidemia, subclinical inflammation, metabolic syndrome, type 2 diabetes mellitus, and coronary heart disease in Indians. The Asian Indian phenotype makes Indians not only highly susceptible to NCDs but also at a much younger age. Most NCDs have shared risk factors (tobacco use, unhealthy diet, physical inactivity, alcohol use) and integrated interventions targeting these risks from middle age will not only help to prevent and control NCDs, but also ensure a good quality of life in advancing years.


Conflicts of Interest: None. This review was supported by a grant from ILSI -India.


References

1.    Deepa R, Sandeep S, Mohan V.  Abdominal obesity, visceral fat, and type 2 diabetes- “Asian Indian Phenotype”. In: Mohan V, Gundu Rao, eds. Type 2 diabetes in South Asians; Epidemiology, Risk factors and Prevention. New Delhi: Jaypee Medical Publishers 2006;138-152.
2.    Chandalia M, Lin P, Seenivasan T, et al.  Insulin resistance and body fat distribution in South Asian men compared to Caucasian men. PLoS ONE. 2007;2(8):e812
3.    Godfrey KM, Barker DJ. Fetal nutrition and adult disease. Am J Clin Nutr 2000;71: 1344S–52S.
4.    Bhargava SK, Sachdev HS, Fall CH et al. Relation of serial changes in childhood body-mass index to impaired glucose tolerance in young adulthood. N Engl J Med 2004;350: 865–75.
5.    Misra A, Singhal N, Sivakumar B, Bhagat N, Jaiswal A, Khurana L. Nutrition transition in India: Secular trends in dietary intake and their relationship to diet-related non-communicable diseases. Journal of Diabetes 2011;3: 278–292.
6.    Misra A, Vikram NK, Arya S, Pandey RM, Dhingra V, Chatterjee A, Dwivedi M, Sharma R, Luthra K, Guleria R, Talwar KK. High prevalence of insulin resistance in postpubertal Asian Indian children is associated with adverse truncal body fat patterning, abdominal adiposity and excess body fat. Int J Obes Relat Metab Disord 2004;28(10):1217-26.
7.    National Sample Survey Organization, Ministry of Statistics and Program Implementation, Government of India. Report of the NSS 61st Round (July 2004– June 2005).
8.    Misra A, Wasir JS, Vikram NK. Carbohydrate diets, postprandial hyperlipidaemia, abdominal obesity and Asian Indians: A recipe for atherogenic disaster. Indian J Med Res 2005;121: 5–8.
9.    Schulz TJ, Zarse K, Voigt A, Urban N, Birringer M, Ristow M. Glucose restriction extends Caenorhabditis elegans life span by inducing mitochondrial respiration and increasing oxidative stress. Cell Metab. 2007;6, 280–293.
10.    Lee SJ, Murphy CT, Kenyon C. Glucose shortens the life span of C. elegans by downregulating DAF-16/FOXO activity and aquaporin gene expression. Cell Metab. 2009;10, 379–391.
11.    Misra A, Singhal N, Khurana L. Obesity, the metabolic syndrome, and type 2 diabetes in developing countries: Role of dietary fats and oils. J Am Coll Nutr 2010;29: 289S–301.
12.    ICMR. Task force project on Collaborative study of coronary Heart Study, 2010.
13.    National Sample Survey Organization, Ministry of Statistics and Program Implementation, Government of India, Report of the NSS 39th Round, 1983. Available from: http://www.mospi.gov.in/nsso_test1. htm
14.    National Sample Survey Organization, Ministry of Statistics and Program Implementation, Government of India. Report of the NSS 50th Round (July 1993 – June 1994). Available from: http://www.mospi.gov.in/ nsso_test1.htm
15.    National Sample Survey Organization, Ministry of Statistics and Program Implementation, Government of India. Report of the NSS 55th Round (July 1999 – June 2000).
16.    National Institute of Nutrition. A Report on Assessment of Consumption of Processed and Non-processed foods in India and Prevalence of Obesity, Hypertension, Diabetes and Cardio metabolic risk factors. Report submitted to FSSAI, 2011.
17.    Schrager MA, Metter EJ, Simonsick E, Ble A, Bandinelli S, Lauretani F, Ferrucci L. Sarcopenic obesity and inflammation in the InCHIANTI study. J. Appl. Physiol. 1985;102, 919–925.
18.    Hulbert AJ (2010) Metabolism and longevity: is there a role for membrane fatty acids? Integr. Comp. Biol. 2010;50, 808 –817.
19.    Misra A, Khurana L, Isharwal S, Bhardwaj S. South Asian diets and insulin resistance. Br J Nutr 2009;101: 465–73.
20.    Mohan V, Deepa R, Rani SS, Premalatha G. Prevalence of coronary artery disease and its relationship to lipids in a selected population in South India: The Chennai Urban Population Study (CUPS No. 5). J Am Coll Cardiol. 2001;38: 682–7
21.    Appel LJ, Sacks FM, Carey VJ, Obarzanek E, Swain JF, Miller ER III, Conlin PR, Erlinger TP, Rosner BA, Laranjo NM, Charleston J, McCarron P, Bishop LM. Effects of protein, monounsaturated fat, and carbohydrate intake on blood pressure and serum lipids: results of the OmniHeart randomized trial. JAMA 2005;294, 2455–2464.
22.    Cao Y, Pearman AT, Zimmerman GA, McIntyre TM, Prescott SM. Intracellular unesterified arachidonic acid signals apoptosis. Proc. Natl Acad. Sci. 2000;97, 11280–11285.
23.    Gopalan C, Ramasastri BV, Balasubramanian SC. Nutritive Value of Indian Foods. National Institute of Nutrition, Indian Council of Medical Research, Hyderabad, 1989.
24.    Rasmussen BM, Vessby B, Uusitupa M et al. Effects of dietary saturated, monounsaturated, and n–3 fatty acids on blood pressure in healthy subjects. Am J Clin Nutr 2006;83: 221–6.
25.    Rivellese AA, Maffettone A, Vessby B et al. Effects of dietary saturated, monounsaturated and n–3 fatty acids on fasting lipoproteins, LDL size and postprandial lipid metabolism in healthy subjects. Atherosclerosis 2003;167: 149–58.
26.    Misra A, Pandey RM, Devi JR, Sharma R, Vikram NK, Khanna N. High prevalence of diabetes, obesity and dyslipidaemia in urban slum population in northern India. Int J Obes Relat Metab Disord 2001;25 (11):1722-9.
27.    Rastogi T, Reddy KS, Vaz M et al. Diet and risk of ischemic heart disease in India. Am J Clin Nutr 2004;79: 582–92.
28.    Salmeron J, Hu FB, Manson JE et al. Dietary fat intake and risk of type 2 diabetes in women. Am J Clin Nutr 2001;73: 1019–26.
29.    Riserus U, Willett WC, Hu FB. Dietary fats and prevention of type 2 diabetes. Prog. Lipid Res. 2009;48, 44 –51.
30.    McCarty MF, Barroso-Aranda J, Contreras F. The low-methionine content of vegan diets may make methionine restriction feasible as a life extension strategy. Med. Hypotheses 2009;72, 125–128.
31.    Radhika G, Sudha V, Mohan Sathya R, Ganesan A, Mohan V.  Association of fruit and vegetable intake with cardiovascular risk factors in urban south Indians. Br J Nutr 2008;99: 398–405.
32.    Krishnaswamy K. Traditional Indian spices and their health significance. Asia Pac J Clin Nutr 2008;17(Suppl 1): 265–8.
33.    Tapsell LC, Hemphill I, Cobiac L et al. Health benefits of herbs and spices: The past, the present, the future. Med J Aust 2006;185: S4–24
34.    Khan A, Safdar M, Ali Khan MM, Khattak KN, Anderson RA.  Cinnamon improves glucose and lipids of people with type 2 diabetes. Diabetes Care 2003;26: 3215–8.
35.    Goel NK, Kaur P. Dr. P.C. Sen Memorial Award, 1994: Role of various risk factors in the epidemiology of hypertension in a rural community of Varanasi district. Indian J Public Health 1996;40 (3): 71–6.
36.    Mohan S, Reddy KS, Prabhakaran D. Chronic Non-communicable Diseases in India Reversing the Tide. Public Health Foundation of India, 2011.
37.    Rainey C, Nyquist L. Nuts – nutrition and health benefits of daily use. Nutr Today. 1997;32: 157–63
38.    Sabate J, Ang Y. Nuts and health outcomes: New epidemiologic evidence. Am J Clin Nutr 2009;89: 1643S– 8S.
39.    Kumar KA, Lalitha A, Pavithra D, Padmavathi IJN, Ganeshan M, Rao KR, Venu L, Balakrishna N, Shanker NH, Reddy SU, Chandak GR, Sengupta S, Raghunath M. Maternal dietary folate and/or vitamin B12 restrictions alter body composition (adiposity) and lipid metabolism in Wistar rat offspring. J Nutr Biochem. 2012;24(1):25–31. doi: 10.1016/j.jnutbio.2012.01.004.
40.    Chahal JS, Raina SK, Sharma KK and Kaur N. How common is Vitamin B12 deficiency – A report on deficiency among healthy adults from a medical college in rural area of North-West India. International Journal of Nutrition, Pharmacology, Neurological Diseases 2014;Vol 4; Issue 4
41.    Marwaha RK, Tandon N, Garg MK, Kanwar R, Narang A, Sastry A, Saberwal A, Bhadra K and Mithal A . Bone health in healthy Indian population aged 50 years and above, Osteoporos Int 2011;22(11); 2829-36
42.    Harinarayan CV, Joshi SR. Vitamin D status in India-Its implications and remedial measures. J Assoc Physicians India 2009; 57:40- 48.
43.    Tuohimaa P. Vitamin D and aging. The Journal of Steroid Biochemistry and Molecular Biology Volume 114, Issues 1–2, March 2009, Pages 78–84
44.    Dherani M,  Murthy GVS, Gupta SK, Young IS et al. Blood Levels of Vitamin C, Carotenoids and Retinol Are Inversely Associated with Cataract in a North Indian Population Invest Ophthalmol Vis Sci. 2008;49:3328 –3335
45.    McCann JC, Ames BN. Vitamin K, an example of triage theory: is micronutrient inadequacy linked to diseases of aging? Am. J. Clin. Nutr. 2009;90, 889–907.
46.    Spirduso WW, Francis KL, MacRae PG. Physical Dimensions of Aging. Champaign (IL): Human Kinetics, 2005
47.    Lakatta EG, Levy D. Arterial and cardiac aging: major share- holders in cardiovascular disease enterprises: Part I: Aging arteries: a ‘‘set up’’ for vascular disease. Circulation. 2003;107:139–46.
48.    Holloszy J. The biology of aging. Mayo Clin Proc. 2000;75(Suppl):S3–8; discussion S8–9. 98.
49.    Ramachandran A, Snehalatha C, Baskar ADS, Mary S, Sathish Kumar CK, Selvam S, Catherine S, Vijay V. Temporal changes in prevalence of diabetes and impaired glucose tolerance associated with lifestyle transition occurring in the rural population in India. Diabetologia, 2004;47:860- 86.
50.    Morita A, Torii K, Maeda A and Yamaguchi Y. Journal of Investigative Dermatology Symposium Proceedings 2009;Volume 14, Issue 1, Pages 53-55
51.    Global Adult Tobacco Survey, GATS India 2009-10. Ministry of Health and Family Welfare, New Delhi, India.
52.    Jha P, Jacob B, Gajalakshmi V, Gupta PC, Dhingra N, Kumar R, Sinha DN, Dikshit RP, Parida DK, Kamadod R, Boreham J, Peto R; RGI- CGHR Investigators. A nationally representative case-control study of smoking and death in India. N Engl J Med 2008;358:1137-47.
53.    Ray R. National survey on extent, pat- tern and trends of drug abuse in India. Ministry of Social Justice and Empowerment, New Delhi: Government of India and United Nations Office on Drugs and Crime,2004.
54.    International Institute for Population Sciences (IIPS) and Macro International. National Family Health Survey (NFHS-3), 2005– 06: India: 2007;Volume I. Mumbai: IIPS.
55.    Joshi P, Islam S, Pais P, Reddy S, Dorairaj P, Kazmi K, Pandey MR, Haque S, Mendis S, Rangarajan S, Yusuf S. Risk factors for early myocardial infarction in South Asians compared with individuals in other countries. JAMA 2007;297(3):286-94.
56.    Lau DCW, Douketis JD, Morrison KM, Hramiak IM, Sharma AM, Ur E, and for members of the Obesity Canada Clinical Practice Guidelines Expert Panel. 2006 Canadian clinical practice guidelines on the management and prevention of obesity in adults and children [summary] CMAJ 2007;176(8): S1–S13. doi:  10.1503/cmaj.061409
57.    Lee M, Martin H, Firpo MA, Demerath EW.  Inverse Association Between Adiposity and Telomere Length: The Fels Longitudinal Study. Am J Hum Biol. 2011;23(1): 100–106
58.    Mohan S, Reddy KS, Prabhakaran D. Chronic Non Communicable Diseases in India: Reversing the tide. Public Health Foundation of India, 2011
59.    Indian Council of Medical Research. Community control of rheumatic fever and rheumatic heart disease. Report of ICMR task force study, 1994.
60.    Gupta R, Prakash H, Gupta VP. Prevalence and determinants of coronary heart disease in a rural population of India. J Clin Epidemiol 1997;50(2):203-9.
61.    Gupta R, Deedwania PC, Gupta A, Rastogi S, Panwar RB, Kothari K. Prevalence of metabolic syndrome in an Indian urban population. Int J Cardiol. 2004;97: 257–61
62.    Morley JE, Vellas B, van Kan GA, et al. Frailty consensus: a call to action. J. Am. Med. Dir. Assoc. 2013;14 , 392–7
63.    Romero-Ortuno R & Kenny RA. The frailty index in Europeans: association with age and mortality. Age Ageing 2012;41 , 684–9
64.    Rosenberg I. Epidemiologic and methodologic problems in determining nutritional status of older persons. (summary comments). Am. J. Clin. Nutr. 1989;50 , 1231– 3
65.    Morley JE. Sarcopenia: diagnosis and treatment. J. Nutr. Health Aging 2008;12, 452–506 6.
66.    Tyrovolas S, Koyanagi A, Olaya B et al. Factors associated with skeletal muscle mass, sarcopenia, and sarcopenic obesity in older adults: a multi-continent study.  Journal of Cachexia, Sarcopenia and Muscle 2016;7: 312–321
67.    Arokiasamy P, Parasuraman S, Sekher TV and Lhungdom H. Study on global Aging and adult health (SAGE) Wave 1: India National Report, 2013.
68.    World Health Organisation. World Report on Ageing and Health, 2015;p.29