E. Alves Valle1, J. Vaz de Melo Mambrini1, S. Viana Peixoto1,2, D. Carvalho Malta2, C. de Oliveira3, M.F. Lima-Costa1
1. Oswaldo Cruz Foundation, René Rachou Research Centre, Belo Horizonte-MG, Brazil; 2. Federal University of Minas Gerais, School of Nursing, Belo Horizonte-MG, Brazil; 3. Department of Epidemiology & Public Health, University College London, London, UK
Corresponding Author: E. Alves Valle, CPQRR/Fiocruz Belo Horizonte, Av. Augusto de Lima, 1715 – Barro Preto, Belo Horizonte – MG, 30190-002, Brazil, +55 31 3349-7700, estevaovalle@gmail.com
J Aging Res Clin Practice 2016;inpress
Published online August 25, 2016, http://dx.doi.org/10.14283/jarcp.2016.112
Abstract
Abstract: Objective: To compare the consumption of selected healthy and unhealthy food groups among elderly Brazilians with daily living activity limitations relative to those with no limitations. Design: Cross-sectional analyses of a nationally representative survey. Setting: The Brazilian National Health Survey, conducted in 2013. Subjects: 11,177 Brazilians aged 60 and over. Results: The prevalence of daily living limitations was 29% (95% CI 27.6,30.5). The consumption of daily meat, beans on a regular basis, and recommended fruit and vegetables intake were 67.1% (95% CI 66.5,68.7), 71.3% (95% CI 69.9,72.8) and 37.3% (95% CI 35.6,39.9), respectively. Compared to those without functional limitation, the consumption of these three food groups was significantly lower among those older adults with functional limitation (Prevalence Ratio = 0.89, 95% CI 0.80,0.98; 0.90, 95% CI 0.82,0.99 and PR 0.86, 95% CI, 0.76,0.96, respectively), independently of age, sex, marital status, living arrangements and education. Level of education showed a strong positive association with fruit and vegetable consumption, and a negative association with bean consumption, a staple diet in Brazil. Conclusions: Our findings highlight the need for public health policies to increase consumption healthy food consumption among those older adults with functional limitations, especially fruit and vegetable intake among those who have low education levels.
Key words: Older adults, nutrition, activity of daily living, disability, healthy ageing, national health survey, Brazil.
Introduction
Nutrition among older adults is a significant public health issue in middle income countries overwhelmed with the rapid demographic ageing (1-3). Furthermore, this scenario generates great concern among policy makers because of the burden of disability in old age. There is evidence that a diet rich in vegetables, fruit, fish, nuts and wine is associated with more disability free days, compared to a diet rich in fast food, fried foods, sweets and fizzy drinks (2). A healthy diet is also associated with better cognition and mental health (3). However, physical, mental and financial barriers experienced by people with disabilities may limit their access to a healthier diet (4). A recent study, based on a nationally representative sample of US adults, showed that people with disabilities are less likely to meet recommended levels of saturated fat, fiber, vitamins A and C, calcium and potassium intakes compared to those without disability (4). These findings highlight the need for further research to investigate the association between poorer diet and disability in different countries and cultures.
Brazil has the world’s fifth largest population and has experienced considerable economic growth over the last decades. As a rapidly ageing middle-income country, social policy development for the elderly is of paramount importance (5, 6). From a nutritional perspective, the prevalence of obesity among Brazilians has increased, while the prevalence of undernutrition has an impressive decline (6). Recently, the Ministry of Health developed a guideline to promote healthy diet, as part of the national strategy for the control of non-communicable diseases and associated risk factors (7). As part of the public national health system (in Portuguese, “Sistema Único de Saúde”), Brazil has a national policy for the elderly, which considers the importance of individual functional status (5). No previous study has compared nutritional patterns between Brazilians with and without disabilities, an essential issue to guide health policies for the elderly.
In the present study, we used data from the most recent Brazilian National Health Survey (8) to describe the dietary habits of older Brazilians, to compare the consumption of selected healthy and unhealthy food groups between those with and without functional limitations and, finally, to identify sociodemographic factors associated to a lower consumption of certain food groups among those individuals with functional limitations.
Methods
The Brazilian National Health Survey (PNS)
Data are derived from the National Health Survey (“Pesquisa Nacional de Saúde”) (8), a nationally representative household survey conducted by the Brazilian Institute of Geography and Statistics (IBGE) and Ministry of Health in 2013. The survey employs a complex sampling design. The primary sampling units are census tracts based on the 2010 census and randomly selected from the IBGE national master sampling plan. Within each census tract, households were randomly selected. Within selected households, a randomly selected respondent aged 18 or over was invited to take part in the study. The final sample size of persons aged 18 years and over was 62,986 (8). All survey participants aged 60 years and older were selected for this analysis.
Functional limitation
Physical functioning limitation was defined as reporting having any difficulty in one or more of the following ten basic (ADL) and/or instrumental activities of daily living (IADL): dressing, walking across a room, bathing or showering, eating, getting in or out of bed, using the toilet, going outside the house using a transportation, managing medications, shopping and managing finances.
Dietary habits
Dietary pattern was assessed by daily or weekly frequency consumption of certain healthy and unhealthy food groups. The following groups, with definitions used, were: regular fish intake (in one or more days per week); regular intake of beans (five or more days per week); recommended fruit and vegetable intake (five or more daily portions, five or more days per week, including wholesome food, in salads or juices); red meat or chicken with visible fat (once or more times per week); full fat milk (any weekly frequency); regular consumption of sweets (five or more days a week); regular ingestion of fizzy drinks or artificial juices (five or more days a week) and high levels of salt (according respondent’s self-perception).In addition, the daily meat consumption (beef, pork and/or chicken) was measured since it is an important marker of protein intake in older adults (9).
Sociodemographic characteristics
Sociodemographic characteristics include age group (60-64, 65-74, 75 and older), sex, marital status (married, divorced/single and widow), number of residents within the household (live alone, two, three or more) and educational attainment. Educational attainment was categorized into: less than four years of schooling, five to eight years of schooling, nine to eleven years of schooling, and 12 years or more.
Statistical analysis
Descriptive analyses were based on prevalence and their respective 95% confidence intervals. In the unadjusted analyses, Pearson Chi Squared test was used to assess the significance of differences between the sociodemographic variables and the dietary patterns of older adults with and without functional limitations. Multivariate analyses, investigating the association between dietary patterns and functional limitations, were performed using prevalence ratios and their 95% confidence intervals through Poisson regression models (10). This was also the statistical approach used to examine the associations between sociodemographic characteristics and daily meat intake, recommended daily intake of fruit and vegetables and regular ingestion of beans of older adults with and without functional limitations. The estimated prevalence ratios from the Poisson regression models were adjusted simultaneously by age, sex, educational attainment, marital status and number of residents within the household. All analyses were performed using Stata version 13.0 and results incorporate appropriate procedures to control for weights and the complex PNS sample design (11).
Ethical approval
The National Health Survey was approved by the National Commission of Ethics in Research on Human Beings (in Portuguese, “Comissão Nacional de Ética em Pesquisa”), of the Ministry of Health, (Process number 328.159 of June 2013). All participants signed a consent form.
Results
The present analysis was based on 11,177 survey participants aged 60 years and over. 3,340 (29.0%; 95% CI: 27.6-30.5%) reported some functional limitation. Table 1 presents descriptive statistics for the sample. Overall, participants predominantly aged between 65 and 74, were female, married, residents in households with 3 or more residents and had five to eight years of schooling. The prevalence of women with functional limitation was significantly higher compared to those without functional limitations (62.4% versus 53.9%). Statistically significant differences (p<0.05) between those with functional limitation compared to those without were observed for oldest age (46.5% vs. 16.7%aged 75 and older, respectively), widowed (39% vs 21.5%) and those with educational attainment less than four years of schooling (47.7% vs 25.7%).
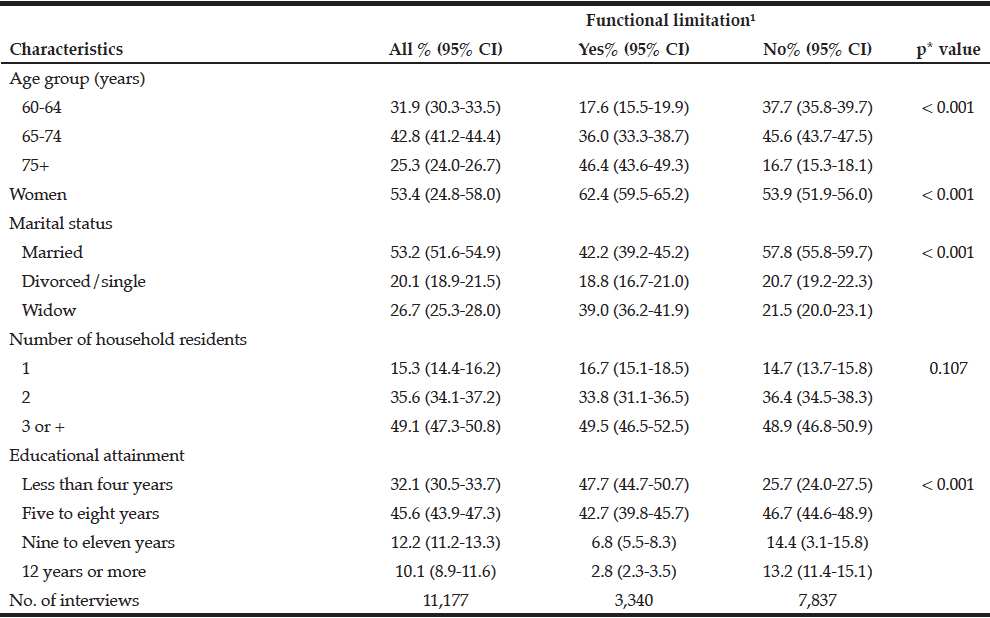
Table 1
Sociodemographic characteristics of the sample of older Brazilians, and by functional limitation status (The Brazilian National Health Survey, 2013)
1. At least one difficulty in the following ten activities: dressing, walking across a room, bathing or showering, eating, getting in or out of bed, using the toilet, handling transportation (driving or navigating public transit), managing medications, shopping and managing finances; %: (95% CI): weighted prevalence and 95% confidence interval; * To test differences between those with and without functional limitation (Pearson Chi-squared test)
The prevalence of selected food groups intake among study participants, and by functional limitation, is displayed in Table 2. Overall, higher prevalence rates were found for weekly consumption of full fat milk (73.8%), regular intake of beans (71.3%), daily consumption of meat (67.1%) and regular fish intake (58.4%). On the other hand, lower prevalence rates were observed for the recommended intake of fruit and vegetables (37.3%), weekly intake red meat or chicken with visible excess of fat (28.2%), regular sweets (17.2%), regular fizzy drinks/artificial juices (12.0%) and high salt intake (7.9%). Significant associations (p<0.05) with functional limitation were found with daily meat consumption (64.1 vs 68.4%, those with and without limitations, respectively), regular fish intake (53.3% and 60.4%, respectively), recommended amount of fruit and vegetable intake (32.1% vs 39.4%, respectively) and excessive salt intake (6.3% vs 8.6%, respectively).
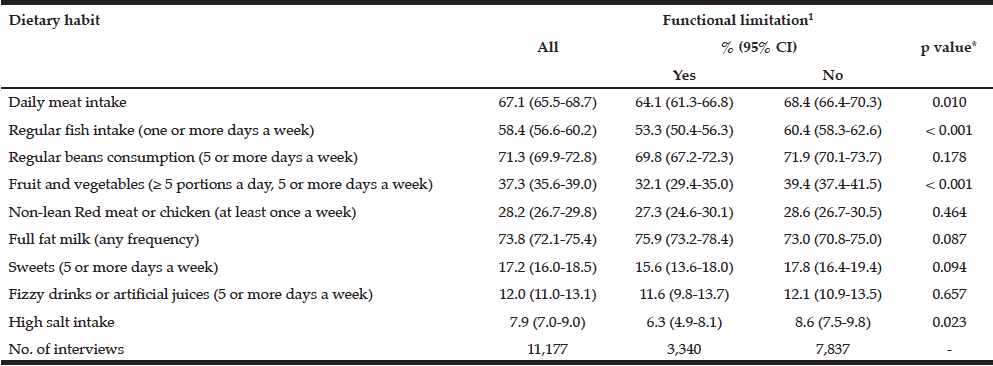
Table 2
Dietary habits of older Brazilians, and by functional limitation status (The Brazilian National Health Survey, 2013
1. At least one difficulty in the following ten activities: dressing, walking across a room, bathing or showering, eating, getting in or out of bed, using the toilet, handling transportation (driving or navigating public transit), managing medications, shopping and managing finances; %: (95% CI): weighted prevalence and 95% confidence interval; * To test differences between those with and without functional limitation (Pearson Chi-squared test)
Table 3 presents results of multivariate Poisson regression models for each outcome. After adjusting for sociodemographic characteristics, the dietary patterns that remained significantly associated with functional limitation were: daily meat intake (PR = 0.89, 95% CI: 0.80-0.98), recommended fruit and vegetables intake (PR = 0.86, 95% CI: 0.76-0.96) and regular bean consumption (PR = 0.90, 95% CI: 0.82-0.99).
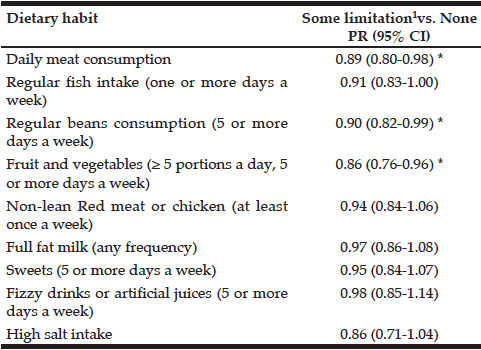
Table 3
Multivariate analysis of dietary habits and functional limitation among older Brazilians (Brazilian National Health Survey, 2013)
1. At least one difficulty in the following ten activities: dressing, walking across a room, bathing or showering, eating, getting in or out of bed, using the toilet, handling transportation (driving or navigating public transit), managing medications, shopping and managing finances; PR (95% CI): weighted prevalence ratios and their 95% confidence intervals estimated by Poisson regression models and adjusted for age, sex, marital status, household number of residents and educational attainment; *p < 0.05
Results from the multivariate analysis of the association of sociodemographic characteristics with selected dietary habits among those participants with and without functional limitation are shown in table 4. Generally, the association was similar in both functional groups, as follows: women had a positive association with the recommended fruit and vegetable intake and a negative association with regular bean consumption; the number of residents within the household (i.e. three or more) was positively associated with regular bean consumption; schooling level was positively correlated with recommended vegetable intake, and negatively correlated with regular bens intake. Conjugal status showed no significant association with the consumption of all the above mentioned foods in any group. Oldest aged showed a negative association with regular bean intake among those with functioning limitations.
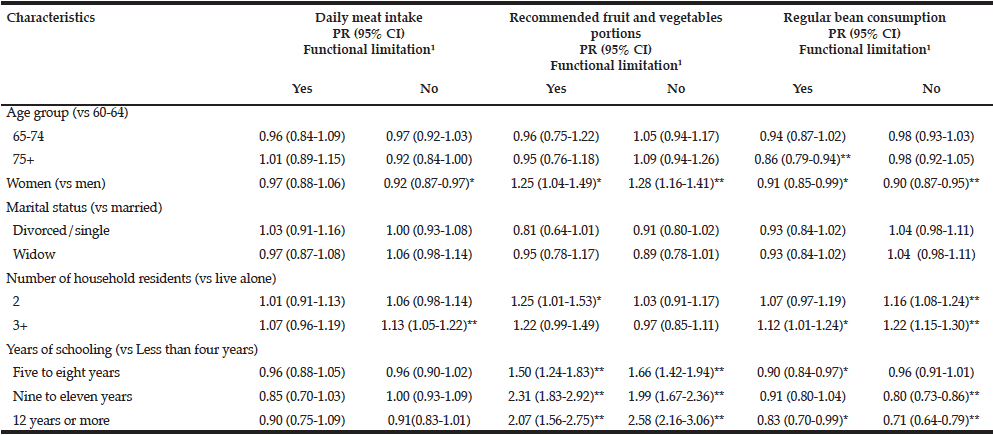
Table 4
Multivariate analysis of sociodemographic factors, selected dietary habits and functional limitation among older Brazilians (Brazilian National Health Survey, 2013)
1. At least one difficulty in the following ten activities: dressing, walking across a room, bathing or showering, eating, getting in or out of bed, using the toilet, handling transportation (driving or navigating public transit), managing medications, shopping and managing finances; *p < 0.05; ** p <= 0.001; PR (95% CI): weighted prevalence ratios and their 95% confidence intervals estimated by Poisson regression models and adjusted for age, sex, marital status, household number of residents and educational attainment
Discussion
The key findings from this study, based on a nationally representative sample of non-institutionalised older Brazilian adults, are: (1) those with functional limitations were less likely to a daily intake of meat, recommended intake of fruit and vegetables and regular ingestion of beans, independent of age, sex and other sociodemographic characteristics; (2) educational attainment was the strongest sociodemographic factor associated to recommended fruit and vegetables intake (higher intake among those with higher educational attainment).
Our findings corroborated previous research based on data from the Brazilian National Household Survey (PNAD) conducted in 1998, 2003 and 2008 that showed higher prevalence of functional limitation among the oldest old, women and those with a low level of education (12,13). Regarding dietary patterns, our study found similar results to earlier descriptive analyses from the Brazilian National Health Survey (2013), based on data from the population aged 18 and older, showing high consumption of healthy foods (such as beans and fish), in contrast with low consumption of fruit vegetables and high intake of food rich in saturated fat (non-lean red meat, chicken or full fat milk) (14, 15).
After adjusting for sociodemographic factors, the dietary patterns of older Brazilians with and without functional limitations were similar, regarding the regular consumption of fish, food rich in fat, fizzy drinks or artificial juices, sweets and salt. On the other hand, the daily meat intake (red meat, chicken and/or fish) was smaller among those with functional limitation. To note that low protein intake may lead to an increased risk to sarcopenia, frailty, falls and fractures resulting into an even greater risk to develop functional limitations (9, 16). Brazilian guidelines (7) and others (17, 18) recommend a diet rich in fruit, vegetables and pulses, like beans, for its important preventive role against the development of non-communicable diseases (17, 18). The current analysis shows that older adults with functional limitations are 10% and 14% less likely to eat regularly beans and the recommended intake of vegetables, respectively.
It is worth mentioning that there are physical, mental and financial barriers which could prevent older adults with functional limitation to have a healthier diet (4). Unfortunately, data from national health surveys usually do not generate information that allows us to identify these barriers. Therefore, the present analysis was focused on sociodemographic factors associated to some healthy diet habits. Overall, the sociodemographic factors associated to daily intake of meat, recommended intake of fruit and vegetables and regular ingestion of beans were similar among those participants with and without functional limitations. Compared to men, women with and without functional limitation reported less meat and beans intake and higher fruit and vegetable consumption. Similar findings regarding women eating more fruit and vegetables were found in Canada (19) but not in South Africa and Iran (20, 21). Furthermore, a qualitative study showed that Canadian women were more aware of the benefits of such food group compared to men (22). Regular ingestion of beans also had a positive and independent association with household number of residents.
As previously mentioned, educational attainment was the strongest sociodemographic factor associated to fruit and vegetable and intake among both those with and without functional limitation. The prevalence of recommended fruit and vegetable intake increased by each level of educational attainment in both functioning groups (with and without functional limitation), with those with 12 or more years of schooling having the highest intake levels. Older Brazilian adults with and without functional limitations with 12 or more years of schooling degree were 207% and 258% more likely to regularly eat fruits and vegetables compared to those with low educational attainment. The positive association between the recommended fruit and vegetables intake and education or income has also been observed in other countries (19, 21, 23). An interesting study conducted in Brazil using data from the Brazilian National Family Budget Survey showed that the total household expenditure on fruit and vegetables is inversely proportional to the price of such food and directly proportional to the household income (24).
In contrast, regular consumption of beans, an important ingredient of the Brazilian staple diet, decreased gradually according to level education in both those with and without functional limitation. Older adults with and without functional limitation with 12 or more years of schooling were17% and 29%, respectively, less likely to eat beans regularly than those with lower education level. A negative association between educational level and beans intake among adults residing in large cities in Brazil has been previously reported (25,26). Beans are an important source of protein, fibre, minerals, vitamins and flavonoids with potential benefits to health (27). This type of food has been considered by some authors as the “meat of the poor” due to its important nutritional value in low income countries (28) and perhaps it has been replaced by other types of food culturally considered “posh” by higher socioeconomic groups’ individuals.
This study has some strengths and limitations. The strength of the present study lies in its large nationally representative sample of older Brazilian with data on functional limitation and dietary habits. Therefore, to the best of our knowledge, this is the first study to compare dietary habits of older Brazilian with and without functional limitations. However, because the data are cross-sectional, we are unable to determine causal relationships and directionality of the observed associations. We are not able to establish if dietary habits were adopted before the development of functional limitation or vice-versa. In addition, the dietary habits module of the interview is rather concise and like any questionnaire on diet is prone to recall bias, leading to under or overestimation of amount of consumption (29). However, it is unlikely that differential associations have affected those with and without functional limitations. Finally, in our analyses we could not establish an individual and/or household income which could directly affect the food choice purchase (24). This limitation was partially addressed by using data on educational attainment which is an important socioeconomic position indicator.
In 2006, the Brazilian Ministry of Health implemented the National Health Policy for the Elderly raising the issue of how important it is to include functional limitation as one of its policies (5). 27 million Brazilian people are currently aged 60 and older (30). Taking into account the findings from the present study, about 5.4 million older adults in Brazil eat less than the recommended amount of fruit and vegetables as indicated by the WHO (31). In conclusion, our findings highlight the importance of assessing dietary habits when investigating functional limitation in older adults. Our findings also highlight the need for public health policies to increase consumption healthy food consumption among those older adults with functional limitations, especially fruit and vegetable intake among those who have low education levels.
Acknowledgements: This study was funded by the Brazilian Ministry of Health, Secretariat of Health Surveillance. MFLC and SVP are fellowship researchers of the Brazilian National Council for Scientific and Technological Development (CNPq).
References
1. United Nations. Department of Economic and Social Affairs. Population Division. World Population Prospects. The 2015 Revision, 2015. http://esa.un.org/unpd/wpp/. Accessed April 2016.
2. Struijk EA, Beulens JWJ, May AM, et al. Dietary patterns in relation to disease burden expressed in Disability- Adjusted Life Years 1 – 3. Am J Clin Nutr 2014;100(4), 1158-1165.
3. Milte CM, McNaughton SA. Dietary patterns and successful ageing: a systematic review. Eur J Nutr 2016;55(2), 423-50.
4. An R, Chiu CY, Zhang Z, Burd NA. Nutrient intake among US adults with disabilities. J Hum Nutr Diet 2015;28(5), 465-475.
5. BRASIL. Ministério da Saúde. Portaria nº 2.528 de 2006. http://bvsms.saude.gov.br/bvs/saudelegis/gm/2006/prt2528_19_10_2006.html. (Accessed April 2016.
6. Conde WL, Monteiro CA. Nutrition transition and double burden of undernutrition and excess of weight in Brazil. Am J Clin 2014;100(6),1617S – 1622S.
7. Monteiro CA, Cannon G, Moubarac JC, et al. Dietary guidelines to nourish humanity and the planet in the twenty-first century. A blueprint from Brazil. Public Health Nutr 2015;18(13),2311-2322.
8. Szwarcwald CL, Malta DC, Pereira CA, et al. Pesquisa Nacional de Saúde no Brasil: concepção e metodologia de aplicação. Cien Saude Colet. 2014;19(2); 333-342.
9. Nowson C, O’Connell S. Protein Requirements and Recommendations for Older People: A Review. Nutrients 2015;7(8), 6874-6899.
10. Long S, Freese J. Regression Models for Categorical Dependent Variables Using Stata. Stata Press, College Station, Texas, 2014.
11. Souza-Júnior PRB, Freitas MPS, Antonaci G et al. Desenho da amostra da Pesquisa Nacional de Saúde 2013. Epidemiol e Serviços Saúde 2015;24(2), 207-216.
12. Lima-Costa MF, De Oliveira C, Macinko J, Marmot M. Socioeconomic Inequalities in Health in Older Adults in Brazil and England. Am J Public Health. 2012;102(8),1535-1541.
13. Lima-Costa MF, Matos DL, Camargos VP, Macinko J. Tendências em dez anos das condições de saúde de idosos brasileiros: evidências da Pesquisa Nacional por Amostra de Domicílios (1998, 2003, 2008). Cien Saude Colet. 2011;16, 3689-3696.
14. Claro RM, Aline M, Santos S et al. Consumo de alimentos não saudáveis relacionados a doenças crônicas não transmissíveis no Brasil: Pesquisa Nacional de Saúde, 2013 Epidemiol e Serviços Saúde 2015;24(2), 257-265.
15. Jaime PC, Stopa SR, Oliveira TP et al. Prevalência e distribuição sociodemográfica de marcadores de alimentação saudável, Pesquisa Nacional de Saúde, Brasil 2013. Epidemiol e Serviços Saúde. 2015;24(2),267-276.
16. Imai E, Tsubota-Utsugi M, Kikuya M, et al. Animal protein intake is associated with higher-level functional capacity in elderly adults: The Ohasama study. J Am Geriatr Soc. 2014;62(3), 426-434.
17. FAO/WHO. Fruit and Vegetables for Health: Report of a Joint FAO/WHO Workshop, 1-3 September, Kobe, Japan, 2004
18. NICE Guidelines, 2015. Dementia, Disability and Frailty in Later Life – Mid-Life Approaches to Delay or Prevent Onset.http://nice.org.uk/guidance/ng16. Accessed April 2016.
19. Riediger ND, Moghadasian MH. Patterns of fruit and vegetable consumption and the influence of sex, age and socio-demographic factors among Canadian elderly. J Am Coll Nutr. 2008;27,1541-1087.
20. Salehi L, Eftekhar H, Mohammad K et al. Consumption of fruit and vegetables among elderly people: a cross sectional study from Iran. Nutr J. 2010;9(1):2.
21. Peltzer K, Phaswana-Mafuya N. Fruit and vegetable intake and associated factors in older adults in South Africa. Glob Health Action. 2012;5,1-8.
22. Paquette M-C. Perceptions of healthy eating: state of knowledge and research gaps. Can J Public Health 96, Suppl. 2005;3, S15-S19.
23. Gregory-Mercado KY, Staten LK, Ranger-Moore J, et al. Fruit and vegetable consumption of older Mexican-American women is associated with their acculturation level. Ethn Dis. 2006;16(1), 89-95.
24. Claro RM, Monteiro CA. Renda familiar, preço de alimentos e aquisição domiciliar de frutas e hortaliças no Brasil. Rev Saude Publica 2010;44(6), 1014-1020.
25. Velásquez-Meléndez G, Mendes LL, Pessoa MC, et al. Tendências da frequência do consumo de feijão por meio de inquérito telefônico nas capitais brasileiras, 2006 a 2009. Cien Saude Colet. 2009;17(12), 3363-3370.
26. Malta DC, Campos MO, Oliveira MM De, Pinto B, et al. Prevalência de fatores de risco e proteção para doenças crônicas não transmissíveis em adultos residentes em capitais brasileiras, 2013. Epidemiol. Serv. Saúde, 2015;24(3), 373-387.
27. Hayat I, Ahmad A, Masud T et al. Nutritional and health perspectives of beans (Phaseolus vulgaris L.): an overview. Crit Rev Food Sci Nutr. 2014;54, 580-592.
28. Tharanathan RN, Mahadevamma S. Grain legumes – A boon to human nutrition. Trends Food Sci Technol. 2003;14(12), 507-518.
29. Molag ML, De Vries JHM, Ocké MC, et al. Design characteristics of food frequency questionnaires in relation to their validity. Am J Epidemiol. 2007;166(12),1468-1478.
30. Instituto Brasileiro de Geografia e Estatística – IBGE. Sinopse Do Censo Demográfico 2010.; 2011. http://portal.mte.gov.br/data/files/8A7C816A2E7311D1013003524D7B79E4/IBGE_CENSO2010_sinopse.pdf Accessed April 2016.
31. World Health Organization, 2004. Global Strategy on Diet, Physical Activity and Health. Fifty-Seventh World Health Assembly. http://www.who.int/dietphysicalactivity/strategy/eb11344/strategy_english_web.pdf Accessed April 2016.

