C. Dussaillant1, G. Echeverría1, L. Villarroel2, C.B. Yu3, A. Rigotti1,4, P.P. Marín3,5
1. Centre for Molecular Nutrition and Chronic Diseases (CNMEC-UC), School of Medicine, Pontificia Universidad Católica de Chile; 2. Department of Public Health, School of Medicine, Pontificia Universidad Católica de Chile; 3. Program of Geriatrics, School of Medicine, Pontificia Universidad Católica de Chile; 4. Department of Nutrition, Diabetes and Metabolism, School of Medicine, Pontificia Universidad Católica de Chile; 5. Department of Internal Medicine, School of Medicine, Pontificia Universidad Católica de Chile
Corresponding Author: Dr. Pedro Paulo Marín, Department of Internal Medicine-Geriatrics, School of Medicine, Pontificia Universidad Católica de Chile. Lira 63, Santiago, Chile, ppmarin@med.puc.cl
J Aging Res Clin Practice 2016;5(3):132-138
Published online June 23, 2016, http://dx.doi.org/10.14283/jarcp.2016.104
Abstract
Objectives: To analyze the relationship between the prevalence of metabolic syndrome, food intake, and diet quality in elderly (≥65 years old) Chilean population. Design: Cross sectional analysis based on the last national health survey performed in the years 2009 and 2010 (ChNHS 2009-2010). Setting: Non-institutionalized individuals of 65 years or older were selected and visited at home. Participants: A subsample of 505 elderly adults from the ChNHS 2009-2010 who answered a food questionnaire and had appropriate information to diagnose metabolic syndrome following the ATPIII-NCEP guidelines. Measurements: Fasting blood samples were obtained in order to measure blood lipids and fasting blood glucose. Blood pressure, waist circumference, and body mass index (BMI) were also measured. A 5-item food frequency questionnaire was applied to all the participants of NHS 2009-2010. Results: The overall prevalence of metabolic syndrome in the Chilean adult population was 37.7%, increasing in frequency with advancing age. Among the elderly (≥65 years old), metabolic syndrome was found in 57.2% of the sample. Elevated blood pressure and increased waist circumference were the most prevalent metabolic syndrome components among this group (88% and 80%, respectively). Low intake of fruits, vegetables, whole cereals, fish, and dairy was seen among the elderly, and no association was found between food intake nor diet quality and metabolic syndrome prevalence. Conclusion: Metabolic syndrome is highly prevalent among the Chilean elderly population and its prevalence is not associated with food intake or diet quality in this age group.
Key words: Metabolic syndrome, food intake, diet quality, elderly.
Introduction
Worldwide, the number of elderly people, defined as 65 years of age and over, is consistently growing. In fact, by the year 2025, it is expected that the number of elderly in the world will be more than 1.2 billion, with 840 million of them living in low-income countries (1). As life expectancy increases, age-associated risk conditions and diseases, such as metabolic syndrome (MS) and cardiovascular disease (CVD), have become increasingly prevalent among the elderly. In Latin America, this ongoing epidemiological transition -along with lifestyle changes- in the last decades has increased the prevalence of obesity and other chronic conditions that lead to CVD (2). Thus, CVD has become an enormous public health burden, raising the need of more detailed survey and intervention studies to increase awareness and to facilitate design and implementation of adequate preventive and treatment strategies.
The metabolic syndrome (MS) is a cluster of risk factors known to promote CVD and diabetes (3). Several definitions and diagnostic criteria for this syndrome have been proposed by organizations such as the World Health Organization (WHO) (4), the US National Cholesterol Education Program (NCEP), and the International Diabetes Federation (IDF) (5). The overall definition proposed by the Adult Treatment Panel III (ATP III) of the NCEP, which was updated on 2004, is one of the most influential and widely used in clinical practice (6). It identifies 6 pathophysiological features that characterize MS and relates it to CVD and/or diabetes: abdominal obesity, atherogenic dyslipidemia (elevated triglycerides and low HDL cholesterol), insulin resistance (with or without dysglycemia), high blood pressure, and a proinflammatory and prothrombotic state (7). The underlying mechanism of this syndrome has not been clearly elucidated, but insulin resistance and abdominal obesity are the unifying factors that most likely explain the presence of this cluster as a distinctive entity (8).
Due to multiple age-related physiologic mechanisms, the elderly are at increased risk of developing insulin resistance and MS (9). This explains the higher prevalence of this syndrome among older adults reported in the US (10) and some Latin American populations (11). Furthermore, MS in the elderly has been associated with a more pronounced cognitive decline (12), Alzheimer´s disease (13), and higher all-cause mortality rates (14). Thus, identification and treatment of the risk factors contributing to the development of this condition are crucial to reduce morbidity and death among this group.
Genetic predisposition, obesity, aging, and a sedentary lifestyle are key risk factors involved in the development of MS. Therefore, therapeutic lifestyle changes, such as increased physical activity and weight reduction, are fundamental in the prevention and treatment of this condition (6). The role of the diet as a promoter of MS has not been clearly elucidated, and there are very few reports addressing this issue in the elderly population. For instance, whole grains intake was inversely associated with MS prevalence among older adults in one prospective study (15). Furthermore, some studies suggest an association between certain foods with MS prevalence in the general population (16-21).Additionally, randomized controlled trials using the Mediterranean diet or the DASH (Dietary Approaches to Stop Hypertension) have shown improvement in several MS parameters and reduction in the prevalence of this condition with health benefits that are independent from weight reduction (21, 22).
Modern medicine has managed to successfully treat disease conditions, prolonging life, but further insights into environmental factors that contribute to the onset of chronic diseases is fundamental for the development of adequate treatments and prevention strategies that will lead to healthier aging in the population and, consequently, to a better quality of life with reduced disability among the elderly. Therefore, the aim of this study was to analyze the prevalence of MS among the Chilean elderly population (≥65 years of age) and to further analyze its association with the quality of food intake in this particular group using data from the last National Health Survey performed between 2009 and 2010.
Materials and methods
Sample population
The National Health Survey performed in Chile in 2009-2010 (ChNHS 2009-2010) was designed to assess the population burden and distribution of certain chronic diseases. Non-institutionalized individuals older than 15 years of age were selected using a stratified multistage probability sampling method. This was a cross-sectional household survey study and a detailed report is available at its website (23). Overrepresentation of some groups, including elderly subjects, within the sample was applied in order to increase efficiency and standardize precision of the estimates. Therefore, in order to correct the distortion of the unprocessed sample and to make it coincident with the projected population of the Chilean 2002 census, expansion factors were applied to each individual in the sample.
From the original 5,412 participants in the NHS 2009-2010 sample, 1,007 subjects were ≥65 years old. For MS prevalence, a subsample of 505 older adults that had fasting plasma analysis and all the information required to diagnose MS -using ATP III-NCEP criteria- was analyzed. All participants in ChNHS 2009-2010 had data regarding food intake, so information of the full 1,007 sample of older adults was considered for overall diet characterization. Regarding association analysis between diet and MS prevalence, we considered food intake and MS prevalence of the 505 older adults for whom MS was a feasible diagnosis.
The survey protocol and consent forms were approved by the ethics committees of the School of Medicine at the Pontificia Universidad Católica de Chile and the Chilean Ministry of Health.
Data collection and laboratory analysis
A team of trained nurses and interviewers performed the survey, with measurements done during two home visits. In the first one, health questionnaires comprising sociodemographic characteristics, disease awareness and self-report along with family history and treatment status were fulfilled. In the second visit, a trained nurse performed physical examination, registered drug use and obtained fasting blood samples. All biochemical assays were performed at the central laboratory of the Pontificia Universidad Católica Clinical Hospital (CDC-certified for lipid measurements).
Blood glucose, total cholesterol, HDL cholesterol, and triglycerides were enzymatically measured with an automated clinical analyzer using standard serum controls. Blood pressure was measured in three consecutive occasions after a 5-min rest. Waist circumference (WC) was measured employing the technique proposed by ATP III-NCEP (6).
For MS diagnosis, we applied the criteria proposed by the ATP III-NCEP updated guidelines but using WC cutoff points specifically defined for our Chilean population (data not published). Thus, MS was present if an individual exhibited at least 3 of the following 5 features: (1) waist circumference ≥88 cm in men or ≥83 cm in women; (2) blood pressure ≥130/85 mm Hg or use of antihypertensive medications; (3) fasting triglycerides ≥150 mg/dL or use of lipid-lowering drugs; (4) HDL cholesterol <40 mg/dL in men or <50 mg/dL in women or use of lipid-modifying drugs; and (5) fasting glucose ≥100 mg/dL or use of antidiabetic drugs (6).
Dietary assessment and Healthy Diet Score (HDS)
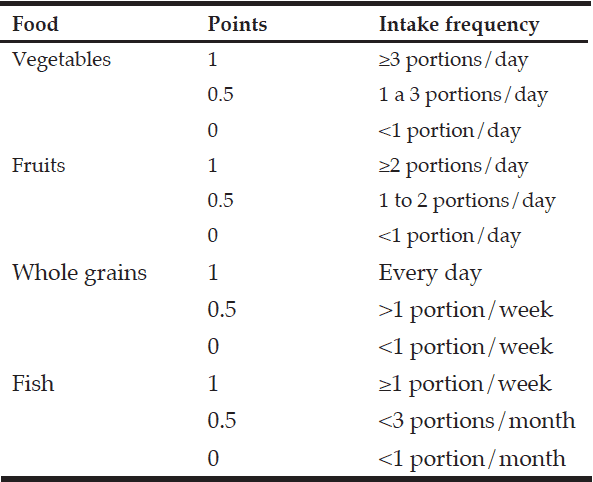
Food intake information was obtained with a 7-item food frequency questionnaire that included 4 foods comprised in a Mediterranean dietary pattern and that have been associated with benefits for human health. Therefore, data regarding fish, whole grains, fruits, vegetables and dairy intake was gathered and further classified in low, moderate or high intake categories. Additionally, we created a Healthy Diet Score (HDS), which was constructed upon the food intake information collected at ChNHS 2009-2010 with the intention of measuring diet quality by approximation as a whole to the Mediterranean diet recommendations. Therefore, low, moderate and high intake of each food translated into 0, 0.5 and 1 point, respectively. As four types of foods (i.e., fish, fruits, vegetables and whole grains) were considered for score calculation, the addition of each food points resulted in a score that could reach values between 0 (worst diet) to 4 points (best diet quality). Dairy was not considered for score calculation because the Mediterranean diet recommends intake of low fat/fat free and fermented dairy products, but ChNHS 2009-2010 made no distinction between regular versus low fat/fat free dairy consumption. Food frequency intake defining each score item and overall HDS calculation are shown in Table 1.
Statistical Analysis
Expansion factors were applied in all the statistical analysis. Continuous variables are shown as mean with 95% confidence interval and categorical variables are shown as number of cases and percentage with 95% confidence interval. Chi-square test was used to analyze differences between proportions, whereas t Student test for independent samples analysis and analysis of variance (ANOVA) were applied to test differences between means. For MS and diet association analysis, complex logistic regression was used, adjusted by age, gender and educational level. A p value <0.05 was considered statistically significant. Data processing and statistical analyses were done with the SPSS statistical software package version 17.0 (SPSS Inc., Chicago, IL, USA).
Results
Subject characteristics
The study sample consisted on 505 Chilean adults ≥ 65 years of age, with a predominance of women (58%, men 42%), and a mean age of 73 years. Most of the participants had low educational level (52%) and showed high rates of CVD (24.7%) and hypertension (75%). The overall demographic and clinical characteristics of these subjects are summarized in Table 2.
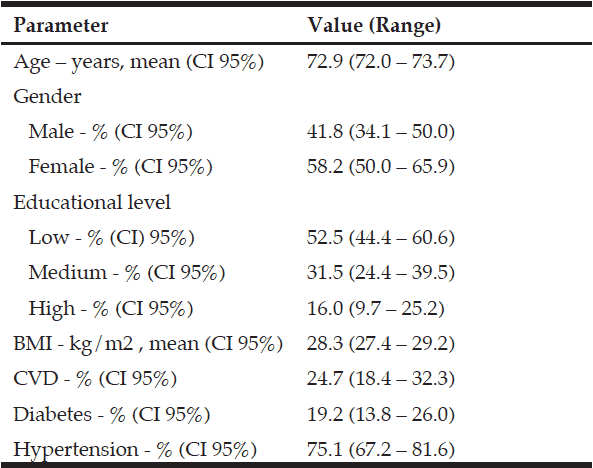
Table 2
Demographic and clinical characteristics of Chilean elderly subjects (n=505) evaluated at ChNHS 2009-2010
Metabolic syndrome prevalence
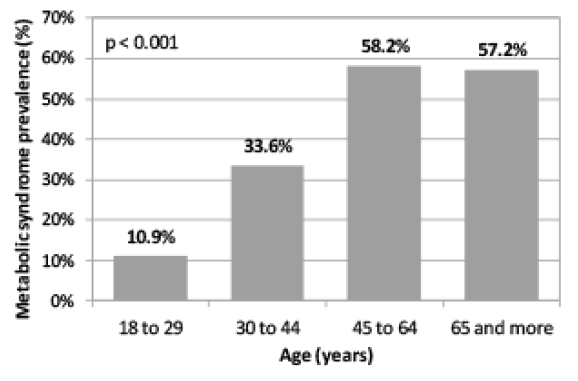
The overall prevalence of MS in the Chilean adult population (>18 years-old) was 37.7%, with no difference found between men and women, or different educational levels. The prevalence increased with advancing age, from 10.9% among subjects aged 18 through 29, to 58.2% in the group aged 45 to 65, and 57.2% among the elderly (≥ 65 years-old) (Figure 1). No differences in MS prevalence among the elderly were seen when analyses were performed by gender or educational level.
Among the elderly, elevated blood pressure and increased waist circumference were the most prevalent MS components (88% and 80% respectively) and low HDL cholesterol was the least frequent alteration (39%) (Figure 2). No difference in the MS component distributions was seen between elderly men and women.
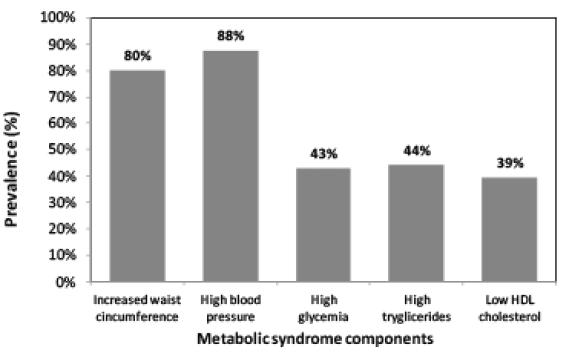
Figure 2
Prevalence of metabolic syndrome components among Chilean elderly (≥65 years-old) population
Food intake
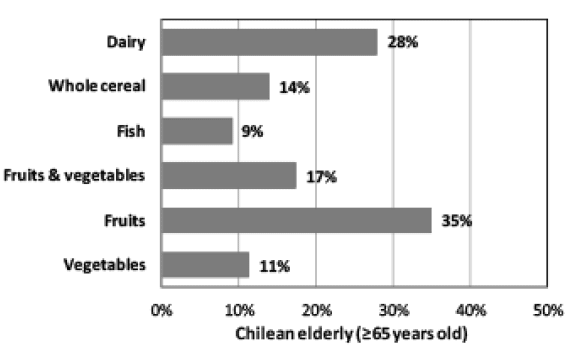
A low intake of all the foods studied was seen among the Chilean elderly adult population, with fish being the least consumed item (Figure 3). On the other hand, fruit was the most frequently consumed food, with 35% of the elderly population reaching a fruit intake of ≥2 portions/day. However, only 17% of the adults in this group age consumed the recommended 5 portions of fruits and vegetables per day.
Food intake recommendations: dairy: > 1 portion/day; whole cereal: ≥1 portion/day; fish: >1 portion/week; fruits & vegetables: ≥5 portions/day; fruits ≥2 portions/day; vegetables ≥3 portions/day
Dairy and fruit intake was significantly higher among older women compared to older men. Indeed, 34% of women consumed dairy at least once a day, in contrast to only 20% of older men (p=0.018). On the other hand, fruit was adequately consumed (at least 2 portions of fruits per day) by 39% of women in contrast with 29% of men (p=0.008) aged ≥ 65 years-old.
On the other hand, fish, whole grains and vegetables were more frequently consumed among individuals with higher educational levels, with 85% of older adults in the higher educational level group consuming at least 1 portion/day of vegetables compared to 66% and 82% of individuals in low and middle levels respectively (p=0.029). Fish was consumed at least once a week by 69% of the individuals in high education levels, compared to 30% and 35% among those in low and middle levels, respectively (p<0.001). Finally, whole grains were consumed at least once every two days in 46% of the highly educated individuals, compared with 20 and 33% in those among low and middle educational levels (p=0.006).
Healthy diet score (HDS)
Overall, the HDS was low, reaching the highest mean value of 1.4 points (with 0 representing the worst food intake and 4 points the best diet quality) among older adults aged 65 through 74. The lowest HDS (1.19), i.e., the worst diet quality, was found among adults older than 75 years and was significantly lower than the HDS of older adults between 65 and 74 years of age (p=0.024). When analyzing by gender, women ≥ 65 years showed a better mean HDS than men (1.429 vs. 1.164; p<0.001), and a better diet quality was seen among those with higher educational levels (HDS = 1.914 in high educational level vs 1.127 and 1.428 in low and middle educational levels, respectively; p<0.001)
Associations between food intake, diet quality and MS
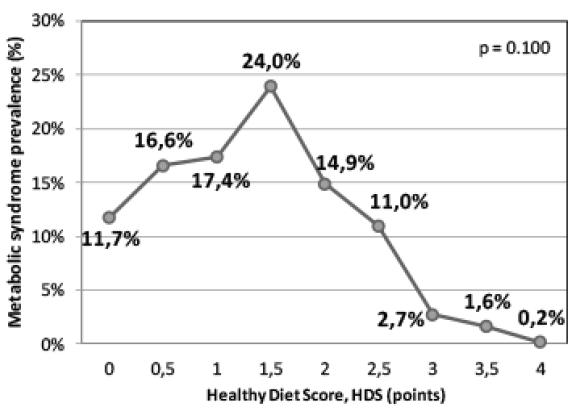
No association was found between the intake of any of the foods evaluated and MS prevalence in the elderly population. Moreover, although a tendency towards a low MS prevalence with higher HDS was observed, this association was not statistically significant (Figure 4).
Discussion
This study is, to our knowledge, the first one to report MS prevalence among a nationally representative elderly Chilean population, and to further associate it with food intake and diet quality in this particular group. Indeed, the prevalence of MS has not been adequately explored in older individuals, with very few studies reporting its prevalence in Latin American populations. In Chile, MS prevalence among this group was 57.2%, similar to that found in Brazil (24) and Venezuela (25). It is also comparable to that reported in the US population surveyed in NHANES 3 (10). Nevertheless, since methodological differences between studies (i.e., different waist circumference cut-offs) can heavily influence prevalence rates, comparisons between populations have to be made carefully.
Our study showed an increase in MS prevalence with advancing age, with significantly higher prevalence of this condition among older individuals when compared to younger groups. In fact, age is known to promote MS since several age-related physiologic changes facilitate the development of insulin resistance and other metabolic alterations related to CVD and diabetes (9, 26).
Abdominal obesity and high blood pressure were the most common MS components in the Chilean elderly population (>80% prevalence each one). Hypertension is common among the elderly, with an estimated prevalence of 30-50% worldwide (26). Aging is associated with changes in the vascular system that involve stiffening of the arteries leading to increased systolic blood pressure (9), therefore explaining the high prevalence of hypertension in this group. On the other hand, the prevalence of abdominal obesity in this population is much larger than that reported in other studies (11). This raises the question about the appropriateness of the 83/88 cm cutoff points for detecting abdominal obesity among older individuals in our country. Nevertheless, variability in the prevalence of MS and its components between populations is foreseeable and could also be explained by demographic and epidemiological factors, as well as ethnic differences and environmental influences, including nutrition.
In this report, older adults showed insufficient intake of all the foods studied. This could be explained by modernization and the ongoing nutritional transition in Latin American countries. Indeed, increased food availability, along with greater processing of food supplies, has lead to a nutritional shift in which whole cereal, fruit, vegetable and fiber intake has declined whereas processed and refined food, sugar and fat intake has increased (27). This dietary pattern facilitates the development of obesity and obesity-related conditions such as MS, diabetes, and CVD (17, 20). Hence, the development of population-level strategies and policies oriented to improve the quality of the diet in our population becomes extremely urgent.
Only 17% of older adults in Chile reached the recommended intake of 5 portions of fruits and vegetables per day. Among the elderly, fruit and vegetable consumption has been linked to a better quality of life and a protective role against cognitive decline and other chronic diseases such as hypertension, diabetes, and CVD (28). Therefore, a low intake of fruits and vegetables is a concerning signal that may be contributing to high morbidity rates in this population. On the other hand, fish was the least consumed food, probably due to its high price, which makes it unaffordable for most Chilean families. Omega-3 fatty acids obtained from fatty fish have been linked with multiple positive effects on human health, including cardiovascular benefits (29) and protection against cognitive decline among the elderly (30). Therefore, its low intake is particularly worrisome and highlights the fact that our country is not taking adequate advantage of its local and natural products, which could have large impact in the health status and quality of life not only of the elderly, but also of the whole population.
No association was found between any of the foods surveyed and MS prevalence in this particular age group. High intake of whole grains (31), dairy (32), fruits and vegetables (33) has been associated with lower MS prevalence among adult populations. Indeed, in a previous report by our group, whole grains intake was inversely associated with MS prevalence in the overall Chilean adult population (34), but this relationship was not observed in this older subsample. Nevertheless, similar to our findings, a cross sectional retrospective study did not find associations between food intake and MS prevalence among older women (35). Although their analysis considered nutrients instead of foods, these results and ours suggest that food intake, as an environmental factor influencing the development of MS, has a different and/or lower impact on preventing and treating this condition in a later stage of life. Age-related physiological mechanisms along with long-term exposition to environmental factors, rather than current dietary habits that promote these metabolic alterations, may be much more significant among older individuals. At this stage of the vital cycle, progression of hyperinsulinemia, inflammation, atherosclerosis and other metabolic alterations may be too advanced and difficult to modify by lifestyle changes. Nevertheless, it is important to consider that following a healthy dietary pattern from younger ages brings health benefits that would manifest later in life. Indeed, Barker’s theory of the developmental origins of adult chronic disease emphasizes the large impact that environmental factors during fetal development have on disease incidence in adulthood (36). Additional plausible explanations for the lack of association between food intake and MS prevalence in this study was a low statistical power due to sample size and/or low intake of foods not reaching levels at which their benefits in health would be clinically observable.
On the other hand, overall dietary patterns embrace a useful approach to study the effects of the diet as a whole in human health, providing more information than that attainable with the analysis of single nutrients or foods. In our study, the quality of the diet was established using a HDS, which evaluated intake of four foods that are routinely included in a variety of healthy eating indexes (37). Applying this score, we observed a better diet quality among women and with higher educational levels, which is consistent with findings reported in the US population using the Healthy Eating Index (HEI) (38, 39). The lowest HDS, hence the worse diet, was found among older adults aged 75 or more. At this stage in life, several health related problems, physical impairment, social isolation, as well as physiologic changes that lead to anorexia may be responsible of this poorer diet quality (40).
Even though we expected that MS prevalence would be higher with a worse diet (i.e., lower HDS), as previously found in the overall Chilean adult population (34), this association was not significant among this subsample of older subjects. As mentioned above, different explanations (e.g., low statistical power due to sample size and low intake of foods as well as limited number of food items used in HDS) may explain our finding. Some dietary patterns, such as the Mediterranean diet, have been previously associated with a lower MS prevalence, along with lower rates of atherogenic dyslipidemia (21). Nevertheless, the role of the Mediterranean diet on MS status does not lack of some controversy because some observational studies have not found any association (41). More recently, the PREDIMED randomized clinical trial however showed that adherence to this dietary pattern reversed metabolic syndrome (42).
It is important to consider some limitations of our HDS. First, it includes only four potentially healthy foods and does not consider unhealthy eating habits. Moreover, the intake categories defined in ChNHS 2009-2010 were in some items, such as fish, different from those recommended by other healthy eating indexes (e.g., high consumption of fish meant ≥1 portion/week in our score, whereas the Mediterranean diet recommends ≥ 3 portions/week). Another limitation of our study is that all the eating habits information of the ChNHS 2009-2010 was exclusively based on a brief questionnaire applied to participants. As memory problems and cognitive decline are common features among older adults, information gathered may not be entirely precise and reliable.
In conclusion, MS is very prevalent among the Chilean elderly population, with abdominal obesity and hypertension being the most frequent MS components. Overall, older adults in our country had a deficient diet, with the poorest diet quality found among adults aged 75 years-old or more. Neither intake of some specific food items nor a healthy diet score were associated with MS prevalence in this group. Despite of this lack of association, we still consider that the recommendations for a healthy diet pattern, such as the Mediterranean diet, are suitable for the elderly. Indeed, increasing evidence suggests an important role of a Mediterranean-like dietary pattern in delaying the onset of multiple chronic diseases and health decline with age, as well as prolonging life expectancy not only in Mediterranean countries, but also outside the Mediterranean basin as well (43). Therefore, the development of population-based strategies that would promote this dietary pattern among the elderly is, in our opinion, fundamental for reducing morbidity and disabilities among this group.
Acknowledgments: This work was partially funded by the 2014 Research Program on Elderly and Aging, Office of Research Affairs, Pontificia Universidad Católica de Chile, and Fundación Alimenta. We also acknowledge the Ministry of Health, Government of Chile for sharing the 2009-2010 National Health Survey database.
Conflict of interest: None
Ethics Standard: ChNHS 2009-2010 protocol was reviewed and approved by ethics committees of the School of Medicine at the Pontificia Universidad Católica de Chile and the Chilean Ministry of Health.
References
1. WHO. Nutrition for older persons. Ageing and nutrition: a growing global challenge [cited 2015 May]. Available from: http://www.who.int/nutrition/topics/ageing/en/index2.html.
2. Medina-Lezama J, Chirinos-Pacheco J, Chirinos JA. Cardiovascular disease in Latin America. Am Heart J 2005;149(2):E13. doi: 10.1016/j.ahj.2004.09.002
3. Alberti KG, Eckel RH, Grundy SM, Zimmet PZ, Cleeman JI, Donato KA, et al. Harmonizing the metabolic syndrome: a joint interim statement of the International Diabetes Federation Task Force on Epidemiology and Prevention; National Heart, Lung, and Blood Institute; American Heart Association; World Heart Federation; International Atherosclerosis Society; and International Association for the Study of Obesity. Circulation 2009;120(16):1640-5. doi: 10.1161/CIRCULATIONAHA.109.192644
4. Alberti KG, Zimmet PZ. Definition, diagnosis and classification of diabetes mellitus and its complications. Part 1: diagnosis and classification of diabetes mellitus provisional report of a WHO consultation. Diabet Med 1998;15(7):539-53. doi: 10.1002/(SICI)1096-9136(199807)15:7<539::AID-DIA668>3.0.CO;2-S
5. International Diabetes Federation. The IDF consensus worldwide definition of the metabolic syndrome 2006 [cited 2015 May]. Available from: http://www.idf.org/webdata/docs/MetS_def_update2006.pdf.
6. Grundy SM, Cleeman JI, Daniels SR, Donato KA, Eckel RH, Franklin BA, et al. Diagnosis and management of the metabolic syndrome: an American Heart Association/National Heart, Lung, and Blood Institute Scientific Statement. Circulation 2005;112(17):2735-52. doi: 10.1161/CIRCULATIONAHA.105.169404
7. Grundy SM, Brewer HB, Jr., Cleeman JI, Smith SC, Jr., Lenfant C, American Heart A, et al. Definition of metabolic syndrome: Report of the National Heart, Lung, and Blood Institute/American Heart Association conference on scientific issues related to definition. Circulation 2004;109(3):433-8. doi: 10.1161/01.CIR.0000111245.75752.C6
8. Eckel RH, Grundy SM, Zimmet PZ. The metabolic syndrome. Lancet 2005;365(9468):1415-28. doi: 10.1016/S0140-6736(05)66378-7
9. Kovacic JC, Moreno P, Nabel EG, Hachinski V, Fuster V. Cellular senescence, vascular disease, and aging: part 2 of a 2-part review: clinical vascular disease in the elderly. Circulation 2011;123(17):1900-10. doi: 10.1161/CIRCULATIONAHA.110.009118
10. Ervin RB. Prevalence of metabolic syndrome among adults 20 years of age and over, by sex, age, race and ethnicity, and body mass index: United States, 2003-2006. Natl Health Stat Report 2009;(13):1-7.
11. Medina-Lezama J, Zea-Diaz H, Morey-Vargas OL, Bolanos-Salazar JF, Munoz-Atahualpa E, Postigo-MacDowall M, et al. Prevalence of the metabolic syndrome in Peruvian Andean hispanics: the PREVENCION study. Diabetes Res Clin Pract 2007;78(2):270-81. doi: 10.1016/j.diabres.2007.04.004
12. Yaffe K, Weston AL, Blackwell T, Krueger KA. The metabolic syndrome and development of cognitive impairment among older women. Arch Neurol 2009;66(3):324-8. doi: 10.1001/archneurol.2008.566
13. Razay G, Vreugdenhil A, Wilcock G. The metabolic syndrome and Alzheimer disease. Arch Neurol 2007;64(1):93-6. doi: 10.1001/archneur.64.1.93
14. Forti P, Pirazzoli GL, Maltoni B, Bianchi G, Magalotti D, Muscari A, et al. Metabolic syndrome and all-cause mortality in older men and women. Eur J Clin Invest 2012;42(9):1000-9. doi: 10.1111/j.1365-2362.2012.02688.x
15. Sahyoun NR, Jacques PF, Zhang XL, Juan W, McKeown NM. Whole-grain intake is inversely associated with the metabolic syndrome and mortality in older adults. Am J Clin Nutr 2006;83(1):124-31.
16. Babio N, Sorli M, Bullo M, Basora J, Ibarrola-Jurado N, Fernandez-Ballart J, et al. Association between red meat consumption and metabolic syndrome in a Mediterranean population at high cardiovascular risk: cross-sectional and 1-year follow-up assessment. Nutr Metab Cardiovasc Dis 2012;22(3):200-7. doi: 10.1016/j.numecd.2010.06.011
17. Lutsey PL, Steffen LM, Stevens J. Dietary intake and the development of the metabolic syndrome: the Atherosclerosis Risk in Communities study. Circulation 2008;117(6):754-61. doi: 10.1161/CIRCULATIONAHA.107.716159
18. Dhingra R, Sullivan L, Jacques PF, Wang TJ, Fox CS, Meigs JB, et al. Soft drink consumption and risk of developing cardiometabolic risk factors and the metabolic syndrome in middle-aged adults in the community. Circulation 2007;116(5):480-8. doi: 10.1161/CIRCULATIONAHA.107.689935
19. Malik VS, Popkin BM, Bray GA, Despres JP, Willett WC, Hu FB. Sugar-sweetened beverages and risk of metabolic syndrome and type 2 diabetes: a meta-analysis. Diabetes Care 2010;33(11):2477-83. doi: 10.2337/dc10-1079
20. Esmaillzadeh A, Kimiagar M, Mehrabi Y, Azadbakht L, Hu FB, Willett WC. Dietary patterns, insulin resistance, and prevalence of the metabolic syndrome in women. Am J Clin Nutr 2007;85(3):910-8.
21. Babio N, Bullo M, Basora J, Martinez-Gonzalez MA, Fernandez-Ballart J, Marquez-Sandoval F, et al. Adherence to the Mediterranean diet and risk of metabolic syndrome and its components. Nutr Metab Cardiovasc Dis 2009;19(8):563-70. doi: 10.1016/j.numecd.2008.10.007
22. Azadbakht L, Mirmiran P, Esmaillzadeh A, Azizi T, Azizi F. Beneficial effects of a Dietary Approaches to Stop Hypertension eating plan on features of the metabolic syndrome. Diabetes Care 2005;28(12):2823-31.
23. Ministry of Health, Chile [cited 2015]. Available from: http://epi.minsal.cl/estudios-y-encuestas-poblacionales/encuestas-poblacionales/descarga-ens/.
24. Dutra ES, de Carvalho KM, Miyazaki E, Hamann EM, Ito MK. Metabolic syndrome in central Brazil: prevalence and correlates in the adult population. Diabetol Metab Syndr 2012;4(1):20. doi: 10.1186/1758-5996-4-20
25. Florez H, Silva E, Fernandez V, Ryder E, Sulbaran T, Campos G, et al. Prevalence and risk factors associated with the metabolic syndrome and dyslipidemia in White, Black, Amerindian and Mixed Hispanics in Zulia State, Venezuela. Diabetes Res Clin Pract 2005;69(1):63-77. doi: 10.1016/j.diabres.2004.11.018
26. Villareal DT, Apovian CM, Kushner RF, Klein S, American Society for N, Naaso TOS. Obesity in older adults: technical review and position statement of the American Society for Nutrition and NAASO, The Obesity Society. Am J Clin Nutr 2005;82(5):923-34.
27. Bermudez OI, Tucker KL. Trends in dietary patterns of Latin American populations. Cad Saude Publica 2003;19 Suppl 1:S87-99.
28. Nicklett EJ, Kadell AR. Fruit and vegetable intake among older adults: a scoping review. Maturitas 2013;75(4):305-12. doi: 10.1016/j.maturitas.2013.05.005
29. Deckelbaum RJ, Torrejon C. The omega-3 fatty acid nutritional landscape: health benefits and sources. J Nutr 2013;142(3):587S-91S. doi: 10.3945/jn.111.148080
30. van Gelder BM, Tijhuis M, Kalmijn S, Kromhout D. Fish consumption, n-3 fatty acids, and subsequent 5-y cognitive decline in elderly men: the Zutphen Elderly Study. Am J Clin Nutr 2007;85(4):1142-7.
31. Mozaffarian D, Kumanyika SK, Lemaitre RN, Olson JL, Burke GL, Siscovick DS. Cereal, fruit, and vegetable fiber intake and the risk of cardiovascular disease in elderly individuals. JAMA 2003;289(13):1659-66. doi: 10.1001/jama.289.13.1659
32. Astrup A. Yogurt and dairy product consumption to prevent cardiometabolic diseases: epidemiologic and experimental studies. Am J Clin Nutr 2014;99(5 Suppl):1235S-42S. doi: 10.3945/ajcn.113.073015
33. Esmaillzadeh A, Kimiagar M, Mehrabi Y, Azadbakht L, Hu FB, Willett WC. Fruit and vegetable intakes, C-reactive protein, and the metabolic syndrome. Am J Clin Nutr 2006;84(6):1489-97.
34. Dussaillant C, Echeverría G, Villarroel L, Marín PP, Rigotti A. Unhealthy food intake is linked to higher prevalence of metabolic syndro,me in Chilean adult population. Nutr Hosp 2015;32(5):2098-104
35. Bruscato NM, Vieira JL, do Nascimento NM, Canto ME, Stobbe JC, Gottlieb MG, et al. Dietary intake is not associated to the metabolic syndrome in elderly women. N Am J Med Sci 2010;2(4):182-8. doi: 10.4297/najms.2010.2182
36. Barker DJP. The developmental origins of chronic adult disease. Acta Paediatrica 2004;93(s446):26-33.
37. Martínez-González MA, Fernández-Jarne E, Serrano-Martínez M, Wright M, Gomez-Gracia E. Development of a short dietary intake questionnaire for the quantitative estimation of adherence to a cardioprotective Mediterranean diet. Eur J Clin Nutr 2004;58:1550-2. doi: 10.1038/sj.ejcn.1602004
38. Ervin RB. Healthy Eating Index scores among adults, 60 years of age and over, by sociodemographic and health characteristics: United States, 1999-2002. Advance Data 2008;20(395):1-16.
39. Ervin RB. Healthy Eating Index–2005 total and component scores for adults aged 20 and over: National Health and Nutrition Examination Survey, 2003-2004. Natl Health Stat Report 2011;13(44):1-9.
40. Ahmed T, Haboubi D. Assessment and management of nutrition in older people and its importance to health. Clin Interv Aging 2010;5:207-16.
41. Alvarez Leon E, Henriquez P, Serra-Majem L. Mediterranean diet and metabolic syndrome: a cross-sectional study in the Canary Islands. Public Health Nutr 2006;9(8A):1089-98. doi: 10.1017/S1368980007668487
42. Babio N, Toledo E, Estruch R, Ros E, Martinez-Gonzalez MA, Castaner O, et al. Mediterranean diets and metabolic syndrome status in the PREDIMED randomized trial. CMAJ 2014;186(17):E649-57. doi: 10.1503/cmaj.140764
43. Roman B, Carta L, Martinez-Gonzalez MA, Serra-Majem L. Effectiveness of the Mediterranean diet in the elderly. Clin Interv Aging 2008;3(1):97-109.

