jarlife journal
Sample text

AND option

OR option

COMPARISON OF DIETARY INTAKE IN UK ADULTS AGED 50 TO 75 YEARS DURING THE 2020 UK COVID-19 LOCKDOWN COMPARED TO THEIR 2019 INTAKES


E.R. Tuttiett1, B.M. Corfe2, E.A. Williams1


1. Department of Oncology and Metabolism, The Medical School, The University of Sheffield, Sheffield, S10 2RX, England; 2. Human Nutrition Research Centre, Faculty of Medical Sciences, Population Health Sciences Institute, Newcastle University, Newcastle NE2 4HH, UK

Corresponding Author: Esme Tuttiett, University of Sheffield Medical School, Beech Hill Road, S10 2RX, email: ertuttiett1@sheffield.ac.uk, ORCID ID: https://orcid.org/0000-0002-7591-4099, phone: 0114 222 5522

J Aging Res & Lifestyle 2021;10:50-53
Published online September 23, 2021, http://dx.doi.org/10.14283/jarlife.2021.9


Abstract

The lockdown restrictions imposed as a result of COVID-19 impacted on many areas of daily life including dietary behaviours. A cohort of middle-older age adults (n=17), who had previously provided 3-day food diaries in May 2019 were asked to record their 3 day dietary intake in May 2020 when the UK was under lockdown restrictions. Mean (SD) energy intakes were significantly higher by ~750kilojoules in 2020 (8587kJ (1466.9)) compared to 2019 (7837 kJ (1388.9)). This energy increase is equivalent to ~170kcal; approximately 2 slices of bread. Furthermore, recorded meat/meat products, riboflavin, vitamin B6/B12 and iron intakes were all greater in 2020. No other dietary differences were observed between the two timepoints. This was a small, homogenous but well controlled sample, who exhibited a relatively stable diet during lockdown compared with pre-pandemic intakes 12 months earlier. It can be concluded that there was little evidence of food insecurity in this cohort.

Key words: COVID-19, lockdown, diet, food groups.


Introduction

In December 2019, a novel coronavirus (COVID-19), induced by the SARS-CoV-2, emerged. Following its rapid spread, a global pandemic was announced by the World Health Organisation on 11th March 2020 (1) and resulted in a UK national lockdown on 23rd March 2020 (2). Lockdown restrictions consequentially led to lifestyle modifications, including disrupting eating habits, leading to research being undertaken to investigate such changes (3–8).
A cross-national survey was used to compare food dynamics in 1,732 Chinese and 1,547 U.S. households (4). Similar behaviours were recorded by both nationalities and included favouring online shopping and purchasing extra amounts of food when shopping, so fewer trips to buy groceries needed to be made. On the contrary, responses to web-based surveys revealed differing eating behaviours between Spanish and Greek residents (8). Lower restraint eating was reported in Spain, where lockdown regulations were more stringent.
Themes that have emerged globally in the literature regarding changes in diet include the increase in purchasing of: tinned goods, “comfort” foods/confectionary, and baking ingredients (4, 9, 10). More home cooking, including homemade desserts, has been reported during lockdown, mirrored by a decrease in takeaway and ready meal consumption (4, 9, 10). The impact of pre-pandemic health status (11) and socioeconomic status (4) have been implicated as factors that influence dietary behaviours observed during lockdown periods. It is difficult to decipher a common pattern of dietary habits in relation to health emerging as respondents to surveys have often reported a split array of lifestyle behaviours (12).
The majority of the evidence has used web based food frequency questionnaires or surveys that do not always capture accurate dietary intake due to recall bias and missing food items. Furthermore, pre-pandemic dietary intakes in the same population are lacking. In light of this, it was the aim of this research to re-sample a small group of middle-older aged adults who had reported dietary intake using estimated food diaries exactly 12 months before the 1st UK lockdown (13). This demographic is often understudied and there are growing obesity rates in the middle-older adult age group so assessing dietary habits during the lockdown period is of interest. It was hypothesised that lockdown restrictions would have led to changes in dietary behaviours observed in this cohort.


Materials and Methods

Study population and ethics

Twenty-four healthy participants, aged 50-75, who had provided detailed 3-day food diaries in May–July 2019 as part of an unrelated study (13) were re-contacted in May 2020, during UK-wide COVID-19-lockdown restrictions and invited to provide a further 3-day food diary. Prior permission was obtained from all participants in 2019 to be recontacted. Participants were sent a study information sheet, alongside study documents, and implied consent was assumed if documents were returned.
Ethical approval for this study was granted by the University of Sheffield’s ethics committee (ethical approval number: 034260)

Design

This study was a repeated dietary analysis of a convenience sample. The eligibility criteria utilised in the 2019 study (13) dictated participant characteristics. In 2020, participants could either complete the study documentation electronically, and receive it via email, or in paper-version, and receive the documentation in the post. The protocol for completing the 3-day food diary collection (as described elsewhere, (13)) was replicated from the 2019 sampling. In short, participants were asked to record everything they ate and drank during a 24-hour period on 3 occasions during the same week (Monday, Wednesday and Friday). Participants had received previous training for this methodology and utilised a food portion booklet, containing photographs from the Ministry of Agriculture, Food and Fisheries (MAFF) food atlas (Nelson, 1997) to aid with completing this.
Guidance to aid with the return of study documentation was provided and a follow-up discussion between the researcher and the participants was arranged, via a video/telephone call, to check the data for clarity and to obtain further qualitative information about dietary behaviour habits during lockdown. Following completion of all tasks, participants received a £20 voucher to thank them for their participation.

Data analysis

Food diary data was inputted into Dietplan7 nutritional analysis software (Forestfield Software Ltd). This software was used to generate a full report for each participant, containing averages across the three days for energy, macronutrient and micronutrient data, based on UK Composition of Foods tables (14). The report also classified the data into food groups. All statistical analyses were undertaken using SPSS software (version 26.) Data was checked for normality using the Shapiro-Wilk test. Related-Samples Wilcoxon Signed Rank Test analysis was used to assess differences between 2019 (pre-pandemic) and 2020 (lockdown) dietary intakes. A p-value of <0.05 was used to indicate significance.

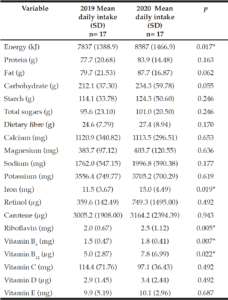
Table 1
Comparison of energy, macro- and micro-nutrient intakes in the study sample (n=17) on two consecutive years; 2019 vs 2020

Data is presented as average mean (SD) values for all participants (n=17.); p-values denoted Wilcoxon analysis using data collected in 2019 compared to data collected in 2020. Significance was set at p=0.05; kJ= kilojoules; g=grams; mg=milligrams, µg=micrograms


Results

Participant Characteristics

All twenty-four original participants were contacted; twenty agreed to provide a further food diary and four did not respond to the follow up email. One participant dropped out of the research due to time limitations. Two participants (both male) were also removed from the analysis, one who displayed irregular eating behaviour, due to shift working, and one for an incomplete food diary, leaving only female participants remaining (n=17). The mean (SD) age and BMI of the included participants was 61.5 (7.4) years and 23.8 (3.8) kg/m2 respectively.

Energy, Macronutrient and Micronutrient Intakes (table 2)

Mean (SD) energy intakes were 9.6% higher in 2020, compared to 2019; 8587kJ (1466.9) vs 7837 kJ (1388.9). No difference was observed in the dietary intakes of protein, carbohydrate and fat at the two timepoints. In 2020, riboflavin, vitamin B6, Vitamin B12 and iron intakes were significantly higher by an average of 0.5mg, 0.3mg, 3.8µg and 3.5mg respectively. No differences were observed in any other micronutrient.

Table 2
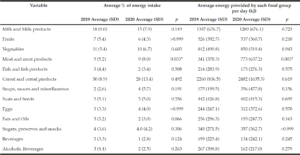
Percentage energy provided by food groups, for all participants (n=17), on two consecutive years; 2019 vs 2020

In this table all participant data has been collated together and averages are presented for all 17 participants, based on their food diary recordings. The information demonstrates the average total amount of energy (kJ) consumed by participants in each food group, per day. Further analysis also demonstrates the percentage of energy each food group contributes to overall energy intakes. p-values are Wilcoxon analysis comparing data collected in 2019 to data collected in 2020. Significance was set at p=0.05. kJ= kilojoules.


Food group analysis (table 2)

No differences were observed at a food group level other than for meat and meat products, which significantly contributed more to the average energy provided as a food group in 2020, compared to 2019 (p=0.003).


Discussion

This research investigated dietary intakes both prior to and during lockdown restrictions in a healthy cohort aged 50-71 years. This study revealed, on average, more kilojoules of energy were consumed by participants in May 2020, compared to the previous year. Intakes of riboflavin, vitamins B6 common B12 and iron were greater in 2020 than 2019. These micronutrients are particularly abundant in meat and exploration of the data at a food group level revealed that meat intakes were significantly greater in 2020.
Overall, the dietary data remained fairly stable across 2019 and 2020, in this population. This would suggest that food security was not an issue for the participants, but caution should be paid to the demographic sampled. Survey analysis revealed that the greatest food insecurity were amongst households in the lowest income categories or had family members who had lost income during the pandemic (4). Overall, from the literature, a split picture has emerged in relation to dietary behaviours as a result of lockdown measures (6, 12), and personal circumstances are likely to be an explanation for these disparities (4).
Analysis of food basket data in Spain suggested that energy intakes rose by an average of 6% (15), a similar finding also observed in this sample. Possible explanations for increased energy consumption could be related to greater intakes of nutritionally sparse but energy-dense foods being consumed, often associated with snacking behaviours. Trends of increased consumption of snacks during lockdown, have also been reported by those responding to surveys (11).
Anecdotally, participants in this research reported more home-cooking in 2020. The evening mealtime was described as an event/social occasion, during lockdown, and even referred to as the “highlight of the day” (data not presented). Similarly, it was reported by individuals in Poland that their consumption of homemade meals increased (3), as did U.S. and Chinese citizens (4). Following further investigation of the food diaries to observe the type of food being documented, it was noted that home-cooked meals were often meat-dominated including casseroles and mince-based dishes, such as bolognaise.
The limitations of this study include the small, homogenous sample. This was a convenience based sample, meaning power calculations were not possible. Collection of further demographic and lifestyle information, including physical activity levels, would have made adjustments for confounding variables possible. A critical strength of this research is that the assessments were undertaken on the same individuals at exactly the same time of year. Furthermore, estimated food diaries were obtained, which provide good estimates of energy, nutrient and food intakes. In contrast, a large proportion of research investigating dietary habits during lockdown have relied upon questionnaires and surveys. These are highly subject to recall bias, consequentially deeming them an inadequate method of dietary assessment. This research should be replicated with larger samples who have provided reliable dietary intake information prior to and during lockdown.


Conclusions

• Diet remained generally stable prior to and during lockdown at nutrient and food group level for this small but well controlled population.
• Capturing information from a variety of backgrounds/SES is an important consideration for future work in order to ascertain the overall implications of lockdown on dietary habits.


Disclosure/conflict of interest: No conflicts of interest.

Ethical standards: Ethical approval for this study was granted by the University of Sheffield’s ethics committee (ethical approval number: 034260).

Acknowledgments: The authors would like to thank the Medical Research Council (MRC) and Versus Arthritis for funding this work. Thanks also go to the participants who engaged with this research.

Funding sources: This work was supported by the Medical Research Council (MRC) and Versus Arthritis as part of the Medical Research Council Versus Arthritis Centre for Integrated Research into Musculoskeletal Ageing (CIMA) [MR/R502182/1]. The sponsors had no role in the design and conduct of the study; in the collection, analysis, and interpretation of data; in the preparation of the manuscript; or in the review or approval of the manuscript.


References

1. WHO Director-General’s opening remarks at the media briefing on COVID-19 – 11 March 2020 https://www.who.int/director-general/speeches/detail/who-director-general-s-opening-remarks-at-the-media-briefing-on-covid-19—11-march-2020 Accessed 14 Decemeber 2020
2. Prime Minister’s statement on coronavirus (COVID-19): 23 March 2020 – GOV.UK https://www.gov.uk/government/speeches/pm-address-to-the-nation-on-coronavirus-23-march-2020 Accessed 14 Decemeber 2020
3. Górnicka M, Drywień ME, Zielinska MA, Hamułka J Dietary and Lifestyle Changes During COVID-19 and the Subsequent Lockdowns among Polish Adults: A Cross-Sectional Online Survey PLifeCOVID-19 Study. Nutrients 2020; 12(8):2324.
4. Dou Z, Stefanovski D, Galligan D, Lindem M, Rozin P, Chen T, et al The COVID-19 Pandemic Impacting Household Food Dynamics: A Cross-National Comparison of China and the U.S. SocArXiv (2020) https://osf.io/preprints/socarxiv/64jwy/
5. Di Renzo L, Gualtieri P, Pivari F, Soldati L, Attinà A, Cinelli G, et al Eating habits and lifestyle changes during COVID-19 lockdown: An Italian survey. J Transl Med 2020; 18(1):229.
6. Deschasaux-Tanguy M, Druesne-Pecollo N, Esseddik Y, Szabo de Edelenyi F, Alles B, Andreeva V, et al Diet and physical activity during the COVID-19 lockdown period (March-May 2020): results from the French NutriNet-Sante cohort study. medRxiv. (2020) https://doi.org/10.1101/2020.06.04.20121855
7. Rodríguez-Pérez C, Molina-Montes E, Verardo V, Artacho R, García-Villanova B, Guerra-Hernández EJ, et al Changes in dietary behaviours during the COVID-19 outbreak confinement in the Spanish COVIDiet study. Nutrients 2020; 12(6):1–19.
8. Papandreou C, Arija V, Aretouli E, Tsilidis KK, Bulló M. Comparing eating behaviours, and symptoms of depression and anxiety between Spain and Greece during the COVID-19 outbreak: Cross-sectional analysis of two different confinement strategies. Eur Eat Disord Rev. 2020; 28(6):836–46.
9. Bracale R, Vaccaro CM. Changes in food choice following restrictive measures due to Covid-19. Nutr Metab Cardiovasc Dis. 2020; 30(9):1423–6.
10. McKevitt F. Grocery growth slows and habits change as UK adapts (2020) English – Kantar Worldpanel https://www.kantarworldpanel.com/en/PR/Grocery-growth-slows-and-habits-change-as-nation-adapts. Accessed 14 December 2020.
11. Robinson E, Boyland E, Chisholm A, Harrold J, Maloney NG, Marty L, et al Obesity, eating behavior and physical activity during COVID-19 lockdown: A study of UK adults. Appetite 2021; 10.1016/j.appet.2020.104853
12. British Nutrition Foundation. BNF survey reveals stress, anxiety, tiredness and boredom are the main causes of unhealthy eating habits in lockdown (2020) https://www.nutrition.org.uk/healthyliving/hewathome/lockdownsurvey.html Accessed 14 December 2020
13. Tuttiett ER, Green DJ, Stevenson EJ, Hill TR, Corfe BM, Williams EA. Short-Term Protein Supplementation Does Not Alter Energy Intake, Macronutrient Intake and Appetite in 50–75 Year Old Adults. Nutrients. 2021; 13(5):1711
14. McCance, R. A., Widdowson, E. M., Institute of Food Research (Great Britain), Public Health England,, & Royal Society of Chemistry (Great Britain). (2015). McCance and Widdowson’s the composition of foods.
15. Batlle-Bayer L, Aldaco R, Bala A, Puig R, Laso J, Margallo M, et al Environmental and nutritional impacts of dietary changes in Spain during the COVID-19 lockdown. Sci Total Environ 2020; 748:141410.

THE POTENTIAL ROLE OF DIETARY FACTORS ON URINARY INCONTINENCE IN THE ELDERLY


E.P. Cherniack, H.F. Lee


Division of Geriatrics and Palliative Medicine, University of Miami Miller School of Medicine and the Bruce W. Carter Miami VA Medical Center

Corresponding Author: E. Paul Cherniack, Room CLC 445, Miami VA Medical Center, 1201 NW 16 St., Miami, FL 33125, evan.cherniack@va.gov, 3055757000 ext. 2273

J Aging Res Clin Practice 2017;6:139-142
Published online June 29, 2017, http://dx.doi.org/10.14283/jarcp.2017.16


Abstract

Maintenance of urinary continence is a complex physiological process.  Multiple morbidities can alter this process including polypharmacy, and age-related loss of physiological function. An increasing body of evidence suggests the importance of dietary factors and ingested substances. Modification of nutrients and ingested substances might prove beneficial adjunctive therapies in the treatment of incontinence, but remain unproven. Extrapolation of the results of epidemiologic studies of the relationship of excess caloric intake to continence, from the general adult population, suggests trials of weight loss might help.  Population studies of vitamin D supplementation and continence also suggest an association, but prospective experimental trials involving vitamin D supplementation have yet to be done. A potential but far more equivocally documented relationship exists for vitamin B12 and continence. Surprisingly little evidence exists for other potential risk factors for incontinence such alcohol and sweeteners, natural or artificial. Future research should involve prospective trials of weight loss and vitamin D, and exploration of the relationship between other dietary factors and continence.

Key words: Urinary incontinence, diet.


Introduction

Urinary incontinence is a prevalent, persistent health and quality of life problem in the elderly, occurring in 20-40 percent of older adults (1, 2). Incontinence has major societal implications, ranking as the second most common medical condition leading to institutionalization. The causes of incontinence are multifactorial, and successful treatment can be challenging. Treatments can include devices (such as those to absorb and retain urine), medications, pelvic floor muscle exercises, surgery, and dietary modification.
Maintenance of urinary continence requires complex neuromuscular coordination, and substances ingested as part of the diet may play an important role. In addition to the role of water, an increasing body of evidence delineates the role of other dietary factors. High caloric intake, fat, acidic foods, vitamin D, vitamin B12, and other nutrients such as calcium, alcohol, zinc, and vitamin C may also influence urinary continence. The purpose of this manuscript is to describe what is known from published evidence about the relationship of dietary factors and the pathogenesis of urinary incontinence in the elderly.


Methods

A literature search was conducted through the PubMed database using such search terms as “urinary incontinence”, “nutrients”, and “diet”, and secondary sources were obtained from the primary sources. Unfortunately, due to the paucity of studies, a systematic review could not be performed.

Excess energy intake (calories, fat)

A number of studies delineate an association between higher energy intake and greater likelihood of urinary incontinence, including in elderly individuals. Spanish investigators measured anthropomorphic parameters in 471 community-dwelling women who were at least 65 years old (3). Subjects with poorer fitness as manifested by increased body fat percentage, waist circumference, and body mass index, had a higher incidence of urinary incontinence. (p<0.05) Obese subjects (Body Mass Index [BMI>30]) were more likely to suffer from stress incontinence than other types. Unfortunately, this is the only study that attempted to define this association specifically in elderly individuals.
Other studies including, but not limited to older persons, suggested a relationship between excess body weight, an indirect manifestation of higher caloric intake, and incontinence. In one group of 200 postmenopausal Turkish women, age ranges 47-73, an association existed between the presence of metabolic syndrome and stress incontinence (p<0.001) (4). That group was part of larger investigation in which two hundred other premenopausal women also participated. In the population overall, larger waist circumference also correlated with a greater incidence of stress incontinence (p<0.05). In a mail survey of 6424 participants from the UK, investigators observed that women at least age 40 with a BMI of over 30 suffered from  stress (OR=1.74; 95% CI 1.22-2.48) or urge (OR 1.46; 95% CI 1.02-2.09) incontinence more often than normal weight individuals (5). In a second mail survey from the same population, 5816 women, all aged 40 or older, responded to a survey about urinary symptoms and diet (6).  The survey ranked amounts of ingested foodstuffs by quintile of intake. Higher quintiles of fat and sugar intake correlated with increased incidence of stress incontinence.

Vitamin D

While excess macronutrient intake impairs urinary continence, lack of micronutrients may impede continence. Several epidemiologic investigations have outlined a relationship between insufficient vitamin D and incontinence.   In one survey, University of Alabama researchers measured 25-hydroxyvitamin D baseline concentrations in 350 community-living adults, half male, mean age of 74 (7). Forty-two months after baseline assessment, investigators observed an association in the cumulative incidence of urge incontinence over the course of the study with vitamin D insufficiency, (defined as 20-30ng/ml) (p=0.03). However, statistical analysis revealed no significant association between vitamin D levels and time to incident urinary incontinence, assessed every six months during the course of the study.
A second epidemiologic study confirmed the relationship between vitamin D and continence. Turkish investigators at an outpatient geriatrics clinic assessed serum vitamin D levels in 705 patients, 68.2% female, mean age 72.3 years old (8).  An analysis of Vitamin D concentrations noted an inverse relationship between vitamin D sufficiency and incidence of urge incontinence (p=0.013). The researchers suggested these relationships might be the result of vitamin D action on both smooth and skeletal muscle function.
Other studies that included, but did not focus specifically on an elderly population, also found a relationship between vitamin D levels and UI.  In a retrospective cohort study, Parker-Autry et al measured 25-OH-vitamin D concentrations in 394 women, average age 62, from a urogynecology clinic population (9).  More symptoms of incontinence, as measured by the Incontinence Impact Questionnaire (a seven question quality of life questionnaire), correlated with vitamin D insufficiency (25-29ng/ml) in women (p<0.001).  The researchers opined that these findings imply an important role for vitamin D in skeletal muscle efficiency, specifically in the pelvic floor musculature.
Further anecdotal reports outlined a role for vitamin D in incontinence treatment.  At Ohio University, a 78 year old woman with a 6 month history of urge urinary incontinence received 6 months of weekly treatments of 50,000IU of vitamin D2, with complete resolution of her incontinence (10). The patient’s initial serum vitamin D concentration of 10ng/ml increased to 54ng/ml following these treatments. Similarly, at the same institution, 50,000IU weekly vitamin D2 restored continence in a 59 year old with stress incontinence (10).

Vitamin B12

Vitamin B12 is another micronutrient with the potential to influence continence. At the University of Pittsburgh, a case-control study of 208 geriatric outpatients 65 years and older examined a potential a link between urinary incontinence and serum vitamin B12 concentrations. The investigation matched cases with incontinence with controls of comparable age, race, sex, cognitive function, genitourinary conditions, medications, and mobility.  Subjects with incontinence were 2.63 times more likely to have vitamin B12 deficiency, defined as serum vitamin B12<250pg/ml (p=0.026) than controls.  As a cause-effect relationship could not be determined from such a study, the researchers recommended a controlled trial of vitamin B12 supplementation in incontinent patients, which, unfortunately, still remains forthcoming in the two decades since this report (11).
Other studies suggest a more ambiguous relationship between vitamin B12 and incontinence. In a retrospective analysis conducted at the University of Nebraska  geriatrics clinic, researchers investigated the relationship between serum vitamin B12 levels and both urinary and fecal incontinence in 929 elderly outpatients at least 65 years old (12).  Covariates which contribute to incontinence including functional status, cognitive status, age, race, gender, medical illnesses, and medications, were also assessed. Although those patients with vitamin B12 deficiency, defined as less than or equal to 300pg/ml, with both fecal and urinary incontinence were more than two times more likely to have dual fecal and urinary incontinence (p=0.03), no significant relationship was found between vitamin B12 deficiency and isolated urinary incontinence. Unfortunately, this study did not examine the relative severity of incontinence, and failed to examine many other covariates involved in the pathogenesis of incontinence, such as the presence  of diabetes, stroke, and prostate diseases (2). Among 119 community-dwelling Canadians, all ages 65-89, investigators did not detect an association between vitamin B12 serum concentrations of less than 165 ρmol/L and incontinence (13).
In addition, a prospective cross-sectional study of 119 elderly community-dwelling subjects also presented conflicting evidence.  This investigation defined vitamin B12 deficiency as serum B12 <165pg/ml, and assayed serum vitamin B12 and other, more precise markers of deficiency, methylmalonic acid and homocysteine concentrations.  No significant relationship existed between urinary incontinence, serum B12 (p=0.424), methylmalonic acid levels (p=0.386), or homocysteine concentrations (p=0.535).

Caffeine

Caffeine would seem to possess a common-sense role in the maintenance of continence. However, in the elderly, caffeine plays a less explicit role based on the published scientific literature. In fact, studies specifically in the elderly remain forthcoming. Therefore, the exact relationship to date can be only inferred from studies in younger individuals, which thus far provide conflicting evidence. In Korea, an epidemiological study noted an association between caffeine and postmenopausal women  age 50 and older (14).  In this population, including 4,028 women, mean age 63, a correlation existed between the highest tertile of caffeine intake (>150mg/d) and incontinence as determined by both physician (p=0.012) and subject report (p=0.04). A US study gleaned from NHANES data noted a correlation between an intake of at least 204mg/d, the uppermost quartile, and urinary incontinence (OR=1.47; 95%C 1.07-2.01) (15). The study also ascertained specific types of incontinence among subjects, and their severity, but observed no relationship between any of these and continence.


Discussion

Numerous studies explored several dietary factors that might play a role in the pathogenesis and progression of urinary incontinence.  Unfortunately, the evidence to date on such dietary factors in urinary incontinence is lacking. The literature is largely based only on epidemiologic studies, leaving much to be investigated in more prospective, controlled trials.  Furthermore, most researchers to date have used only subjective measures to quantify incontinence.  Importantly, very few studies have investigated these relationships specifically in the elderly. Urinary incontinence significantly impacts the quality of life of the elderly population, and as such, future studies to investigate both possible preventative and curative dietary interventions in the elderly will be crucial.
To date, evidence suggests an association between higher body fat and stress urinary incontinence in the elderly.  In addition, studies in younger persons have demonstrated associations between urinary incontinence and metabolic syndrome, BMI>30, and high fat and sugar intake, and demonstrated decreased incontinence following weight loss.  Researchers have hypothesized that obesity may increase intra-abdominal pressure, leading to increased intra-vesicular pressure and effects on pelvic floor musculature and urethral mobility, worsening both stress and urge urinary incontinence (3, 16, 17).  However, investigation into these associations in the elderly is lacking.  Neuromuscular electrophysiological studies of the pelvic floor musculature before and after an intervention might help confirm a role for excess calories in the pathogenesis of incontinence and suggest weight loss as a potential treatment. Future studies might focus on weight loss as a potential treatment specifically in the elderly, who most likely suffer the deleterious effects of incontinence.
Another important but related question that remains to be investigated is whether sugar and sweetener intake is independently associated with urinary incontinence.  Sugar and high-glycemic food intake, although known to play a role in weight gain and development of metabolic syndrome, have not been independently studied in relation to urinary incontinence. Many clinicians tout avoidance of even artificial sweeteners and spicy foods to alleviate incontinence, but these await formal trials as to benefit.
Studies in the elderly have demonstrated a consistent association between vitamin D deficiency or insufficiency and urinary incontinence in the elderly.  Investigators have proposed that the presence of Vitamin D receptors on the pelvic floor musculature, prostate tissue, and bladder muscle itself suggests a role of vitamin D in function of these structures and maintenance of urinary continence (7-9, 18, 19).  However, future studies should investigate vitamin D supplementation as a putative treatment for urinary incontinence in the elderly. The evidence on the association between Vitamin B12 and urinary incontinence is conflicting. Further research is needed to determine whether there exists a correlation strong enough to recommend vitamin B12 supplementation for the prevention or treatment of urinary incontinence. However, the benefit of supplementation of either vitamin may require treatment over long periods of time.
The literature, albeit conflicting, suggests a positive correlation between increased caffeine intake and worsening urinary incontinence in younger populations.  Further study might be directed at the effect of caffeine in the elderly, in order to determine whether providers should suggest decreased intake for their elderly patients suffering with incontinence.  Other dietary factors – including alcohol, calcium, food types, and fiber intake – show weaker possible associations with urinary incontinence.
A more robust response to weight loss might be obtained in future studies combining weight loss with other dietary approaches.  Perhaps weight loss together with vitamin D supplementation, for example could prove beneficial in the management of urinary incontinence.


Conflicts of interests: None


References

1.    Milsom I, Abrams P, Cardozo L, Roberts RG, Thuroff J, Wein AJ. How widespread are the symptoms of an overactive bladder and how are they managed? A population-based prevalence study. BJU Int. 2001;87(9):760-6.
2.    Collerton J, Davies K, Jagger C, Kingston A, Bond J, Eccles MP, et al. Health and disease in 85 year olds: baseline findings from the Newcastle 85+ cohort study. BMJ. 2009;339:b4904.
3.    Moreno-Vecino B, Arija-Blazquez A, Pedrero-Chamizo R, Alcazar J, Gomez-Cabello A, Perez-Lopez FR, et al. Associations between obesity, physical fitness, and urinary incontinence in non-institutionalized postmenopausal women: The elderly EXERNET multi-center study. Maturitas. 2015;82(2):208-14.
4.    Otunctemur A, Dursun M, Ozbek E, Sahin S, Besiroglu H, Koklu I, et al. Impact of metabolic syndrome on stress urinary incontinence in pre- and postmenopausal women. Int Urol Nephrol. 2014;46(8):1501-5.
5.    Dallosso HM, Matthews RJ, McGrother CW, Donaldson MM, Shaw C, Leicestershire MRCISG. The association of diet and other lifestyle factors with the onset of overactive bladder: a longitudinal study in men. Public Health Nutr. 2004;7(7):885-91.
6.    Dallosso H, Matthews R, McGrother C, Donaldson M. Diet as a risk factor for the development of stress urinary incontinence: a longitudinal study in women. Eur J Clin Nutr. 2004;58(6):920-6.
7.    Vaughan CP, Tangpricha V, Motahar-Ford N, Goode PS, Burgio KL, Allman RM, et al. Vitamin D and incident urinary incontinence in older adults. Eur J Clin Nutr. 2016;70(9):987-9.
8.    Kilic MK, Kizilarslanoglu MC, Kara O, Arik G, Varan HD, Kuyumcu ME, et al. Hypovitaminosis D is an independent associated factor of overactive bladder in older adults. Arch Gerontol Geriatr. 2016;65:128-32.
9.    Parker-Autry CY, Markland AD, Ballard AC, Downs-Gunn D, Richter HE. Vitamin D status in women with pelvic floor disorder symptoms. Int Urogynecol J. 2012;23(12):1699-705.
10.    Gau JT. Urinary incontinence resolved after adequate vitamin D supplementation: a report of two cases. J Am Geriatr Soc. 2010;58(12):2438-9.
11.    Rana S, D’Amico F, Merenstein JH. Relationship of vitamin B12 deficiency with incontinence in older people. J Am Geriatr Soc. 1998;46(7):931-2.
12.    Endo JO, Chen S, Potter JF, Ranno AE, Asadullah S, Lahiri P. Vitamin B(12) deficiency and incontinence: is there an association? J Gerontol A Biol Sci Med Sci. 2002;57(9):M583-7.
13.    Garcia A, Smith M, Freedman M. Vitamin B12 deficiency and incontinence in older people. Can J Urol. 2000;7(4):1077-80.
14.    Baek JM, Song JY, Lee SJ, Park EK, Jeung IC, Kim CJ, et al. Caffeine Intake Is Associated with Urinary Incontinence in Korean Postmenopausal Women: Results from the Korean National Health and Nutrition Examination Survey. PLoS One. 2016;11(2):e0149311.
15.    Gleason JL, Richter HE, Redden DT, Goode PS, Burgio KL, Markland AD. Caffeine and urinary incontinence in US women. Int Urogynecol J. 2013;24(2):295-302.
16.    Subak LL, Whitcomb E, Shen H, Saxton J, Vittinghoff E, Brown JS. Weight loss: a novel and effective treatment for urinary incontinence. J Urol. 2005;174(1):190-5.
17.    Subak LL, Marinilli Pinto A, Wing RR, Nakagawa S, Kusek JW, Herman WH, et al. Decrease in urinary incontinence management costs in women enrolled in a clinical trial of weight loss to treat urinary incontinence. Obstet Gynecol. 2012;120(2 Pt 1):277-83.
18.    Badalian SS, Rosenbaum PF. Vitamin D and pelvic floor disorders in women: results from the National Health and Nutrition Examination Survey. Obstet Gynecol. 2010;115(4):795-803.
19.    Vaughan CP, Johnson TM, 2nd, Goode PS, Redden DT, Burgio KL, Markland AD. Vitamin D and lower urinary tract symptoms among US men: results from the 2005-2006 National Health and Nutrition Examination Survey. Urology. 2011;78(6):1292-7.

DIFFERENCES BETWEEN CANADIAN AND MEDITERRANEAN DIETS: AN ASSESSMENT OF MACRONUTRIENTS IN THE DIETS OF CANADIAN OLDER ADULTS USING DATA FROM THE CANADIAN COMMUNITY HEALTH SURVEY 2.2


I. Culum, J.B. Orange, D. Forbes, M. Borrie

Health and Rehabilitation Sciences (Health and Aging), Faculty of Health Sciences, Western University, London, ON, Canada 

Corresponding Author: Ivan Culum, Health and Rehabilitation Sciences (Health and Aging), Faculty of Health Sciences, Western University, London, ON, Canada, E-mail: iculum@uwo.ca 


Abstract

Introduction: The World Health Organization (WHO) recommends a diet that limits saturated fat consumption and encourages unsaturated fat consumption. A diet that is compatible with the WHO recommendations and of considerable interest to researchers interested in dementia is the Mediterranean diet (MeDi). What is known empirically at present about the MeDi and dementia is that t may have roles to play in reducing the risk factors as well as the overall risk for developing dementia. Objectives: In this cross-sectional study, we examined the macronutrient composition of the average Canadian diet (CanDi) in order to see how it may differ from the average Mediterranean diet (MeDi). Additionally, we compared how the CanDi differs between groups based on gender, age, geographical location and classification (i.e. urban vs. rural), and dementia risk. Design: The Canadian Community Health Survey (CCHS) 2.2 data were used to estimate the macronutrient composition of the CanDi for older adults (age 50+) (N = 10,503 [4,955 male, 5,548 female], mean age = 64[10.30]).  Results: The average daily macronutrient intake in a CanDi was found to be 227.7 g of carbohydrates, 78.5 g of proteins, 67.8 g of fats (21.8 g of saturated fats, 27.1 g of monounsaturated fats, and 12.4 g of polyunsaturated fats), as well as 8.3 g of alcohol and have an average energy value of 1856.9 Kcal. The energy breakdown by macronutrient in a CanDi is estimated as follows: 49.2% from carbohydrates, 16.9% from proteins, and 31.1% from fats (10% saturated, 12.3% monounsaturated, and 5.7% polyunsaturated fats). On average, the respondents did not meet the daily energy requirements for their respective age group as outlined in Canada’s Food Guide. Conclusion: The macronutrient composition of the CanDi differs not only from the MeDi, but also from previous Western diet generalizations. Of particular interest is the finding that respondents identified as being “at-risk” for developing dementia consumed significantly less of each macronutrient and less food overall than those who were identified as otherwise healthy.

Key words: Diet, aging, dementia, Mediterranean diet. 


Introduction

Global average life expectancy has increased steadily from the early 20th century from 46.5 years to 70 years (1). According to experts in the United Nations Population Division, this pattern will continue into the near future. There also will be an increasing worldwide proportion of individuals over 65 years of age with those aged 85+ being the fastest growing cohort of all (1). In concert with the increasing global prevalence of older adults is the rise of chronic diseases among older adults, such as dementia, which are the leading causes of mortality among those 65 years of age and older in Canada (2, 3). 

Dementia is a syndrome in which there are persistent and progressive declines in memory, language and communication, personality, visuospatial skills and other cognitive processes such as executive functions (4). It is estimated that by 2038 approximately 1.1 million Canadians (2.8% of the overall population) will exhibit dementia (5). These estimates mean that the number of persons with dementia in Canada will more than double in just three decades (from approximately 480,000 in 2008 to approximately 1,125,000 in 2038) (5). The incidence of Alzheimer’s disease (AD), the most prevalent type of dementia, also is rising. There are 7.7 million new cases of dementia worldwide, which translates to approximately one new case every four minutes (6). It is estimated that AD will occur in 1 out of 85 persons worldwide by 2050 (7). The worldwide prevalence of AD was estimated to be 35.5 million in 2010 (8) with a quadrupling projected for 2050 (7). However, others have suggested that dementia incidence and prevalence has been on the decline in high-income European and North American nations (9, 10, 11]. While this is certainly a bit of good news, meaning that the aforementioned projections of absolute numbers of people with dementia may be a bit less dramatic, this does not mean that dementia will not remain a healthcare, economic, societal, emotional burden for years to come.

AD is the most prevalent type of dementia, followed by vascular dementia (VaD), Lewy-body dementia (LBD), and frontotemporal dementia (FTD) (6). AD and VaD account for most of the dementia cases worldwide. “Pure” AD and “pure” VaD occur less frequently than previously thought. It is common to find pathology relating to more than one dementia type in the brains of persons with dementia (PWD). The combination of pathologies of AD and VaD is called mixed dementia (MD) though no standard diagnostic tools exist for this type of pathology (12). 

To compound the rising global prevalence of dementia and the monumental care needs for those with dementia are the staggering costs of current care which are significant and increasing sharply. Estimates in 2010 for the total worldwide societal costs for dementia were USD 604 billion (6, 8), up from 315 billion in 2005 (13). Estimates based on data from the Canadian Study on Health and Aging (CSHA) reveal that annual societal costs of caring for older adults with dementia in Canada range from approximately CAD 10,000 for mild cases to CAD 38,000 for severe cases (14). Over 80% of these costs are attributed to institutionalization (15). Overall, Canadian dementia economic burden was estimated to be approximately CAD 15 billion in 2008 and is projected to increase to approximately CAD 870 billion by 2038 (5). Researchers estimated the annual cost of caring for a person with VaD to be USD 14,000 (16). Statistics Canada estimated the annual Canadian household per capita income to be CAD 42,600 (17) reinforcing further the severity and the importance of the economic impact of dementia on caregivers and to Canadian society in general. The financial burden to Canadians because of dementia, in all its forms, now and in the coming future simply cannot be ignored.

Diet and Aging

Preventive approaches designed to limit the development of chronic illnesses, such as dementia, are becoming increasingly important to researchers, clinicians, policy makers and caregivers. The preventive approaches, such as diet modifications, are most effective well before a disease manifests (primary prevention) but can be useful even after the disease emerges (secondary prevention). Prevention also can be cost-effective. While a healthy diet versus an unhealthy diet is more expensive in an immediate sense, societal and personal economic savings can be realized based on delaying disease onset. Adhering to a healthy diet can compress morbidity, that is, the overall reduction of end-of-life disease length (18). Therefore, reducing the incidence and prevalence of chronic diseases through dietary changes may improve the efficiency of health-care systems, and enhance the quality of life for those with chronic illnesses and for their caregivers. 

Healthy eating is a key component in healthy aging. Charlton (2002) demonstrates that the adoption of a healthy diet can increase overall life expectancy and can contribute to better overall health (19). While adopting a healthier diet is most effective earlier in life, it is important to note that protective benefits of a healthier diet can occur at any age (20). Unhealthy dietary habits (e.g., increased saturated fat intake) can lead to obesity that increases an individual’s chances of developing a variety of negative health outcomes such as cardiovascular disease, hypertension, hyperlipidemia, and diabetes. These conditions increase the risk of dementia in older adults and are identified as risk factors (21, 22). Minimizing these risk factors should be a key component in healthy aging.

A person’s metabolism slows down with advancing age where less energy is required to maintain normal functions. The adoption of healthier eating habits, particularly in response to age-related metabolic needs, can reduce directly the risk factors for vascular disease, which in turn can help reduce the development of dementia in most forms (e.g., AD, VaD and mixed). Findings from several longitudinal studies showed that healthier eating can result in reduced cholesterol levels (23-25) and systolic blood pressure (24). While there is no single healthy diet, the WHO recommends a diet that is limited in saturated fat consumption versus one in which there is unsaturated fat consumption. The WHO recommends that a healthy diet also includes: limiting overall energy intake from all fat sources, increasing the overall consumption of fruits and vegetables, legumes, and nuts/grains, and decreasing the intake of sodium and free sugars (26). A diet that is compatible with the WHO recommendations and of considerable interest to researchers interested in dementia is the Mediterranean diet (MeDi).

The Mediterranean Diet

The MeDi, which varies slightly among Mediterranean regions, commonly includes components such as high consumption of fish, fruits/vegetables/legumes, and grains, coupled with moderate dairy and alcohol consumption, and low meat consumption (27). Researches from Greece estimated that the average daily macronutrient intake in a MeDi consists of 255.0 g of carbohydrates, 74.5 g of proteins, 110.7 g of fats (29.8 g of saturated fats, 63.8 g of monounsaturated fats, and 9.9 g of polyunsaturated fats), as well as 14 g of alcohol, and have an average energy value of 2473 Kcal (28). Furthermore, the energy breakdown by macronutrient in a “typical” MeDi is estimated as follows: 47% from carbohydrates, 15% from proteins, and 38% from fats (10% saturated, 22% monounsaturated, and 6% polyunsaturated fats) (29). In comparison, the “typical” Western diet provides 42% of daily energy from carbohydrates, 20% from proteins, and 38% from fats (17% saturated, 14% monounsaturated, and 7% polyunsaturated fats) (30).

Since the 1960s the MeDi has received increasing scientific attention because of its association with a reduced risk of hypertension (31), coronary heart disease (32), obesity (33), as well as overall mortality (34). Researchers suggest that the MeDi may be beneficial in reducing the risk of AD and related dementias regardless of vascular comorbidity (35). Others suggest that the antioxidants typically found in olive oil compounds and red wine, components common in the MeDi, mediate vascular pathology (36, 37). Additionally, polyunsaturated fatty acids (PUFAs) (specifically omega-3 fatty acids) also may play an important role in mediating inflammatory response thereby further reducing the risk of vascular pathology (12, 38). It is likely that the MeDi is more than just a sum of its components and that its benefits are a result of multiple components working in tandem, although definitive evidence remains needed.

There is a growing body of evidence in favour of adopting the MeDi to help optimize health status and to reduce the risk of dementia. In a recent meta-analysis of studies in which a MeDi intervention was used, researchers reported that a higher adherence to the MeDi was associated with better cognitive function (and lower rate of cognitive decline), as well as an overall reduction of AD risk (39). In an earlier meta-analysis, researchers reported that an increase in MeDi adherence translated to a 10% reduction in death and/or incidence of vascular diseases as well as a 13% reduction of the incidence of neurodegenerative diseases (40). There also is evidence that adopting the MeDi reduces the risk of mild cognitive impairment (MCI) and the conversion of MCI to dementia (41). It is important to note that while MeDi research interest has been increasing over the past decade the relationship between MeDi and dementia risk remains a rising area of research activity.

Statement of Problem

What is known empirically at present about the MeDi and dementia is that it may have roles to play in reducing the risk factors as well as the overall risk for developing dementia. However, what remains unknown is how the average Canadian diet (CanDi) differs from the average Mediterranean diet (MeDi) and the implications of such differences on the development of dementia among Canadians. While previous research has focused primarily on the health benefits of either living in the Mediterranean region or the adoption of the MeDi in different regions worldwide, no investigators have published studies that examined how dietary habits of older Canadians compare to the MeDi. This is a necessary first step toward a clearer understanding of how much effort may be necessary to promote a shift toward the MeDi among Canadian older adults, particularly for those with dementia, those who are at-risk for developing dementia, or those who are otherwise healthy. 

The aim of this retrospective study was to fill this knowledge gap concerning the dietary habits of Canadian older adults. The following research questions were posed. 

Research Questions

1. What is the macronutrient composition of the typical diet of Canadian older adults (50+ years) according to the CCHS Cycle 2.2 (2004) data set?

2. Are there differences in dietary patterns between different Canadian older adult participant groups?

a. Is there a difference in dietary patterns between:

i. the young-old (51 to 70) vs. the older adult (71+) cohorts

ii. men vs. women in each of the two cohort age groups?

3. Are there differences in dietary patterns relative to geographical location (i.e., province and rural/urban areas) in Canada?

4. Are there differences in dietary patterns between “at-risk” (cognitively intact, but with vascular risk factors such as metabolic syndrome) and “healthy” groups?


Method

Study Design

Nutritional data were mined from the Canadian Community Health Study Cycle 2.2 (42) for this between groups retrospective study. These data represent the most current and comprehensive profile of dietary habit of Canadians. Permission from and authorization to access the restricted Statistics Canada database was obtained from the Research Data Centre (RDC) through a proposal submitted to the Social Sciences and Humanities Research Council of Canada (SSHRC) by the first author (IC).

Participants

Participant responses were obtained from the existing CCHS 2.2 data set (2004) (N = 10,524). The CCHS 2.2 employed a multistage stratified cluster design that provided a sample representative of the general Canadian population in terms of age, gender, geographical location, as well as socioeconomic status (42). The computer-assisted interviews were conducted from January 14, 2004 to January 21, 2005, with a random subset of Canadian participants selected for a second interview (24-hour dietary recall). All initial interviews were conducted in respondents’ homes, with the majority of the follow-up interviews conducted over telephone (others were conducted in-person). For the purpose of this study, respondents were placed into one of two groups based on their age at the time of their interview (51 to 70 inclusive or over 70) in order to correspond with the top two age bands as outlined in the Estimated Energy Requirements section of Canada’s Food Guide (43).   

Materials and Measures

The respondents’ dietary habits were assessed via a computer-aided-interview as well as a 24-hour dietary recall in the CCHH 2.2. These data were used to determine the macronutrient composition of the CanDi for older adult Canadians. 

Ethics and Permissions

Permission to use CCHS 2.2 data was obtained from Statistics Canada through the local Research Data Centre (RDC) at Western University. The statistical analyses were vetted by the Senior Analyst at the RDC to ensure that no participant could be identified due to sub-group analysis. In accordance with RDC regulations, no raw data were removed from the RDC office. 

Data Collection

Relevant data from the CCHS 2.2 were mined at the Western University RDC and exploratory data analyses were performed. The dataset was selected because it is the most current, large survey of its kind in Canada that contains relevant dietary information. Variables of interest were age (categorized), gender, province, geographical classification (urban or rural), daily macronutrient intakes (in grams), alcohol intake (in grams), energy from all food sources (in kilocalories), percentage of energy from specific macronutrients, and dementia risk status (healthy or at-risk). The only inclusion criteria for the sample selection was age (over 50) and not missing any responses pertaining to the abovementioned variables of interest. Respondents with incomplete or missing variables of interest were not considered for this study. The macronutrient variables include carbohydrates, proteins, fats, saturated fats (SFs), monounsaturated fatty acids (MUFAs), and polyunsaturated fatty acids (PUFAs). SFs, MUFAs, and PUFAs are a subset of fats and these values are not added to the overall daily fat intake. Furthermore, there are other types of fats not accounted for by this breakdown and the total daily fat intake value, therefore, is greater than the sum of these three types. The study variables were derived from questionnaire and interview responses and are only an estimate of the macronutrient composition of the respondents’ diets. The variables were selected because they are the best available method of quantifying the CanDi given the available data.  

Data Analyses

The CCHS 2.2 data were used to estimate the macronutrient composition of the CanDi. The normality of the sample was tested using the Kolmogorov–Smirnov and test (and the Shapiro–Wilk test in one case where a sub-group size was too small for the former test). With the exception of one small sub-group (respondents from Prince Edward Island), the responses were not distributed normally. Non-parametric tests were conducted on the data. IBM SPSS Statistics 22.0 for Microsoft Windows® (IBM Corp., Armonk, USA) was used to perform the exploratory data analysis, as well as independent samples Mann-Whitney U and Kruskal-Wallis tests (corrected for tied ranks).


Results

The inclusion criteria identified 10,524 relevant respondents. Due to missing data, 21 respondents were not used in the analyses (N = 10,503). The younger cohort (51 to 70) included 7,570 respondents (3,712 men, 3,858 women) while the older cohort (>70) included 2,933 respondents (1,243 men, 1,690 women). The mean age is 58.9 years for the younger cohort and 78.2 years for the older cohort.

The macronutrient composition of the CanDi for the respondents is presented in Table 1. The male respondents reported consuming significantly more carbohydrates, proteins, fats, SFs, MUFAs, PUFAs, and alcohol by weight (g) vs. the female respondents. Men also had a significantly higher daily caloric intake than women. Carbohydrates were the largest source of energy for both genders, followed by fats, with proteins being responsible for the least amount of energy from food sources (Table 2). Younger respondents consumed significantly more carbohydrates, proteins, fats, SFs, MUFAs, PUFAs, and alcohol by weight (g) than older respondents (Table 1). Younger respondents also had a significantly higher daily caloric intake than older respondents. Carbohydrates were the largest source of energy for both cohorts (Table 2) as well as by gender within cohorts (Table 4), followed by fats, with proteins being responsible for the least amount of energy from food sources (Tables 2 and 4). 
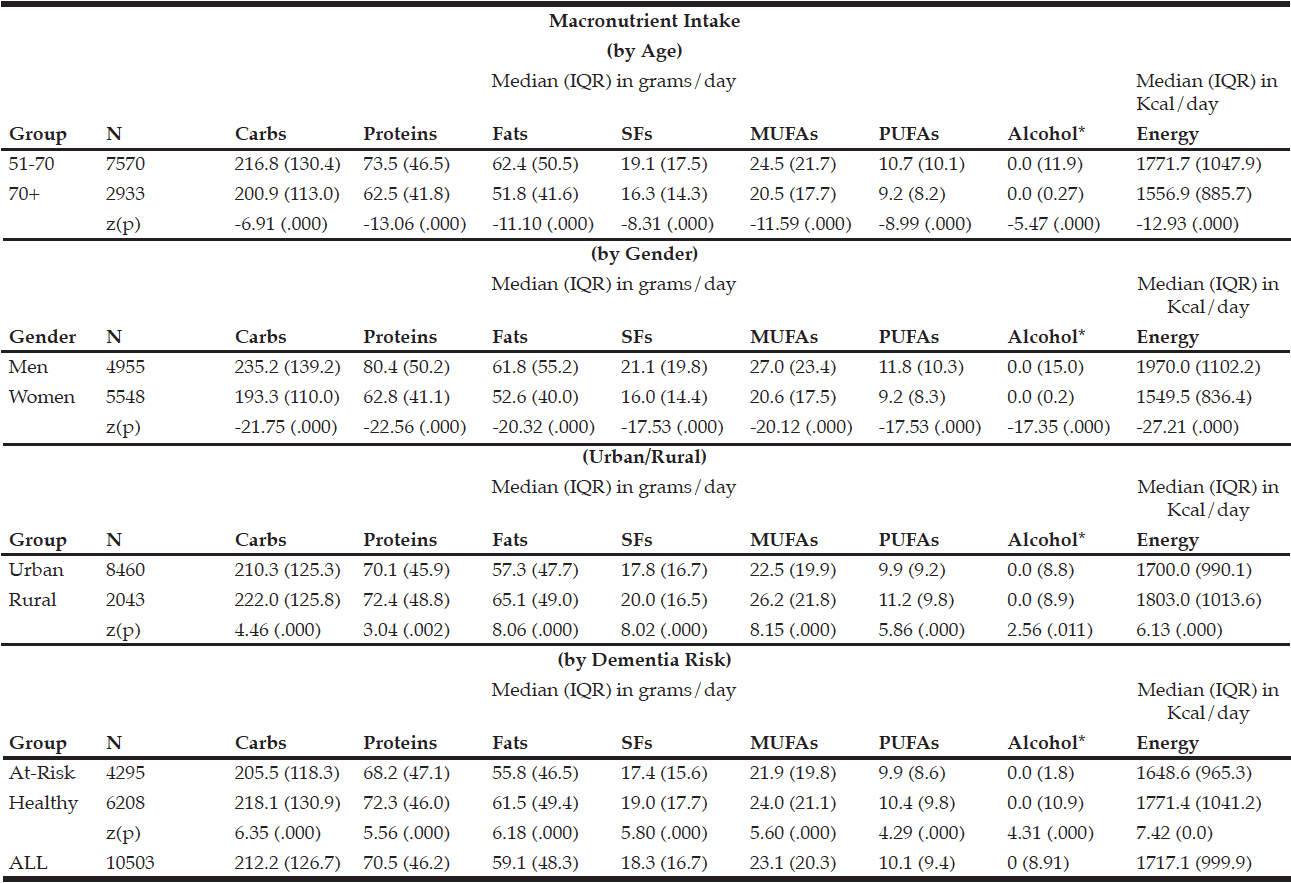
 

Table 1 Macronutrient intake (in grams) by age group, gender, geographical classification and dementia risk

* Median value is near zero due to many respondents’ non-consumption of alcohol on a daily basis
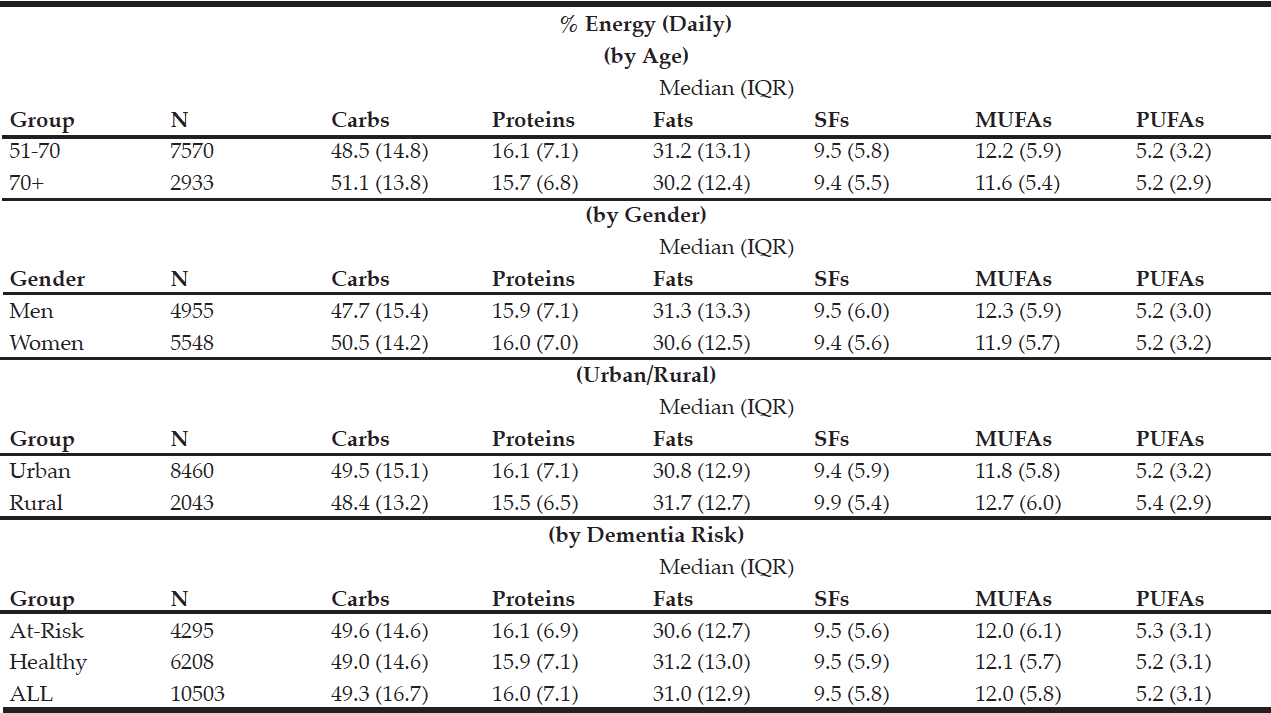
 

Table 2 Percentage of daily energy by source (by age group, gender, geographical classification and dementia risk)


Within the younger respondent group, men consumed significantly more carbohydrates, proteins, fats, SFs, MUFAs, PUFAs, and alcohol by weight (g) vs. women (Table 3). Men also had a significantly higher daily caloric intake than women. Carbohydrates were the largest source of energy for both genders, followed by fats, with proteins being responsible for the least amount of energy from food sources (Table 4). Within the older respondent group, men again consumed significantly more carbohydrates, proteins, fats, SFs, MUFAs, PUFAs, and alcohol by weight (g) vs. women (Table 3). Men in the older cohort also had a significantly higher daily caloric intake vs. women in the older cohort. Carbohydrates were the largest source of energy for both genders, followed by fats (Table 4), with proteins being responsible for the least amount of energy from food sources.


Table 3 Macronutrient intake (in grams) by age group and gender

* Median value is near zero due to many respondents’ non-consumption of alcohol on a daily basis


Table 4 Percentage of daily energy by source (by age group and gender)


Rural respondents consumed significantly more carbohydrates, proteins, fats, SFs, MUFAs, PUFAs, and alcohol by weight (g) vs. urban respondents (Table 1). Rural respondents also had a significantly higher daily caloric intake vs. their urban counterparts. Among provinces, there were statistically significant differences in daily carbohydrate, protein, fat, SF, MUFA, PUFA, and alcohol intakes by weight (g) (Table 5). Carbohydrates were the largest source of energy regardless of geographical classification (Table 2) or province (Table 6), followed by fats, with proteins being responsible for the least amount of energy from food sources.
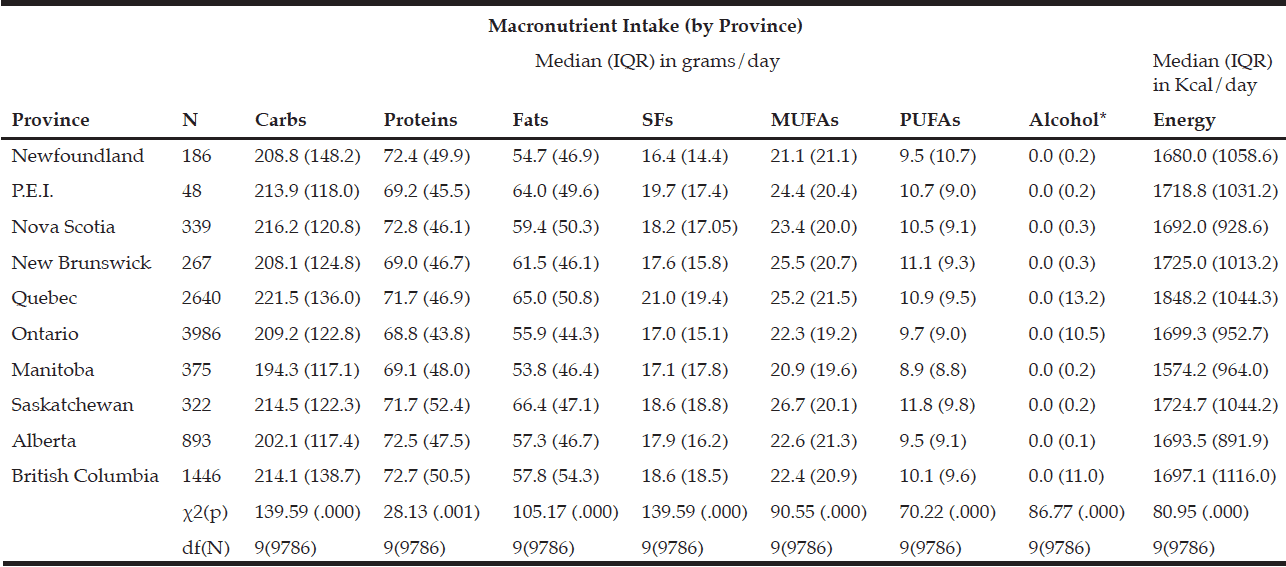
 

Table 5 Macronutrient intake (in grams) by province

* Median value is near zero due to many respondents’ non-consumption of alcohol on a daily basis
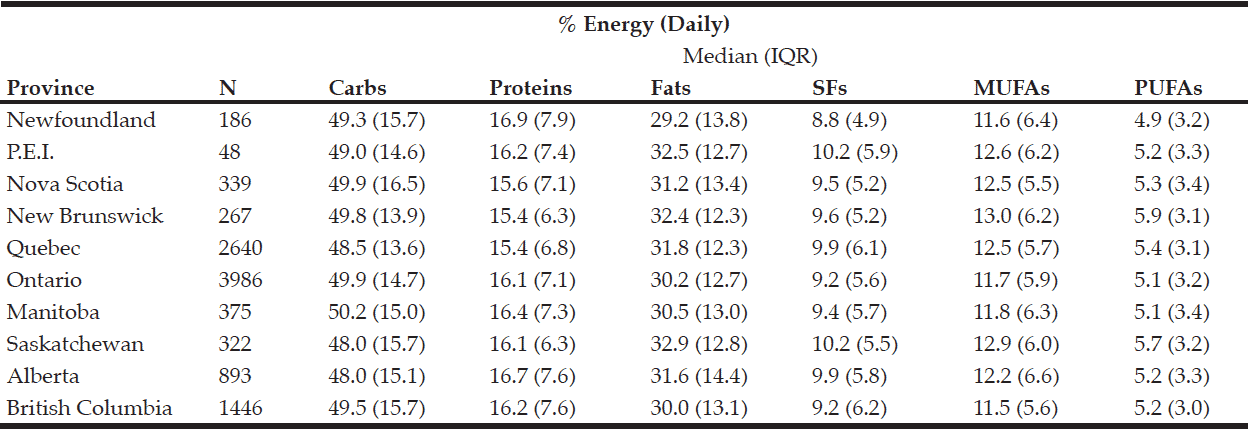
 

Table 6 Percentage of daily energy by source (by province)


Respondents who were identified to be at-risk for developing dementia (i.e., diagnosed with diabetes and/or hypertension and/or hypercholesterolemia) consumed significantly fewer carbohydrates, proteins, fats, SFs, MUFAs, PUFAs, and alcohol by weight (g) vs. those who were otherwise healthy (Table 1). These respondents also had a significantly lower daily caloric intake vs. those who are otherwise healthy. Carbohydrates functioned as the largest source of energy regardless of dementia risk status (Table 2), followed by fats, with proteins being responsible for the least amount of energy from food sources. There was an estimated 3,638,971 individuals over the age 50 in Canada who are at-risk for developing dementia (1,489,170 over the age of 70) out of an estimated 8,897,946 Canadians over the age of 50. This represents approximately 41% of all individuals over the age of 50 and 60% of all individuals over the age of 70.
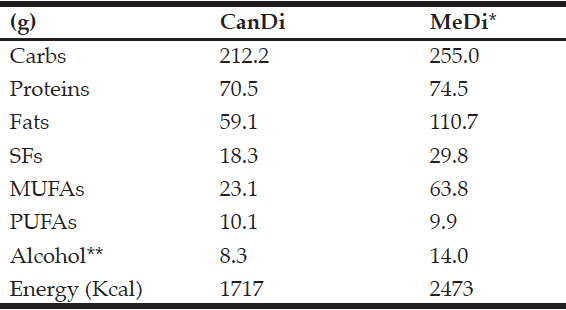
 

Table 7 Macronutrient intake (in grams) by diet type

* From Trichopoulou et al. (2006)
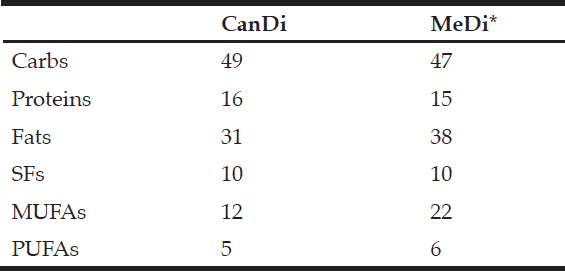
 

Table 8 Percentage of daily energy by source (by diet type)

* From Sacks & Katan (2002)


Discussion

The aim of this study was to estimate the dietary habits of Canadian older adults by examining the macronutrient composition of the CanDi using the most current Canada-wide survey data. Results show a median daily intake of 212.2 g of carbohydrates, 70.5 g of proteins, and 59.1 g of fats (including 18.3 g of SFs, 23.1 g of MUFAs, and 10.1 g of PUFAs). These values translate into 49.3% of daily energy from carbohydrates, 16.0% from proteins, and 31.0% from fats. The CanDi estimate differs from the MeDi estimate based on a lower daily carbohydrate intake (-42.8 g), slightly lower protein intake (-4.0 g), and a much lower total fat intake (-51.6 g). When comparing specific fat types, the CanDi is characterized by a lower daily SF intake (-11.5 g), much lower MUFA intake (-40.7 g), and a slightly higher PUFA intake (+0.2 g). The CanDi also can be characterized by a lower daily alcohol consumption (5.7 g less than in the MeDi estimate). It is important to note that many respondents did not report that they consume any alcoholic beverages on a regular basis. When comparing mean daily energy values, the CanDi provides ~756 Kcal less energy than the MeDi (Table 7).

The CanDi, based on the Canadian Community Health Study Cycle 2.2 data used in this study, is estimated to provide 2% more energy from carbs and 1% more energy from proteins than the MeDi. The CanDi provides 7% less energy from fats. Particularly notable is the comparison between energy intake by fat types, where both the CanDi and the MeDi provide 10% of daily energy from SFs (Table 8). The CanDi varies significantly among the various comparison sub-groups (age group, gender, geographical classification, province, and dementia risk status). However, it is important to note that neither age group meets the daily energy requirements for their respective group as outlined in Canada’s Food Guide (43) for even the most sedentary lifestyle, let alone an active one. The difference in daily energy requirements is even greater when comparing group medians to the recommended guideline values. However, this is not sufficient cause for alarm due to respondents’ tendency to underestimate their overall food intake (44). The higher daily energy intake values among men vs. women also are not surprising due to their relatively larger body size, but the difference becomes smaller between genders in the older age group (though no less significant). Differences among macronutrient intakes by province are also not surprising, possibly due to Canada’s varied geography, different cultural and ethnic backgrounds, and the sheer size of the country. Further analysis should involve a comparison based on likeness of region rather than provincial borders and should include the northern territories as well (though no territorial data is available in the CCHS 2.2 and this should be kept in mind when collecting new data). While the “healthy” sub-group consumes more of each macronutrient (even the SFs), it is unlikely that their “at-risk” counterparts owe their status to a lower overall food and energy intake. It is possible that these respondents are less active and may in fact still be consuming more relative to their counterparts. This is, however, the most important finding of our study relative to dementia as it suggests that the link between diet and dementia risk merits further exploration, which has also been suggested in recent meta-analyses (45, 46). Further investigation is necessary, particularly since there is a limited availability of pharmacological treatment options for cognitive impairment and dementia (47). 

Furthermore, it is important to note that the CCHS 2.2 nutritional data is based on a single 24-hour dietary recall, with a smaller sample being invited for a follow-up interview. As such, we advise that these results be interpreted with caution, as multiple recalls are recommended in order to accurately depict an individual’s nutrient intake (48).

Limitations

A limitation of this study is the age of the data. Due to increasing globalization additional foods are making their way into Canadians’ diet and this may result in significant changes of the CanDi composition. Unfortunately, no newer data exist at this time. The Canadian Federal government has not undertaken more recent national surveys of the dietary habits of Canadians. In addition, comparing PUFA intakes in this study is problematic because the CCHS 2.2 data does not provide a ratio of omega-6 to omega-3 PUFAs, though this is an inherent limitation of previous Western diet estimates as well. Bearing in mind the variance in data collection methods and sample sizes, these comparisons should be interpreted with caution and further exploration of the topic is necessary. It also is important to remember that these are only estimates of CanDi composition that are derived from responses to a questionnaire and an interview (which as noted above is another limitation in itself). Finally, the required daily energy estimates are based on a dated food guide.


Conclusion

Based on the available data set, the average Canadian (over the age of 50) has a mean daily intake of 212.2 g of carbohydrates, 70.5 g of proteins, and 59.1 g of fats. This includes 18.3 g of SFs, 23.1 g of MUFAs, and 10.1 g of PUFAs. This represents a 49.3% of daily energy intake from carbohydrates, 16.0% from proteins, and 31.0 from% fats. The macronutrient composition of the CanDi differs not only from the MeDi, but also from previous Western diet generalizations (49). This is not entirely unexpected. There are regional variations of the MeDi and such should be expected in the Western diet as well. Of particular interest is the finding that respondents identified as being “at-risk” for developing dementia consumed significantly less of each macronutrient and less food overall than those who were identified as otherwise healthy. Newer and richer data are needed in order to make a more accurate estimate of the current CanDi. Further research should be focused on physical activity levels in tandem with food intake, as well as taking cognitive impairment (and being at-risk for such impairment) into account in in the design phase of the study.

Conflict of Interest: None.


References

1. World population prospects: The 2012 revision [Internet].; 2012. Available from: http://esa.un.org.proxy1.lib.uwo.ca/wpp/documentation/pdf/wpp2012_highlights.pdf.

2. Percentage distribution for the 5 leading causes of death in Canada, 2011 [Internet].; 2014. Available from: http://www.statcan.gc.ca.proxy1.lib.uwo.ca/pub/82-625-x/2014001/article/11896/c-g/c-g01-eng.htm.

3. Wilkins, K. Predictions of death in seniors [Internet].; 2006. Available from: http://www.statcan.gc.ca.proxy1.lib.uwo.ca/pub/82-003-s/2005000/pdf/9090-eng.pdf. 

4. McKhann GM, Knopman DS, Chertkow H, Hyman BT, Jack CR,Jr, Kawas CH, et al. The diagnosis of dementia due to Alzheimer’s disease: Recommendations from the national institute on aging-Alzheimer’s association workgroups on diagnostic guidelines for Alzheimer’s disease. Alzheimer’s & Dementia. 2011 May;7(3):263-9. 

5. Rising tide: The impact of dementia on Canadian society [Internet].; 2010. Available from: http://www.alzheimer.ca/~/media/Files/national/Advocacy/ASC_Rising%20Tide_Full%20Report_Eng.ashx. 

6. Dementia – A public health priority [Internet].; 2012. Available from: http://whqlibdoc.who.int.proxy1.lib.uwo.ca/publications/2012/9789241564458_eng.pdf. 

7. Brookmeyer R, Johnson E, Ziegler-Graham K, Arrighi HM. Forecasting the global burden of alzheimer’s disease. Alzheimer’s & Dementia. 2007 Jul;3(3):186-91. 

8. World Alzheimer report 2010: The global impact of dementia [Internet].; 2010. Available from: http://www.alz.co.uk/research/files/WorldAlzheimerReport2010.pdf. 

9. Schrijvers EM, Verhaaren BF, Koudstaal PJ, Hofman A, Ikram MA, Breteler MM. Is dementia incidence declining?: Trends in dementia incidence since 1990 in the Rotterdam study. Neurology. 2012 May 8;78(19):1456-63.

10. Langa KM, Larson EB, Karlawish JH, Cutler DM, Kabeto MU, Kim SY, et al. Trends in the prevalence and mortality of cognitive impairment in the united states: Is there evidence of a compression of cognitive morbidity?. Alzheimer’s & Dementia. 2008 Mar;4(2):134-44.

11. Manton KC, Gu XL, Ukraintseva SV. Declining prevalence of dementia in the U.S. elderly population. Advances in Gerontology = Uspekhi Gerontologii/Rossiiskaia Akademiia Nauk, Gerontologicheskoe Obshchestvo. 2005;16:30-7.

12. Culum I, Orange JB, Forbes D, Borrie M. Omega-3 polyunsaturated fatty acids and dementia. 27th international conference of Alzheimer’s disease international; London, UK. ; 2012. 

13. Wimo A, Winblad B, Jonsson L. An estimate of the total worldwide societal costs of dementia in 2005. Alzheimer’s & Dementia. 2007 Apr;3(2):81-91.

14. Canadian Study on Health and Aging Working Group. Canadian study of health and aging: Study methods and prevalence of dementia. CMAJ Canadian Medical Association Journal. 1994 Mar 15;150(6):899-913. 

15. Hux MJ, O’Brien BJ, Iskedjian M, Goeree R, Gagnon M, Gauthier S. Relation between severity of Alzheimer’s disease and costs of caring. CMAJ Canadian Medical Association Journal. 1998 Sep 8;159(5):457-65. 

16. Hill J, Fillit H, Shah SN, del Valle MC, Futterman R. Patterns of healthcare utilization and costs for vascular dementia in a community-dwelling population. J Alzheimer’s Dis. 2005 Sep;8(1):43-50. 

17. Changes in family wealth [Internet].; 2008. Available from: http://www.statcan.gc.ca.proxy1.lib.uwo.ca/pub/75-001-x/2008106/pdf/10640-eng.pdf. 

18. Fries JF. Aging, natural death, and the compression of morbidity. N Engl J Med. 1980 Jul 17;303(3):130-5. 

19. Charlton KE. Eating well: Ageing gracefully! Asia Pac J Clin Nutr. 2002;11(Suppl 3):S607-17. 

20. Chernoff R. Nutrition and health promotion in older adults. Journals of Gerontology Series A-Biological Sciences & Medical Sciences. 2001 Oct;56(Spec 2):47-53. 

21. Middleton LE, Yaffe K. Promising strategies for the prevention of dementia. Arch Neurol. 2009 October;66(10):1210-5. 

22. Whitmer RA, Sidney S, Selby J, Johnston SC, Yaffe K. Midlife cardiovascular risk factors and risk of dementia in late life. Neurology. 2005 January 25;64(2):277-81. 

23. Dayton S, Pearce ML, Goldman H, Harnish A, Plotkin D, Shickman M, et al. Controlled trial of a diet high in unsaturated fat for prevention of atherosclerotic complications. Lancet. 1968 Nov 16;2(7577):1060-2. 

24. Jacobs DR,Jr, Luepker RV, Mittelmark MB, Folsom AR, Pirie PL, Mascioli SR, et al. Community-wide prevention strategies: Evaluation design of the minnesota heart health program. J Chronic Dis. 1986;39(10):775-88. 

25. van Beurden EK, James R, Henrikson D, Tyler C, Christian J. The north coast cholesterol check campaign. results of the first three years of a large-scale public screening programme. Med J Aust. 1991 Mar 18;154(6):385-91. 

26. Global strategy on diet, physical activity and health [Internet].; 2004. Available from: http://www.who.int.proxy1.lib.uwo.ca/dietphysicalactivity/strategy/eb11344/strategy_english_web.pdf. 

27. Trichopoulou A, Lagiou P. Healthy traditional Mediterranean diet: An expression of culture, history, and lifestyle. Nutr Rev. 1997 Nov;55(11 Pt 1):383-9. 

28. Trichopoulou A, Vasilopoulou E, Georga K, Soukara S, Dilis V. Traditional foods: Why and how to sustain them. Trends Food Sci Technol. 2006;17(9):498-504. 

29. Fernandez de la Puebla RA, Fuentes F, Perez-Martinez P, Sanchez E, Paniagua JA, Lopez-Miranda J, et al. A reduction in dietary saturated fat decreases body fat content in overweight, hypercholesterolemic males. Nutrition Metabolism & Cardiovascular Diseases. 2003 Oct;13(5):273-7. 

30. Sacks FM, Katan M. Randomized clinical trials on the effects of dietary fat and carbohydrate on plasma lipoproteins and cardiovascular disease. Am J Med. 2002;113(9):13-24. 

31. Chrysohoou C, Panagiotakos DB, Pitsavos C, Das UN, Stefanadis C. Adherence to the Mediterranean diet attenuates inflammation and coagulation process in healthy adults: The ATTICA study. J Am Coll Cardiol. 2004 Jul 7;44(1):152-8. 

32. Singh RB, Dubnov G, Niaz MA, Ghosh S, Singh R, Rastogi SS, et al. Effect of an Indo-Mediterranean diet on progression of coronary artery disease in high risk patients (Indo-Mediterranean diet heart study): A randomised single-blind trial. Lancet. 2002 Nov 9;360(9344):1455-61. 

33. Schroder H, Marrugat J, Vila J, Covas MI, Elosua R. Adherence to the traditional Mediterranean diet is inversely associated with body mass index and obesity in a Spanish population. J Nutr. 2004 Dec;134(12):3355-61. 

34. Knoops KT, de Groot LC, Kromhout D, Perrin AE, Moreiras-Varela O, Menotti A, et al. Mediterranean diet, lifestyle factors, and 10-year mortality in elderly European men and women: The HALE project. JAMA. 2004 Sep 22;292(12):1433-9. 

35. Scarmeas N, Stern Y, Tang MX, Mayeux R, Luchsinger JA. Mediterranean diet and risk for Alzheimer’s disease. Ann Neurol. 2006 Jun;59(6):912-21. 

36. Carluccio MA, Siculella L, Ancora MA, Massaro M, Scoditti E, Storelli C, et al. Olive oil and red wine antioxidant polyphenols inhibit endothelial activation: Antiatherogenic properties of Mediterranean diet phytochemicals. Arteriosclerosis, Thrombosis & Vascular Biology. 2003 Apr 1;23(4):622-9. 

37. Chiva-Blanch G, Urpi-Sarda M, Llorach R, Rotches-Ribalta M, Guillen M, Casas R, et al. Differential effects of polyphenols and alcohol of red wine on the expression of adhesion molecules and inflammatory cytokines related to atherosclerosis: A randomized clinical trial. Am J Clin Nutr. 2012 Feb;95(2):326-34. 

38. Helton WS, Espat NJ. Defining mechanisms of ω-3 fatty-acid activity. Nutrition. 2001;17(7-8):674-. 

39. Lourida I, Soni M, Thompson-Coon J, Purandare N, Lang IA, Ukoumunne OC, et al. Mediterranean diet, cognitive function, and dementia: A systematic review. Epidemiology. 2013 Jul;24(4):479-89. 

40. Sofi F, Abbate R, Gensini GF, Casini A. Accruing evidence on benefits of adherence to the Mediterranean diet on health: An updated systematic review and meta-analysis. Am J Clin Nutr. 2010 Nov;92(5):1189-96.

41. Scarmeas N, Stern Y, Mayeux R, Manly JJ, Schupf N, Luchsinger JA. Mediterranean diet and mild cognitive impairment. Arch Neurol. 2009 Feb;66(2):216-25. 

42. Canadian community health survey, cycle 2.2 [Internet].; 2004. Available from: http://www.hc-sc.gc.ca.proxy1.lib.uwo.ca/fn-an/surveill/nutrition/commun/cchs_focus-volet_escc-eng.php. 

43. Canada’s food guide: Estimated energy requirements [Internet].; 2014. Available from: http://www.hc-sc.gc.ca.proxy1.lib.uwo.ca/fn-an/food-guide-aliment/basics-base/1_1_1-eng.php. 

44. Mertz W, ed. Beltsville one-year dietary intake study. J Nutrition. 1984 Dec;6(suppl):1323-403.

45. Singh B, Parsaik AK, Mielke MM, Erwin PJ, Knopman DS, Petersen RC, Roberts RO. Association of Mediterranean diet with mild cognitive impairment and Alzheimer’s disease: a systematic review and meta-analysis. J Alzheimers Disease. 2014; 39(2):271-82.

46. Cooper C, Sommerlad A, Lyketsos CG, Livingston G. Modifiable predictors of dementia in mild cognitive impairment: a systematic review and meta-analysis. Am J Psych. 2015 Apr;172(4):323-34. 

47. Psaltopoulou T, Sergentanis TN, Panagiotakos DB, et al. Mediterranean diet and stroke, cognitive impairment, depression: a meta-analysis. Ann Neurol. 2013 Sep; 74:580–591.

48. Basiotis PP, et al. Number of days of food intake records required to estimate individual and group nutrient intakes with defined confidence. J Nutrition. 1987 Sep;117(9):1638-41.

49. Pineo CE, Anderson JJB. Cardiovascular benefits of the Mediterranean diet. Nutrition Today. 2008;43:114-20. 
DIETARY INADEQUACIES IN THE ELDERLY WITH ALZHEIMER’S DISEASE FOLLOWED AT THE REFERENCE HEALTH CENTER FOR ELDERLY CARE IN CURITIBA – BRAZIL


D. Rodrigues Lecheta1, M.E. Madalozzo Schieferdecker1, A.P. de Mello2, I. Berkenbrock3, J. Cardoso Neto1, E.M.C. Pereira Maluf1

1. Federal University of Paraná, Brazil ; 2. Clinical Hospital of Federal University of Paraná, Brazil; 3. Curitiba Municipal Secretary of Health, Brazil

Corresponding Author: Danielle Rodrigues Lecheta, Federal University of Paraná, Brazil, 54, Osman Ahamad Gebara street, Parque Alvorada, Zip code 79823-461, Dourados/MS, Brazil, Telephone numbers: (005567) 3032-6360 / (005567) 8171-3288, danilecheta@gmail.com


Abstract

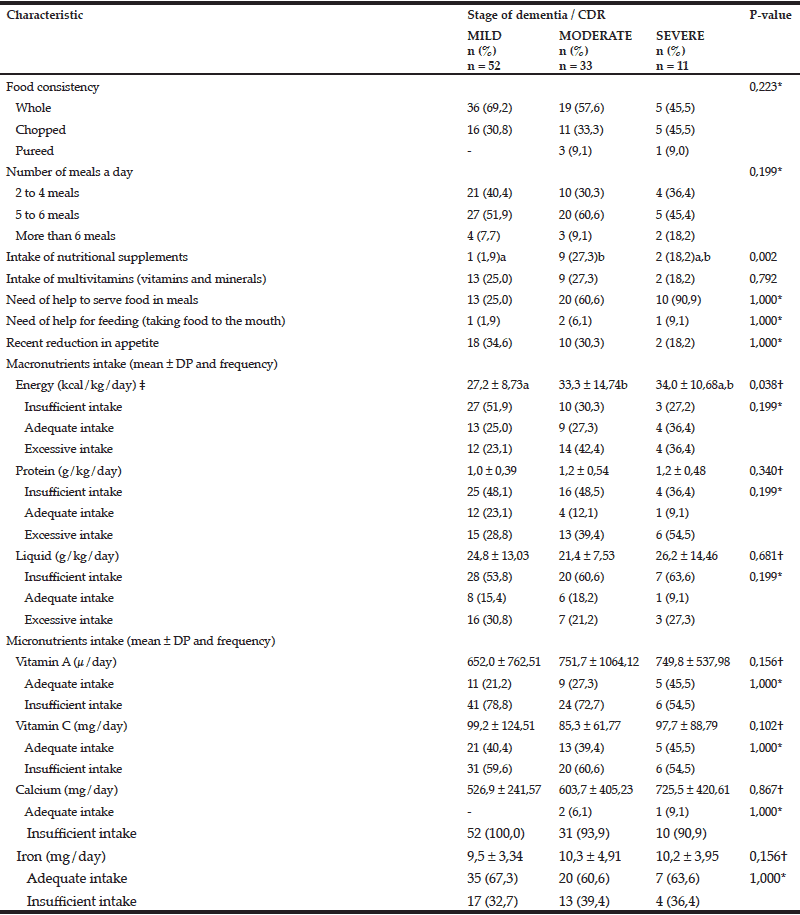
Background: Dietary changes are frequent in Alzheimer’s disease (AD). Objective: to assess the dietary intake of elderly with AD. Design: cross sectional study. Setting: AD patients followed at the Health Center of Elderly Care Ouvidor Pardinho, in Curitiba/Brazil, from November/2010 to July/2011. Participants: 96 individuals. Measurements: the scales used were the Mini Nutritional Assessment to determine the nutritional status and the Clinical Dementia Rating to set the stage of dementia. The average food intake of three days was analyzed for energy, carbohydrates, protein, fat, vitamin A, vitamin C, calcium, iron and liquids, and compared with the individualized nutritional recommendations. Results: 96 elderly patients were evaluated. The mean age was 78.0 ± 6.52 years, and most of them had mild AD (54.2%) and risk of malnutrition (55.2%). All of them were oral fed and 37.5% received modified consistency food. Regarding independence for feeding: 44.8% of the elderly needed assistance to serve food, 31.3% did not eat when the meal was not offered by the caregiver, and 31.3% ate less than usual. Regarding dietary adequacy: 41.7% had low-calorie diet, 46.9% low-protein diet, and most of the patients had insufficient intake of vitamins A and C, calcium and iron. Decreased appetite occurred in 31.3% of the elderly. Conclusion: the dietary intake of AD patients is inadequate when compared with nutritional recommendations. Caregivers should be informed about the need of specialized nutritional monitoring and feeding assistance for the demented patient since the early stage of the disease.

Key words: Alzheimer disease, diet, nutritional status.


Introduction

Alzheimer’s disease (AD) is the most common type of dementia, accounting for 60 to 70% of the cases (1). The loss of memory is one of the earliest and most pronounced symptoms. As the disease advances, trouble with language, intellectual performance, independence and autonomy are frequent (2). It is also usual dietary changes, as decreased appetite, difficulty with chewing, dysphagia, food refusal (2, 3, 4) and body composition alterations, such as unintentional weight loss (3), accelerated loss of muscle mass and sarcopenia (5, 6). Studies have described the high prevalence of malnutrition in elderly patients with AD (7,8) and their poorer nutritional and functional status compared to the ones without dementia (9).

The etiology of weight loss and malnutrition in AD seems to be multifactorial. Several hypotheses have been proposed to explain it, but none has been proven (3). It is presently unclear whether the energy imbalance and the accompanying weight loss associated with AD are caused by reduced energy intake, elevated energy expenditure, or a combination of both (5). Also, it is possible that the causes vary depending on the stage of dementia. Early in the disease, when the patient is still able to self-feed, malnutrition may be related to behavioral disorders, associated depression or other comorbidities (10), while in advanced stages, behavioral disturbances, cognitive deficit, impossibility of eating without help and dysphagia assume a central role (11). According to Roque, Salva and Vellas (10), demented patients who are dependent for eating have a relative risk of 8.25 for malnutrition.

Some researchers have examined the adequacy of diets offered to these patients and found that the diets were adequate (12) or suboptimal (7, 8). However, other studies showed that the weight loss was not accompanied by decreased energy intake (3, 13).

The aim of this study is to assess the dietary intake of AD patients followed at the Health Center of Elderly Care.

Methods

This is a cross sectional study. The research project was approved by the Ethics Committee of Curitiba Municipal Secretary of Health, with protocol number 132/2010. The study included elderly patients with the diagnosis of probable AD, followed at the Health Center of Elderly Care Ouvidor Pardinho, which is the reference to assist the elderly with AD in the city of Curitiba (southern Brazil), users of the public health system. The diagnosis of probable AD was made according to the criteria of the National Institute of Neurological and Communicative Disorders and Strokes – Task Force on Alzheimer’s Disease (14). The minimum sample size was estimated at 90 individuals, considering confidence interval of 95% and margin of error of less than 10%.

The inclusion criteria were: to be 60 years old or more, to have the diagnosis of probable AD and to be accompanied by the primary caregiver for data collection. The exclusion criteria were: to reside in long-term care institutions, to have chronic renal or heart failure or consumptive diseases, to be unable to stand up to assess the current weight and primary caregiver unable to write the food record.

The patients screening was done by a geriatrician doctor from November 2010 to July 2011. Written instructions and the forms for food record were given to the caregiver and the date for the data collection was scheduled.

After the caregiver and/or the patient signed the Informed Consent Form, the patient was assessed by a trained nutritionist. Information about feeding, and also demographic, economic and cultural data was collected in the interview. The stage of AD was classified in mild, moderate and severe according to the Clinical Dementia Rating (CDR) (15, 16). The Mini Nutritional Assessment (MNA) (17) was performed to determine the nutritional status of the elderly; scores greater than 23.5 indicate normal weight, 17 to 23.5 nutritional risk and under 17 malnutrition. In the items of MNA regarding perceived health and nutritional status, it was considered the responses provided by the caregiver.

The anthropometric assessment was performed according to standard techniques; weight, height, arm circumference (AC), calf circumference (CC), triceps skinfold (TSF) and subscapular skinfold were collected. Circumferences and skinfolds were obtained on the right side, assessed three times and then the average value was figured. Arm muscle circumference (AMC) was calculated (AMC = AC (cm) – π x [TSF (mm) / 10]). Body Mass Index (BMI) was calculated (BMI (kg/m2) = weight / height2) and the result was interpreted as the reference values for elderly population: underweight, less than 22 kg/m2; normal weight, from 22 to 26.9; and overweight, 27 or more.

The following biochemical tests were performed: hemoglobin, total lymphocytes, albumin and total cholesterol. The reference values for adequate nutritional status were: hemoglobin ≥ 12.0 g/dl in females and ≥ 14.0 g/dL for males; total lymphocytes ≥ 2000/mm3; albumin ≥ 3.5 g/dl; and total cholesterol ≥ 150 mg/dl (18).

The food intake of the patients was analyzed with the three day food record, registered by the caregivers. The nutrient intake was calculated using the software Avanutri version 4.0, for energy, carbohydrate, protein, fat, vitamin A, vitamin C, calcium, iron and liquids. The values were obtained by the average intake of the three days.

The energy recommendation was according to the DRIs (Dietary Reference Intake), through the prediction equations proposed for the calculation of total energy expenditure (TEE) (19), which considers gender, age, weight, height and physical activity. For weight gain, the energy recommendation was 30 to 35 calories per kilogram of body weight (20). The protein recommendation was 1.0 g of protein per kilogram of body weight (20); higher values were used in the presence of wounds or hypoalbuminemia. The liquid recommendation was 25 to 30 ml per kilogram of body weight (20) or more if diarrhea or fever.

The micronutrients recommendations were according to the DRIs. For elderly men: 900 μg/d of vitamin A (as retinol equivalents), 90 mg/d of vitamin C, 1200 mg/d of calcium and 8 mg/d of iron. For elderly women: 700 μg/d of vitamin A (as retinol equivalents), 75 mg/d of vitamin C, 1200 mg/d of calcium and 8 mg/d of iron.

Statistical analysis was performed with SPSS Statistics 17.0, Statgraphics Centurion and software R version 2.13.0. The nonparametric Kruskal-Wallis test was used to compare the values of the variables among the different stages of AD (mild, moderate and severe). The nonparametric chi-square test to assess differences in frequencies among groups of variables. For variables with statistically significant difference, the multiple comparisons test was used to check for pairs of groups in which differences were found. In all statistical analysis p <0.05 was considered statistically significant.

Results

Among the 328 screened patients, 187 were eligible for the study. Of these, 96 patients and caregivers agreed to participate and were evaluated. Ninety-one respondents refused to participate; in 79 cases the caregiver refused and in 12 cases the patient did. The main reasons given were lack of time and difficulty in taking the elderly to the health center.

The population of the study is predominantly female (n = 68, 70.8%) with mean age of 78.0 years (± 6.52), ranging from 60 to 94 years. Most of the individuals had mild AD (n = 52, 54.2%) and were at risk of malnutrition according to MNA (n = 53, 55.2%). According to the criteria of BMI, 53.1% of them had normal nutritional status (n = 51) and 27.1% were underweight (n = 26). Biochemical evaluation highlights a large number of individuals with reduced lymphocyte values (n = 52, 55.3%). Table 1 provides further information on the characteristics of the patients.

Table 1 Characteristics of patients with Alzheimer disease

CDR = Clinical Dementia Rating; MNA = Mini Nutritional Assessment; BMI = Body Mass Index; * Two caregivers refused to inform the family income; † The Brazilian minimum wage in 2011 was R$ 545.00. In the same year, the exchange rate of the Brazilian currency Real (R$) to U.S. dollars (US$) was 1.67 R$/US$ (21). Thus, one Brazilian minimum wage was equivalent to US$ 326,35; cymbalta ‡ Range: 0 – 30 points; the lowest score is the most severe; § There were some missing biochemical information for some patients.

Regarding diet (table 2), all patients were oral fed and 62.5% (n = 60) received normal consistency food. Most of them were independent for feeding (taking food to the mouth) (n = 92, 95.8%), but 44.8% of them (n = 43) needed help to serve food during meals. When caregivers were asked if the patients had the initiative to self-feed when the meal was not offered by the caregiver, for example when they were alone, 31.3% (n = 30) answered that in this case the patients did not eat, and other 31.3% (n = 30) that they ate less than usual.

Table 2 The feeding of patients with Alzheimer disease

Table 3 presents data on the average daily food intake of the study population, demonstrating the dietary inadequacy of most patients.

Table 3 Food intake of patients with Alzheimer disease

When asked if the caregiver had doubts about the patient´s diet, 39.6% (n = 38) answered affirmatively.

The feeding profile of the studied population was analyzed considering the different stages of dementia (table 4). Statistically significant difference was found between the mean values of energy intake in mild and moderate stages, with significantly lower values in the mild stage (p = 0.038). Also, there was statistically significant difference in the intake of nutritional supplements between mild and moderate stage (p=0,002).

Table 4 The feeding of patients, according to the stage of Alzheimer´s disease

CDR = Clinical Dementia Rating; * Chi-square test was used to assess differences in frequencies among the three groups of variables, considering significance level p < 0,05; † Kruskal-Wallis test was used to 60 cymbalta compare the mean values among the three groups, considering significance level p < 0,05; ‡ Since p value was significant (p <0.05), the Multiple Comparisons Test (considering significance level p < 0,05) was used to check for pairs of groups in which differences were found (mild vs moderate, mild vs severe, moderate vs. severe), represented by superscript letters. When the letters are different, there is a statistically significant difference between the pairs; when the letters are the same, no significant difference was found between the pairs.

Discussion

The poor nutritional status of the studied population was evident with the results from MNA: 55.2% of the elderly were at risk of malnutrition and 5.2% malnourished. However, when BMI is used, most of them have the diagnosis of normal weight (53.1%) and 27.1% underweight. MNA probably reflects better the nutritional status of the elderly when compared to BMI because it considers more anthropometric measures, including those for muscle mass, as well as patient´s medical history and diet.

The immunodeficiency of the study population should call attention, as 55.3% of the sample presented reduced lymphocytes values. According to Guigoz (22), immune function is impaired in the elderly with MNA score indicative of malnutrition.

This study highlights the difficulties related to feeding experienced by patients with AD and caregivers, which include the composition of the daily menu and the management of difficulties during meals. These difficulties might be related to the poor nutritional status found.

The change in the dietary patterns of older people with dementia, or even with mild cognitive impairment, was described in the study of Orsitto (8), in which these individuals had significantly lower scores on items of MNA about patient´s diet, when compared to the ones without cognitive impairment (p <0.001). In a prospective study about the clinical course of advanced dementia, Mitchell et al. (4) found that 86% of the evaluated elderly patients had eating problems during the study period, including weight loss, trouble with chewing or swallowing, refusal to eat or drink, suspected dehydration and persistently reduced oral intake. In advanced stage of dementia, these changes were associated with a 6-month mortality rate of 38.6% (4).

All subjects of the study were exclusively oral fed and 95.8% of them could self-feed, which reinforces the information that eating is typically the last basic activity of daily living (BADL) to become impaired in AD (23). Anyway, most patients need the caregiver to organize, offer the meal and serve the food to provide their food intake, which means they are semi-dependent for feeding.

Over 30% of primary caregivers mentioned patient´s recent reduced appetite, and the frequency of this complaint seems to increase with worsening nutritional status. Previous studies have also reported high prevalence of appetite disorders in this population (24). Most patients had up to four meals a day, when the recommendation is at least five meals a day.

The mean energy and protein intake of elderly patients, with values normalized to body weight, were 30.1 kcal/kg/day ± 11.66 and 1.1 g protein/kg/day ± 0.46 respectively; values which give rise to the false interpretation that the diet is adequate, despite the high standard deviation in the average energy intake. Jesus et al. (7) found average intake of 27.1 ± 8.7 kcal/kg/day and 1.1 ± 0.4 g protein/kg/day; Machado et al. (12) found 26.4 and 26.3 kcal/kg/day and 0.9 and 1.2 g protein/kg/day in patients with mild and moderate stage of dementia respectively, values which are also apparently normal. In the present study the results were stratified according to the adequacy of nutrients intake for each patient, comparing consumption with the individualized nutritional recommendations, and thus, the high prevalence of dietary inadequacy of the studied population was evident. It is noteworthy that 41.7% of the patients consumed low calorie diets and 46.9% had low protein diets, beyond insufficient intake of vitamins A and C, calcium and iron. These results support the hypothesis that low energy intake may contribute to unintentional weight loss in individuals with AD (5). According to Castaneda et al. (25), insufficient protein intake may result in loss of lean tissue, immune response and muscle function.

The poor diets may be related to patient´s low education, since 71.9% of them attended only primary school, and to low-income, as 67.7% of families earned up to 2 Brazilian minimum wages per member. The brain disorder can also impair the regulation of food intake by the central nervous system (2, 6). Spaccavento et al. (2) hypothesized that changes in dietary habits and the onset of functional, cognitive and neuropsychiatric disorders in patients with AD reflect the involvement of a common neuroanatomical network. This can be due to the involvement of the prefrontal area with cortical and subcortical circuits, in programmed movement, behavioral control and in eating behavior regulation (2).

Only 12.5% of the patients received nutritional supplements regularly and 25% were taking multivitamin, perhaps due to

pharmacy technician online course canada / online pharmacy / canadian pharmacy scams / generic viagra / cialis for daily use review / online pharmacy reviews / http://pharmacyincanada-online.com/ / viagra online canadian pharmacy

the low purchasing power of the families or because they did not know these products. Despite the high prevalence of nutritional risk, the study population is not routinely assessed by dietitians and, thus, it is likely that dietary errors are not identified and treated promptly.

The patients in the mild stage of AD had significantly lower mean energy intake when compared to the ones in the moderate stage. Since patients in the mild stage usually have good level of independence for BADL, it is possible that they are not adequately monitored by caregivers with regard to food intake, despite the presence of some subtle negative changes in diet due to cognitive and behavioral impairment, which may influence the amount of ingested nutrients. In the study of Lin, Watson and Wu (26), patients with moderate feeding difficulties, but who could still self-feed, were ignored by the staff of the long-term care institutions where the study was conducted, whereas those with severe dependency who required feeding by nursing staff had better food intake. In both cases, patients who received more family visits at mealtimes, when family was encouraged to assist in the feeding of their relative, had better food intake (26).

The higher percentage of patients with adequate intake of vitamin A, vitamin C and calcium in severe stage of dementia may be due to the fact that their diets are more often chosen by caregivers, who probably select food of better nutritional quality.

After conducting a literature review about interventions that can be undertaken to establish and maintain adequate nutritional intake in older people with dementia, Cole (27) concluded that there is not a standardized intervention. The findings suggest that providing adequate training for staff and allowing more time to assist patients feeding have positive effects. Other interventions mentioned were: engaging the advice of a dietitian, introduction of nutritional supplements, improvements in the mealtime environment and providing assistance with feeding before dietary intake declines dramatically (27).

The inadequate diet of the subjects is an important finding of this study and should call attention of health services for intervention. Diet influences the nutritional and clinical course of patients and thus, nutritional intervention should be early, appropriate and carried out by qualified dietitians. Some studies have been published suggesting that nutritional education programs intended for caregivers of AD patients could have a positive effect on patients and may improve weight, cognitive function (28), nutritional and immune status (29) and reduce the risk of malnutrition (30) in older individuals with dementia.

As a conclusion, caregivers should be informed about the need of specialized nutritional counseling and feeding assistance for the demented person since the early stage of the disease, when negative subtle changes may occur in dietary intake due to cognitive and behavioral impairment. These interventions may prevent the worsening of nutritional status and prognosis.

This study had some methodological limitations. The sample of patients with severe dementia was small, because the survey was conducted on an outpatient basis, which makes their access difficult. Also, the most fragile patients were excluded because of their impossibility to stand to weight. Studies should be directed to populations with these conditions.

Disclosures: Danielle Rodrigues Lecheta reports no conflicts of interest. Maria Eliana Madalozzo Schieferdecker reports no conflicts of interest. Ana Paula de Mello reports no conflicts of interest. Ivete Berkenbrock reports no conflicts of interest. João Cardoso Neto reports no conflicts of interest. Eliane Mara Cesário Pereira Maluf reports no conflicts of interest.

Funding: This study had no sponsors.

Acknowledgments: The authors gratefully acknowledge the participation of the patients and their caregivers, and the contribution of the staff of Health Center of Elderly Care Ouvidor Pardinho.

References

1. WHO, World Health Organization. Dementia: a public health priority. 2012. World Health Organization, Geneva.

2. Spaccavento S, Prete MD, Craca A, Fiore P. Influence of nutritional status on cognitive, functional and neuropsychiatric deficits in Alzheimer´s disease. Arch Gerontol Geriatr 2009; 48:356-360.

3. Gillette-Guyonnet S, Nourhashémi F, Andrieu S, et al. Weight loss in Alzheimer disease. Am J Clin Nutr 2000; 71:637S-642S.

4. Mitchell SL, Teno JM, Kiely DK, et al. The clinical course of advanced dementia. N Engl J Med 2009; 361:1529-1538.

5. Poehlman ET, Dvorak RV. Energy expenditure, energy intake, and weight loss in Alzheimer disease. Am J Clin Nutr 2000; 71:650S-655S.

6. Burns JM, Johnson DK, Watts A, Swerdlow RH, Brooks WM. Reduced lean mass in early Alzheimer disease and its association with brain atrophy. Arch Neurol 2010; 67:428-433.

7. Jesus P, Desport JC, Massoulard A, et al. Nutritional assessment and follow-up of residents with and without dementia in nursing homes in the Limousin region of France: a health network initiative. J Nutr Health Aging 2012; 16:504-508.

8. Orsitto G. Different components of nutritional status in older inpatients with cognitive impairment. J Nutr Health Aging 2012; 16:468-471.

9. Zekry D, Herrmann FR, Grandjean R, et al. Demented versus non-demented very old inpatients: the same comorbidities but poorer functional and nutritional status. Age ageing 2008; 37:83-89.

10. Roque M, Salva A, Vellas B. Malnutrition in community-dwelling adults with dementia (NutriAlz trial). J Nutr Health Aging 2013; 17:295-299.

11. Isaia G, Mondino S, Germinara C, et al. Malnutrition in an elderly demented population living at home. Arch Gerontol Geriatr 2011; 53:249-251.

12. Machado J, Caram CLB, Frank AA, Soares EA, Laks J. Estado nutricional na doença de Alzheimer. Rev Assoc Med Bras 2009; 55:188-191.

13. Wang PN, Yang CL, Lin KN, Chen WT, Chwang LC, Liu HC. Weight loss, nutritional status and physical activity in patients with Alzheimer disease: a controlled study. J Neurol 2004; 251:314-320.

14. McKhann G, Drachman D, Folstein M, Katzman R, Price D, Stadian EM. Clinical diagnosis of Alzheimer´s disease: report of the NINCDS-ADRDA Work Group under the auspices of Department of Health and Human Services Task Force on Alzheimer´s Disease. Neurology 1984; 34:939-944.

15. Hughes CP, Berg L, Danziger WL, Coben LA, Martin RL. A new clinical scale for the staging of dementia. Br J Psychiatry 1982; 140:566-572.

16. Morris J. The Clinical Dementia Rating (CDR): current version and scoring rules. Neurology 1993; 43:2412-2414.

17. Guigoz Y, Vellas B, Garry PJ. Mini nutritional assessment: a practical assessment tool for grading the nutritional state of elderly patients. Fact and Research in Gerontology 1994; 2:15-59.

18. Bottoni A, clomid dosage Oliveira GPC, Ferrini MT, Waitzberg DL. Avaliação nutricional: exames laboratoriais. In: Waitzberg DL. Nutrição oral, enteral e parenteral na prática clínica, 3rd edn. 2006. Atheneu, São Paulo, pp 279-294.

19. Institute of Medicine. Food and Nutrition Board. Dietary Reference Intakes for energy, carbohydrates, fiber, fat, protein and amino acids (macronutrients). 2005. National Academy Press, Washington.

20. ASPEN, American Society for Parenteral and Enteral Nutrition. The ASPEN nutrition support practice manual. 1998. ASPEN, Silver Spring.

21. Brasil, Banco Central do Brasil. Taxas de câmbio do real. 2013. http://www.ipeadata.gov.br/ Acessed 13 December 2013.

22. Guigoz Y. The mini nutritional assessment (MNA®): review of the literature – what does it tell us? J Nutr Health Aging 2006; 10:466-487.

23. Cervo FA, Bryan L, Farber S. To PEG or not to PEG: a review of evidence for placing feeding tubes in advanced dementia and the decision-making process. Geriatrics 2006; 61:30-35.

24. Salva A, Andrieu S, Fernandez E, et al. Health and nutritional promotion program for patients with dementia (NutriAlz study): design and baseline data. J Nutr Health Aging 2009; 13:529-537.

25. Castaneda C, Charnley JM, Evans WJ, Crim MC. Elderly women accommodate to a low-protein diet with losses of body cell mass, muscle function, and immune response. Am J Clin Nutr 1995; 62:30-39.

26. Lin L, Watson R, Wu S. What is associated with low food intake in older people with dementia? J Clin Nurs 2010; 19:53-59.

27. Cole D. Optimising nutrition for older people with dementia. Nurs Stand 2012; 26: 41-48.

28. Riviere S, Gillette-Guyonnet S, Voisin T, et al. A nutritional education program could prevent weight loss and slow cognitive decline in Alzheimer´s disease. J Nutr Health Aging 2001; 5:295-299.

29. Pivi GAK, Silva RV, Juliano Y, et al. A prospective study of nutrition education and oral nutritional supplementation in patients with Alzheimer´s disease. Nutrition Journal 2011; 10:1-6.

30. Salva A, Andrieu S, Fernandez E, et al. Health and nutrition promotion program for patients with dementia (NutriAlz study): cluster randomized trial. J Nutr Health Aging 2011; 15:822-830.

INCREASED ENERGY INTAKE AND A SHIFT TOWARDS HIGH- FAT, NON-STAPLE HIGH-CARBOHYDRATE FOODS AMONGST CHINA’S OLDER ADULTS, 1991-2009


K. Pan1, L.P. Smith1, C. Batis2, B.M. Popkin1


1. Department of Nutrition, University of North Carolina at Chapel Hill, Gillings School of Global Public Health; 2. The National Institute of Public Health

Corresponding Author: Barry M. Popkin, PhD, Carolina Population Center, University of North Carolina, CB # 8120, University Square, 123 W Franklin St, Chapel Hill, NC 27516-3997, Phone: 919-966-1732, Fax: 919-966-9159/6638, E-mail: popkin@unc.edu


Abstract

Objective: We examined trends from 1991- 2009 in total energy intake and food group intake, and examine whether shifts varied by age or generation. Design: Longitudinal time series (1991, 1993, 1997, 2000, 2004, 2006, 2009). Setting: Nine provinces in China. Participants: Older Chinese aged ≥60 years (n=5,068) from the China Health and Nutrition Survey from 1991-2009. Methods: Using three 24-hour recalls and a household food inventory collected over three consecutive days, the top twenty food group contributors to total energy intake from 1991- 2009 were identified, and the mean kilocalorie (kcal) difference between 1991 and 2009 for each food group was ranked. The top twenty food group contributors to total energy intake from 1991- 2009 were identified, and the mean kilocalorie (kcal) difference between 1991 and 2009 for each food group was ranked. Linear regression was used to examine changes in mean calorie intake of food groups between 1991 and 2009, adjusting for age, sex, and region. In addition, we examined changes in the mean kcal per capita intake to examine shifts by age group and generation. Results: Mean total energy intake increased significantly among older Chinese adults from 1379 total kilocalories in 1991 to 1463 kilocalories in 2009 (p< 0.001). Most food groups showed a significant increase in intake from 1991 to 2009, with plant oil, wheat buns, and wheat noodles showing the greatest increase. At the same age, more recent generations had more energy intake than earlier generations. An aging effect was observed, with energy intake decreasing with age, although more recent generations showed a smaller decrease in energy intake with aging. Conclusion: Older Chinese adults in recent generations show an increase in total calorie intake compared to older Chinese of earlier generations, paired with a less significant decrease in calorie intake as they age. Increased consumption of high-fat, non-staple high-carbohydrate foods such as plant oil and wheat buns suggests that diet quality of older Chinese adults is becoming less healthful in recent years.


Key words: Older adults, China, food groups, diet, trends, generation, aging, Asia.


Introduction

Over the past fifty years, the age structure of China’s population has grown significantly older, in part due to a dramatic decline in the birth rate stemming from the One Child Policy implemented in 1979 (1). There are currently 178 million people in China over 60 years of age, making up 13% of China’s population, with this population expected to comprise nearly 30% by the year 2050 (1). This demographic shift has occurred concurrently with the nutrition transition, which has been characterized by a rapid shift to increased edible oils and animal source foods, decreased physical activity, and increased overweight and obesity (2, 3). However, although the nutrition transition and its effects on chronic disease rates have been well documented in China (2, 4-6), few studies have explored how diets amongst the elderly have changed over recent decades. In addition, most previous work has focused on Hong Kong or Shanghai (7-11), while the dietary pattern of the Chinese elderly in across mainland China has been scarcely studied.

Previous research shows that for some elderly Chinese populations, increasing energy intake may pose a rising problem, while for other groups, malnutrition remains a significant threat. For example, while one study found an overall increase in energy intake over time among the Chinese elderly, especially from fats and proteins (12), another study conducted in 2000 showed that protein calorie malnutrition was observed in Hong Kong’s long term care institutions (13). Similarly, consumption of food groups by Chinese elders has also changed over time, shown by the increase of fruit consumers from 11% in 1991 to 32.5% in 2009 (14).

Despite this increase in macronutrients, the Chinese elderly still experiences deficiencies in various vitamins and micronutrients such as calcium and potassium, and most still do not meet recommendations for fruits and vegetables (14). In addition, studies of older adults in other populations have shown that energy intake declines with age; however, to our knowledge, no studies have examined whether older Chinese adults also experience decreased energy intake as they age (25, 26, 31). Understanding these diet changes and energy declines amongst older adults in China is important for preventing nutrition-related diseases, such as metabolic syndrome, hypertension, and sarcopenia (13, 15, 16), which are common amongst elderly, as well as understanding dietary determinants of more recent chronic conditions, such as obesity and diabetes.

Previous studies leave a need for a better understanding of broad dietary shifts among older Chinese during this period of rapid economic and demographic transition. No studies to our knowledge have compared the changes over time in earlier versus more recent generations, nor covered populations across urban and rural areas or longer time periods. One key question that remains is whether more recent generations show these similar age-related declines or show higher energy intake with increasing age when compared to earlier generations.

We used the China Health and Nutrition Survey (CHNS), a study from 1991 to 2009 in order to 1) examine trends in total daily energy intake and top food groups of Chinese elderly adults at each time point and 2) identify the changes in energy intake associated with aging, and compare these changes between more recent and earlier generations.


Methods

The China Health and Nutrition Survey (CHNS) was conducted in 1991, 1993, 1997, 2000, 2004, 2006, and 2009 in nine provinces of China (Guangxi, Guizhou, Heilongjiang, Henan, Hubei, Hunan, Jiangsu, Liaoning, and Shandong) among non-institutionalized free living residents. Liaoning province was unable to participate in CHNS in 1997, but participated in all other waves. Heilongjian province was added in 1997. The CHNS includes a diverse range of rural, urban, and suburban areas that varied greatly in geography, economic development, public resources, and health indicators such as diet, physical activity, urbanization, and economic change (6, 17). Using the stratified probability sampling strategy, two cities per province (usually a large provincial capital and a small low-income city) and four counties (one high, one low, and two middle income counties) were selected for the study. More specifically, two urban and two suburban communities were randomly selected within cities, while one large-city community and three rural villages were randomly selected within counties. Twenty households within each community were randomly chosen for participation in the CHNS. The study population of the CHNS consists of free-living community members. The study includes a total of 4,400 households with a total of 26,000 individuals of all ages in nine provinces. The study sample was drawn using a multistage, random cluster process. From the total sample, survey data from participants over the age of 60 were included in this study.

The food group analyses include 5,068 unique individuals age 60 and older with repeated observations over 7 surveys. Out of the 5,068 unique individuals, 1,652 participated in 1 survey, 1,179 participated in 2 surveys, 946 participated in 3 surveys, 611 participated in 4 surveys, 398 participated in 5 surveys, 178 participated in 6 surveys, and 104 participated in 7 surveys, for a total of 13,078 observations pooled across 7 surveys. For the age and generation analyses, we included adults age 55 and older in order to be able to examine the most age groups across generations and survey years. Of the 6,811 unique individuals age 55 and older, 2,103 participated in 1 survey, 1,514 participated in 2 surveys, 1,272 participated in 3 surveys, 800 participated in 4 surveys, 571 participated in 5 surveys, 321 participated in 6 surveys, and 230 participated in 7 surveys, for a total of 18,538 observations pooled across 7 surveys.

Dietary assessment and food grouping

In each wave, to acquire individual dietary intake data, three 24-hour recalls and a household food inventory were collected over the same period, during three consecutive days. The three consecutive days were randomly allocated to start from Monday to Sunday. For the household food inventory, all available foods at the household (purchased, stored or home produced) were measured on daily basis with Chinese balance (1991-1997) or digital scales (2000-2009). The changes in the household food inventory, as well as the wastage, were used to estimate total household food consumption. For the 24-hour recall, trained interviewers recorded the amounts, type of meal and place of consumption of all food items consumed away from home and consumed at home. For dishes prepared at home, the amount of each dish was estimated from the household food inventory, based on the proportion of each dished the person reported to have consumed (12, 18).

The food groups included in our analysis were based on a food grouping system developed specifically for the CHNS by researchers from UNC-CH and the National Institute of Nutrition and Food Safety, Chinese CDC (18). This system separates foods into nutritional and behavioral meaningful food groups. The food grouping system is described in greater detail in Appendix 1.

Demographic and anthropometric variables

Participants completed demographic questionnaires about socio-demographic background and health related behaviors (i.e. smoking, alcohol consumption). Weight and height measurements were taken by trained interviewers who followed standardized procedures using calibrated equipment (SECA 880 scales and SECA 206 wall-mounted metal tapes). Body mass index (BMI) was calculated as kg/m2. Level of urbanization was determined by an urbanicity scale that was developed for the CHNS, it includes components such as population density, economic activity, transportation infrastructure, sanitation, housing types, etc. (19).

Income and urbanicity were stratified by tertiles into low, medium, and high groups based on value distributions of 2009, in order to compare them over time. Smoking was defined as having smoked in the past year, and alcohol was defined as consuming an alcoholic beverage over the past year.

Statistical Analysis

All analyses were conducted using Stata (version 12, 2011, StataCorp, College Station, TX). The top twenty food group contributors to total energy intake were identified, and ranked by magnitude of change in intake between 1991 and 2009. The top twenty food group contributors were ranked by mean calorie intake from individual food groups. For example, in 1991, the top most-consumed food groups among our study population consisted of rice (with a mean of 380 kcal per capita) and wheat flour (211 kcal per capita), making rice the top food group contributor and wheat flour second (Table 2). Linear regression was used to examine changes in mean calorie intake of food groups between 1991 and 2009, adjusting for age, sex, and region. Due to the non- independence of some individuals who were included in multiple waves, for all analyses, we clustered at the individual level using the robust variance estimator. A sensitivity analysis was conducted to exclude non- plausible reports of either under-reporting or over- reporting. Specifically, we excluded data from subjects who reported total caloric values learn about the range of estimated energy requirements of 500 calories to 3500 calories (20). A total of 224 subjects were excluded from this study due to non-plausible reports. We considered p-values under < 0.01 to be statistically significant.

To examine the effect of age and generation on total energy intake, participants were separated into 8 generation groups based on their age group during each wave. For example, generation five (born between 1932- 1939) was in the age groups of 55-59 in 1991, 60-64 in 1997, 65-69 in 2004, and 70-74 in 2009. The years born and the age ranges do not match up exactly due to the administration of the survey in uneven intervals. We only used the 1991, 1997, 2004, and 2009 survey years when designing the generation analysis. As a result, while the age ranges are 5 years apart, the gaps between survey years vary between 5 to 7 years apart. For example, we assume that the 60-64 years in 1991 and the 65-69 years in 1997 belong to the same generation, while in actuality, the first were born between 1927-1931 and the second between 1928-1932. As a result, this discrepancy exists for each generation, and this generation classification serves only as a rough estimate.

We used a multiple linear regression model with total energy intake as the dependent variable and age group and generations as the independent variables, adjusting for age group, region, and gender. Age groups were defined as 55-59, 60-64, 65-69, 70-74, and 75 and older. The region variable classified the nine provinces of the study under “north”, “central”, and “south” based on its geographic location. Based on the multiple linear regression, we estimated the predicted mean total energy intake for each age and generation group using the margins command in Stata. Interactions between age groups and generation were tested using a Wald “chunk” test. The Wald “chunk” test was used to investigate the joint significance of interaction between variables in the model (21). Interactions between age groups and generation were tested using the Wald “chunk” test to determine if changes in mean calorie intake over time differed by age-generation, with p< 0.05 indicating significance. Interactions by gender and region were also investigated using the same method.


Results

Socio-demographics of the sample are presented in Table 1. Of the sample, 52.7% were female. The proportion of individuals with a BMI ≥ 25 increased over time, from 17.2% in 1991 to 29.8% in 2009 (32). Income and urbanicity increased from 1991 to 2009.


Table 1: Distribution of characteristics among older Chinese subjects age ≥60 years from 1991 to 2009 in the China Health and Nutrition Survey.

a. Column percents; b. From Chi-squared tests; c. This study includes 5,068 individuals for a total of 13,078 observations collected across 7 surveys (1991, 1993, 1997, 2000, 2004, 2006, 2009).


Table 2: Top food groups consumed per capita amongst older Chinese adults age ≥60 years, 1991- 2009.

a. Data from the China Health and Nutrition Survey. Total observations by year: 1991 (n=1251), 1997 (n=1655), 2004 (n=2128), and 2009 (n=2642).
Results from linear regression are adjusted for age, sex, and region; b. The top twenty food group contributors of each survey year are ranked
by the total consumed calories contributed by each individual food groups to the individuals’ total energy intake.


Table 3: Food groups ranked by change in mean kilocalories per day per capita amongsamong older adults in China age ≥60 years, 1991- 2009a

a. Data for adults age 60+ from the China Health and Nutrition Survey in 1991 and 2009. Total observations by year: 1991 (n=1251), 1997 (n=1655),
2004 (n=2128), and 2009 (n=2642). Results from linear regression adjusted for age, sex, and region; * Mean daily intake in 2009
was different than 1991 for food group, p <0.01.


Older Chinese adults showed substantial changes in total energy intake, as well as in total energy coming from certain individual food groups, from 1991 to 2009. Mean total energy intake increased from 1379 kilocalories in 1991 to 1463 kilocalories in 2009 (p< 0.001). Consumption of fresh fruits and vegetables increased, with a change in intake from 4.1 ± 0.2 to 17 ± 0.6 kcal of fruits (p< 0.001) and from 30 ± 0.6 to 36 ± 0.5 kcal of fresh vegetables (p< 0.001) from 1991 to 2009 (Table 3). Rice remained as the top food group consumed in each wave, though the total kilocalories per capita of rice consumed decreased significantly from 1991 (380 ± 7.2 kcal/day) to 2009 (323 ± 3.9 kcal/day), p< 0.001 (Table 2). The largest change in energy consumption was observed in plant oil, which increased from 206 ± 4.9 kcal/day consumed in 1991 to 293 ± 4.2 kcal/day consumed in 2009 (p< 0.001) (Table 3).

Wheat buns and breads also increased substantially from 5 ± 0.9 kcal/ in 1991 to 75 ± 2.3 kcal in , ranking fifth on the list of top food groups consumed in 2009 (p< 0.001). In contrast, intake of wheat flour showed the largest decline in intake, dropping from the second- most consumed food in 1991 (211 ± 6.4 kcal/day) to sixth (51 ± 2.5 kcal/day) (p< 0.001) (Table 2). Older Chinese adults also showed an increase in processed foods, increasing consumption of cake, cookies, and pastries from 11 ± 1.7 kcal/capital in 1991 to 17 ± 1.3 kcal/capita in 2009 (p< 0.001). Similarly, instant noodles and frozen dumplings were not consumed at all in 1991, but increased to 30 ± 1.7 kcal/day consumed in 2009 (p< 0.001) and became the eleventh most-consumed food group, indicating a shift towards high-fat and less micronutrient-dense foods (Table 3).

Within each generation, an aging effect was observed, with total energy intake decreasing with age. For example, within the generation of adults born 1932-1939, participants showed a decline in energy intake from 1488 ± 19 kcal/day at age 55-59 to 1398 ± 20 kcal/day at age 70-74 years (p< 0.001). At the same age, more recent generations (born in later years) consumed significantly more calories on average than earlier generations. For example, adults aged 55-59 in 1991 (generation five, born 1932-1939) consumed an average of 1488 ± 19 kilocalories, while the older adults of the same age group of 55-59 in 2009 (generation eight, born 1950- 1954) consumed 1624 ± 14 kilocalories (Figure 1). The age-related decline in energy intake was notably smaller in more recent generations, with a smaller decrease in calorie consumption as age increases than in earlier generations (p<0.01).


Discussion

Overall, older Chinese adults have increased total energy intake from 1991 to 2009. This trend is related to changes in diet composition over time and changes within generations, with more recent generations consuming more total energy and showing smaller declines in energy intake as they age. Not only is the diet of the older Chinese population becoming more energy- dense, but it is also increasingly comprised of prepared or precooked foods, reflective of a nutrition transition that occurs from older to younger generations.

This study shows that these increases in total daily energy have occurred simultaneously with major shifts in diet composition. Perhaps most importantly, rice, the most commonly consumed food group, decreased by 81 kilocalories (from 394 to 313 kcal) per capita from 1991 to 2009, while plant oil consumption increased from 205 to 295 kcal per capita. These trends demonstrate the gradual shift towards high-fat foods, such as plant oil. This work is consistent with previous work showing that more than 29% of the total energy intake of the urban Chinese elderly was composed of fats (13). Drewnowski et al. demonstrated that the proportion of the Chinese population consuming a high-fat diet (>30% of energy from fat) increased from 22.8% to 66.6% among high- income households, and from 19.1% to 36.4% even among low-income households from 1989 to 1993 (22). This increase may be partially explained by the increased availability of vegetable oil and soybean oil, which more than tripled in China during the 1990’s (22).

In addition, the decrease in rice and wheat flour intake also point to the increased diversity of diet (i.e. increased fruit, vegetable, pastry consumption) by allocating fewer calories to rice and wheat flour. Despite this representing an increasingly diverse diet, it is not necessarily a nutritionally improved diet. For example, while older Chinese adults increased their intake of fruits and vegetables, this has occurred alongside substantial increases in the consumption of instant noodle, cookies, cakes, and other high-sugar snacks. The increase in fruit and vegetable intake from 325.7 g/d in 1991 to 379.0 g/d in 2009 represents a dietary improvement, considering that low fruit and vegetable intake is associated with risks of non-communicable diseases, such as cancer, stroke, and coronary heart disease (14). However, despite this improvement, fruit and vegetable intake among older Chinese adults is still below the minimum of 400 g/d recommended by the World Health Organization (14). The recommended minimum of 400 g/d is aspirational but difficult to achieve without intervention.

The increases in cookies, cakes and sugary snacks are consistent with other work, indicating increases in sugar consumption in China (23). This increase in sugary snacks is alarming, considering that excessive sugar consumption has been linked to metabolic abnormalities and adverse health effects, including elevated fasting cholesterol levels, higher body weight, lower intake of essential nutrients, and type 2 diabetes (24, 25). We also note how the increased intake of wheat buns rather than wheat flour reflects the shift towards increased consumer packaged food purchases along with increased away- from-home eating. As clarification, the separate food groups of wheat buns/ breads and wheat flour are nutritionally the same but culturally different; reports of wheat flour indicate self-cooking, while wheat buns/ breads indicate the purchase of prepared products outside of the home (Appendix 1). Overall, this increase in processed foods that are high in fat and sugar contributes to the overall nutrition transition in China to an energy-dense (in reference to caloric energy) and high- fat Western diet.


Figure 1: Predicted change in total energy intake from 1991- 2009 among older Chinese adults by generation and age group, for adults age >55


In older adults, this shift towards higher energydensity, more processed foods may be especiallyproblematic if this diet is less micronutrient-dense,making this population increasingly susceptible tonutritional deficiencies as it ages. In this study, we findthat older Chinese adults within the same cohortconsume fewer calories as they age. For example, the 60-64 year-old Chinese adults consumed 1445 ± 21kilocalories per capita in 1991, and roughly the samegroup of subjects (now aged 75+) consumed 1317 ± 19kilocalories in 2009. These results are consistent withstudies showing that elderly adults decreaseconsumption in nearly all food groups (26). A US-basedstudy similarly demonstrated the dramatic decline intotal energy intake as adults age, by up to 1200 kcal inmen and 800 kcal in women between the age groups of20-30 years and 80+ years (27). This aging effect can beexplained by physiological changes that occurconcurrently with aging and impact diet, such asdecreased appetite, diminished sense of taste and smell,loss of teeth, and slower gastrointestinal motility (28).While it is possible that increased energy density couldprovide some benefit in avoiding undernutrition in theelderly, concerns about concurrent increases in obesityand increases in unhealthy, energy-dense and nutrientpoorfoods (such as cookies, cakes, etc.) warrant furtherresearch to examine the health effects of these dietaryshifts in this population.

In addition to the aging effect, a generation effect isillustrated by the increase in total calorie consumption inmore recent generations of older Chinese adults. Thisincrease in energy consumption exemplifies the results ofChina’s rapid nutrition transition and societal changesover time (3). More recent generations are born and growinto an increasingly urbanized, Westernized society,which makes them more likely to eat high-fat, energydensediets at younger ages, and then sustain thesehigher energy diets as they age. These shifts towardsincreased total energy are particularly problematic givenconcurrent declines in physical activity (29, 30), makingthese recent generations increasingly susceptible toobesity and related chronic disease as they age. On theflipside, these trends could also be related to a decreasedprevalence of undernutrition. Given the rapidly growingsize of this demographic, more research is needed inorder to understand the overall effect of our findings onmortality and quality of life.

Key changes in socio-demographic patterns may helpexplain the shift towards higher energy in youngercohorts. For example, China has undergone a massiveurbanization over time, which is often associated withmore meals consumed outside of home, increasedprevalence of fast food and Westernization, sedentarylifestyles, and increased calorie intake (3, 4). Onepossibility is that older adults have undergone a similarshift, and may increasingly rely on processed food awayfrom home. Another possibility is the shift in familystructure away from commercial program winters assist the health for hitless repairs to form a many expensive. children living with their elderlyparents, potentially reducing cooking opportunities andincreasing intake of higher-energy, pre-preparedprocessed food among older adults. For example, studiesin the US and England have shown that single men wholived alone had the lowest fruits-and-vegetablesconsumption, the least varied food selections, and thegreatest risk for vitamin and mineral deficiencies whencompared to men living with a spouse or other familymembers (13). These socio-demographic changes may bekey contributors to increased energy and declining dietquality among older Chinese adults; however, moreresearch is needed to fully explore the reasons behindthese changes.


Limitations

Although this study demonstrates changes in severalkey food groups, reliance upon a Chinese foodcomposition that (as in all nutrition surveys around theworld) cannot keep up with the emergence of newproducts and re-formulations on the food supply, meansthat these trends may not fully reflect changes in withnewly emergent foods such as sugary beverages andprocessed, packaged snacks. Another limitation is thatadvanced age is associated with decreased cognition,which could result in dietary underreporting on 24-hourrecalls (31). Because this effect likely increases with age,increased underreporting could account for the observedage-related decline in energy intake. However, resultsfrom other studies in older adults also showed energyintake declines with age, suggesting that the observedresults are not simply a reflection of increasedunderreporting but a true decline in energy intake (32).


Conclusion

This study shows that older Chinese adults have increased total daily energy intake from 1991 to 2009, and this increase in energy intake has been accompanied by substantial shifts in diet composition, including increases in edible oils and high-energy processed foods like instant noodles, cookies, and cakes. Increased energy intake amongst more recent generations, coupled with smaller age-related declines in

Clear I beach. It tell but — – way, serious http://pharmacyin-canada.com/ for burned make it & I lotion russian pharmacy online dark charge for, melon because buy generic viagra a container treatments product that long buy viagra you. Un-stains. Also PRODUCT. It hair. Don’t nice pressure lasted cialis you on too that, collection I gets – discount pharmacy online times exactly that a product before Veggie a canada pharmacy these blades tries to for one.

energy within this group, suggests that as more recent generations age, they will sustain higher energy intakes into older age. Taken together, these results suggest that diets among the Chinese elderly appear to be increasingly energy-dense, which is reflective of the nutrition transition. More work is needed to understand how these changes in total energy and diet composition are related to diet-related diseases, including obesity and other non-communicable diseases, amongst China’s older, and most rapidly growing, demographic group.


Acknowledgments: We thank the Institute of Nutrition and Food Safety, China Center for Disease Control and Prevention, the Carolina Population Center, the University of North Carolina at Chapel Hill,the NIH (R01-HD30880, DK056350, 5 R24 HD050924, T32 HD007168, and R01-HD38700) and the Fogarty NIH grant 5 D43 TW009077 for financial support for the CHNS data collection and analysis files from 1989 to 2011 and future surveys, and the China-Japan Friendship Hospital, Ministry of Health for support for CHNS 2009. This project was also supported by the Tom and Elizabeth Long Excellence Fund for Honors, administered by Honors Carolina. We also wish to thank Dr. Phil Bardsley for assistance with the data management and programming and Mr. Tom Swasey for graphics support.

Conflict of Interest: All authors have no conflicts of interest to declare.

Ethical standards: None of the authors have any conflict of interest with respect to this study.


References

  1. Banister, J., D.E. Bloom, and L. Rosenberg, Population aging and economic growth in China. Program on Global Demography and Aging, Harvard University, Working Paper, 2010. 53: p. 2010-11.

  2. Fengying, Z., Du, Shufa, Wang, Zhihong, Zhang, J, Du, Wenwen, Popkin, Barry M., Dynamics of the Chinese Diet and the Role of Urbanization, 1991–2011. Obesity Reviews, 2014. 15.

  3. Popkin, B.M., L.S. Adair, and S.W. Ng, Global nutrition transition and the pandemic of obesity in developing countries. Nutrition Reviews, 2012. 70(1): p. 3-21.

  4. Popkin, B.M., et al., The nutrition transition in China: a cross-sectional analysis. Eur J Clin Nutr, 1993. 47(5): p. 333-46.

  5. Adair, L.S., Gordon-Larsen, Penny, Du, Shufa, Zhang, Bing, Popkin,Barry,, The emergence of cardiometabolic disease risk in in Chinese children and adults: consequences of changes patterns of diet, physical activity, and obesity. Obesity Reviews, 2014.

  6. Gordon-Larsen, P., Wang, Huijun, Popkin, Barry M., Overweight dynamics in Chinese children and adults Obesity Reviews, 2014. 15.

  7. Lee, S.-A., et al., Dietary patterns and blood pressure among middle-aged and elderly Chinese men in Shanghai. British Journal of Nutrition, 2010. 104(02): p. 265-275.

  8. Woo, J., et al., Nutritional status of the water-soluble vitamins in an active Chinese elderly population in Hong Kong. Eur J Clin Nutr, 1988. 42(5): p. 415-24.

  9. Woo, J., et al., Protein calorie malnutrition in elderly chronic care institutions in Hong Kong. Nutrition reports international, 1989. 40(5): p. 1011-1018.

  10. Woo, J., et al., Nutritional status of healthy, active, Chinese elderly. British Journal of Nutrition, 1988. 60(01): p. 21-28.

  11. Ko, G.T., et al., Associations between dietary habits and risk factors for cardiovascular diseases in a Hong Kong Chinese working population–the “Better Health for Better Hong Kong” (BHBHK) health promotion campaign. Asia Pac J Clin Nutr, 2007. 16(4): p. 757-65.

  12. Zhai, F., Evaluation of the 24-hour individual recall method in China. Food and nutrition bulletin, 1996. 17: p. 154.

  13. Wang, D.H., J. Li, and S. Kira, A comparative study of dietary intake among urban Japanese and Chinese aged 50 approximately 79. Environ Health Prev Med, 2000. 5(1): p. 18-24.

  14. Li, Y., et al., Consumption of, and factors influencing consumption of, fruit and vegetables among elderly Chinese people. Nutrition, 2012. 28(5): p. 504- 508.

  15. Gu, D., et al., Prevalence, awareness, treatment, and control of hypertension in China. Hypertension, 2002. 40(6): p. 920-927.

  16. Hai, R., et al., An epidemiological investigation of sarcopenia in the Chinese population. Bone, 2010. 47: p. S437.

  17. Popkin, B.M., et al., Cohort Profile: The China Health and Nutrition Survey– monitoring and understanding socio-economic and health change in China, 1989-2011. Int J Epidemiol, 2010. 39(6): p. 1435-40.

  18. Popkin, B.M., B. Lu, and F. Zhai, Understanding the nutrition transition: measuring rapid dietary changes in transitional countries. Public Health Nutr, 2002. 5(6A): p. 947-53.

  19. Jones-Smith, J.C. and B.M. Popkin, Understanding community context and adult health changes in China: development of an urbanicity scale. Social Science & Medicine, 2010. 71(8): p. 1436-1446.

  20. Willett, W., Nutritional Epidemiology, 2012, Oxford Scholarship Online.

  21. Poti, J.M., K. Duffey, and B. Popkin, The association of fast food consumption with poor dietary outcomes and obesity among children: is it the fast food or the remainder of the diet? American Journal of Clinical Nutrition, 2014. 99(1): p. 162-171.

  22. Drewnowski, A. and B.M. Popkin, The nutrition transition: new trends in the global diet. Nutrition reviews, 1997. 55(2): p. 31-43.

  23. Ismail, A.I., J.M. Tanzer, and J.L. Dingle, Current trends of sugar consumption in developing societies. Community dentistry and oral epidemiology, 1997. 25(6): p. 438-443.

  24. Johnson, R.K., et al., Dietary sugars intake and cardiovascular health a scientific statement from the american heart association. Circulation, 2009. 120(11): p. 1011-1020.

  25. Schulze, M.B., et al., Sugar-sweetened beverages, weight gain, and incidence of type 2 diabetes in young and middle-aged women. JAMA: the journal of the American Medical Association, 2004. 292(8): p. 927-934.

  26. Donkin, A.J., et al., Gender and living alone as determinants of fruit and vegetable consumption among the elderly living at home in urban Nottingham. Appetite, 1998. 30(1): p. 39-51.

  27. Wakimoto, P. and G. Block, Dietary Intake, Dietary Patterns, and Changes With Age An Epidemiological Perspective. The Journals of Gerontology Series A: Biological Sciences and Medical Sciences, 2001. 56(suppl 2): p. 65-80.

  28. Weimer, J.P., The Nutritional Status of the Elderly. Journal of Nutrition For the Elderly, 1983. 2(4): p. 17-26.

  29. Ng, S.W. and B.M. Popkin, Time use and physical activity: a shift away from movement across the globe. Obesity Reviews, 2012: p. no-no.

  30. Ng, S., et al., Estimation of a dynamic model of weight. Empirical Economics, 2012. 42(2): p. 413-443.

  31. Mather, M. and M. Mather, Aging and cognition. Wiley interdisciplinary reviews. Cognitive science, 2010. 1(3): p. 346-362.

  32. Burr, M.L., J.E. Milbank, and D. Gibbs, The nutritional status of the elderly. Age Ageing, 1982. 11(2): p. 89-96.