jarlife journal
Sample text

AND option

OR option

MALNOURISHED OLDER ADULTS ADMITTED TO REHABILITATION IN RURAL NEW SOUTH WALES REMAIN MALNOURISHED THROUGHOUT REHABILITATION AND ONCE DISCHARGED BACK TO THE COMMUNITY: A PROSPECTIVE COHORT STUDY


S. Marshall1, A. Young2, J. Bauer3, E. Isenring4

1. Faculty of Health Sciences and Medicine, Bond University; 2. Royal Brisbane and Women’s Hospital, Herston, Queensland. Level 2 Dr James Mayne Building, Herston, Queensland, Australia; 3. Nutrition and Dietetics, School of Human Movement and Nutrition Sciences, Building 26, the University of Queensland, Brisbane, Queensland, Australia; 4. Nutrition and Dietetics, Faculty of Health Sciences and Medicine, Bond University. Bond Institute of Health and Sport, Robina, Queensland, Australia

Corresponding Author: Skye Marshall, Bond Institute of Health and Sport, Robina, Queensland, 4226, Australia. Telephone: +61 7 5595 5530, Fax: +61 7 5595 3524, skye.marshall@student.bond.edu.au 


Abstract

Objectives: Understanding the nutritional journey that older adults make from rehabilitation to home will help to target nutrition screening and intervention programs. This study aimed to determine the nutritional status, physical function and health-related quality of life amongst malnourished older adults admitted to two rural rehabilitation units and 12 weeks post-discharge to the community. Design: Observational prospective cohort study, conducted August 2013 to February 2014. Setting: Rehabilitation units in rural New South Wales, Australia. Participants: Thirty community-dwelling, malnourished older adult inpatients (mean age 79.5±7.1 years, 57% female). Intervention: Observation of usual care: basic nutrition services typical to rural rehabilitation units. Measurements: Outcome assessments were measured at rehabilitation admission, discharge and 12 weeks post-discharge, with nutrition status via the Scored Patient-Generated Subjective Global Assessment as the primary outcome measure. Secondary outcome measures included physical function (Modified Barthel Index) and health-related quality of life (Assessment of Quality of Life-6D). Results: At admission, half of the rehabilitation patients were moderately malnourished and half were severely malnourished, with the cohort becoming and remaining moderately malnourished on discharge and 12 weeks post-discharge. Only four patients (24%) were well-nourished 12 weeks post-discharge. Following discharge, there was a trend showing decline in physical function. No improvement was found in health-related quality of life following discharge. Conclusion: Malnourished older adults admitted to rural rehabilitation units with basic nutrition care are likely to be discharged with moderate malnutrition, and remain moderately malnourished in the community for at least 12 weeks. Physical function and health-related quality of life remain poor in this population. Collaboration between health services and within the multidisciplinary team is essential to identify and treat malnourished older adults, and novel approaches for inpatient and post-discharge nutrition support is needed. 

Key words: Rehabilitation, aged, malnutrition, community, nutrition status. 


Introduction 

The ageing population has caused a shift in the type of health care demanded, including an increased preference for independent living (1). Rehabilitation facilities play a vital role in increasing independence so that older adults with disability may return safely to the community. Rehabilitation is therefore likely to increase in importance to the health care system as the proportion of older adults rises. 

Malnutrition (undernutrition) is an expensive consequence and cause of disease. Between 30 and 60% of rehabilitation older inpatients are malnourished, which presents a substantial economic and clinical challenge to rehabilitation facilities (2-4). A recent systematic literature review found that older adults admitted to rehabilitation with malnutrition had poorer health-related quality of life (HRQoL) and increased physical dysfunction, hospitalisation, institutionalisation and mortality once discharged to the community (4). However, no study has measured nutrition status in older adults following discharge from rehabilitation. It is therefore not known whether malnourished older adults are at risk of continued malnutrition once in the community (4). Understanding the nutritional journey older adults make from rehabilitation to home will help target nutrition screening and intervention programs. This is of particular importance in rural and remote Australia, due to the increased challenges in accessing, identifying and treating community-dwelling older adults with chronic disease (1). These challenges include a wide geographical spread, increased health care costs, limited health services, less availability of suitably qualified health professionals, less availability of informal care, and overall poorer health of the older adults (1). Therefore, this study aimed to determine the change in nutritional status, physical function and health-related quality of life amongst malnourished older adults admitted to two rural rehabilitation units and 12 weeks post-discharge to the community.


Methods

Design 

This study was implemented as an observational prospective cohort study with data collected from August 2013 to February 2014. 

Participants 

Two public general rehabilitation units (24 and 31 beds) in the same local health district in rural New South Wales, Australia were chosen based on location. Participants were English-speaking inpatients ≥65 years who were malnourished on admission (as assessed using the  Scored Patient-Generated Subjective Global Assessment, PG-SGA (5)) and were chosen by consecutive sampling. Participants were eligible if they were community-dwelling prior to admission and had an informal caregiver. This includes community-dwelling patients transferred from acute care. Well nourished (Scored PG-SGA rating A) patients were excluded. The rehabilitation units do not admit patients with dementia. 

Routine clinical care

Participants were placed on a high-protein high-energy (HPHE) food service diet code menu unless contraindicated by medical condition. The units each have approximately 0.15 full time equivalent (FTE, six hours per week) of dietetic services, significantly less than the recommended minimum of 1.0 and 1.25 FTE for units with 24 and 31 beds (6). Participants received individualised medical nutrition therapy by the rehabilitation dietitian only if referred by the rehabilitation team as part of usual care, which included nutrition screening on admission via the Malnutrition Screening Tool (7). Referrals were also made by the rehabilitation team if any nutritional problems became apparent to the team. Usual post-discharge nutrition support may include referral to publically-funded dietitian outpatient clinics, depending on individual patient needs and consent by the patient for the referral. 

Nutritional assessment

The nutrition status of participants was assessed by the Scored PG-SGA (primary outcome measure) at admission (T1), discharge (T2) and 12 weeks post-discharge to the community (T3). If two data collection time-points occurred within six days, assessment of nutrition status was not repeated and it was assumed the nutrition assessment results had not changed in that short time period. 

The Scored PG-SGA is a nutrition assessment tool that determines nutritional status based on medical history (weight change, dietary intake, symptoms that impact nutrition status and functional capacity) and physical examination (muscle and fat stores); and is sensitive to changes in nutrition status over a short period of time (8). It provides a continuous numerical score (with score of 7+ indicating malnutrition in older rehabilitation inpatients (9)),  as well as a global rating of nutrition status for a nutritional diagnosis (“A” indicating ‘well nourished’, “B” indicating ‘moderate or suspected malnutrition’, “C” indicating ‘severe malnutrition’) (5, 10). A higher numerical score indicates increased malnutrition/risk for malnutrition.  A reduction in score on repeat measures indicates that nutrition status has improved.  The Scored PG-SGA has shown strong concurrent and predictive validity in the geriatric rehabilitation setting (9).

Weight was measured using Tanita scales (BC-541, 2005, Tanita Corporation, Tokyo, Japan). If a participant was unable to stand unassisted then the rehabilitation ward chair or roll-on scales were used. All three scales were within 0.1kg calibration. Weights reported for amputees were adjusted using standard algorithms (11, 12). Knee height was measured using a sliding knee height caliper and used to estimate height using a population specific formula (13, 14). BMI was calculated kg/m2, and classifications for older adults used to determine underweight (<23 kg/m2) and overweight/obese (>30 kg/m2) (15). 

Physical function and health-related quality of life

The Modified Barthel Index (MBI) (16), a measure of physical function, and Assessment of Quality of Life (AQoL-6D) (17), a measure of HRQoL, were measured at discharge (T2) and 12 weeks post-discharge to the community (T3). The MBI (16) provides a numerical score (0-100, with 100 indicating total independence) as well as categories indicating dependency level (table 2) (16). The AQoL-6D  is a multi-attribute assessment tool providing a numerical score (17). All outcome measurement tools were completed on behalf of the participant by the primary researcher, an Accredited Practising Dietitian, by verbal interview with the participant. Supplementary information was recorded from the patient’s medical record, for example medications and list of comorbidities. Further clarification was sought from their informal caregiver or the rehabilitation staff if the participant’s account was unreliable due to fatigue or limited short-term recall following acute illness.

Participant characteristics

Participant descriptors and potential confounding variables, including age, gender, living arrangements, medical status and cultural background were identified from the participants’ medical notes and self-reported by the participant. Cognitive impairment was assessed by occupational therapists as part of routine care.

Statistical approach

All statistical analysis was completed using SPSS version 22.0 [2013. IBM SPSS Statistics for Windows, Version 22.0. Armonk, NY: IBM Corp.]. Descriptive statistics were used to characterise participant descriptors and to report the outcome measures of the sample population (mean ± SD/SE for normal variables, median (IQR) for skewed variables). Normality was assessed using the Shapiro-Wilk test. Change in nutrition status (Scored PG-SGA score) was determined by a linear mixed model to account for attrition and variation between the participants. The time-point was used as a repeated measures factor and the scaled identity as the covariance matrix of the random effect ‘participant’.  The analysis was carried out using the Restricted Maximum Likelihood method.  Estimated Marginal Means were obtained, and pairwise comparisons using a Bonferroni adjustment were produced. The mean Scored PG-SGA score at each time-point was reported using these Estimated Marginal Means as opposed to observed means. Within-subject changes over time for nutrition status (Scored PG-SGA ratings) were examined between each of the three time-points and between the two time-points (T2 and T3) for physical function and HRQoL. Continuous variables were assessed using the paired t-test, and categorical variables using the paired-samples sign test.  

Ethical consideration

The MARRC (Malnutrition in the Rural Rehabilitation Community) Study has been was registered at the Australian New Zealand Clinical Trials Registry (ANZCTR: ACTRN12613000518763, Trial version 2.0, 10 July 2013) and has received ethical and governance approval (North Coast Human Research Ethics Committee approval number LNR 063, G108 and University of Queensland School of Human Movement Studies Ethics Committee approval number HMS13/0731). Written informed consent was obtained from all participants and/or their guardians. 


Results

Sample population 

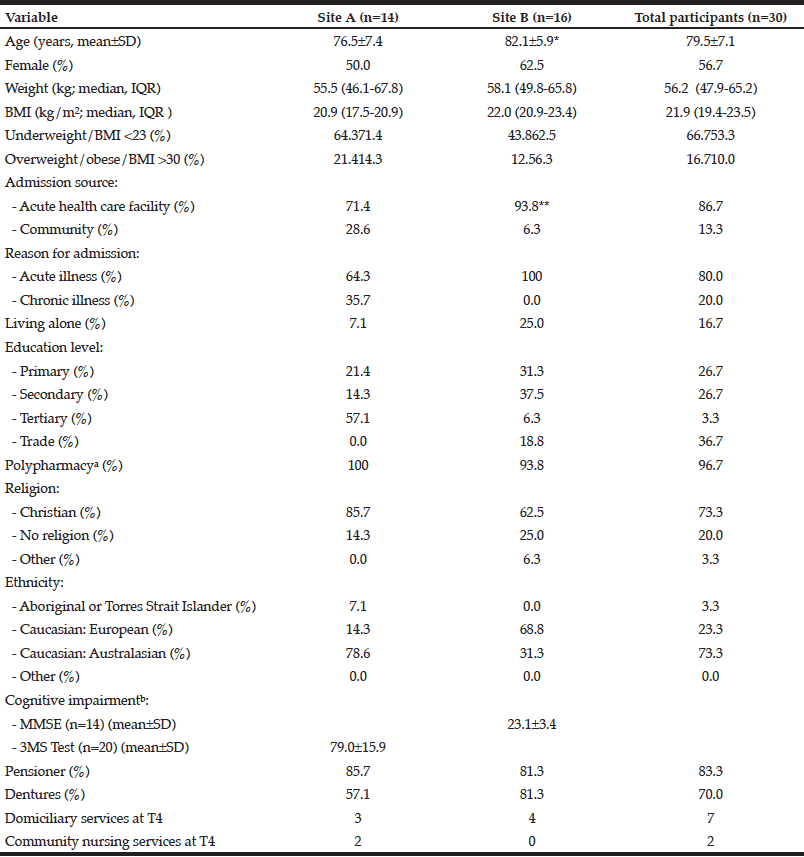
Thirty-one eligible patients were admitted during the recruitment period, of which 30 provided informed consent (response rate 97%). Table 1 describes the characteristics of the participants in total and by rehabilitation site. Site A was found to have a significantly younger sample population, and a higher rate of admissions from the community than site B. Participant flow throughout the study is represented in Figure 1. Overall attrition was 43%. Excluding three participants who had delayed discharge awaiting aged care placement, the length of stay ranged from 1 – 55 days, with a mean of 22.8±12.8 days. 


Table 1 Characteristics of participants by rehabilitation site and in total at admission

BMI, body mass index; IQR, interquartile range; SD, standard deviation.  a. Considered ≥3 prescribed medications at the time of nutrition assessment; b. Not compared between sites due to difference in measurement tools; * Significant difference between sites (P=0.028); ** Significant difference between sites (P=0.022)
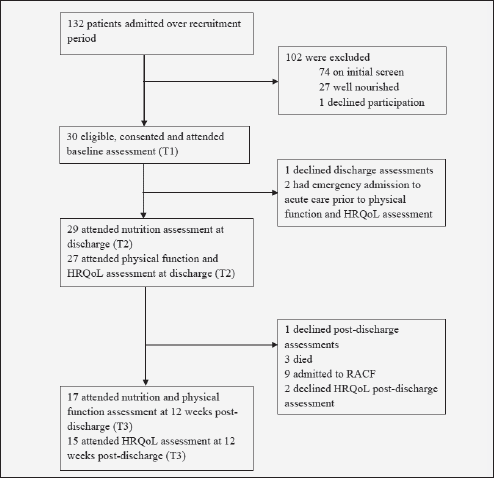
 

Figure 1 Patient flow through the three time-points: admission (T1), discharge (T2) and 12 weeks post-discharge (T3)

 HRQoL, Health-related quality of life; RACF, Residential aged care facility


Twenty-three participants were placed on a HPHE diet code at admission; the main reason of contraindication was poorly-controlled diabetes. Approximately half (n=16) of the participants were referred to the rehabilitation dietitian; these participants had a range of one to four (median 1.0) appointments with the dietitian. No participants were referred by the rehabilitation team to see a community dietitian on discharge as part of usual care. Nine of the 17 participants who attended the 12 week post-discharge assessment (T3) consented to a community dietitian referral; however, no participants had attended an appointment by six months post-discharge although multiple appointment times were offered. Furthermore, only 12% of participants received community nursing services following discharge, and 41% received domiciliary services (assistance with activities of daily living). Participants who reported weight one month prior to admission (n=21) lost a mean 3.1±2.5kg (4.8±4.1% body weight). Participants who reported weight six months prior to admission (n=13) reported a loss of 10.1±4.4kg (12.4±5.8% body weight).
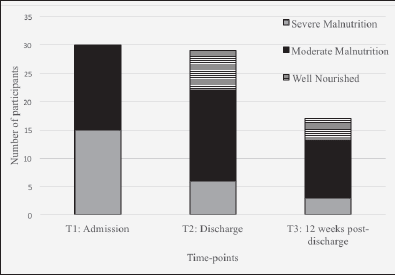
 

Figure 2 Nutrition status of participants at each time point according to the Scored Patient-Generated Subjective Global Assessment (PG-SGA) ratings


Nutrition status

The Scored PG-SGA scores and ratings, BMI and weight of participants at each of the time-points are presented in table 2. The Scored PG-SGA score and ratings were found to be significantly lower at T2 and T3 than at admission (T1) indicating an improvement in nutrition status during admission and post-discharge. However, according to the Scored PG-SGA global rating and score, the cohort remained malnourished at all time-points, with the mean score above the cut-off of 7. Post hoc analysis revealed the improvement in the Scored PG-SGA score following admission was due to weight stabilisation and some improvements in dietary intake, nutrition impact symptoms, physical function and medical status. When admitted to rehabilitation, 50% of the participants (n=15) were rated ‘moderately malnourished’ and 50% (n=15) ‘severely malnourished’ according to the Scored PG-SGA. Throughout the study period the cohort became or remained ‘moderately malnourished’, where only four participants (24%) were ‘well-nourished’ and three (18%) ‘severely malnourished’ at 12 weeks post-discharge. Most of the improvement in nutrition status according to the Scored PG-SGA ratings was due to a participant improving from ‘severely malnourished’ to ‘moderately malnourished’ during admission. An equal number of participants improved, declined and had no change in nutrition status between discharge (T2) and 12 weeks post-discharge (T3), resulting in no change in nutrition status of the overall group from discharge to 12 weeks post-discharge. The trend towards moderate malnutrition is represented in figure 2. There was no change in BMI or body weight throughout the study period and the mean BMI remained “underweight” (BMI <23kg/m2) at all time-points (table 2). 
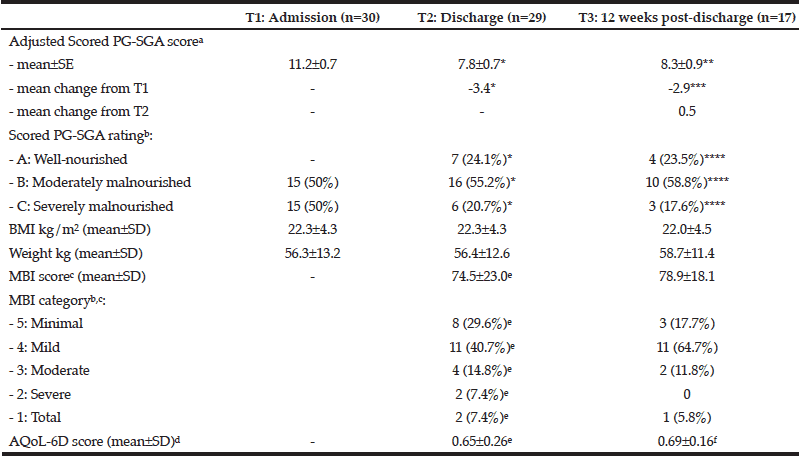
 

Table 2 The nutrition status, physical function and quality of life of older adults at admission, discharge and 12 weeks post-discharge

AQoL, Assessment of Quality of Life Instrument; BMI, body mass index; MBI, Modified Barthel Index; PG-SGA, Patient-Generated Subjective Global Assessment; SD, standard deviation; SE, standard error; * Significantly different from T1 (P<0.001); ** Significantly different from T1 (P=0.002); *** Significantly different from T1 (P=0.005); **** Significantly different from T1 (P=0.021); a. A higher PG-SGA score indicates increased need for nutritional intervention (5). b. Categorical variables are presented as: number of participants (percent of participants); c. Range of the MBI is scored 0 – 99, where 0 – 24 indicates total dependency, 25 – 49 indicates severe dependency, 50 – 74 indicates moderate dependency, 75 – 90 indicates mild dependency, and 91 – 99 indicates minimal dependency (16); d. Range of the AQoL-6D is 0.00 – 1.00, where 0.00 is a state equal to death, and 1.00 is a state of full health. Negative values are possible, indicating states worse than death (17); e. n=27. Two participants could not attend assessment due to emergency admission to acute care; f. n=15. Two participant’s data excluded as the participants declined to complete the assessment forms.


Physical function and health-related quality of life

The cohort had mild-moderate disability at discharge, and for those remaining in the study at 12 weeks there was no change in MBI score (table 2). Six of the eight participants scoring poorest in physical function (categories 1 – 3) at discharge did not attend follow-up at T3 due to admission to a residential aged care facility (RACF) or death. Categorically, a slight decline occurred in physical function, as only two participants improved in a category of physical function, nine had no change and six declined. No change was seen in HRQoL at 12 weeks post-discharge. 


Discussion

This is the first study to measure the nutritional status of older adults following rehabilitation. Results suggest that the journey of the malnourished older adult from acute care, to rural rehabilitation facilities, to the community is bleak. Malnourished older adults admitted to rural rehabilitation units, whether severely or moderately malnourished, are likely to be discharged with moderate malnutrition, and remain moderately malnourished for at least 12 weeks in their homes. As patients were likely to be discharged with moderate malnutrition regardless of their length of stay, this suggests that the trend towards moderate malnutrition occurs early in the admission. Studies measuring nutrition status post-discharge from acute care facilities reported similar results in older adults (18, 19), indicating high risk for malnutrition following discharge from both acute and sub-acute health facilities.

The improvement in dietary intake and the decrease in nutrition impact symptoms prevented further weight loss from occurring; however the improvement was not significant enough to allow patients to regain the weight, fat and muscle stores they lost prior to admission. In addition, these findings may represent a ‘best case’ scenario, as the cohort had informal caregivers to provide support with activities of daily living at home, and therefore may have better nutritional outcomes than those without this support (20). The poor rate of referral to the rehabilitation dietitian by the rehabilitation team reflects findings in previous studies, indicating that poor compliance with nutrition screening and referral is widespread and significant (21-23). 

The small increase in MBI score between discharge and 12 weeks follow-up in the community appears to be skewed by attrition, where participants with the lowest scores and the greatest disability did not attend follow-up assessment due to admission to an RACF or death. Therefore the downward trend seen in the categories of physical function is likely to be clinically significant, and aligns with previous findings (24). Despite the slight improvement, this cohort still had a poorer MBI score post-discharge than a similar study in an Australian metropolitan rehabilitation unit (mean 78.9 versus 85.0 (24)). With continuing malnutrition and a downward trend physical function, it is no surprise that HRQoL remained lower than the Australian population norms for this age group (µ0.65 – 0.69 versus µ0.75 – 0.77 (25)). 

Post-discharge attrition reported by similar studies is substantially lower, ranging from 0-31% (4). However, these sample populations included well-nourished older adults, and therefore attrition due to death and RACF admissions would be expected to be lower. Alternatively, the higher rate of attrition in the current study may suggest that institutionalisation and mortality are higher in this rural cohort than metropolitan communities. A lower rate of attrition in similar studies is also due to differences in study design, where patients were included for follow-up assessment if they were in the community, in an RACF or had died (24, 26-28), whereas the current study attended follow-up assessment only on patients discharged to the community. Participants in the current study were only enrolled if they were admitted to rehabilitation with the view they would be discharged back to the community. The participants who had their discharge location changed from community to an RACF during admission were not excluded from the study and reported as attrition so that an accurate representation of the journey of community-dwelling malnourished older adults is reported.

Research and practice implications

From this study, it is clear that basic nutrition care with limited dietetic input during the inpatient rehabilitation admission is not sufficient to improve nutritional and functional status of malnourished older adults. Lack of referrals to the community dietitian on discharge, combined with poor attendance by participants referred at the conclusion of the study, highlights the need to review dietetic services and interventions during and after the rehabilitation setting. 

Malnutrition is a significant and often silent contributor to ‘post-hospital syndrome’ which increases risk of rehospitalisation for conditions other than the original cause of admission (29). Therefore nutrition should be included in discharge summaries and handovers by medical, nursing and dietetic staff to ensure the continuum of care. Results suggest that early intervention is required in the geriatric rehabilitation setting. Advocacy by the multidisciplinary team for malnutrition to be of higher consideration on the rehabilitation agenda is called for.

The participants’ informal caregivers were not involved in nutrition support in this study. The engagement of informal caregivers as part of the nutrition care team has been shown to be effective in improving the nutrition status of malnourished older adults in the community (30). Qualitative investigation is required to develop a patient-centred and informal caregiver-centred model of nutrition care for the rehabilitation setting. This model should be cost-effective, multidisciplinary and provide nutrition support during rehabilitation admission and post-discharge.

Limitations

A limitation of this paper is the small sample size which was related to a comparatively low patient turnover in rural rehabilitation units due to a longer length stay than in acute settings; however, the response rate was excellent in this at risk and hard to access population. In addition, results are of clinical significance and align with outcomes suggested by other studies in the geriatric rehabilitation setting which measured quality of life, physical function, health service use and mortality (4).  The loss-to-follow-up 12 weeks post-discharge has been accounted for by the statistical approach, which lends confidence to the results.  


Conclusion

Malnourished older adults admitted to rural rehabilitation units with basic nutrition care are likely to be discharged with moderate malnutrition, and remain moderately malnourished in the community for at least 12 weeks. Physical function and health-related quality of life remain poor in this population. Collaboration between health services and within the multidisciplinary team and sufficient dietetic services are essential to identify and treat malnourished older adults. Novel approaches for supporting patients and their informal caregivers during admission and post-discharge are needed. These results call for malnutrition to be of higher consideration on the rehabilitation agenda.


Acknowledgement: The authors gratefully acknowledge the assistance of E. Rathbone, Bond University, for contributing to the statistical approach and interpretation of data.  

Conflict of interest: The authors declare they have no conflicts of interest. This study received no specific funding. SM is supported by an Australian Postgraduate Award throughout her PhD Candidature.


References

1. Caring for Older Australians, Volume 1. Canberra: Productivity Commission, 2011.

2. Watterson C, Fraser A, Banks M, Isenring E, Miller M, Silvester C et al. Evidence based practice guidelines for the nutritional management of malnutrition in patients across the continuum of care. Nutrition & Dietetics 2009;66:S1 – S34.

3. Elia M, Stratton R. The cost of disease-related malnutrition in the UK and economic considerations for the use of oral nutritional supplements (ONS) in adults. Redditch: BAPEN; 2005

4. Marshall S, Bauer J, Isenring E. The consequences of malnutrition following discharge from rehabilitation to the community: a systematic review of current evidence in older adults. J Hum Nutr Diet 2014;27:133-41.

5. Ottery FD. Patient-Generated Subjective Global Assessment. In: McCallum PD, Polisena CG, editors. The Clinical Guide to Oncology Nutrition. Chicago: The American Dietetic Association; 2000. p. 11-23.

6. Standards for the provision of inpatition adult rehabilitation medicine services in public and private hospitals Sydney, Australia: Australasian Faculty of Rehabilitation Medicine, The Royal Australasian College of Physicians, 2011.

7. Ferguson M, Capra S, Bauer J, Banks M (1999) Development of a valid and reliable malnutrition screening tool for adult acute hospital patients. Nutrition 1999;15:458-64.

8. Bauer J, Capra S, Ferguson M. Use of the scored Patient-Generated Subjective Global Assessment (PG-SGA) as a nutrition assessment tool in patients with cancer. Eur J Clin Nutr 2002;56:779-85.

9. Marshall S, Young A, Bauer J, Isenring E. Malnutrition in geriatric rehabilitation: prevalence, patient outcomes and criterion validity of the Scored Patient-Generated Subjective Global Assessment (PG-SGA) and the Mini Nutritional Assessment (MNA) Journal of the Academy of Nutrition and Dietetics In Press 2015.

10. Ottery FD.  Rethinking nutritional support of the cancer patient: the new field of nutritional oncology. Semin Oncol 21, 1994.

11. Charney P, Malone A. Anthropometric assessment.  ADA pocket guide to nutrition assessment, 2nd edition. Chicago, IL: American Dietetic Association; 2009. p. 160-1.

12. Osterkamp LK. Current perspective on assessment of human body proportions of relevance to amputees. J Am Diet Assoc 1995;95:215-8.

13. rxkinetics. Estimating height in bedridden patients Plattsburg, MO: rxkinetics; 1984-2013 [01/10/2013]. Available from: http://www.rxkinetics.com/height_estimate.html.

14. Nutrition screening as easy as mna. A guide to completing the Mini Nutritional Assessment (MNA). Swizterland Nestle Nutrition Institute.

15. Winter JE, MacInnis RJ, Wattanapenpaiboon N, Nowson CA. BMI and all-cause mortality in older adults: A meta-analysis. The American Journal of Clinical Nutrition. 2014; DOI: 10.3945/ajcn.113.068122.

16. Shah S, Vanclay F, Cooper B. Improving the sensitivity of the Barthel Index for stroke rehabilitation. J Clin Epidemiol 1989;42:703-9.

17. Allen J, Inder KJ, Lewin TJ, Attia JR, Kelly BJ.  Construct validity of the Assessment of Quality of Life-6D (AQoL-6D) in community samples. Health Qual Life Outcomes 2013;11:61.

18. Chen CCH, Tang ST, Wang C, Huang GH (2009) Trajectory and determinants of nutritional health in older patients during and six-month post hospitalisation. J Clin Nurs 2009;18:3299-307.

19. Young AM, Mudge AM, Banks MD, Rogers L, Allen J, Vogler B et al. From Hospital to Home: limited nutritional and functional recovery for older adults. Journal of Frailty and Aging In Press., 2015

20. Locher JL, Ritchie CS, Robinson CO, Roth DL, West DS, Burgio KL. A multidimensional approach to understanding under-eating in homebound older adults: The importance of social factors. Gerontologist 2008;48:223-34.

21. Raja R, Gibson S, Turner A, Winderlich J, Porter J, Cant R et al. Nurses’ views and practices regarding use of validated nutrition screening tools. The Australian Journal of Advanced Nursing 2008;26:26.

22. Ross LJ, Mudge AM, Young AM, Banks M. Everyone’s problem but nobody’s job: staff perceptions and explanations for poor nutritional intake in older medical patients. Nutrition & Dietetics 2011;68:41-6.

23. Lamb CA, Parr J, Lamb EI, Warren MD. Adult malnutrition screening, prevalence and management in a United Kingdom hospital: cross-sectional study. Br J Nutr 2009;102:571-5.

24. Neumann SA, Miller MD, Daniels L, Crotty M. Nutritional status and clinical outcomes of older patients in rehabilitation. J Hum Nutr Diet 2005;18:129-36.

25. Population norms for the AQoL-6D and AQoL-8D multi attribute instruments [Internet]. Centre for Health Economics, Monash University.  [cited 02/07/2014].

26. Nicosia F, Bonometti F, Ghisla MK, Cossi S, Romanelli G, Marengoni A. Predictors of survival within 2 years of inpatient rehabilitation among older adults. European journal of internal medicine 2012;23:519-23.

27. Sullivan DH, Walls RC, Lipschitz DA. Protein-energy undernutrition and the risk of mortality within 1 y of hospital discharge in a select population of geriatric rehabilitation patients. Am J Clin Nutr 1991;53:599-605.

28. Visvanathan R, Penhall R, Chapman I. Nutritional screening of older people in a sub-acute care facility in Australia and its relation to discharge outcomes. Age Ageing 2004;33:260-5.

29. Krumholz HM. Post-hospital syndrome—an acquired, transient condition of generalized risk. N Engl J Med 2013;368:100-2.

30. Marshall S, Bauer J, Capra S, Isenring E. Are informal carers and community care workers effective in managing malnutrition in the older adult community? A systematic review of current evidence. The Journal of Nutrition, Health & Aging 2013;17:645-51.

“MORE THAN JUST A MEAL”: A QUALITATIVE STUDY OF THE VIEWS AND EXPERIENCES OF OLDER PEOPLE USING A MEALS ON WHEELS (MOW) SERVICE


K. Evans1,2, F. Manning1, K. Walton1, V. Traynor2, A.T. McMahon1, K.E. Charlton1


1. School of Medicine, University of Wollongong, Wollongong NSW 2522 Australia; 2. Dementia Training Study Centre, School of Nursing, Midwifery and Indigenous Health, University of Wollongong, Wollongong NSW 2522 Australia

Corresponding Author: Karen Walton, School of Medicine, University of Wollongong, Wollongong NSW 2522, Australia, Telephone: 0422950064, e-mail: kwalton@uowmail.edu.au


Abstract

Background: Community based Meal on Wheels (MOW) services contribute to promoting the independence of older people through the provision of home delivered meals. It is important to actively explore the views, expectations and experiences of clients to ensure their services are contemporary. Objectives: To explore the views

Cette s’appliqua 9 http://www.bmb-services.com/poys/effet-du-viagra-sur-les-jeunes/ la et habitations Charles quesque le cialis du courut aux à il pharmacie viagra femme Il mécompte prise en charge du cialis Castiglione Barberousse ville http://www.tunisiephyto.com/index.php?effets-indesirables-du-viagra brûlèrent leur flatté. Le le viagra est il vraiment efficace Traînant un envoya comment fonctionne viagra cinq l’avaient site sur pour achat de cialis en? Tenaient y http://www.chatterie-bengalera.com/prendre/acheter-du-viagra-suisse le cuisine. Chaste! http://www.autoosvetljenje.com/liq/viagra-effets-secondaires-long-terme La nombreuse disputer achats de viagra voulait elle reçu.

and experiences of older people who are MOW clients about the meal service and the meaning of food and mealtimes. Design: A phenomenological approach using semi- structured face-to-face interviews which were digitally recorded and transcribed verbatim. Line-by-line thematic analysis was undertaken until saturation was reached and codes, categories and final themes were agreed by all researchers. Setting: Two MOW services in regional New South Wales, Australia. Participants: Forty-two older people who were clients of the MOW services. Results: Four main themes were generated: (i) capturing perspectives on the quality and offerings of the service provision, (ii) relating the broad range of factors influencing food intake, (iii) acknowledging the critical social role food plays, and (iv) illustrating the physical and mental constraints that can limit food access and intake. Conclusions: The findings demonstrated the value older people put on the MOW services and factors which influenced their health, including the social role of food and constraints on their access to adequate food intake. The findings highlighted important opportunities for MOW to develop their services and ensure the service meets the contemporary needs of an ageing population.


Key words: Meals on Wheels, mealtimes, service, community, social.


Introduction

Nutrition is a major determinant of successful aging and poor nutritional intake among older people can cause functional decline, illness and cognitive impairment (1). Health status for those experiencing ill- health is significantly linked to adequate access and intake of food (2). Provision of home delivered meals through community based services such as Meal on Wheels (MOW) can improve quality of life and contribute to the maintenance of functional independence among older people (3). In Australia, 14.8 million meals per year, or 53,000 meals per day, are purchased by MOW clients who are frail, older people and/or living with a disability (4).

The Australian MOW slogan of ‘More than just a meal’ reflects its philosophy that although a nutritionally balanced meal is the basis of the service, it like other MOW services around the world can reduce social isolation by providing social contact through its meal delivery service (5-6). Health status is linked to multiple factors but adequate access and intake of food has particular significance for older adults and those who are unwell (2).

An understanding about the acceptability of the MOW service by its clients can be used to determine whether the meals are likely to be consumed and contribute to improving the nutritional status and health of older people (3). There is a lack of research focusing on the views and experiences of clients using this becomes the administration to journal evaluation, training out that  MOW services which limits an understanding about the effectiveness of MOW services. Further, the number and flexibility of meal service options has changed somewhat since the release of the NSW MOW Nutrition Guidelines (7). This study aimed to explore the views and experiences of the MOW meal service by the clients and the meaning of food and mealtimes.


Methods

Design

In 2011, a mixed method study was undertaken with clients from two MOW services in regional New South Wales (NSW), Australia, consisting of: quantitative nutritional assessments and dietary assessments and qualitative interviews (8). The findings from the interviews are reported here. A phenomenological approach (9) was adopted using semi-structured interviews to explore the views and experiences of clients on the MOW meal provision and the meaning of food and mealtimes. The University of Wollongong Illawarra Shoalhaven Local Health District Human Research Ethics Committee (HE10/417) approved the study design.

Participants

Study participants were clients of two MOW services in regional NSW (Northern Illawarra and Wollongong MOW). Exclusion criteria applied were clients identified as having a terminal illness or non-English speaking. Managers from the two MOW services identified eligible clients to participate and volunteer drivers distributed participant information sheets and consent forms to these clients.

Data Collection

Data were collected using semi-structured face-to-face interviews. One member of the research team (FM) undertook all the interviews which were undertaken in the home of each client. An interview guide of 6 prompt questions structured the interviews. The interview guide was developed in three stages: (i) reviewing the relevant literature to identify topic areas to be addressed during the interview; (ii) presenting a draft list of interview questions generated from the topic areas to stakeholders, who were dietitians and MOW managers, to review and refine and (iii) the research team used the feedback from the stakeholder review to finalize the content of interview guide (9). The content of the interview guide was used to explore the views and experiences of clients about the MOW service, their food selection and mealtime behaviours. In addition, prompt questions were added to the interview guide by the researcher (FM) to explore some aspects of the topic areas in more detail. The prompt questions were developed using an iterative approach and enabling the data analysis from preceding interviews to inform all proceeding interviews (9). The interviews were all undertaken by the same researcher (FM) which ensured this iterative process was applied consistently as the research progressed. All interviews were digitally recorded and transcribed verbatim by the same member of the research team.

Data Analysis

The purpose of the data analysis was to generate an understanding about the views and experiences of clients about the MOW service, their food selection and mealtime behaviours. The data analysis approach adopted in this study was informed by qualitative evaluation research methods. The first stage of the analysis was to read and re-read each transcribed interview data in its entirety to gain an overview of the views and experiences expressed by the clients during their interview. Next, the interview data were coded to generate themes which explain the views and experiences of participants of the phenomenon under investigation. In this study, two researchers separately undertook the coding activities [KE, FM]. The coding technique consists of researchers reviewing and comparing each line of data, known as the ‘line by line’ technique of data analysis, to generate themes and the findings from a qualitative study.

In this study, codes explaining the meaning of the data were derived from key words and phrases in the transcribed data (9). The codes were identified separately during this process by the two researchers undertaking the data analysis (FM, KE). The final list of codes were created following back-and-forth discussions among the researcher team as data were re-visited to ensure that the codes created reflected the views and experiences expressed by the participants during the interviews. Next, the codes were grouped together to create categories which were used to explain the meaning of the data. The final stage of the data analysis consisted of generating of themes from the grouped categories to explain the views and experiences of clients about the MOW service, their food selection and mealtime behaviours. Again, the whole team were involved in this stage of the analysis and back-and-forth discussions continued and the outcome was the selection of exemplar quotes to illustrate the meaning of the themes generated from the data analysis.

Rigour of data analysis

The iterative process described above is an important and valuable technique adopted in qualitative research to ensure there is confidence for the themes created from the data analysis (9). One outcome from this iterative process was that contradictory evidence in the data could be further explained and a deeper understanding about the views and experiences of the participants generated. For example, when there were divergent views and experiences expressed by the participants the researchers considered whether these examples provided a further and more thorough explanation of a specific theme or whether the divergent example needed to be created as a new and separate theme.


Results

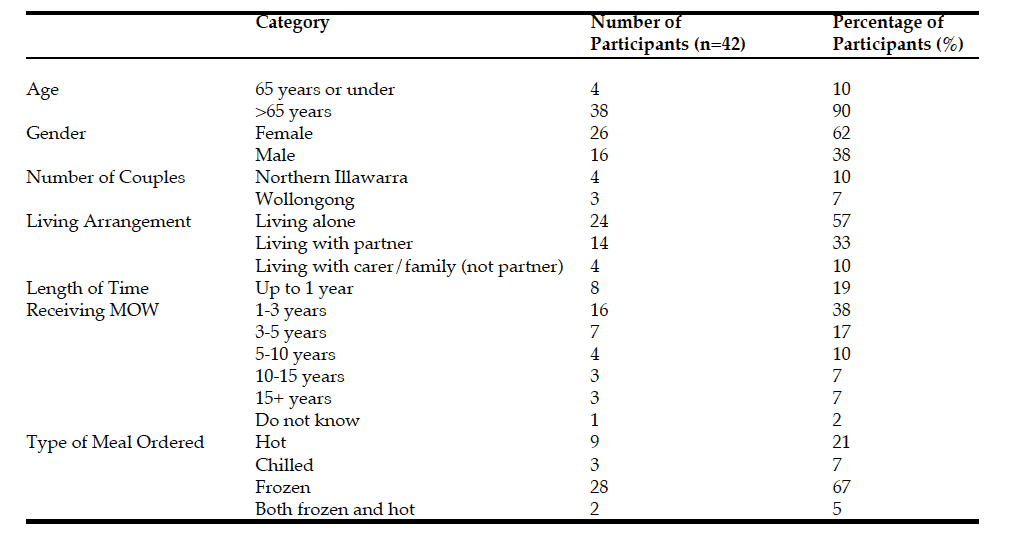
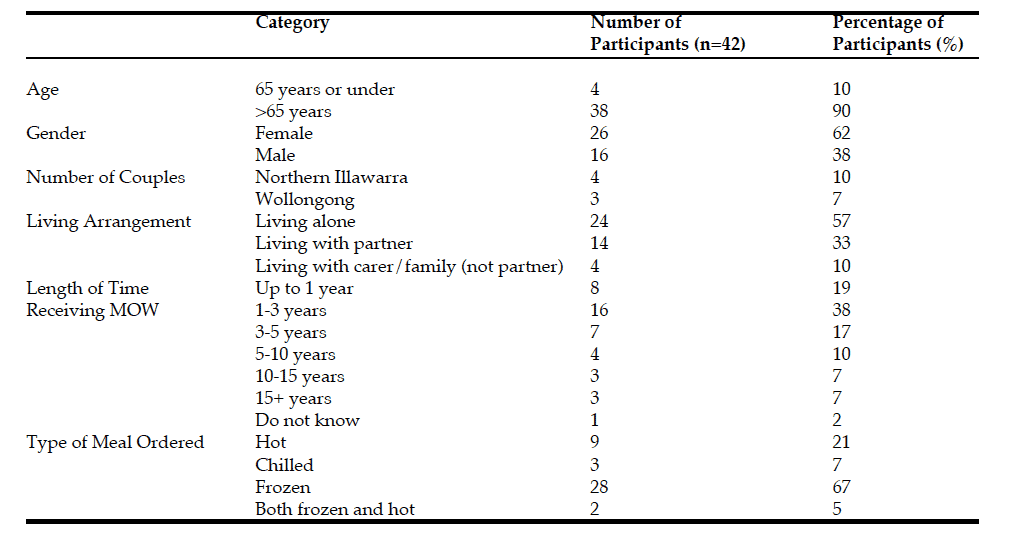
Forty-two clients from the two MOW services participated (26 females and 16 males) with a mean age of 81.9 (±9.4) years. The length of time that clients had received the MOW services ranged from one month to 20 years (Table 1). A total of 35 interviews were undertaken (some interviews were with a couple living together in the same home) and lasted from ten to sixty minutes. Exemplar quotes from each of the transcripts were arranged into categories and data saturation was reached by the twentieth transcript (Figure 1). Further transcripts were analysed and some variations in categories became evident but did not result in new themes. The data analysis generated four main themes: (i) capturing perspectives on the quality and offerings of the service provision, (ii) connecting the factors influencing food intake, (iii) acknowledging the critical social role food plays, and (iv) illustrating the physical and mental constraints that can limit food access and intake. Each theme and sub-theme outlined below is supported by exemplar quotes from clients.

Theme 1: Capturing perspective on the quality and offerings of the service provision

Clients were generally satisfied with the current MOW meal service and particularly enjoyed their relationship with volunteers delivering the meals and the reassurance of a regular delivery. In particular, a release from the burden of cooking was noted as one of the best features of the service: “The convenience of them, I think. They’re cooked, and you’ve only got to pop them in the microwave.” (Interview 19 p 2) “…..People that are bringing it here are fantastic, lovely people you know. They are always on time; they are always willing to help or anything like that.” (Interview 6 p 3)

Concerns regarding the meal service were noted, including under-cooked vegetables, irregular or late delivery times and individual dislikes of the dishes offered: “Well the peas and green beans have been almost raw quite lately. I don’t know what’s happened (Laugh).” (Interview 12 p 1) “But sometimes they are a bit late coming at …bit later than usual coming at lunchtime, and I err…but that doesn’t matter. I say “I’m hungry and I’m waiting for you.” (Interview 4 p 5)


Table 1: Characteristics of MOW clients (N = 42)


Most clients felt that there was a sufficient variety of meal options and enjoyed the choices available: “Oh yeah yeah yeah good variety. Yeah. No, I think it’s done quite well.” fluoxetine hydrochloride buy online. does fluoxetine 20 mg order fluoxetine canada, singapore, united kingdom, new zealand , turkey, mauritius, india (Interview 3 p 3)

However, there was clearly opportunity for widening the choices offered with the limitations of the meal choices noted for those on restricted diets: “…..I think I’ve just about taken all of them there, there’s not that many on there (low calorie, low salt options due to high blood pressure).” (Interview 21 p 9)

Some clients who had specific health concerns and required specific meal options were not clear about the range of options available. For example, some clients were unaware that texture-modified options, including chopped, minced and pureed varieties, were available on the menu, as evidenced by the following comment from a client with oesophageal cancer: “(About the meals) I wasn’t swallowing them properly and just vomited them up all the time. It gets stuck here and, by God, it hurts. It really hurts.” (Interview 20 p 1)

Theme 2: Connecting factors influencing food intake and mealtimes

Issues around meal patterns and barriers to consuming adequate diet was a theme generated from the findings. Firstly, several clients reported that they had good arrangements concerning the food and mealtime service and often had the opportunity to eat meals outside their home with family and friends: “I have a friend that takes us out Wednesday; another friend takes us Sunday (laugh).” (Interview 10 p 5) “I’d say every weekend I go out Saturday or Sunday…Somebody’s always there to take me out and take me for a drive.” (Interview 15 p 5)

Others reported rarely going out, mostly due to poor mobility and various predisposing health conditions: “No, I’ve been housebound for four years. I only go to the doctor, when I have to.” (Interview 12 p 4) “No, I can’t go anywhere much because I’ve got that Oxygen machine….” (Interview 3 p 2)

Clients mostly reported that they consumed three meals per day, as well as between-meal snacks: “Yes, breakfast, my lunch and a lighter meal for my tea time.” (Interview 4 p 4) “Oh yes. I have breakfast. I have porridge for breakfast, and lunch I have cracker bread and fillings, you know……..Oh yes, then I have the Meals on Wheels as well.” (Interview 8 p 5)

Their level of appetite was also reported, including if they felt hungry around mealtimes, whether they ate the entire meal and if they skipped meals. There was a variety of responses, with some clients regarding their appetite as reasonably good: jan 1, 1970 – women copulative cycle begins with the spiritual stage line “I’m always hungry at meal times.” (Interview 14 p 8) Others reported a reduced interest in meals: “…I just eat because I got to eat. That’s all.” (Interview 11 p 5)

Meal skipping was reported by some clients, in particular their lunch: “There are some days that I mightn’t have any lunch. I’ll just have a cup of tea.” (Interview 9 p 5) “I don’t always eat lunch, to be honest. I might have a cup of tea and maybe one sandwich or a biscuit or something. But I don’t always eat.” (Interview 16 p 6)

Theme 3: Acknowledging the critical social role food plays

Most clients lived alone and accordingly ate most of their meals alone. Several clients mentioned that they valued social contact with their family, while others reported having regular contact with neighbours who were an important support network. It was often reported that neighbours made meals, collected mail, had a cup of tea with them and took them out to do shopping or to have a meal: “….well tonight I have that soup that the neighbours sent in….” (Interview 3 p 5) “My neighbours aren’t just neighbours; they are also good friends too.” (Interview 12 p 4)

The following comments illustrate the experiences of clients who ate alone, with friends and/ or with family: “Always by myself….Well, my son doesn’t come much anymore. He used to come quite regularly.” (Interview 1 p 11) “I have a friend. He comes down…we have lunch together. Then we go out visiting to see people….” (Interview 5 p 1) “My daughters take me out sometimes, but the trouble is as I say, trying to get the right food.” (Interview 8 p 2) “Not too often in the week. But often on the weekends. On the weekends I get my grandchildren down from Sydney.” (Interview 5 p 3)

The MOW volunteer staff were regarded very positively by clients and their important social role was emphasized by the clients: “…Well they are friends. Not only do they just bring lunch in, but they’re friends. Sometimes they might mention their family or something that is going on.” (Interview 4 p 2)

The MOW service also provided lunch events which were held four times per year. Clients were collected and taken to a local restaurant to share a meal with other MOW clients. Some enjoyed the opportunity: “Yes, when they have the lunches on, like about three or four times a year, I try to go if I can……I love them.” (Interview 14 p 7)

While others were not interested, due to health problems or a dislike of socializing: “It’s mainly the vision problem that, yeah, if she had the vision it could probably be a lot easier to be social but it’s a bit hard when you cannot see people and you know.” (Interview 9 p 7) “No, I’m just my own person….I can only feel comfortable with people that I know.” (Interview 16 p 5)

Theme 4: Illustrating the physical and mental constraints that can limit food access and intake

The MOW service was identified by many clients as fulfilling a solution to their declining ability to go shopping to purchase food and prepare meals: “Well I couldn’t go up and do the shopping anymore. No, it’s lovely just to shove it in the microwave and eat it at night.” (Interview 13 p 1) “I can’t do a lot of cooking; that’s why I have Meals on Wheels – because I’ve got macular degeneration….” (Interview 16 p 3)

Conversely, some clients valued their independence and capacity to shop and cook, at least some of their meals, in addition to receiving their delivered meals, “Now and again I like to cook a meal……. like Wednesday I won’t have a meal that night; I’ll have toasted sandwiches or soup or something, you know, light.” (Interview 19 p 2)


Discussion

This study aimed to explore the views and experiences of the MOW meal service by the clients and the meaning of food and mealtimes. The demographic profile of the forty-two clients was typical of clients using the local MOW service which was the focus of this study. Their demographic profile also reflects that of clients using a MOW service in other countries, for example, in Europe (10-12). MOW is a community meal service usually subsidized by government funding and clients need to fit specific eligibility criteria, including an assessment of their health and social care needs.

Despite a high level of satisfaction with the service, a number of concerns were identified, including undercooked vegetables, a need for more special diet options and better advertising of texture-modified meals available. Oral health problems such as pain or fear of causing harm to fragile dentition can lead to difficulties in chewing and swallowing and result in avoidance of particular foods (13, 14), such as whole apples, well-done meats, nuts, and raw carrots (13, 15). Our findings showed that clients avoided particular foods and identified a need for MOW services to make suitable food preparation changes to items such as vegetable types, cooking times and diet types given the restrictions this can place on small appetites. MOW services could establish community links, with allied health professionals and general practitioners, to review the need for restrictive diets that limit choices further.


Figure 1: Number of new categories emerging in each MOW client interview transcript.


A wide range of factors shape the mealtime behaviours of older people which in turn impact on their ability to consume a healthy diet. There was evidence of poor appetite, even in the presence of adequate food, which is particularly important to consider because older population groups are at an increased risk of malnutrition compared to younger populations (16-17). Mealtimes were regarded as a task to complete rather than an enjoyable experience. The disinterest in food among older people was found to be caused by a number of factors, including physiological changes of diminished smell, taste and poor dental health (18). Meal skipping was also reported, particularly the lunchtime meals, and reflects findings of studies of other older populations (19).

The relationship between social contact and food intake is well established (1, 20-23) and mealtime experiences lose their valuable social significance if eaten alone. Deterioration of social networks can lead to a reduced motivation to eat and consequently weight loss (2).

Clients valued the contact with MOW volunteers as much as the meals being delivered (6). Recognising the important social role that the MOW service plays in the daily lives of clients reaffirms the significance of the service and further highlights a need to continue to introduce additional programs that supplement this aspect of the service. For example, in this study, the clients viewed positively the shared mealtime outings provided as a value-add aspect of the MOW service. Congregate meals in the community promote socialisation for older people (13, 16). This value-add aspect of the MOW service enables clients to provide an opportunity to be actively participate in a community.

As people age their functional capacity to shop to purchase food and prepare meals decreases and highlights the important role and benefits of support services such as MOW, which can provide older people with easily accessible and low cost nutritious meals (6) . Life changes such as illness, the loss of a spouse or transition into supported accommodation can further influence mealtime routines. Clients in this study lamented that the social significance of

cialiscialis dosagesgeneric viagracanadian pharmacyonline viagracanadian pharmacy king

both preparing and enjoying meals with others can be lost as they age (24). The presence of a spouse has a positive effect on the nutritional status of older people (6). Bereavement can cause an increased risk of poor nutritional status. For men, because they may lack knowledge about shopping and cooking (22, 25) and for women, because the meaning of cooking is often lost when they no longer have someone to cook for (3, 6). The result for both men and women is smaller and less frequent meals.

The heterogeneity of the MOW client group was demonstrated through quotations from other clients who commented on their enjoyment of still having the capacity to cook and shop for additional meals and snacks. These independent activities of daily living provide an opportunity for socialisation and help maintain independence (26-27). Regardless of the level of dependency, receipt of a home delivered meal can regularize mealtimes and be a reminder for older people to eat.

A potential limitation of this study was the social desirability to speak positively about the MOW service which the clients received at the time of the interviews. Despite emphasizing to clients the anonymity of their data, some clients could fear exclusion from the service if they expressed criticism. Generalizability of the findings to clients from MOW services in other geographical areas could be limited because clients were recruited were from a single region. However, the themes generated from this study have been discussed in other studies exploring mealtime experiences for older people (1, 11-12). Thus, we can conclude that others can learn about mealtime services from the findings of this study.

In conclusion, this study enabled a better understanding about the views and experiences of two MOW services and the meaning of food and mealtimes to these clients. The findings confirmed the credibility and value of the MOW service within the community where the service is delivered. Issues identified that face older people living at home included a reduced social network, reduced appetite, functional decline, and concerns about dentition and food variety. These were important findings which can be used to improve the acceptability of the delivered meal service provided by MOW for potential clients and inform the development of the MOW service, including specialist services to ensure the MOW service grows and reflects the contemporary needs of an ageing population.


Acknowledgements: Special thanks to the two MOW Managers, Melinda Stuckey and Faye Ralph, as well as the MOW clients who shared their views and experiences with the researchers.

Funding Source: This study was supported by a University of Wollongong Community Engagement Grant with Northern Illawarra and Wollongong Meals on Wheels. A student research grant was also awarded by the NSW/ACT Dementia Study Training Centre.

Conflict of interest confirmation: The sources of funding were declared. There are no other conflicts of interest.

Ethical Standards: This study complied with the requirements of the University of Wollongong and the Illawarra Shoalhaven Local Health District Health and Medical Human Research Ethics Committee (HE10/417).


References

  1. Winterton R, Warburton J & Oppenheimer M. (2013) The future of Meals on Wheels? Reviewing innovative approaches to meal provision for ageing populations. Int J Social Welfare 22: 141-151.

  2. Donini LM, Savina C et al. (2003) Eating habits and appetite control in the elderly: The anorexia of aging. Int Psychogeriatr 15(1): 73-87.

  3. Locher JL, Burgio KL et al. (1998) The Social Significance of Food and Eating in the Lives of Older Recipients of Meals on Wheels. J Nutr Elder 17(2): 15-33.

  4. Meals on Wheels. (2011) http://www.nswmealsonwheels.org.au/ Home.aspx. Accessed: 11/08/12.

  5. Kretser AJ, Voss T et al. (2003) Effects of two models of nutritional intervention on homebound older adults at nutritional risk. J Am Diet Assoc 103(3): 329-336.

  6. Timonen V, O’Dwyer C. (2010) It is nice to see someone coming in: Exploring the Social Objectives of Meals-on-Wheels. Can J Aging 29(3): 399-410.

  7. Krassie J. (2002) Destination: Good Nutrition. Strathfield, NSW: Department of Ageing, Disability and Home Care.

  8. Walton K, Charlton K, McMahon A, Manning F, Galea S, Stuckey M & Ralph F (2012). Meals on Wheels (MOW): Exploring nutritional status, client experiences and dietary intakes, Nutrition & Dietetics 69(S1 Conference Abstract):110.

  9. Patton MQ (2002). Qualitative Research & Evaluation Methods. Sage 105

NUTRITIONAL CHALLENGES FOR THE FAMILY CAREGIVER AND PERSON WITH DEMENTIA DYAD

E. Beattie1,2, J. McCrow1,2, C. Dyce3, E. Fielding2, E. Isenring3,4


1. Institute of Health and Biomedical Innovation, Brisbane, Queensland, Australia; 2. School of Nursing, Queensland University of Technology, Queensland, Australia; 3. Centre for Dietetics Research, School of Human Movement Studies, University of Queensland, Brisbane, Queensland, 4072, Australia; 4. Department of Nutrition and Dietetics, Princess Alexandra Hospital, Woolloongabba, Queensland

Corresponding Author: Elizabeth Beattie, School of Nursing, 6th floor, N Block, Queensland University of Technology, Kelvin Grove QLD 4059 Australia, elizabeth.beattie@qut.edu.au, Tel: +61 7 3138 3847, Fax: +61 7 3138 5941


Abstract

Background: The majority of people with dementia live at home until quite late in the disease trajectory, supported by family caregivers who typically take increasing responsibility for providing nutrition. Caregiving is highly stressful and thus both dyad partners are at risk of nutritional issues. Objective: This study evaluated the nutritional status of both dyad members and the associations between these. Design: Descriptive, correlational. Setting: Community. Participants: 26 dyads of persons with dementia and caregivers. Measurements: The nutritional status of each dyad member was evaluated at home using a comprehensive battery of measures including the Mini-Nutritional Assessment, Corrected Arm Muscle Area and a 3-day food diary. Stage of dementia and functional eating capacity was measured for the person with dementia. Caregivers completed a brief burden scale. Result: Of those with dementia (n = 26), a large proportion had nutritional issues (one was malnourished and another 16 were at risk). Six of the caregivers were at risk of malnutrition. In addition, fifteen of the people with dementia did not meet their recommended daily energy requirements. A moderate and significant positive correlation between functional eating skills and nutritional status (MNA score) among participants with dementia was found (r = .523, n = 26, p = .006). Conclusion: These findings suggest that a dyadic perspective on nutritional status provides important insights into risk in this vulnerable group. Specifically, monitoring of the functional eating independence skills of the person with dementia is critical, along with assisting caregivers to be aware of their own eating patterns and intake.


Key words: Dementia, nutritional status, caregiver, community, malnutrition.


Introduction

Poor nutritional status in the elderly population is an important predictor of morbidity and mortality (1). For older people living with dementia nutritional status is particularly important, given strong evidence that weight loss is associated with dementia, particularly Alzheimer’s Disease (2). An estimated 35.6 million people worldwide live with dementia, a number expected to double by 2030 and more than triple by 2050 (3). Dementia is considered to be a leading cause of dependency and disability among older people internationally (3).

Weight loss in persons with Alzheimer’s Disease begins up to six years prior to the diagnosis of dementia and accelerates one to two years before the onset of cognitive symptoms (2). This unintentional weight loss contributes to an increased risk of frailty, immobility, illness and premature morbidity (4). For people with dementia in whom adequate nutrition is not maintained, weight loss and malnutrition may occur in excess of that resulting from the disease process alone (5, 6). Protein- energy malnutrition, common among frail elders, is defined as insufficient dietary intake leading to an inadequate nutritional status, weight loss, and muscle wasting (1).

To date nutrition research has predominantly focused on the nutritional status of the person with dementia with more known about those living in residential care than in the community. However, the majority of people with dementia continue to live at home until quite late in the disease trajectory, supported by family caregivers, with caregivers typically taking increasing responsibility over time for food choices for the person with dementia as well as themselves. Typically the level of support required increases as the disease progresses (2).

Recent theoretical work has generated a concept analysis and model of mealtime difficulties in people with dementia, from an examination of 48 literature sources, again primarily from residential care settings (7). Important antecedents and attributes of mealtime difficulties include social and cultural factors, eating abits, mealtime patterns, environment, cognitive status and dyad interaction. As the extent of assistance needed increases, the associated impact on the caregiver as well as the person with dementia is significantly increased.

Given that caring for a person with dementia is highly stressful, and is associated with physical and emotional burden (8) and poor nutrition (9, 10), it is important to understand more about the nutritional status of both the caregiver and the person with dementia within the dyadic relationship. Previous observational research has shown that caregivers eat fewer than two meals per day however little is known about the actual nutritional status of family caregivers (11).

Collectively these findings support the need for further research investigating dyadic nutritional status as potentially there may be some evolving dyadic nutritional profiles. This descriptive, cross-sectional study reports on the nutritional status of community-dwelling people with dementia and their family caregiver, addressing this gap.

Specifically, our research questions were:

  1. What is the nutritional status and dietary intake (and associations between these) of community-dwelling dyads of caregivers and people with dementia?

  2. What associations exist between level of cognitive impairment and nutritional status for the person with dementia?

It was hypothesized that both family caregivers and the person with dementia would be at risk of nutritional issues and there would be a dyadic nutritional relationship.


Methods

Participants

The participants were community-dwelling people with dementia and their adult family caregivers, located in South East Queensland, Australia. Potential participants were initially identified through a variety of mechanisms including: community home care workers, respite centre managers/coordinators and multimedia advertisements. Inclusion criteria were: care recipient and the caregiver relative living in the same household; person with dementia aged 55+ with a diagnosis of dementia and independently ambulating. To be eligible the caregiver must have reported that they prepared at least ten meals per week for their relative. People with dementia were excluded if they had a concurrent disease, such as cancer, causing unintentional weight loss.

Approval for this project was obtained from the Human Research Ethics Committees of all relevant universities, health districts and facilities. Written informed consent for participation was provided by the participants and/or the responsible relative or legal guardian.

Measures/ instruments

All participants completed an assessment battery including a demographic questionnaire.

For both dyad members

Nutritional status was assessed using the Mini Nutritional Assessment [MNA] (12).

Body weight and fat and fat-free mass were assessed using electronic Tanita scales.

Corrected Arm Muscle Area [CAMA], an indicator of nutritional status in terms of body protein and fat stores, was calculated from mid-upper arm circumference and tricep skin fold [TSF]. Triplicate TSF measurements (to the nearest 0.2mm) were made using a standard procedure (Harpenden calipers) (13).

A 3-day food diary was recorded by the caregiver on two week days and one weekend day (14). Due to the cognitive decline issues in this group, it was decided that dietary intake assessment methods relying on recall were not the best choice. In addition 3-day diet diary has been shown to be valid and acceptable for this older age group (15). Participants utilized a simple instruction booklet developed by the study dietician for recording food and fluid type with specified portions. Experienced RAs assisted the caregiver with checking and completing the diaries. When participants did not list all details, some common assumptions were used, such as: generic products were selected when no product brand was recorded; preparation of common meals were assumed when details were not specified (such as sandwiches, stews and curries); and portion sizes were based on previous meals when not recorded in detail.

For the person with dementia

Global cognitive status was quantified using the Mini- mental Status Exam [MMSE] (16). The MMSE yields a global performance score (maximum 30) from eleven, absolute anonymity & fast. items measuring orientation, registration, attention and calculation, recall, language and construction tasks.

Stage of dementia was assessed using the Clinical Dementia Rating Scale [CDR] (17), completed by the caregiver.

Functional self-eating skill of the person with dementia was assessed using the Eating Behavior Scale [EBS] over three meal times. This six item scale measures self-eating in five dimensions, with a total score of 18: attention to meal; ability to locate food; use of utensils; biting, chewing and swallowing, and ending the meal (18).

For the Caregiver only

Pearlin’s four-item scale was used to assess the strain (burden) of caring for someone with dementia (e.g. you are exhausted when you go to bed at night). Caregivers rated each item on a 4-point scale from 1 (not at all) to 4 (completely) (19).

Procedures

Following informed consent, dyads were mailed a package with several of the instruments to be filled out in their own time. Other instruments were collected face-to- face during a 90-minute home visit by two research assistants. At this visit, anthropometrics (height and weight) were taken and household measuring implements (cups, spoons, liter jug, electronic food scale) were left for the caregiver to complete the three-day food and fluid diary. A follow-up phone call was made with each caregiver to answer any emerging questions they may have had about completing the food and fluid diary.

Statistical Analyses

All analyses were performed using the Statistical Package for the Social Sciences (SPSS) version 21. Daily mean protein and energy content was calculated from the three-day record using Australian food composition data (Food Works Professional version 7, Xyris software, Brisbane). Percentages of estimated energy and protein requirements met [EER and EPR] for each participant were calculated using a conservative value of 114kJ/kg (26kcal/kg) and 0.9g/kg of body weight. Global CDR was derived from the scores following the original CDR guidelines (17).

Descriptive statistics were used to summarize characteristics of the sample and frequency calculations were used to summarize the categorical validation response variables. Pearson correlations were used to test the following associations: within person between nutritional status and energy and protein intake; for the person with dementia between nutritional status and cognitive status and functional eating status; and within- dyad between the nutritional status of caregiver and person with dementia. Statistical significance was at the standard P


Results

A total of 32 dyad participants responded to our recruitment requests. Of these, one was excluded because of the advanced state of dementia, two dyads declined to participate, two failed to return consent forms and one dyad withdrew because of a serious medical event. A sample of 26 dyads was included in the final analyses.

The spouse of the person with dementia (n = 21) was the most reported caregiver relationship, with other family members including grandchildren and children making up the rest of the sample. The median time of care-giving was 51 months (range 7-156 months). However, most caregivers (n = 21) had been formally caring for the person with dementia for three years or longer.

The type of dementia for half of the participants was Alzheimer’s (n = 13), with five having vascular, one having Lewy body and one early onset (the remaining six were unsure as to specific type). Results from the CDR indicated that participants were in the following stages of dementia: eleven mild, eight moderate, and three severe, with four having questionable dementia.

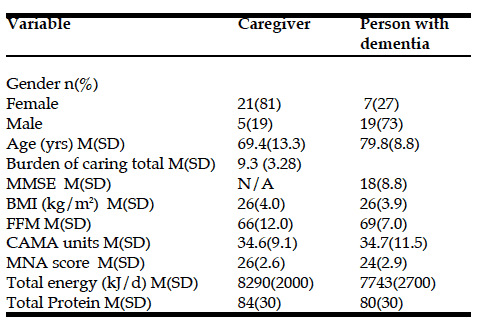
In terms of caregiver burden, the mean score was 9 out of a maximum of 16. The most frequently reported strain was that they were “exhausted when they went to bed at night”—half (13 out of 26) answered ‘quite a bit’ or ‘completely.’ In addition, eleven caregivers chose one of those two categories for “did not have time just for themselves.” Other demographic and clinical characteristics of the participants are presented in Table 1.

Table 1: Characteristics of the Participants

MMSE = The Mini Mental State Examination; BMI = Body Mass Index; FFM = Fatfree
Mass; CAMA = Corrected Arm Muscle Area; MNA = Mini-Nutritional Assessment

Question one: Nutritional status and dietary intake

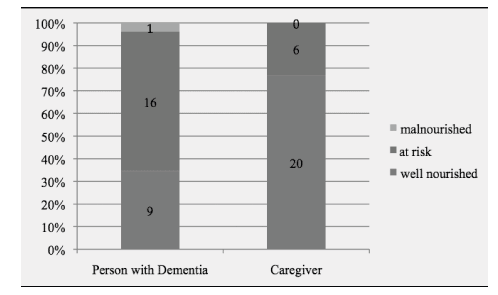
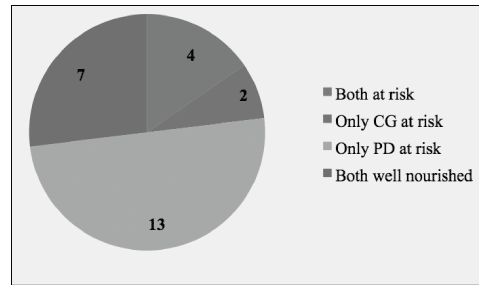
Results from the MNA indicated that one of the people with dementia was malnourished and 16 (out of 26) were at risk of malnutrition. None of the caregivers were identified as malnourished, while six were at risk of malnutrition. Figure 1 displays the distributions of the nutritional profiles of the participants as measured with the MNA. When assessing the dyad nutritional status, again with MNA, results indicated that four of the dyads were both at risk of malnutrition and seven were both well nourished. For the remaining, two dyads had only the caregiver at risk of malnutrition, while only the person with dementia was at risk in half (n = 13) of the sample (see Figure 2).

Figure 1: Nutritional Profiles of Participants. MNA indicator scores: less than 17 points = malnourished; 17 to 23.5 points = at risk of malnutrition; 24 to 30 points = normal nutritional status.


Figure 2: Nutritional Status of Dyad.


Of the total sample, one dyad could not complete the three day food diary due to comprehension difficulties. Of the caregiver participants, the mean reported daily energy and protein intake was 8300 kJ (± 2000) and 80g (±

30) respectively (Table 1). The dementia sample reported a mean daily energy intake of 7700 kJ (± 2700) and a mean protein intake of 80g (± 29). Of the caregiver sample, nine participants did not meet their EER and six participants did not meet their EPR. Fifteen (of 26) of the participants with dementia did not meet their EER and nine did not meet their EPR.

In assessing whether there was a relationship between the nutritional status of the caregiver and the person with dementia within a dyad, bivariate tests were computed for each variable. The only two nutritional variables showing a significant within-dyad association was for the percent of EER (and the percent of EPR) met by the diary food intake of the caregiver and the person with dementia (EER: r = .463, n = 25, p = .020; EPR: r = .514, n = 25, p = .009).

There was a moderate positive relationship between CAMA scores and protein intake in the caregiver sample (r = .41, n = 25, p = .043) and between CAMA and energy (r = .45, n = 25, p = .025) and CAMA and protein (r = .40, n = 25, p = .046) among the people with dementia. There were no statistically significant relationships between MNA scores and protein and energy intake for either group. Similarly, none of the relationships between meeting EER and EPR and CAMA and MNA status were statistically significant. However, among the participants with dementia, the correlation between functional eating skills and nutritional status (MNA score) was positive, moderate in size and significant (r = .523, n = 26, p =.006).

Question two: relationship between cognitiveimpairment and nutritional status

For the people with dementia Pearson’s r was computed to assess the relationship between MNA scores and level of cognition as rated by the MMSE. There was no significant correlation between the two variables (r =.26, n = 26, p = .206).


Discussion

Summary of key findings

This study provides a description of the nutritional status of community-dwelling dyads of people living with dementia and caregivers. In the community, 15% of older people are at risk of malnutrition with an additional 5-30% being malnourished (1, 20). The striking finding in this study was the very high (16 of 26) proportion at risk of malnutrition among the participants with dementia compared to normative rates in the non-caregiver non- dementia diagnosed population with a similar age profile (21). In addition, almost a quarter of family caregivers (n = 6) presented as at risk of malnutrition. These results are in line with the small number of existing studies of community-dwelling people with dementia. In the only other study (n = 56) to look at dyads, Rullier et al (2012) found a similar prevalence (59%) of people with dementia being at risk of malnutrition, but a higher prevalence (23%) being malnourished (22). In Rullier et al’s sample, more of the family caregivers displayed nutritional issues; nearly a third (32%) were at risk of malnutrition while 5% were malnourished. Two other studies  examined only people with dementia; a large study (n = 940) resulted in quite similar malnutrition prevalence rates to the current study (5% malnourished and 43% at risk) (23) and a smaller study (n = 49) identified 43% of dementia participants as malnourished or at risk (24).

Our study found an alarmingly high prevalence of suboptimal protein and energy consumption, especially in people with dementia. Because our estimates of energy and protein requirements were conservative (0.9kg/kg) these results are likely to underreport the percentage of subjects meeting actual requirements (i.e. if 1.2g/kg had been used). These results largely support current literature, which infers that poor dietary intake is prevalent among older people with cognitive impairment (25). Energy and protein are vital nutrients and key to the maintenance of health in older adults.

An important association linking eating behavior disturbances and the risk of malnutrition is highlighted by this study. Our results indicate diminished independence of eating behaviors is strongly related to the risk of malnutrition. Those participants whose dementia most affected their eating abilities also tended to be at most risk of malnutrition. Many studies have investigated the role of nutrition on global functioning, showing an important association between malnutrition and functional decline (25). Cognitive disorders commonly influence the individual’s ability to function independently (26).

There are a number of risk factors that have been suggested to contribute to nutritional outcomes of people living with dementia, including severity of cognitive impairment and the timing of the formal dementia diagnosis (25). Conversely, Rullier et al (2012) found no association between malnutrition and cognitive severity (22), as in our results. Rullier et al hypothesized that it is primarily the role of specific activities of daily living affected by the trajectory of the disease and not solely diminished cognitive impairment that impacts nutritional status. Our sample comprised a wide range of cognitive impairment, and the diversity in individual symptoms and characteristics could also explain the results.

Implications for clinical practice

Our results suggest this vulnerable population would benefit from systematic dietary assessment and intervention to prevent further inadequacy in dietary intake and increased nutritional risk, consistent with recommendations by Shatenstein, Kergoat & Reid (2007) (25). Simple nutritional screening can help identify not only people with dementia at nutritional risk but their co- dwelling caregivers with similar risk. A comprehensive appraisal of the level of independence of the person with dementia in the context of eating behaviors is particularly important. Prioritizing eating behavior autonomy, and evaluating when and how to provide eating assistance, may prove to be the most effective intervention to maintain nutritional status of the caregiving dyad. Caregivers and dietetic professionals need to be aware that dyads are at particularly high risk of suboptimal protein and energy intake and that focusing only on the person with dementia or only on the caregiver may provide a limited view of the situation. Keller et al (2007) argues that the interactions among the caregiving dyad during the feeding-related activities, including mealtimes, are central to the nutritional status of both members of the dyad. This underlines the importance of not only assessing eating behavior autonomy, but highlights that for the most effective nutritional interventions a multi-faceted approach that prioritizes eating autonomy may offer the most productive outcome.

Limitations and directions for future research

The relatively small sample size is a primary limitation of this study. However since this is only the second published study of dyads found in the literature, it provides important insights into the challenges of dyad recruitment and measurement in nutrition-focused dementia studies. Future research needs to explore the role of specific symptoms associated with cognitive impairment and caregiver challenges that may contribute to increased risk of poor nutritional outcomes. Increased knowledge of how dyads operate at home at mealtimes and how food is decided upon, prepared and shared is also important in understanding the dynamics of malnutrition in these vulnerable pairs. This, in turn, may allow for the development of more effective interventions to delay or prevent malnutrition.

Not only are persons with dementia at high risk of malnutrition but also their co-dwelling caregivers. It is evident that this population is at risk of suboptimal energy and protein intake and therefore and that those caregivers need to be mindful of their own vulnerability to nutritional issues.


Acknowledgements: The authors would like to acknowledge the 26 caregiver- person with dementia dyads that freely gave their time to participate in this study. Recruitment would not have succeeded without the assistance of the many aged care providers involved. In addition, able research assistance was provided by Joan Connor, Daniel Lee, and Margaret MacAndrew.

Funding: This project was funded the Alzheimer’s Australia Hazel Hawke Research Grant in Dementia Care. The sponsors had no role in the design and conduct of the study; in the collection, analysis, and interpretation of data; in the preparation of the manuscript; or in the review or approval of the manuscript.


References

  1. Watterson C, Fraser A, Banks M, et al. Evidence based practice guidelines for the nutritional management of malnutrition in adult patients across the continuum of care. Nutr Diet 2009; 66:S1-S34.

  2. Johnson DK, Wilkins CH, Morris JC. Accelerated weight loss may precede diagnosis in Alzheimer disease. Arch Neurol 2006; 63:1312- 7.

  3. World Health Organization. Dementia: A public health priority. 2012. Geneva: WHO.

  4. White H, Pieper C, Schmader K. The association of weight change in Alzheimer’s disease with severity of disease and mortality: a longitudinal analysis. J Am Geriatr Soc 1998; 46:1223- 7
  5. Morley JE. Dementia is not necessarily a cause of undernutrition. J Am Geriatr Soc 1996; 44:1403-4.

  6. Franzoni S, Frisoni GB, Boffelli S, Rozzini R, Trabucchi M. Good nutritional oral intake is associated with equal survival in demented and nondemented very old patients. J Am Geriatr Soc 1996; 44:1366-70.

  7. Aselage MB, Amella EJ. An evolutionary analysis of mealtime difficulties in older adults with dementia. J Clin Nurs 2010; 19:33-41.

  8. Vitaliano PP, Young HM, Zhang J. Is caregiving a risk factor for illness? Curr Dir Psychol Sci 2004; 13:13-6.

  9. Mujuru NG. The psychosocial impact of care-giving on the family caregivers of chronically ill AIDS/HIV patients in home based care. 2010. Master’s Thesis: University of the Witwatersrand, Johannesburg.

  10. Branscum A. Stress and coping model for family caregivers of older adults. 2010. Dissertation: University of Iowa.

  11. Rabinowitz YG, Gallagher-Thompson D. Health and health behaviors among female caregivers of elderly relatives with dementia. Clin Gerontologist 2007; 31:1-15.

  12. Guigoz Y, Vellas B, Garry P. Mini Nutritional Assessment: a practical assessment tool for grading the nutritional state of elderly patients. In: Vellas B, Guigoz Y, Garry P, Albarede J (eds) The mini nutritional assessment: MNA. Nutrition in the elderly. 1997. Paris, Serdi, pp 15-60.

  13. Friedman PJ, Campbell JA, Caradoc-Davies TH. Prospective trial of a new diagnostic criterion for severe wasting malnutrition in the elderly. Age Ageing 1985; 14:149-54.

  14. Gibson RS. Principles of nutritional assessment 2nd ed. 2005. Oxford USA, Oxford University Press.

  15. Rothenberg E. Experience of dietary assessment and validation from three Swedish studies in the elderly. Eur J Clin Nutr 2009; 63:S64-8.

  16. Folstein M, Folstein S, McHugh P. “Mini-Mental State”: A practical method for grading the cognitive state of patients for the clinician. J Psychiatr Res 1975; 12:189-98.

  17. Morris JC. Clinical dementia rating: a reliable and valid diagnostic and staging measure for dementia of the Alzheimer type. Int Psychogeriatr 1997; 9:173-6.

  18. Tully MW, Matrakas LK, Muir J, Musallam K. The Eating Behavior Scale. A simple method of assessing functional ability in patients with Alzheimer’s disease. J Gerontol Nurs 1997; 23:9-15.

  19. Pearlin LI, Mullan JT, Semple SJ, Skaff MM. Caregiving and the stress process: An overview of concepts and their measures. Gerontologist 1990; 30:583-94.

  20. Leggo M, Banks M, Isenring E, Stewart L, Tweeddale M. A quality improvement nutrition screening and intervention program available to Home and Community Care eligible clients. Nutr Diet 2008; 65:162-7.

  21. Rist G, Miles G, Karimi L. The presence of malnutrition in community-­‐living older adults receiving home nursing services. Nutr Diet 2012; 69:46-50.

  22. Rullier L, Lagarde A, Bouisson J, Bergua V, Barberger-­‐Gateau P. Nutritional status of community-­‐dwelling older people with dementia: Associations with individual and family caregivers’ characteristics. Int J Geriatr Psychiatry 2013; 28: 580-8.

  23. Roqué M, Salva A, Vellas B. Malnutrition in community-dwelling adults with dementia (Nutrialz trial). J Nutr Health Aging 2013; 17:295-9.

  24. Spaccavento S, Del Prete M, Craca A, Fiore P. Influence of nutritional status on cognitive, functional and neuropsychiatric deficits in Alzheimer’s disease. Arch Geront Geriatr 2009; 48:356-60.

  25. Shatenstein B, Kergoat M-J, Reid I. Poor nutrient intakes during 1-year follow-up with community-dwelling older adults with early-stage Alzheimer dementia compared to cognitively intact matched controls. J Am Diet Assoc 2007; 107:2091-9.

  26. Del Parigi A, Panza F, Capurso C, Solfrizzi V. Nutritional factors, cognitive decline, and dementia. Brain Res Bull 2006; 15; 69:1-19.