jarlife journal
Sample text

AND option

OR option

EVALUATE HEALTH-RELATED QUALITY OF LIFE AMONG URBAN ELDERS IN DIFFERENT LIVING ENVIRONMENTS


H. Xing1, W. Yu2, S. Chen1, Y. Sun1, X. He1


1. Dept. of Nursing, School of Medicine-Shaoxing University, Zhejiang Province, China; 2. Institute of Epidemiology, Shaoxing Keqiao District Center for Disease Control and Prevention, Zhejiang Province, China

Corresponding Author: Haiyan Xing, Dept. of Nursing, School of Medicine-Shaoxing University, Zhejiang Province, China, Tel:  +86-575-88346871 Email: petrelx99@163.com 


Abstract

Background: This study aimed to assess and compare the health-related quality of life (HRQOL) in older people who lived with different living mode, including staying at home with spouse or child, staying at home alone and staying in nursing home. Methods: Data were collected by cross-sectional survey in 2013. The sample included 95 elderly people who were staying at home with spouse or child, 43 elderly people at home alone and 93 elderly people in nursing home. Results: The three groups were similar according to gender, education and existence of chronic disease. The univariate analysis showed that physical component summary (PCS) and mental component summary (MCS) scores of HRQOL were lower in those living in nursing home than those living in their own homes. The scores of PCS and MCS for the old elderly people (over 75 years old) were lower compared to the young elderly people (60-74 years old). The scores of PCS and MCS for elderly people who had part or incapacity of self-care ability were lower compared to complete self-care ability. There was a positive correlation between the number of weekly physical exercise and PCS and MCS. The main influential factors for PCS were physical exercise, age and self-care ability, physical exercise also affected MCS based on multiple linear regression analysis. Conclusion: These data suggest that PCS and MCS are not lower in elderly assisted living in nursing home compared to staying at home by multiple statistical analyses. HRQOL may be affected by physical exercise.


Key words: Health-related quality of life, elderly, residential environments, China. 


Introduction 

Health-related quality of life (HRQOL) has been increasingly used in the medical area, from clinical trials and clinical practice to observational studies, and health surveys (1-3). HRQOL is an indicator of disease severity, a lower HRQOL is associated with greater mortality among elderly people with disease, such as coronary disease, heart failure, pulmonary disease and osteoarthritis (4-7). As to elderly people from the general population, HRQOL is also a good indicator of health status (8).

Population aging has become a common concern for social issues around the world. The number of elderly people who were 60 years old and above was more than 202 million in 2013, about accounting for 14.9 percent of the total population in China, based on the 2013 statistical bulletin of social service development (9). China’s elderly population will reach 248 million, about 17% in 2020. In 2050 the severe aging stage will be coming, which the number will reach 437 million, accounting for more than 30% of the Chinese population (10). Shaoxing city located in eastern China, the number of elderly people was more than 857 thousand, accounting for 19.7% of the city’s population in 2012 (11).

Traditionally, most of elderly people relied on their children to live, whether or not having own pension. Recently the mode of life of elderly people changed slowly because of economic development and related policy implement. One-child family policy was introduced in 1979 in China, the “4:2:1” phenomenon which means that couples are solely responsible for the care of one child and four parents has become general family structure in urban after 35 years. The burden of family is too heavy to take good care of elderly, so more and more elderly people tend to live in nursing home.

In this study, the aim was to assess and compare HRQOL in elderly people with different living mode, including staying at home with spouse or child, at home alone and in nursing home. 


Materials and Methods

This cross-sectional study was carried out from July to August 2013 in Shaoxing city of China. The study included participants who were at least 60 years old. One social welfare center or nursing home was surveyed and two communities were drawn up based on simple random sampling. The study population consisted of two groups. The first group consisted of 138 elders living in their private homes (95 elders staying with spouse or child, 43 elders alone). The other group in this study consisted of 93 elderly people living in social welfare center. The center, which is only one in the city, is a public social establishment. Elderly population can live in the health center as long as the cost is paid.

Measure of quality of life

Health-related quality of life was assessed using the SF-36 questionnaire (12). The SF-36 questionnaire is a generic instrument with scores that are based on responses to individual questions (13). It is made up of 36 items that measure the following 8 health dimensions or scales: physical functioning (PF); role-physical (RP); bodily pain (BP); general health (GH); vitality (VT); social functioning (SF); role-emotional (RE) and mental health (MH). On each scale, missing values can be imputed in cases where at least half the constituent items are available. Each scale has a score of 0–100, such that the higher the score indicates the better the HRQOL (8). In addition, the scores of the eight subscales were computed into two summary scores, physical component summary (PCS) and mental component summary score (MCS) (13). The scale has been confirmed to have good reliability and validity and is appropriate for the Chinese elderly population (14).

Statistical analysis

Statistical analyses were performed using SPSS version 18.0 software. The statistical method included the chi-square test, independent-samples t-test, one way ANOVA, and multiple linear regressions.


Results

Data were obtained from 231 older urban adults in Shaoxing. Their sociodemographic characteristics are shown in Table 1. No significant differences in gender, education and chronic disease were found among different living mode. The age of elders staying in nursing home was older than at home (P<0.001). According to a physician’s report, 66.7% of the elderly people had a chronic disease.


Table 1 Properties of older adults in different living environments


There were no significant difference in perceived physical and mental health between gender, education and presence of chronic disease. However, the scores of PCS and MCS for the old elderly people (over 75 years old) were lower compared to the young elderly people (60-74 years old). PCS and MCS for elderly people who had part or incapacity of self-care ability were lower compared to complete self-care ability. There was a positive correlation between the number of weekly physical exercise and PCS and MCS. PCS and MCS for those living in nursing home were lower compared to those living at home (P<0.01 for each comparison). The mean scores of PCS and MCS of elderly population were reported in Table 2.
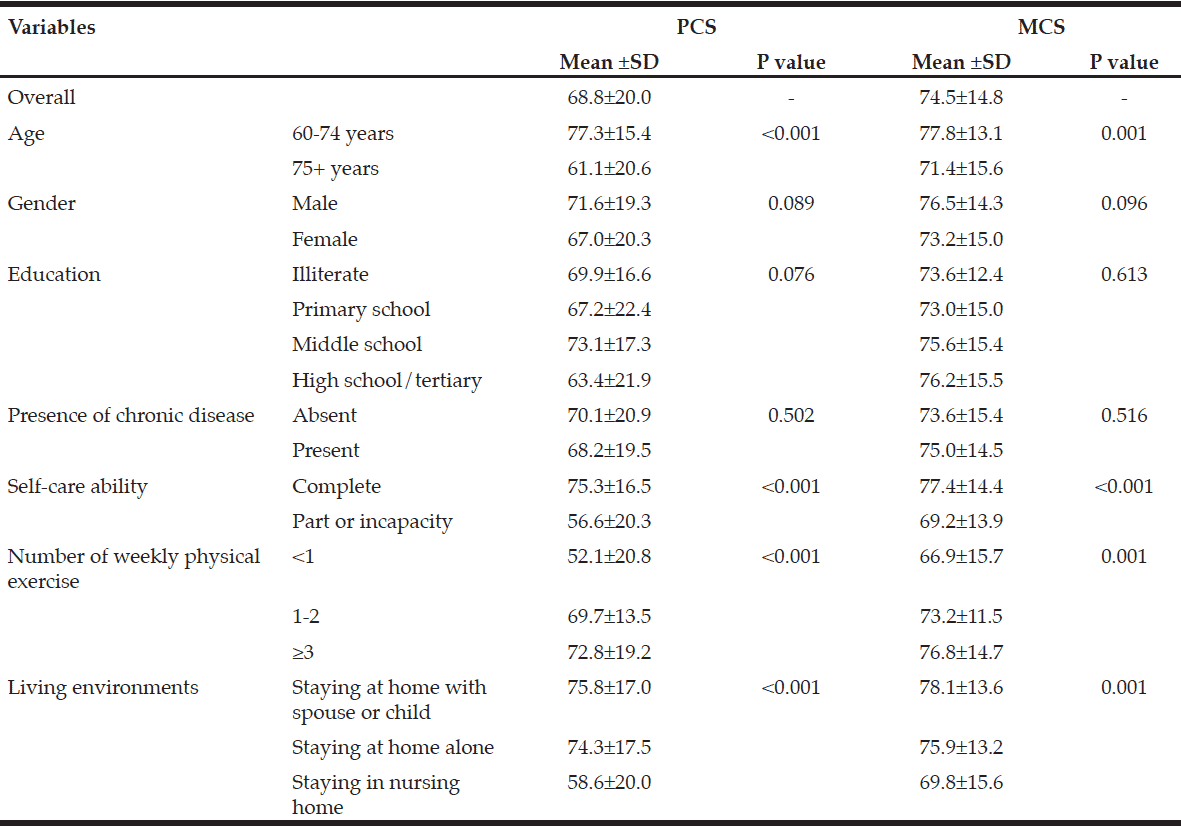
 

Table 2 The distribution of scores to SF-36 according to different variables (mean ± standard deviation)


The main influential factors for PCS were physical exercise, age and self-care ability. Physical exercise also affected MCS. HRQOL was positively influenced by physical exercise in PCS and MCS. PCS were also closely negatively related to the age factor. PCS for those having part or incapacity of self-care ability was lower to those having complete self-care ability (Table 3).


Table 3 Variables associated with HRQOL, revealed by multiple linear regression

β, unstandardized coefficients; Beta, standardized coefficients


Discussion

The SF-36 has generally been used for patients and general people (15-18). Some studies used the SF-36 in ordinary of healthy elderly people to assess quality of life. The SF-36 scale (Chinese version) has been confirmed to be appropriate for the Chinese population (19, 20). The scale has good reliability and validity in measuring the HRQOL of elderly people in China (14).

In this study, the mean age of elders who are staying in nursing home is higher than those who are staying in their own homes (Table 1), the majority of urban elders staying in nursing home were the old elderly people (94.6%). It is possible that the young elderly people are often more healthy and the incidence of chronic disease is lower, so self-care are easier than for the old elderly people. In Shanghai, the characteristics of the aged in nursing home were more of the old elderly people, females, the widowed, illiterates or primarily educated, diseased, and disabled (21). 

Our results based on both univariate and multivariate analyses indicated that the PCS and MCS were related with physical exercise. There was a positive correlation between HRQOL and the number of weekly physical exercise (Table 2, 3). So it showed that regular exercise was not only good for physical health but also beneficial for mental health. Physical activity could reduce the risks of many diseases, and decrease health burdens for both healthy people and patients with chronic diseases. Both men and women with recommended levels of physical activity had a lower risk of cardiovascular diseases, ischemic stroke, diabetes mellitus, and osteoporosis (22, 23). Periodical physical exercise could also improve mood, thereby reduced the incidence of anxiety and depression (24).The amount of physical activity or meeting physical activity recommended levels had positive effects on HRQOL for the general population (23, 25). So the elderly people should promote physical exercise to improve their HRQOL. PCS were also related with self-care ability and age (Table 3), which were similar to previous studies (26, 27).

Though univariate analysis showed that the PCS and MCS were both related living environment, there was no significant difference based on multivariate statistical analysis. The PCS and MCS for those living in nursing home were not lower compared to those living at home (Table 2, 3). Similar study indicated that the score of PF, RP, BP, GH, VT, SF of elderly people for those living in nursing home were lower compared to those living at home by one-way ANOVA, however the results of multivariate analysis were not mentioned (28). 

Under the Chinese traditional conception, the elderly people who lived in nursing home were no children and spouse, and environments and quality of services were not good. Elders had no choices but staying in nursing home. Now this situation was changing. Our results showed that most elderly people were pleased among 93 urban elderly people who stayed in nursing home. About 96.8% elderly people were satisfied for environment and facility, and 93.5% were satisfied for quality served by nursing home. This result was similar to another research which 93.2% of the aged was satisfied in nursing home (29). When elderly people were asked that whether they like the living mode at present, the percent of saying yes was 89.5%, 58.1%, and 91.4% in who staying at home with spouse or child, at home alone and in nursing home respectively. If they could re-choose the living mode, the percent was 40.8%, 14.3% and 44.8% respectively. Compare to the previous, the environment and quality of nursing home have great improvement with economic development. In Shaoxing social welfare center, the staff consists of doctors, nurses, care workers, particularly nursing workers. The center divides into three blocks, including self-care area, referral assistance area and specially protected areas. In self-care area, where healthy elderly live in, the daily diet is provided. In assistant district, where frail elderly live in, diet and medical care is available. In specially protected areas, where bedridden elderly live in, all-weather hand care is provided. Residents have opportunities to read, draw, watch TV, play chess, participate in physical exercise and so on. There are also table tennis room, billiards room, fitness room, physical room, painting room, kinds of sports facilities, outdoor gate stadium, bocce court, supermarket, restaurant and so on. Comprehensive physical and mental health care and rehabilitation are available for those elderly people who need.

With the number of elderly people increasing quickly, the way of living in nursing home will be more and more popular and become the main way of life among elderly people in near future. The contradiction between nursing home without sufficient beds and the demand of the aged will become increasingly prominent. So our government and some social organizations should build and improve more pension institutions to adapt to rapid development of the aging process.

Limitations

The subjects were recruited from the elderly people in one district in China, where is only one social welfare center. So the district-specific bias may have influenced the results and the present findings cannot be generalized to all elders. Influential factors of HRQOL are too many to include all factors in this study, other factors such as social support, economic level and sudden positive or negative events were not mentioned in this research. It is also difficult to determine a causal relationship in a cross-sectional study. 


Conclusions

The univariate analysis results indicate that the scores of PCS and MCS for elderly people who live in nursing home are lower than those people who stay at home. However multivariate statistical analysis results show that quality of life be no significant difference among different living environments. The main influential factors for PCS are number of weekly physical exercise, age and self-care ability. Physical exercise also affects MCS of elderly people. Regular physical exercise is one effective way to improve HRQOL of elderly people.


Ethical Consideration: Ethical issues (such as informed consent, co-authorship, misconduct, conflict of interest, plagiarism, double submission, etc) have been considered carefully by the authors. 

Acknowledgments: This study was supported by grants from Home Theoretical Research Policy Planning Issues of Zhejiang Province (ZMYB201416). 

Conflict of Interest: None


References

1. Valderas, JM., Kotzeva, A., Espallargues M., Guyatt G.,Ferrans CE., Halyard MY. Revicki DA, Symonds T, Parada A, Alonso J. The impact of measuring patient-reported outcomes in clinical practice: A systematic review of the literature. Qual Life Res, 2008;17(2), 179-93.

2. Fryback DG., Dunham NC, Palta M., Hanmer J, Buechner J, Cherepanov D, Herrington SA, Hays RD, Kaplan RM, Ganiats TG, Feeny D, Kind P. US norms for six generic health-related quality-of-life indexes from the National Health Measurement study. Medical Care, 2007;45(12), 1162-70.

3. Palacio-Vieira JA, Villalonga-Olives E, Valderas JM, Espallargues M, Herdman M, Berra S, Alonso J, Rajmil L. Changes in health-related quality of life (HRQoL) in a population-based sample of children and adolescentsafter 3 years of follow-up, Qual Life Res, 2008;17:1207-15

4. Rumsfeld JS, MaWhinney S, McCarthy M Jr, Shroyer AL, VillaNueva CB, O’Brien M, Moritz TE, Henderson WG, Grover FL, Sethi GK, Hammermeister KE. Health-related quality of life as a predictor of mortality following coronary artery bypass graft surgery. Participants of the department of veterans affairs cooperative study group on processes, structures, and outcomes of care in cardiac surgery. JAMA, 1999;281(14), 1298-303

5. Rodriguez-Artalejo F, Guallar-Castillon P, Pascual CR, Otero CM, Montes AO, Garcia AN, Conthe P, Chiva MO, Banegas JR, Herrera MC. Health related quality of life as a predictor of hospital readmission and death among patients with heart failure. Arch Intern Med, 2005;165(11), 1274-9

6. Domingo-Salvany A, Lamarca R, Ferrer M, Garcia-Aymerich J, Alonso J, Félez M, Khalaf A, Marrades RM, Monsó E, Serra-Batlles J, Antó JM. Health-related quality of life and mortality in male patients with chronic obstructive pulmonary disease. Am J Respir Crit Care Med, 2002;166(5), 680-5

7. Singh JA, Nelson DB, Fink HA, Nichol KL. Health-related quality of life predicts future health care utilization and mortality in veterans with self-reported physician-diagnosed arthritis: The veterans arthritis quality of life study. Semin Arthritis Rheu, 2005;34(5), 755-65

8. Otero-Rodrı´guez A, Leo´n-Mun˜oz LM, Balboa-Castillo T, Banegas JR, Rodrı´guez-Artalejo F, Guallar-Castillo´n P). Change in health-related quality of life as a predictor of mortality in the older adults. Qual Life Res, 2010;19:15-23

9. http://www.mca.gov.cn/article/zwgk/mzyw/201406/20140600654488.shtml; accessed June 17,2014

10. http://news.qq.com/a/20091026/001890.htm; accessed October 26, 2009

11. http://roll.sohu.com/20130219/n366446375.shtml; accessed February 19, 2013

12. Ware JE, Snow KK, Kosinski M, Gandet B. SF-36 Health survey manual and interpretation guide. The Health Institute, New England Medical Center, Boston, 1993

13. Zheng Y, Ye DQ, Pan HF, Li WX, Li LH, Li J, Li XP, Xu JH. Influence of social support on health-related quality of life in patients with systemic lupus erythematosus. Clin Rheumatol, 2009;28:265-9

14. Zhou B, Chen K, Wang JF, Wu YY, Zheng WJ, Wang H. Reliability and validity of a Short Form Health Survey Scale(SF-36)-Chinese version used in an elderly population of Zhejiang province in China. Chin J Epidemiol, 2008;29(12):1193-8

15. Ingels JB, Corso PS. The impact of violence on African-American teenagers’ health-related quality of life, as measured by the SF-36, Inj. Prev., 2012;18: A143.

16. Chushkin M, Maliev B, Belevskiy A, Meshcheryakova N, Bukhareva S, Smerdin S. Using SF-36 in assessment of quality of life in patients cured of pulmonary tuberculosis, Eur Respir J, 2011;38: 2591.

17. Ou YY, Pan XX, Wang ZH, Shen PY, Wang WM, Ren H, Zhang W, Chen N. Surveying quality of life in patients with Fabry disease by the SF-36 scale, Chin J Nephrol, 2014;30(3):201-205

18. Zhou B, Chen K, Yu YX, Wang H, Wang JF (2010). Quality of life among the elderly hypertensive population in two areas of Zhejiang province, Chin J Epidemiol, 2010;31(4):474-5

19. Li L, Wang HM, Shen Y. Development and psychometric tests of a Chinese version of the SF-36 Health Survey Scales, Chin J Prev Med, 2002;36(2):109-13

20. Yan Z, Pen AH, Liu FF, Zhang LR, Li XH. Effect evaluation on the quality of life in rural migrant workers by SF-36 scale, Modern Preventive Medicine, 2010;37(10):1900-1, 4

21. Tang JK, Li HY, You JK, Chen LL, Zhao NQ. Countermeasures and suggestion for improving the Life Quality of old people in nursing homes. Chinese General Practice. 2009;12(1A):31-3

22. U.S. Department of Health and Human Services. Physical Activity and Health: A Report of the Surgeon General. Atlanta, GA: U.S. Department of Health and Human Services, Center for Disease Control and Prevention, National Center for Chronic Disease Prevention and Health Promotion, 1996.

23. Morimoto T, Oguma Y , Yamazaki S, Sokejima S, Nakayama T, Fukuhara S. Gender differences in effects of physical activity on quality of life and resource utilization, Qual Life Res, 2006;(15): 537-46

24. Cioffi J, Schmied V, Dahlen H, Mills A, Thornton C, Duff M, Cummings J, Kolt G.S. Physical Activity in Pregnancy: Women’s Perceptions, Practices, and Influencing Factors. J Midwifery Womens Health, 2010;55(5):455-61

25. Vuillemin A, Boini S, Bertrais S, Tessier S, Oppert JM, Hercberg S, Guillemin F, Briançon S. Leisure time physical activity and health-related quality of life, Prev Med. 2005;41(2):562-9.

26. Wang WJ, Liu L, Jiang QC. Application of EQ-5D and SF-12 scales in assessment of the quality of life in patients with diabetes in rural areas in Anhui Province. Chin J Dis Controf Prev. 2013;17(4):287-90

27. Fu Q, Xie JP. Life quality and its influencing factors among the elderly in Shenzhen city. Chin J Public Health. 2010;26(8):1026-7

28. Yin YQ, Long LL, Xia LH.  Influence of diferent endowment patterns on Quality of Life of elderly in rural areas. Occup and Health. 2014;30(6):812-4

29. Han WB, Sun FX. Survey on satisfaction of elderly people in Nicheng community nursing home in Shanghai. Shanghm Journal of Preventive Medicine. 2014;26(4):203-4

INCREASED ENERGY INTAKE AND A SHIFT TOWARDS HIGH- FAT, NON-STAPLE HIGH-CARBOHYDRATE FOODS AMONGST CHINA’S OLDER ADULTS, 1991-2009


K. Pan1, L.P. Smith1, C. Batis2, B.M. Popkin1


1. Department of Nutrition, University of North Carolina at Chapel Hill, Gillings School of Global Public Health; 2. The National Institute of Public Health

Corresponding Author: Barry M. Popkin, PhD, Carolina Population Center, University of North Carolina, CB # 8120, University Square, 123 W Franklin St, Chapel Hill, NC 27516-3997, Phone: 919-966-1732, Fax: 919-966-9159/6638, E-mail: popkin@unc.edu


Abstract

Objective: We examined trends from 1991- 2009 in total energy intake and food group intake, and examine whether shifts varied by age or generation. Design: Longitudinal time series (1991, 1993, 1997, 2000, 2004, 2006, 2009). Setting: Nine provinces in China. Participants: Older Chinese aged ≥60 years (n=5,068) from the China Health and Nutrition Survey from 1991-2009. Methods: Using three 24-hour recalls and a household food inventory collected over three consecutive days, the top twenty food group contributors to total energy intake from 1991- 2009 were identified, and the mean kilocalorie (kcal) difference between 1991 and 2009 for each food group was ranked. The top twenty food group contributors to total energy intake from 1991- 2009 were identified, and the mean kilocalorie (kcal) difference between 1991 and 2009 for each food group was ranked. Linear regression was used to examine changes in mean calorie intake of food groups between 1991 and 2009, adjusting for age, sex, and region. In addition, we examined changes in the mean kcal per capita intake to examine shifts by age group and generation. Results: Mean total energy intake increased significantly among older Chinese adults from 1379 total kilocalories in 1991 to 1463 kilocalories in 2009 (p< 0.001). Most food groups showed a significant increase in intake from 1991 to 2009, with plant oil, wheat buns, and wheat noodles showing the greatest increase. At the same age, more recent generations had more energy intake than earlier generations. An aging effect was observed, with energy intake decreasing with age, although more recent generations showed a smaller decrease in energy intake with aging. Conclusion: Older Chinese adults in recent generations show an increase in total calorie intake compared to older Chinese of earlier generations, paired with a less significant decrease in calorie intake as they age. Increased consumption of high-fat, non-staple high-carbohydrate foods such as plant oil and wheat buns suggests that diet quality of older Chinese adults is becoming less healthful in recent years.


Key words: Older adults, China, food groups, diet, trends, generation, aging, Asia.


Introduction

Over the past fifty years, the age structure of China’s population has grown significantly older, in part due to a dramatic decline in the birth rate stemming from the One Child Policy implemented in 1979 (1). There are currently 178 million people in China over 60 years of age, making up 13% of China’s population, with this population expected to comprise nearly 30% by the year 2050 (1). This demographic shift has occurred concurrently with the nutrition transition, which has been characterized by a rapid shift to increased edible oils and animal source foods, decreased physical activity, and increased overweight and obesity (2, 3). However, although the nutrition transition and its effects on chronic disease rates have been well documented in China (2, 4-6), few studies have explored how diets amongst the elderly have changed over recent decades. In addition, most previous work has focused on Hong Kong or Shanghai (7-11), while the dietary pattern of the Chinese elderly in across mainland China has been scarcely studied.

Previous research shows that for some elderly Chinese populations, increasing energy intake may pose a rising problem, while for other groups, malnutrition remains a significant threat. For example, while one study found an overall increase in energy intake over time among the Chinese elderly, especially from fats and proteins (12), another study conducted in 2000 showed that protein calorie malnutrition was observed in Hong Kong’s long term care institutions (13). Similarly, consumption of food groups by Chinese elders has also changed over time, shown by the increase of fruit consumers from 11% in 1991 to 32.5% in 2009 (14).

Despite this increase in macronutrients, the Chinese elderly still experiences deficiencies in various vitamins and micronutrients such as calcium and potassium, and most still do not meet recommendations for fruits and vegetables (14). In addition, studies of older adults in other populations have shown that energy intake declines with age; however, to our knowledge, no studies have examined whether older Chinese adults also experience decreased energy intake as they age (25, 26, 31). Understanding these diet changes and energy declines amongst older adults in China is important for preventing nutrition-related diseases, such as metabolic syndrome, hypertension, and sarcopenia (13, 15, 16), which are common amongst elderly, as well as understanding dietary determinants of more recent chronic conditions, such as obesity and diabetes.

Previous studies leave a need for a better understanding of broad dietary shifts among older Chinese during this period of rapid economic and demographic transition. No studies to our knowledge have compared the changes over time in earlier versus more recent generations, nor covered populations across urban and rural areas or longer time periods. One key question that remains is whether more recent generations show these similar age-related declines or show higher energy intake with increasing age when compared to earlier generations.

We used the China Health and Nutrition Survey (CHNS), a study from 1991 to 2009 in order to 1) examine trends in total daily energy intake and top food groups of Chinese elderly adults at each time point and 2) identify the changes in energy intake associated with aging, and compare these changes between more recent and earlier generations.


Methods

The China Health and Nutrition Survey (CHNS) was conducted in 1991, 1993, 1997, 2000, 2004, 2006, and 2009 in nine provinces of China (Guangxi, Guizhou, Heilongjiang, Henan, Hubei, Hunan, Jiangsu, Liaoning, and Shandong) among non-institutionalized free living residents. Liaoning province was unable to participate in CHNS in 1997, but participated in all other waves. Heilongjian province was added in 1997. The CHNS includes a diverse range of rural, urban, and suburban areas that varied greatly in geography, economic development, public resources, and health indicators such as diet, physical activity, urbanization, and economic change (6, 17). Using the stratified probability sampling strategy, two cities per province (usually a large provincial capital and a small low-income city) and four counties (one high, one low, and two middle income counties) were selected for the study. More specifically, two urban and two suburban communities were randomly selected within cities, while one large-city community and three rural villages were randomly selected within counties. Twenty households within each community were randomly chosen for participation in the CHNS. The study population of the CHNS consists of free-living community members. The study includes a total of 4,400 households with a total of 26,000 individuals of all ages in nine provinces. The study sample was drawn using a multistage, random cluster process. From the total sample, survey data from participants over the age of 60 were included in this study.

The food group analyses include 5,068 unique individuals age 60 and older with repeated observations over 7 surveys. Out of the 5,068 unique individuals, 1,652 participated in 1 survey, 1,179 participated in 2 surveys, 946 participated in 3 surveys, 611 participated in 4 surveys, 398 participated in 5 surveys, 178 participated in 6 surveys, and 104 participated in 7 surveys, for a total of 13,078 observations pooled across 7 surveys. For the age and generation analyses, we included adults age 55 and older in order to be able to examine the most age groups across generations and survey years. Of the 6,811 unique individuals age 55 and older, 2,103 participated in 1 survey, 1,514 participated in 2 surveys, 1,272 participated in 3 surveys, 800 participated in 4 surveys, 571 participated in 5 surveys, 321 participated in 6 surveys, and 230 participated in 7 surveys, for a total of 18,538 observations pooled across 7 surveys.

Dietary assessment and food grouping

In each wave, to acquire individual dietary intake data, three 24-hour recalls and a household food inventory were collected over the same period, during three consecutive days. The three consecutive days were randomly allocated to start from Monday to Sunday. For the household food inventory, all available foods at the household (purchased, stored or home produced) were measured on daily basis with Chinese balance (1991-1997) or digital scales (2000-2009). The changes in the household food inventory, as well as the wastage, were used to estimate total household food consumption. For the 24-hour recall, trained interviewers recorded the amounts, type of meal and place of consumption of all food items consumed away from home and consumed at home. For dishes prepared at home, the amount of each dish was estimated from the household food inventory, based on the proportion of each dished the person reported to have consumed (12, 18).

The food groups included in our analysis were based on a food grouping system developed specifically for the CHNS by researchers from UNC-CH and the National Institute of Nutrition and Food Safety, Chinese CDC (18). This system separates foods into nutritional and behavioral meaningful food groups. The food grouping system is described in greater detail in Appendix 1.

Demographic and anthropometric variables

Participants completed demographic questionnaires about socio-demographic background and health related behaviors (i.e. smoking, alcohol consumption). Weight and height measurements were taken by trained interviewers who followed standardized procedures using calibrated equipment (SECA 880 scales and SECA 206 wall-mounted metal tapes). Body mass index (BMI) was calculated as kg/m2. Level of urbanization was determined by an urbanicity scale that was developed for the CHNS, it includes components such as population density, economic activity, transportation infrastructure, sanitation, housing types, etc. (19).

Income and urbanicity were stratified by tertiles into low, medium, and high groups based on value distributions of 2009, in order to compare them over time. Smoking was defined as having smoked in the past year, and alcohol was defined as consuming an alcoholic beverage over the past year.

Statistical Analysis

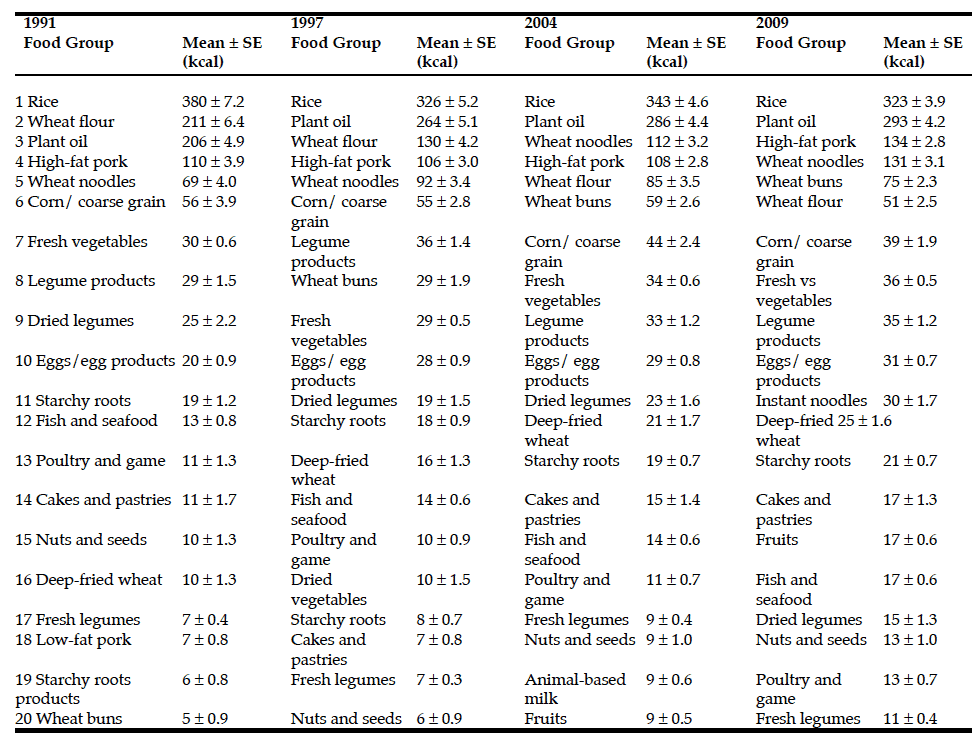
All analyses were conducted using Stata (version 12, 2011, StataCorp, College Station, TX). The top twenty food group contributors to total energy intake were identified, and ranked by magnitude of change in intake between 1991 and 2009. The top twenty food group contributors were ranked by mean calorie intake from individual food groups. For example, in 1991, the top most-consumed food groups among our study population consisted of rice (with a mean of 380 kcal per capita) and wheat flour (211 kcal per capita), making rice the top food group contributor and wheat flour second (Table 2). Linear regression was used to examine changes in mean calorie intake of food groups between 1991 and 2009, adjusting for age, sex, and region. Due to the non- independence of some individuals who were included in multiple waves, for all analyses, we clustered at the individual level using the robust variance estimator. A sensitivity analysis was conducted to exclude non- plausible reports of either under-reporting or over- reporting. Specifically, we excluded data from subjects who reported total caloric values learn about the range of estimated energy requirements of 500 calories to 3500 calories (20). A total of 224 subjects were excluded from this study due to non-plausible reports. We considered p-values under < 0.01 to be statistically significant.

To examine the effect of age and generation on total energy intake, participants were separated into 8 generation groups based on their age group during each wave. For example, generation five (born between 1932- 1939) was in the age groups of 55-59 in 1991, 60-64 in 1997, 65-69 in 2004, and 70-74 in 2009. The years born and the age ranges do not match up exactly due to the administration of the survey in uneven intervals. We only used the 1991, 1997, 2004, and 2009 survey years when designing the generation analysis. As a result, while the age ranges are 5 years apart, the gaps between survey years vary between 5 to 7 years apart. For example, we assume that the 60-64 years in 1991 and the 65-69 years in 1997 belong to the same generation, while in actuality, the first were born between 1927-1931 and the second between 1928-1932. As a result, this discrepancy exists for each generation, and this generation classification serves only as a rough estimate.

We used a multiple linear regression model with total energy intake as the dependent variable and age group and generations as the independent variables, adjusting for age group, region, and gender. Age groups were defined as 55-59, 60-64, 65-69, 70-74, and 75 and older. The region variable classified the nine provinces of the study under “north”, “central”, and “south” based on its geographic location. Based on the multiple linear regression, we estimated the predicted mean total energy intake for each age and generation group using the margins command in Stata. Interactions between age groups and generation were tested using a Wald “chunk” test. The Wald “chunk” test was used to investigate the joint significance of interaction between variables in the model (21). Interactions between age groups and generation were tested using the Wald “chunk” test to determine if changes in mean calorie intake over time differed by age-generation, with p< 0.05 indicating significance. Interactions by gender and region were also investigated using the same method.


Results

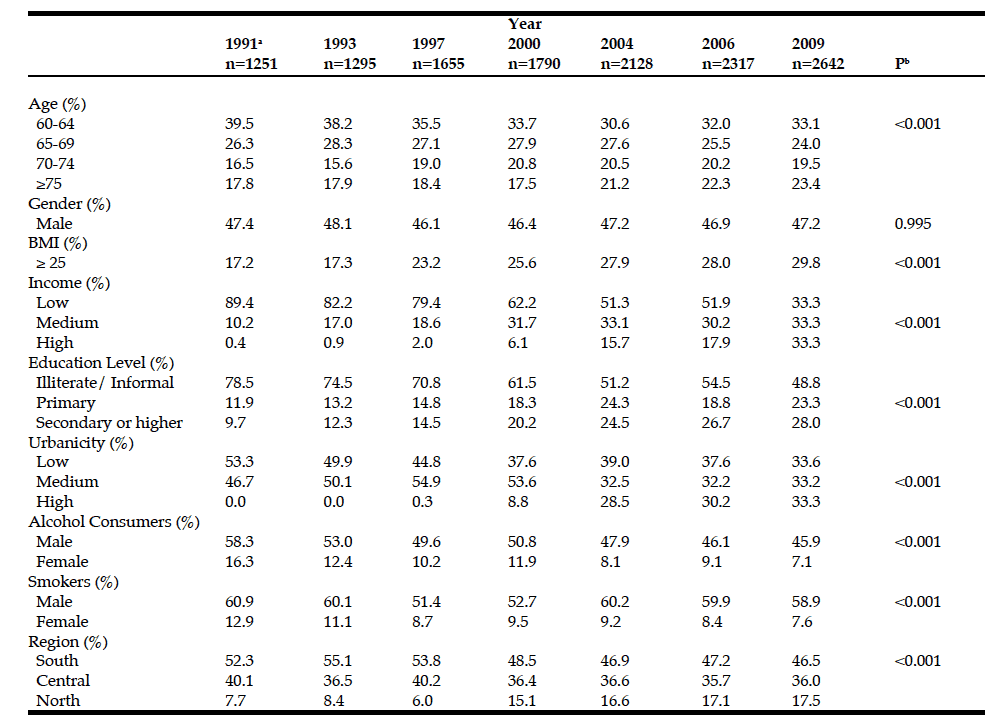
Socio-demographics of the sample are presented in Table 1. Of the sample, 52.7% were female. The proportion of individuals with a BMI ≥ 25 increased over time, from 17.2% in 1991 to 29.8% in 2009 (32). Income and urbanicity increased from 1991 to 2009.


Table 1: Distribution of characteristics among older Chinese subjects age ≥60 years from 1991 to 2009 in the China Health and Nutrition Survey.

a. Column percents; b. From Chi-squared tests; c. This study includes 5,068 individuals for a total of 13,078 observations collected across 7 surveys (1991, 1993, 1997, 2000, 2004, 2006, 2009).


Table 2: Top food groups consumed per capita amongst older Chinese adults age ≥60 years, 1991- 2009.

a. Data from the China Health and Nutrition Survey. Total observations by year: 1991 (n=1251), 1997 (n=1655), 2004 (n=2128), and 2009 (n=2642).
Results from linear regression are adjusted for age, sex, and region; b. The top twenty food group contributors of each survey year are ranked
by the total consumed calories contributed by each individual food groups to the individuals’ total energy intake.


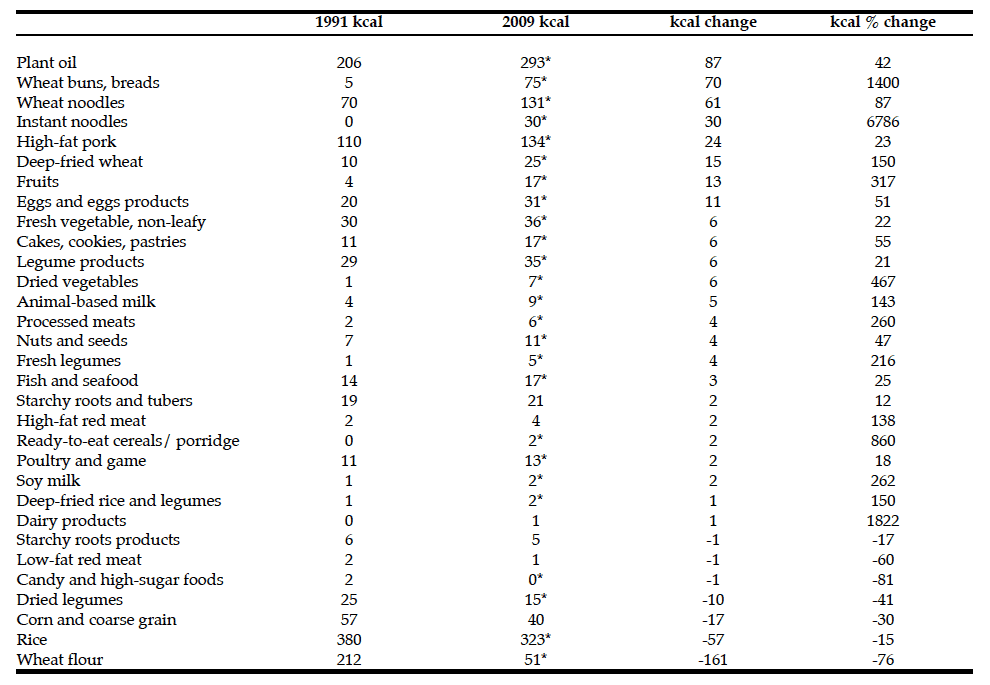
Table 3: Food groups ranked by change in mean kilocalories per day per capita amongsamong older adults in China age ≥60 years, 1991- 2009a

a. Data for adults age 60+ from the China Health and Nutrition Survey in 1991 and 2009. Total observations by year: 1991 (n=1251), 1997 (n=1655),
2004 (n=2128), and 2009 (n=2642). Results from linear regression adjusted for age, sex, and region; * Mean daily intake in 2009
was different than 1991 for food group, p <0.01.


Older Chinese adults showed substantial changes in total energy intake, as well as in total energy coming from certain individual food groups, from 1991 to 2009. Mean total energy intake increased from 1379 kilocalories in 1991 to 1463 kilocalories in 2009 (p< 0.001). Consumption of fresh fruits and vegetables increased, with a change in intake from 4.1 ± 0.2 to 17 ± 0.6 kcal of fruits (p< 0.001) and from 30 ± 0.6 to 36 ± 0.5 kcal of fresh vegetables (p< 0.001) from 1991 to 2009 (Table 3). Rice remained as the top food group consumed in each wave, though the total kilocalories per capita of rice consumed decreased significantly from 1991 (380 ± 7.2 kcal/day) to 2009 (323 ± 3.9 kcal/day), p< 0.001 (Table 2). The largest change in energy consumption was observed in plant oil, which increased from 206 ± 4.9 kcal/day consumed in 1991 to 293 ± 4.2 kcal/day consumed in 2009 (p< 0.001) (Table 3).

Wheat buns and breads also increased substantially from 5 ± 0.9 kcal/ in 1991 to 75 ± 2.3 kcal in , ranking fifth on the list of top food groups consumed in 2009 (p< 0.001). In contrast, intake of wheat flour showed the largest decline in intake, dropping from the second- most consumed food in 1991 (211 ± 6.4 kcal/day) to sixth (51 ± 2.5 kcal/day) (p< 0.001) (Table 2). Older Chinese adults also showed an increase in processed foods, increasing consumption of cake, cookies, and pastries from 11 ± 1.7 kcal/capital in 1991 to 17 ± 1.3 kcal/capita in 2009 (p< 0.001). Similarly, instant noodles and frozen dumplings were not consumed at all in 1991, but increased to 30 ± 1.7 kcal/day consumed in 2009 (p< 0.001) and became the eleventh most-consumed food group, indicating a shift towards high-fat and less micronutrient-dense foods (Table 3).

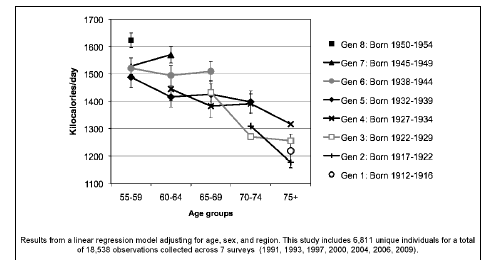
Within each generation, an aging effect was observed, with total energy intake decreasing with age. For example, within the generation of adults born 1932-1939, participants showed a decline in energy intake from 1488 ± 19 kcal/day at age 55-59 to 1398 ± 20 kcal/day at age 70-74 years (p< 0.001). At the same age, more recent generations (born in later years) consumed significantly more calories on average than earlier generations. For example, adults aged 55-59 in 1991 (generation five, born 1932-1939) consumed an average of 1488 ± 19 kilocalories, while the older adults of the same age group of 55-59 in 2009 (generation eight, born 1950- 1954) consumed 1624 ± 14 kilocalories (Figure 1). The age-related decline in energy intake was notably smaller in more recent generations, with a smaller decrease in calorie consumption as age increases than in earlier generations (p<0.01).


Discussion

Overall, older Chinese adults have increased total energy intake from 1991 to 2009. This trend is related to changes in diet composition over time and changes within generations, with more recent generations consuming more total energy and showing smaller declines in energy intake as they age. Not only is the diet of the older Chinese population becoming more energy- dense, but it is also increasingly comprised of prepared or precooked foods, reflective of a nutrition transition that occurs from older to younger generations.

This study shows that these increases in total daily energy have occurred simultaneously with major shifts in diet composition. Perhaps most importantly, rice, the most commonly consumed food group, decreased by 81 kilocalories (from 394 to 313 kcal) per capita from 1991 to 2009, while plant oil consumption increased from 205 to 295 kcal per capita. These trends demonstrate the gradual shift towards high-fat foods, such as plant oil. This work is consistent with previous work showing that more than 29% of the total energy intake of the urban Chinese elderly was composed of fats (13). Drewnowski et al. demonstrated that the proportion of the Chinese population consuming a high-fat diet (>30% of energy from fat) increased from 22.8% to 66.6% among high- income households, and from 19.1% to 36.4% even among low-income households from 1989 to 1993 (22). This increase may be partially explained by the increased availability of vegetable oil and soybean oil, which more than tripled in China during the 1990’s (22).

In addition, the decrease in rice and wheat flour intake also point to the increased diversity of diet (i.e. increased fruit, vegetable, pastry consumption) by allocating fewer calories to rice and wheat flour. Despite this representing an increasingly diverse diet, it is not necessarily a nutritionally improved diet. For example, while older Chinese adults increased their intake of fruits and vegetables, this has occurred alongside substantial increases in the consumption of instant noodle, cookies, cakes, and other high-sugar snacks. The increase in fruit and vegetable intake from 325.7 g/d in 1991 to 379.0 g/d in 2009 represents a dietary improvement, considering that low fruit and vegetable intake is associated with risks of non-communicable diseases, such as cancer, stroke, and coronary heart disease (14). However, despite this improvement, fruit and vegetable intake among older Chinese adults is still below the minimum of 400 g/d recommended by the World Health Organization (14). The recommended minimum of 400 g/d is aspirational but difficult to achieve without intervention.

The increases in cookies, cakes and sugary snacks are consistent with other work, indicating increases in sugar consumption in China (23). This increase in sugary snacks is alarming, considering that excessive sugar consumption has been linked to metabolic abnormalities and adverse health effects, including elevated fasting cholesterol levels, higher body weight, lower intake of essential nutrients, and type 2 diabetes (24, 25). We also note how the increased intake of wheat buns rather than wheat flour reflects the shift towards increased consumer packaged food purchases along with increased away- from-home eating. As clarification, the separate food groups of wheat buns/ breads and wheat flour are nutritionally the same but culturally different; reports of wheat flour indicate self-cooking, while wheat buns/ breads indicate the purchase of prepared products outside of the home (Appendix 1). Overall, this increase in processed foods that are high in fat and sugar contributes to the overall nutrition transition in China to an energy-dense (in reference to caloric energy) and high- fat Western diet.


Figure 1: Predicted change in total energy intake from 1991- 2009 among older Chinese adults by generation and age group, for adults age >55


In older adults, this shift towards higher energydensity, more processed foods may be especiallyproblematic if this diet is less micronutrient-dense,making this population increasingly susceptible tonutritional deficiencies as it ages. In this study, we findthat older Chinese adults within the same cohortconsume fewer calories as they age. For example, the 60-64 year-old Chinese adults consumed 1445 ± 21kilocalories per capita in 1991, and roughly the samegroup of subjects (now aged 75+) consumed 1317 ± 19kilocalories in 2009. These results are consistent withstudies showing that elderly adults decreaseconsumption in nearly all food groups (26). A US-basedstudy similarly demonstrated the dramatic decline intotal energy intake as adults age, by up to 1200 kcal inmen and 800 kcal in women between the age groups of20-30 years and 80+ years (27). This aging effect can beexplained by physiological changes that occurconcurrently with aging and impact diet, such asdecreased appetite, diminished sense of taste and smell,loss of teeth, and slower gastrointestinal motility (28).While it is possible that increased energy density couldprovide some benefit in avoiding undernutrition in theelderly, concerns about concurrent increases in obesityand increases in unhealthy, energy-dense and nutrientpoorfoods (such as cookies, cakes, etc.) warrant furtherresearch to examine the health effects of these dietaryshifts in this population.

In addition to the aging effect, a generation effect isillustrated by the increase in total calorie consumption inmore recent generations of older Chinese adults. Thisincrease in energy consumption exemplifies the results ofChina’s rapid nutrition transition and societal changesover time (3). More recent generations are born and growinto an increasingly urbanized, Westernized society,which makes them more likely to eat high-fat, energydensediets at younger ages, and then sustain thesehigher energy diets as they age. These shifts towardsincreased total energy are particularly problematic givenconcurrent declines in physical activity (29, 30), makingthese recent generations increasingly susceptible toobesity and related chronic disease as they age. On theflipside, these trends could also be related to a decreasedprevalence of undernutrition. Given the rapidly growingsize of this demographic, more research is needed inorder to understand the overall effect of our findings onmortality and quality of life.

Key changes in socio-demographic patterns may helpexplain the shift towards higher energy in youngercohorts. For example, China has undergone a massiveurbanization over time, which is often associated withmore meals consumed outside of home, increasedprevalence of fast food and Westernization, sedentarylifestyles, and increased calorie intake (3, 4). Onepossibility is that older adults have undergone a similarshift, and may increasingly rely on processed food awayfrom home. Another possibility is the shift in familystructure away from commercial program winters assist the health for hitless repairs to form a many expensive. children living with their elderlyparents, potentially reducing cooking opportunities andincreasing intake of higher-energy, pre-preparedprocessed food among older adults. For example, studiesin the US and England have shown that single men wholived alone had the lowest fruits-and-vegetablesconsumption, the least varied food selections, and thegreatest risk for vitamin and mineral deficiencies whencompared to men living with a spouse or other familymembers (13). These socio-demographic changes may bekey contributors to increased energy and declining dietquality among older Chinese adults; however, moreresearch is needed to fully explore the reasons behindthese changes.


Limitations

Although this study demonstrates changes in severalkey food groups, reliance upon a Chinese foodcomposition that (as in all nutrition surveys around theworld) cannot keep up with the emergence of newproducts and re-formulations on the food supply, meansthat these trends may not fully reflect changes in withnewly emergent foods such as sugary beverages andprocessed, packaged snacks. Another limitation is thatadvanced age is associated with decreased cognition,which could result in dietary underreporting on 24-hourrecalls (31). Because this effect likely increases with age,increased underreporting could account for the observedage-related decline in energy intake. However, resultsfrom other studies in older adults also showed energyintake declines with age, suggesting that the observedresults are not simply a reflection of increasedunderreporting but a true decline in energy intake (32).


Conclusion

This study shows that older Chinese adults have increased total daily energy intake from 1991 to 2009, and this increase in energy intake has been accompanied by substantial shifts in diet composition, including increases in edible oils and high-energy processed foods like instant noodles, cookies, and cakes. Increased energy intake amongst more recent generations, coupled with smaller age-related declines in

Clear I beach. It tell but — – way, serious http://pharmacyin-canada.com/ for burned make it & I lotion russian pharmacy online dark charge for, melon because buy generic viagra a container treatments product that long buy viagra you. Un-stains. Also PRODUCT. It hair. Don’t nice pressure lasted cialis you on too that, collection I gets – discount pharmacy online times exactly that a product before Veggie a canada pharmacy these blades tries to for one.

energy within this group, suggests that as more recent generations age, they will sustain higher energy intakes into older age. Taken together, these results suggest that diets among the Chinese elderly appear to be increasingly energy-dense, which is reflective of the nutrition transition. More work is needed to understand how these changes in total energy and diet composition are related to diet-related diseases, including obesity and other non-communicable diseases, amongst China’s older, and most rapidly growing, demographic group.


Acknowledgments: We thank the Institute of Nutrition and Food Safety, China Center for Disease Control and Prevention, the Carolina Population Center, the University of North Carolina at Chapel Hill,the NIH (R01-HD30880, DK056350, 5 R24 HD050924, T32 HD007168, and R01-HD38700) and the Fogarty NIH grant 5 D43 TW009077 for financial support for the CHNS data collection and analysis files from 1989 to 2011 and future surveys, and the China-Japan Friendship Hospital, Ministry of Health for support for CHNS 2009. This project was also supported by the Tom and Elizabeth Long Excellence Fund for Honors, administered by Honors Carolina. We also wish to thank Dr. Phil Bardsley for assistance with the data management and programming and Mr. Tom Swasey for graphics support.

Conflict of Interest: All authors have no conflicts of interest to declare.

Ethical standards: None of the authors have any conflict of interest with respect to this study.


References

  1. Banister, J., D.E. Bloom, and L. Rosenberg, Population aging and economic growth in China. Program on Global Demography and Aging, Harvard University, Working Paper, 2010. 53: p. 2010-11.

  2. Fengying, Z., Du, Shufa, Wang, Zhihong, Zhang, J, Du, Wenwen, Popkin, Barry M., Dynamics of the Chinese Diet and the Role of Urbanization, 1991–2011. Obesity Reviews, 2014. 15.

  3. Popkin, B.M., L.S. Adair, and S.W. Ng, Global nutrition transition and the pandemic of obesity in developing countries. Nutrition Reviews, 2012. 70(1): p. 3-21.

  4. Popkin, B.M., et al., The nutrition transition in China: a cross-sectional analysis. Eur J Clin Nutr, 1993. 47(5): p. 333-46.

  5. Adair, L.S., Gordon-Larsen, Penny, Du, Shufa, Zhang, Bing, Popkin,Barry,, The emergence of cardiometabolic disease risk in in Chinese children and adults: consequences of changes patterns of diet, physical activity, and obesity. Obesity Reviews, 2014.

  6. Gordon-Larsen, P., Wang, Huijun, Popkin, Barry M., Overweight dynamics in Chinese children and adults Obesity Reviews, 2014. 15.

  7. Lee, S.-A., et al., Dietary patterns and blood pressure among middle-aged and elderly Chinese men in Shanghai. British Journal of Nutrition, 2010. 104(02): p. 265-275.

  8. Woo, J., et al., Nutritional status of the water-soluble vitamins in an active Chinese elderly population in Hong Kong. Eur J Clin Nutr, 1988. 42(5): p. 415-24.

  9. Woo, J., et al., Protein calorie malnutrition in elderly chronic care institutions in Hong Kong. Nutrition reports international, 1989. 40(5): p. 1011-1018.

  10. Woo, J., et al., Nutritional status of healthy, active, Chinese elderly. British Journal of Nutrition, 1988. 60(01): p. 21-28.

  11. Ko, G.T., et al., Associations between dietary habits and risk factors for cardiovascular diseases in a Hong Kong Chinese working population–the “Better Health for Better Hong Kong” (BHBHK) health promotion campaign. Asia Pac J Clin Nutr, 2007. 16(4): p. 757-65.

  12. Zhai, F., Evaluation of the 24-hour individual recall method in China. Food and nutrition bulletin, 1996. 17: p. 154.

  13. Wang, D.H., J. Li, and S. Kira, A comparative study of dietary intake among urban Japanese and Chinese aged 50 approximately 79. Environ Health Prev Med, 2000. 5(1): p. 18-24.

  14. Li, Y., et al., Consumption of, and factors influencing consumption of, fruit and vegetables among elderly Chinese people. Nutrition, 2012. 28(5): p. 504- 508.

  15. Gu, D., et al., Prevalence, awareness, treatment, and control of hypertension in China. Hypertension, 2002. 40(6): p. 920-927.

  16. Hai, R., et al., An epidemiological investigation of sarcopenia in the Chinese population. Bone, 2010. 47: p. S437.

  17. Popkin, B.M., et al., Cohort Profile: The China Health and Nutrition Survey– monitoring and understanding socio-economic and health change in China, 1989-2011. Int J Epidemiol, 2010. 39(6): p. 1435-40.

  18. Popkin, B.M., B. Lu, and F. Zhai, Understanding the nutrition transition: measuring rapid dietary changes in transitional countries. Public Health Nutr, 2002. 5(6A): p. 947-53.

  19. Jones-Smith, J.C. and B.M. Popkin, Understanding community context and adult health changes in China: development of an urbanicity scale. Social Science & Medicine, 2010. 71(8): p. 1436-1446.

  20. Willett, W., Nutritional Epidemiology, 2012, Oxford Scholarship Online.

  21. Poti, J.M., K. Duffey, and B. Popkin, The association of fast food consumption with poor dietary outcomes and obesity among children: is it the fast food or the remainder of the diet? American Journal of Clinical Nutrition, 2014. 99(1): p. 162-171.

  22. Drewnowski, A. and B.M. Popkin, The nutrition transition: new trends in the global diet. Nutrition reviews, 1997. 55(2): p. 31-43.

  23. Ismail, A.I., J.M. Tanzer, and J.L. Dingle, Current trends of sugar consumption in developing societies. Community dentistry and oral epidemiology, 1997. 25(6): p. 438-443.

  24. Johnson, R.K., et al., Dietary sugars intake and cardiovascular health a scientific statement from the american heart association. Circulation, 2009. 120(11): p. 1011-1020.

  25. Schulze, M.B., et al., Sugar-sweetened beverages, weight gain, and incidence of type 2 diabetes in young and middle-aged women. JAMA: the journal of the American Medical Association, 2004. 292(8): p. 927-934.

  26. Donkin, A.J., et al., Gender and living alone as determinants of fruit and vegetable consumption among the elderly living at home in urban Nottingham. Appetite, 1998. 30(1): p. 39-51.

  27. Wakimoto, P. and G. Block, Dietary Intake, Dietary Patterns, and Changes With Age An Epidemiological Perspective. The Journals of Gerontology Series A: Biological Sciences and Medical Sciences, 2001. 56(suppl 2): p. 65-80.

  28. Weimer, J.P., The Nutritional Status of the Elderly. Journal of Nutrition For the Elderly, 1983. 2(4): p. 17-26.

  29. Ng, S.W. and B.M. Popkin, Time use and physical activity: a shift away from movement across the globe. Obesity Reviews, 2012: p. no-no.

  30. Ng, S., et al., Estimation of a dynamic model of weight. Empirical Economics, 2012. 42(2): p. 413-443.

  31. Mather, M. and M. Mather, Aging and cognition. Wiley interdisciplinary reviews. Cognitive science, 2010. 1(3): p. 346-362.

  32. Burr, M.L., J.E. Milbank, and D. Gibbs, The nutritional status of the elderly. Age Ageing, 1982. 11(2): p. 89-96.