J. Willers1, A. Hahn1, T. Köbe2,3, S. Gellert1, V. Witte2,3,4, V. Tesky5, J. Pantel5, A. Flöel2,3,6, J.P. Schuchardt1
1. Institute of Food Science and Human Nutrition, Leibniz University Hannover, Germany; 2. Department of Neurology, Charité – University of Medicine Berlin, Germany; 3. NeuroCure Cluster of Excellence, Charité – University of Medicine Berlin, Germany; 4. Max Planck Institute of Human Cognitive and Brain Sciences, Department of Neurology, Leipzig, Germany and SFB 1052 Obesity Mechanism subproject A1, University of Leipzig, Germany; 5. Institute of General Practice, Goethe University, Frankfurt am Main, Germany; 6. Center for Stroke Research Berlin, Charité – University of Medicine Berlin, Germany
Corresponding Author: J. Willers, Institute of Food Science and Human Nutrition, Leibniz University Hannover, Am Kleinen Felde 30, 30167 Hannover, Germany, Tel: +49 (0)511 762 5755; Fax: +49 (0)511 762 5729; Email: willers@nutrition.uni-hannover.de
J Aging Res Clin Practice 2018;7:37-41
Published online March 1, 2018, http://dx.doi.org/10.14283/jarcp.2018.8
Abstract
In this cross-sectional study, body composition of fifty-eight mild cognitive impairment (MCI) patients (single and multiple domain) and fifty healthy older control subjects by the use of bioelectrical impedance analysis (BIA) was assessed. Measurements were: height, weight, body mass index, BIA: phase angle (PA), total body water (TBW), lean body mass (LBM), body cell mass (BCM), extracellular mass (ECM), body fat mass (BFM), apolipoprotein E4, and physical activity level. Compared to BIA reference values and healthy subjects, MCI patients had significant differences in PA (only female), BCM and ECM/BCM index. Differences were more pronounced in females compared to males. The low levels of BCM and PA suggest that MCI patients, especially of female sex, have a poor nutritional status. BIA-derived PA might be a suitable indicator, that could enhance evaluation of nutritional status in patients with cognitive decline.
Key words: Mild cognitive impairment, bioelectrical impedance analysis, phase angle, body composition.
Abbreviations: APOE: apolipoprotein E; AVLT: auditory verbal learning test; BCM: body cell mass; BFM: body fat mass; BIA: bioelectrical impedance analysis; BMI: body mass index; CERAD: Consortium to establish a registry for Alzheimer’s disease; ECM: extracellular mass; LBM: lean body mass; MCI: mild cognitive impairment; MMSE: mini-mental status examination; PA: phase angle; PAL: physical activity level; R: resistance; TBW: total body water; Xc: capacitive reactance.
Introduction
Different epidemiological studies observed a relationship between nutritional status and cognitive function in patients with cognitive impairment (1-3). There is also evidence that poor nutritional conditions are associated with cognitive decline (4-6) and may play an important role in progression of cognitive loss (7).
Techniques for measuring body composition include anthropometry and bioelectric impedance analysis (BIA). Especially the use of raw BIA data has become a standard procedure in the assessment and monitoring of the body composition and nutritional status of patients [8]. BIA measures the opposition to electrical flow arising from resistance and reactance. The BIA is a simple, inexpensive and non-invasive technique for assessing body composition, allowing conclusions on total body water (TBW), hydration status and body cell mass. This method is used for the determination of nutritional status and risk of morbidity in ambulatory and hospitalized patients (9). For the nutritional screening and clinical prognosis, the phase angle (PA) is the most established impedance parameter (10). The PA is calculated from resistive behaviour (R), which is mainly dependent on tissue hydration, and the capacitive behaviour of tissues (Xc) associated with cellularity, cell size, and integrity of the cell membrane (8). A low PA suggest cell death or decreased cell integrity and has strong predictive value according to morbidity and mortality in various disease conditions, e.g. HIV or cancer (11).
Due to a strong dependency of body composition on sex (e.g., females have less muscle and greater percentage of body fat than males), age (e.g., decreasing muscle mass and increasing fat mass with increasing age) and body mass index (BMI), reference values for PA and other BIA parameters are sex-, age-, and BMI-specific (8). A gender specific evaluation is therefore mandatory.
To our knowledge, only one recent study is published that investigated the nutritional status of mild cognitive impairment (MCI) patients in terms of the body composition via BIA (12). MCI is a frequent condition in the general aged population and is associated with an increased risk for the development of dementia. Therefore, body composition in MCI may be of relevance for prognosis of cognitive decline. Thus, the objective in this study was to compare BIA measurements in MCI patients with literature reference values and age-matched older adults without clinical dementia.
Methods
For this cross-sectional study, 58 patients with MCI were recruited consecutive between 2011 and 2014 in Berlin (memory clinic of the Department of Neurology of the Charité University Hospital and Neurology specialist practice) and Frankfurt am Main (Institute of General Practice), Germany. MCI patients (single and multiple domain) were diagnosed according to Mayo criteria based on subjective cognitive complaints and objective memory impairment in standardized tests (performing at least 1.5 SD below age- and education-specific norm in relevant subtests (Total Word List, Delayed Recall Word/Figures) of the CERAD-Plus test battery (13), relatively preserved general cognition, no impairment in activities of daily living, and no dementia (14). Fifty healthy older adults were recruited between 2010 and 2013 at the memory clinic of the Department of Neurology at the Charité Berlin, Germany. A detailed description of in- and exclusion criteria can be found in Köbe et al. (15) for MCI patients and Witte et al. (16) for healthy older adults.
MCI patients had a body mass index (BMI) range from 18 to 32 kg/m², whereas the healthy controls had a BMI between 24 kg/m² to 32 kg/m². Before comparing the two groups a BMI adjustment as well as an age-match was mandatory (Figure 1).
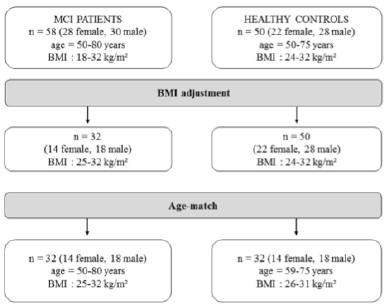
Figure 1
BMI adjustment and age-match for the group comparison
Anthropometric (e.g., body weight, height, BMI) and bioimpedance measurements (e.g., PA, TBW, lean body mass (LBM), body cell mass (BCM), extracellular mass (ECM), body fat mass (BFM)) were carried out. BIA was performed with B.I.A. 2000-M (Pöcking, Germany) and the software NutriPlus (Data Input GmbH, Darmstadt, Germany).
Fasting blood samples were obtained by venipuncture of an arm vein using sealed blood collection tubes and Monovettes® (Sarstedt, Nürnbrecht, Germany). Concentrations of cobalamine (vitamin B12) and folate were measured in serum samples at the IMD laboratory, Berlin, Germany.
For apolipoprotein E (ApoE) genotyping, DNA was extracted from whole blood using a blood mini-kit (Qiagen, Hilden, Germany) and stored at -80°C until analysis. Genotyping of apolipoprotein E4 (ApoE4) was performed on a Sequenom® MassARRAY iPLEX, TaqMan assay following procedures described previously (17).
Participants were tested on memory performance using the German version of the Rey Auditory Verbal Learning Test (AVLT) (18). Global cognitive dysfunction was estimated with the Mini Mental State Examination (MMSE) (19). Patients were asked to learn a list of 15 words within five immediate recall trials, followed by a 30 min delayed recall and delayed recognition test. Learning ability was defined as the sum of words learned in all five trials (maximum 75 words); delayed recall represented the total number of remembered words after 30 min (maximum 15 words). For delayed recognition (recognition memory), subjects were asked to recognize the 15 original words presented within 35 distractor words subsequent to the delayed recall tests (number of correctly recognized words minus false positives; maximum 15 words). All testing was conducted by trained staff members according to standard procedure.
Statistical analyses were processed with SPSS software version 24.0 (SPSS Inc., Chicago, IL, USA). Results are expressed as means ± SD unless otherwise specified. Differences between men and women were calculated by the non-parametric Mann-Whitney U test. Multiple linear regression models were used for group comparison (MCI vs. healthy controls). Initially, all analyses were conducted unadjusted. Subsequently, age, education, ApoE4 status, vitamin B12, folate status (factors that are known to be associated with cognition) (15), and physical activity level (a factor that influences body composition) were entered as covariates in multiple linear regression models to study whether potential group differences are independent. Patients reported their physical activity using the Freiburger physical activity questionnaire. Spearman’s rank correlation was used to test correlations between variables. P-values ≤ 0.05 were considered significant.
Results and discussion
Characterisation of the MCI group
Characterisation of the MCI patients according to anthropometric and BIA measurements is presented in Table 1. The total MCI collective includes fifty-eight MCI patients (28 women) with a mean age of 69.1 ± 7.8 years. As expected, gender differences were observed for body weight as well as all bioelectrical variables. Percentage of BCM was reduced in MCI women (44.3 ± 3.1%) vs. men (48.5 ± 3.9%), resulting in a lower ECM/BCM index in men (1.1 ± 0.3) vs. women (1.3 ± 0.2). Manufacturer reference values for this age group constitute ideal BCM values of 50 – 56% for women and 53 – 59% for men, while the ECM/BCM ratio should be < 1 for both sexes. Thus, our data suggest that MCI patients, especially female, are of poor body condition and exhibit a low muscle content and activity status (20).
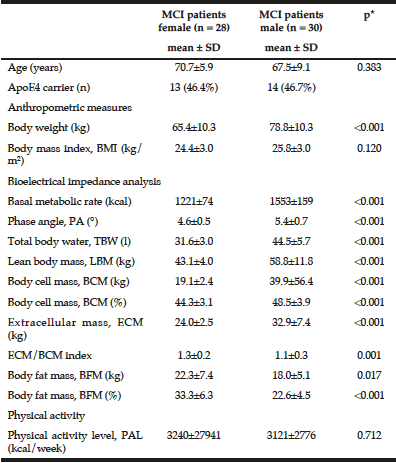
Table 1
Anthropometric measures and bioelectrical impedance analysis of the MCI group (n = 58)
* Mann-Whitney U test was performed for comparison between women and men; 1 n = 26
Additionally, male MCI patients had a significantly higher PA than female patients. The median PA of the total MCI collective was 4.9° (range 3.6° to 6.4°). About half of the MCI patients (48.3%, women: 67.9%, men: 30%) had a lower PA from 3.6° to 4.8°. There was a strong negative correlation between PA and age (r = -0.538; p < 0.001, Spearman’s rank correlation), which has been, likewise, reported in healthy populations (10, 21). Physiologically, increasing age is associated with decline in tissue mass, which results in decreasing PA (11). Simultaneously, hospitalized patients showed a significant lower LBM, higher BFM and lower PA in general (22). Nevertheless, the mean PA in MCI patients of this study was even lower than of MCI patients in a recently published cross-sectional study (women: 5.6 ± 0.6°, men: 6.4 ± 0.7°) (12) and lower compared to hospitalized patients (women: 5.0 ± 1.3°; men: 6.0 ± 1.4°) (22). Furthermore, various studies indicate that the PA can be considered as a marker of clinically relevant malnutrition caused by an increase of extracellular fluid and a decrease of BCM (11, 23).
Compared to reference BIA values of a large German database (214,732 adults) in corresponding gender, age and BMI groups (8), the body composition of the present MCI patients can be classified as worse. MCI patients of both sexes have lower PAs (MCI women: 4.6 ± 0.5°, MCI men: 5.4 ± 0.7°) according to their corresponding BMI and age classes (German reference sample: women: 5.1 ± 0.8°; men: 6.0 ± 0.8°).
Additionally, in female MCI patients (n = 28) learning ability was positively correlated with the PA (r = 0.433, p = 0.002, Spearman’s rank correlation) and negatively with the ECM/BCM index (r = -0.456, p = 0.001, Spearman’s rank correlation). In male MCI patients, no correlation was observed. Nevertheless, these data suggest an association between an impaired memory performance and a poor body composition, although it cannot be clarified whether a lower cognitive function is a cause or consequence of a poor nutritional status. Further longitudinal studies are necessary.
Comparison between MCI patients and healthy controls
Furthermore, we compared the MCI patients to healthy controls in terms of BIA measurements. As the participants were selected using different BMI ranges, an adjustment according to BMI and age was necessary (Figure 1). Finally, in each case, thirty-two MCI patients and healthy controls were compared with regard to anthropometric and BIA measures (Table 2 and 3).
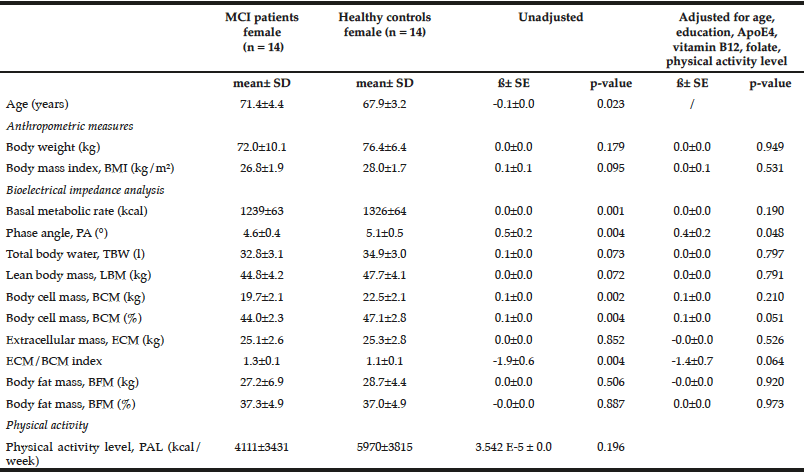
Table 2
Comparison of anthropometric measures and bioelectrical impedance analysis between female MCI patients and healthy controls
Multiple linear regression models were used for group comparison, adjusting for potential confounders; p < 0.05; ß: unstandardized regression coefficient.
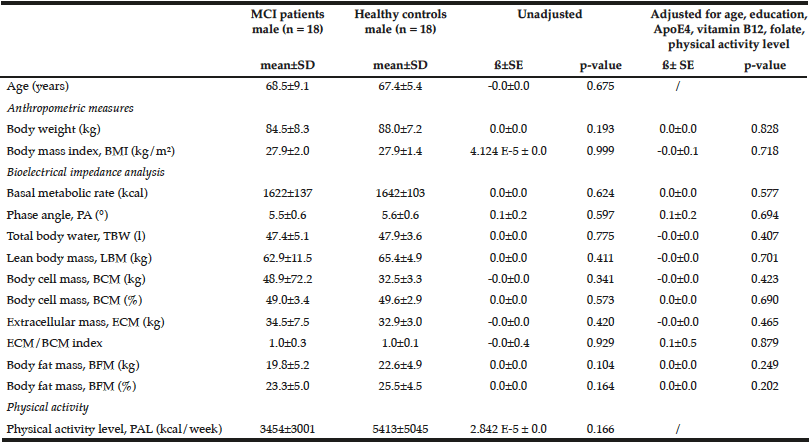
Table 3
Comparison of anthropometric measures and bioelectrical impedance analysis between male MCI patients and healthy controls
Multiple linear regression models were used for group comparison, adjusting for potential confounders; p < 0.05; ß: unstandardized regression coefficient.
Female healthy subjects had a higher BMI (28.0 ± 1.7 kg/m2) and were heavier (76.4 ± 6.4 kg) compared to female MCI patients (BMI: 26.8 ± 1.9 kg/m2; weight: 72.0 ± 10.1 kg). These data were not statistical significant. However, the parameter should not be underestimated as cognitive decline is faster and more severe with a low BMI (BMI cut-off 25 kg/m²) (24). Especially female MCI patients showed significantly lower values in basal metabolic rate, PA, BCM, ECM, and ECM/BCM index compared to healthy females (Table 2). The differences remained significant only for PA and BCM after adjustment for potential confounders such as age, education, ApoE4, vitamin B12, folate status, and physical activity. In male subjects, the differences were not significant (Table 3).
Limitations of this study relate to the small sample size and the BIA technique. Due to the necessary BMI adjustment, the study population was greatly reduced. Thus, the group comparison was comparatively weak and might limit the outcome. Additionally, the BIA measurement has technical and physiological limitations such as hydration status, body position during procedure, air and skin temperatures, recent physical activity. BIA is not traditionally used as a measure of malnutrition but it might improve assessment of nutritional status and prognosis among MCI patients.
Conclusion
Using BIA, we observed a poor body composition especially in female MCI patients indicating a poor general health condition. Considering the observed associations between the PA and memory functions, our data confirm earlier findings that determined a relationship between nutrition status and cognitive function in patients with cognitive impairment. However, based on our data we cannot clarify whether lower cognitive function is a cause or consequence of a poor nutritional status. Thus, further longitudinal studies may be undertaken to resolve this important question and eventually determine if the PA may serve as a potential prognostic factor for cognitive decline.
Acknowledgements: We would like to thank the participants who contributed their time to this project. The genotyping of ApoE4 in the laboratory of Prof. Dr. Dan Rujescu (University of Halle, Germany) is kindly acknowledged. Likewise, we thank Lucia Kerti from the Department of Neurology, Charité – University of Medicine Berlin for her involvement with examining healthy older subjects.
Funding: This research was funded by the German Federal Ministry of Education and Research (BMBF; FKZ 01EA1328D) and is registered under ClinicalTrials.gov identifier: NCT01219244.
Ethical statement: The study was conducted according to the German law and to good clinical practice and ethical principles of the Declaration of Helsinki. The Ethics Committee of the Charité – University of Medicine, Berlin, Germany, approved the study.
Consent statement: Written informed consent was obtained from all participants.
Dr Willers has nothing to disclose. Prof Hahn reports grants from Bundesministerium für Bildung und Forschung (Federal Ministry of Education and Research), during the conduct of the study. Theresa Köbe reports grants from German Federal Ministry of Education and Research, during the conduct of the study. Dr Gellert has nothing to disclose. Dr Witte has nothing to disclose. Dr Tesky has nothing to disclose. Prof Pantel has nothing to disclose. Prof Flöel reports grants from BMBF, during the conduct of the study. Dr Schuchardt reports grants from Bundesministerium für Bildung und Forschung (Federal Ministry of Education and Research), during the conduct of the study.
References
1. Lee KS, Hong CH, Cheong HK, Oh BH. Difference in nutritional risk between mild cognitive impairment group and normal cognitive function elderly group. Arch Gerontol Geriatr 2009;49(1): 49-53.
2. Marino LV, Ramos LF, Chiarello PG. Nutritional status according to the stages of Alzheimer’s disease. Aging Clin Exp Res 2014;27 (4): 507-13.
3. Orsitto G. Different components of nutritional status in older in patients with cognitive impairment. J Nutr Health Aging 2012;16 (5): 468-471.
4. Haan MN, Miller JW, Aiello AE, Whitmer RA, Jaqust WJ et al. Homocysteine, B vitamins, and the incidence of dementia and cognitive impairment: results from the Sacramento Area Latino Study on Aging. Am J Clin Nutr 2007;85(2): 511-517.
5. Khater MS, Aboulelezz NF. Nutritional status in older adults with mild cognitive impairment living in elderly homes in cairo, Egypt. J Nutr Health Aging 2011;15(2): 104-108.
6. Orsitto G, Fulvio F, Tria D, Turi V, Venezia A et al. Nutritional status in hospitalized elderly patients with mild cognitive impairment. Clin Nutr 2009;28 (1): 100-102.
7. Malara A, Sgrò G, Caruso C, Ceravolo F, Curinga G et al. Relationship between cognitive impairment and nutritional assessment on functional status in Calabrian long-term-care. Clin Interv Aging 2014;9: 105-110.
8. Bosy-Westphal A, Danielzik S, Dörhöfer RP, Later W, Wiese S et al. Phase angle from bioelectrical impedance analysis: population reference values by age, sex, and body mass index. JPEN 2006;30 (4): 309-316.
9. Buffa R, Floris G, Marini E. Assessment of nutritional status in free-living elderly individuals by bioelectrical impedance vector analysis. Nutrition 2009;25: 3-5.
10. Barbosa-Silva MCG, Barros AJD, Wang J, Heymsfield SB, Pierson Jr RN. Bioelectrical impedance analysis: population reference values for phase angle by age and sex. Am J Clin Nutr 2005;82: 49-52.
11. Stobäus N, Pirlich M, Valentini L, Schulzke JD, Norman K. Determinants of bioelectrical phase angle in disease. Br J Nutr 2011;107 (8): 1217-1220.
12. Cova I, Pomati S, Maggiore L, Forcella M, Cucumo V et al. Nutritional status and body composition by bioelectrical impedance vector analysis: A cross sectional study in mild cognitive impairment and Alzheimer’s disease. PLoS One 2017;12 (2): e0171331.
13. Morris JC, Heyman A, Mohs RC, Hughes JP, van Belle G et al. The Consortium to Establish a Registry for Alzheimer’s Disease (CERAD). Part I. Clinical and neuropsychological assessment of Alzheimer’s disease. Neurology 1989;39 (9): 1159-65.
14. Petersen RC, Smith GE, Waring SC, Ivnik RJ, Tangalos EG et al. Mild cognitive impairment: clinical characterization and outcome. Arch Neurol 1999;56 (3): 303-8.
15. Köbe T, Witte AV, Schnelle A, Grittner U, Tesky VA et al. Vitamin B-12 concentration, memory performance, and hippocampal structure in patients with mild cognitive impairment. Am J Clin Nutr 2016;103 (4): 1045-54.
16. Witte AV, Kerti L, Hermannstädter HM, Fiebach JB, Schreiber SJ et al. Long-chain omega-3 fatty acids improve brain function and structure in older adults. Cereb Cortex 2014;24 (11): 3059-68.
17. O’Dwyer L, Lamberton F, Matura S, Tanner C, Scheibe M et al. Reduced hippocampal volume in healthy young ApoE4 carriers: an MRI study. PloS one 2012;7 (11): e48895.
18. Lezak M. Neuropsychological assessment. New York, Oxford: Oxford University Press, 2004.
19. Folstein MF, Folstein SE, McHugh PR. “Mini-mental state”: a practical method for grading the cognitive state of patients for the clinician. J Psychiatr Res 1975;12: 189-198.
20. Matthie JR. Bioimpedance measurements of human body composition: critical analysis and outlook. Expert Rev Med Devices 2008;5(2): 239-261.
21. Dittmar M. Reliability and Variablility of Bioimpedance Measures in Normal Adults: Effects of Age, Gender, and Body Mass. Am J Physiol Anthropol 2003;122: 361-370.
22. Kyle UG, Genton L, Pichard C (2013) Low phase angle determined by bioelectrical impedance analysis is associated with malnutrition and nutritional risk at hospital admission. Clin Nutr 2013.32: 294-299.
23. Kyle UG, Soundar EP, Genton L, Pichard C. Can phase angle determined by bioelectrical impedance analysis assess nutritional risk? A comparison between healthy and hospitalized subjects. Clin Nutr 2012.31: 875-881.
24. Coin A, Veronese N, De Rui M, Mosele M, Bolzetta F et al. Nutritional predictors of cognitive impairment severity in demented elderly patients: the key role of BMI. J Nutr Health Aging 2012.16(6):553-556.