jarlife journal
Sample text

AND option

OR option

POOR BODY COMPOSITION IN PATIENTS WITH MILD COGNITIVE IMPAIRMENT COMPARED TO HEALTHY OLDER CONTROLS


J. Willers1, A. Hahn1, T. Köbe2,3, S. Gellert1, V. Witte2,3,4, V. Tesky5, J. Pantel5, A. Flöel2,3,6, J.P. Schuchardt1


1. Institute of Food Science and Human Nutrition, Leibniz University Hannover, Germany; 2. Department of Neurology, Charité – University of Medicine Berlin, Germany; 3. NeuroCure Cluster of Excellence, Charité – University of Medicine Berlin, Germany; 4. Max Planck Institute of Human Cognitive and Brain Sciences, Department of Neurology, Leipzig, Germany and SFB 1052 Obesity Mechanism subproject A1, University of Leipzig, Germany; 5. Institute of General Practice, Goethe University, Frankfurt am Main, Germany; 6. Center for Stroke Research Berlin, Charité – University of Medicine Berlin, Germany

Corresponding Author: J. Willers, Institute of Food Science and Human Nutrition, Leibniz University Hannover, Am Kleinen Felde 30, 30167 Hannover, Germany, Tel: +49 (0)511 762 5755; Fax: +49 (0)511 762 5729; Email: willers@nutrition.uni-hannover.de

J Aging Res Clin Practice 2018;7:37-41
Published online March 1, 2018, http://dx.doi.org/10.14283/jarcp.2018.8


Abstract

In this cross-sectional study, body composition of fifty-eight mild cognitive impairment (MCI) patients (single and multiple domain) and fifty healthy older control subjects by the use of bioelectrical impedance analysis (BIA) was assessed. Measurements were: height, weight, body mass index, BIA: phase angle (PA), total body water (TBW), lean body mass (LBM), body cell mass (BCM), extracellular mass (ECM), body fat mass (BFM), apolipoprotein E4, and physical activity level. Compared to BIA reference values and healthy subjects, MCI patients had significant differences in PA (only female), BCM and ECM/BCM index. Differences were more pronounced in females compared to males. The low levels of BCM and PA suggest that MCI patients, especially of female sex, have a poor nutritional status. BIA-derived PA might be a suitable indicator, that could enhance evaluation of nutritional status in patients with cognitive decline.

Key words: Mild cognitive impairment, bioelectrical impedance analysis, phase angle, body composition.

Abbreviations: APOE: apolipoprotein E; AVLT: auditory verbal learning test; BCM: body cell mass; BFM: body fat mass; BIA: bioelectrical impedance analysis; BMI: body mass index; CERAD: Consortium to establish a registry for Alzheimer’s disease; ECM: extracellular mass; LBM: lean body mass; MCI: mild cognitive impairment; MMSE: mini-mental status examination; PA: phase angle; PAL: physical activity level; R: resistance; TBW: total body water; Xc: capacitive reactance.


Introduction

Different epidemiological studies observed a relationship between nutritional status and cognitive function in patients with cognitive impairment (1-3). There is also evidence that poor nutritional conditions are associated with cognitive decline (4-6) and may play an important role in progression of cognitive loss (7).
Techniques for measuring body composition include anthropometry and bioelectric impedance analysis (BIA). Especially the use of raw BIA data has become a standard procedure in the assessment and monitoring of the body composition and nutritional status of patients [8]. BIA measures the opposition to electrical flow arising from resistance and reactance. The BIA is a simple, inexpensive and non-invasive technique for assessing body composition, allowing conclusions on total body water (TBW), hydration status and body cell mass. This method is used for the determination of nutritional status and risk of morbidity in ambulatory and hospitalized patients (9). For the nutritional screening and clinical prognosis, the phase angle (PA) is the most established impedance parameter (10). The PA is calculated from resistive behaviour (R), which is mainly dependent on tissue hydration, and the capacitive behaviour of tissues (Xc) associated with cellularity, cell size, and integrity of the cell membrane (8). A low PA suggest cell death or decreased cell integrity and has strong predictive value according to morbidity and mortality in various disease conditions, e.g. HIV or cancer (11).
Due to a strong dependency of body composition on sex (e.g., females have less muscle and greater percentage of body fat than males), age (e.g., decreasing muscle mass and increasing fat mass with increasing age) and body mass index (BMI), reference values for PA and other BIA parameters are sex-, age-, and BMI-specific (8). A gender specific evaluation is therefore mandatory.
To our knowledge, only one recent study is published that investigated the nutritional status of mild cognitive impairment (MCI) patients in terms of the body composition via BIA (12). MCI is a frequent condition in the general aged population and is associated with an increased risk for the development of dementia. Therefore, body composition in MCI may be of relevance for prognosis of cognitive decline. Thus, the objective in this study was to compare BIA measurements in MCI patients with literature reference values and age-matched older adults without clinical dementia.


Methods

For this cross-sectional study, 58 patients with MCI were recruited consecutive between 2011 and 2014 in Berlin (memory clinic of the Department of Neurology of the Charité University Hospital and Neurology specialist practice) and Frankfurt am Main (Institute of General Practice), Germany. MCI patients (single and multiple domain) were diagnosed according to Mayo criteria based on subjective cognitive complaints and objective memory impairment in standardized tests (performing at least 1.5 SD below age- and education-specific norm in relevant subtests (Total Word List, Delayed Recall Word/Figures) of the CERAD-Plus test battery (13), relatively preserved general cognition, no impairment in activities of daily living, and no dementia (14). Fifty healthy older adults were recruited between 2010 and 2013 at the memory clinic of the Department of Neurology at the Charité Berlin, Germany. A detailed description of in- and exclusion criteria can be found in Köbe et al. (15) for MCI patients and Witte et al. (16) for healthy older adults.
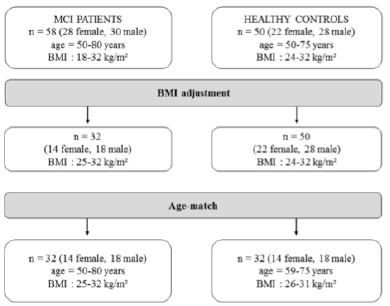
MCI patients had a body mass index (BMI) range from 18 to 32 kg/m², whereas the healthy controls had a BMI between 24 kg/m² to 32 kg/m². Before comparing the two groups a BMI adjustment as well as an age-match was mandatory (Figure 1).


Figure 1 BMI adjustment and age-match for the group comparison

Figure 1
BMI adjustment and age-match for the group comparison


Anthropometric (e.g., body weight, height, BMI) and bioimpedance measurements (e.g., PA, TBW, lean body mass (LBM), body cell mass (BCM), extracellular mass (ECM), body fat mass (BFM)) were carried out. BIA was performed with B.I.A. 2000-M (Pöcking, Germany) and the software NutriPlus (Data Input GmbH, Darmstadt, Germany).
Fasting blood samples were obtained by venipuncture of an arm vein using sealed blood collection tubes and Monovettes® (Sarstedt, Nürnbrecht, Germany). Concentrations of cobalamine (vitamin B12) and folate were measured in serum samples at the IMD laboratory, Berlin, Germany.
For apolipoprotein E (ApoE) genotyping, DNA was extracted from whole blood using a blood mini-kit (Qiagen, Hilden, Germany) and stored at -80°C until analysis. Genotyping of apolipoprotein E4 (ApoE4) was performed on a Sequenom® MassARRAY iPLEX, TaqMan assay following procedures described previously (17).
Participants were tested on memory performance using the German version of the Rey Auditory Verbal Learning Test (AVLT) (18). Global cognitive dysfunction was estimated with the Mini Mental State Examination (MMSE) (19). Patients were asked to learn a list of 15 words within five immediate recall trials, followed by a 30 min delayed recall and delayed recognition test. Learning ability was defined as the sum of words learned in all five trials (maximum 75 words); delayed recall represented the total number of remembered words after 30 min (maximum 15 words). For delayed recognition (recognition memory), subjects were asked to recognize the 15 original words presented within 35 distractor words subsequent to the delayed recall tests (number of correctly recognized words minus false positives; maximum 15 words). All testing was conducted by trained staff members according to standard procedure.
Statistical analyses were processed with SPSS software version 24.0 (SPSS Inc., Chicago, IL, USA). Results are expressed as means ± SD unless otherwise specified. Differences between men and women were calculated by the non-parametric Mann-Whitney U test. Multiple linear regression models were used for group comparison (MCI vs. healthy controls). Initially, all analyses were conducted unadjusted. Subsequently, age, education, ApoE4 status, vitamin B12, folate status (factors that are known to be associated with cognition) (15), and physical activity level (a factor that influences body composition) were entered as covariates in multiple linear regression models to study whether potential group differences are independent. Patients reported their physical activity using the Freiburger physical activity questionnaire. Spearman’s rank correlation was used to test correlations between variables. P-values ≤ 0.05 were considered significant.


Results and discussion

Characterisation of the MCI group

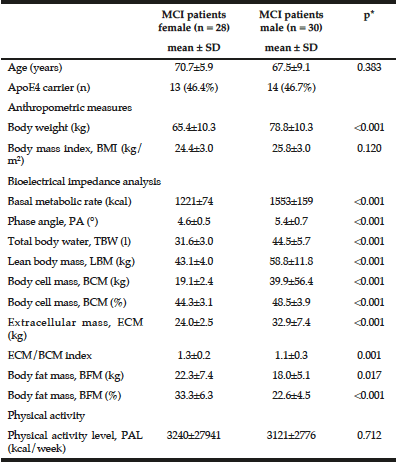
Characterisation of the MCI patients according to anthropometric and BIA measurements is presented in Table 1. The total MCI collective includes fifty-eight MCI patients (28 women) with a mean age of 69.1 ± 7.8 years. As expected, gender differences were observed for body weight as well as all bioelectrical variables. Percentage of BCM was reduced in MCI women (44.3 ± 3.1%) vs. men (48.5 ± 3.9%), resulting in a lower ECM/BCM index in men (1.1 ± 0.3) vs. women (1.3 ± 0.2). Manufacturer reference values for this age group constitute ideal BCM values of 50 – 56% for women and 53 – 59% for men, while the ECM/BCM ratio should be < 1 for both sexes. Thus, our data suggest that MCI patients, especially female, are of poor body condition and exhibit a low muscle content and activity status (20).


Table 1 Anthropometric measures and bioelectrical impedance analysis of the MCI group (n = 58)

Table 1
Anthropometric measures and bioelectrical impedance analysis of the MCI group (n = 58)

* Mann-Whitney U test was performed for comparison between women and men; 1 n = 26


Additionally, male MCI patients had a significantly higher PA than female patients. The median PA of the total MCI collective was 4.9° (range 3.6° to 6.4°). About half of the MCI patients (48.3%, women: 67.9%, men: 30%) had a lower PA from 3.6° to 4.8°. There was a strong negative correlation between PA and age (r = -0.538; p < 0.001, Spearman’s rank correlation), which has been, likewise, reported in healthy populations (10, 21). Physiologically, increasing age is associated with decline in tissue mass, which results in decreasing PA (11). Simultaneously, hospitalized patients showed a significant lower LBM, higher BFM and lower PA in general (22). Nevertheless, the mean PA in MCI patients of this study was even lower than of MCI patients in a recently published cross-sectional study (women: 5.6 ± 0.6°, men: 6.4 ± 0.7°) (12) and lower compared to hospitalized patients (women: 5.0 ± 1.3°; men: 6.0 ± 1.4°) (22). Furthermore, various studies indicate that the PA can be considered as a marker of clinically relevant malnutrition caused by an increase of extracellular fluid and a decrease of BCM (11, 23).
Compared to reference BIA values of a large German database (214,732 adults) in corresponding gender, age and BMI groups (8), the body composition of the present MCI patients can be classified as worse. MCI patients of both sexes have lower PAs (MCI women: 4.6 ± 0.5°, MCI men: 5.4 ± 0.7°) according to their corresponding BMI and age classes (German reference sample: women: 5.1 ± 0.8°; men: 6.0 ± 0.8°).
Additionally, in female MCI patients (n = 28) learning ability was positively correlated with the PA (r = 0.433, p = 0.002, Spearman’s rank correlation) and negatively with the ECM/BCM index (r = -0.456, p = 0.001, Spearman’s rank correlation). In male MCI patients, no correlation was observed. Nevertheless, these data suggest an association between an impaired memory performance and a poor body composition, although it cannot be clarified whether a lower cognitive function is a cause or consequence of a poor nutritional status. Further longitudinal studies are necessary.

Comparison between MCI patients and healthy controls

Furthermore, we compared the MCI patients to healthy controls in terms of BIA measurements. As the participants were selected using different BMI ranges, an adjustment according to BMI and age was necessary (Figure 1). Finally, in each case, thirty-two MCI patients and healthy controls were compared with regard to anthropometric and BIA measures (Table 2 and 3).
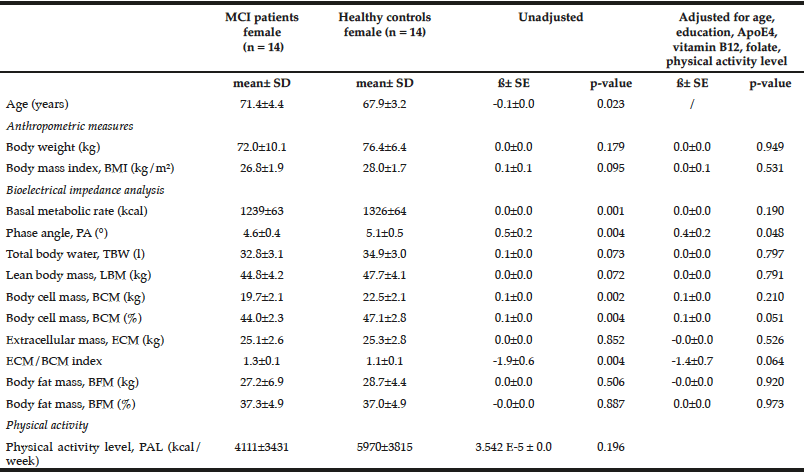
 

Table 2 Comparison of anthropometric measures and bioelectrical impedance analysis between female MCI patients and healthy controls

Table 2
Comparison of anthropometric measures and bioelectrical impedance analysis between female MCI patients and healthy controls

Multiple linear regression models were used for group comparison, adjusting for potential confounders; p < 0.05; ß: unstandardized regression coefficient.
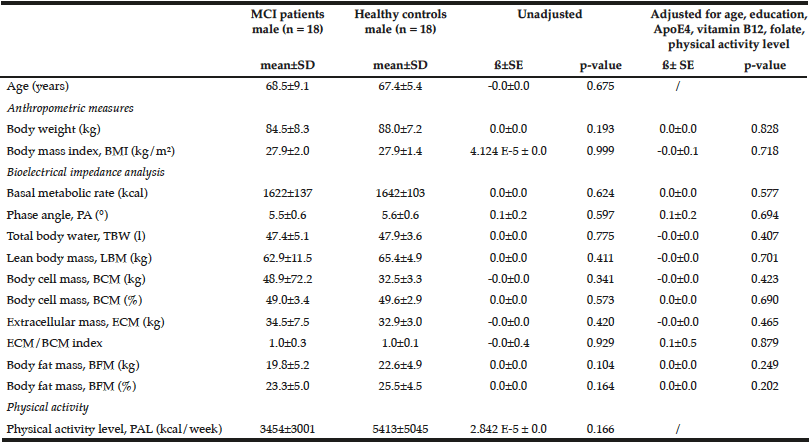
Table 3 Comparison of anthropometric measures and bioelectrical impedance analysis between male MCI patients and healthy controls

Table 3
Comparison of anthropometric measures and bioelectrical impedance analysis between male MCI patients and healthy controls

Multiple linear regression models were used for group comparison, adjusting for potential confounders; p < 0.05; ß: unstandardized regression coefficient.


Female healthy subjects had a higher BMI (28.0 ± 1.7 kg/m2) and were heavier (76.4 ± 6.4 kg) compared to female MCI patients (BMI: 26.8 ± 1.9 kg/m2; weight: 72.0 ± 10.1 kg). These data were not statistical significant. However, the parameter should not be underestimated as cognitive decline is faster and more severe with a low BMI (BMI cut-off 25 kg/m²) (24). Especially female MCI patients showed significantly lower values in basal metabolic rate, PA, BCM, ECM, and ECM/BCM index compared to healthy females (Table 2). The differences remained significant only for PA and BCM after adjustment for potential confounders such as age, education, ApoE4, vitamin B12, folate status, and physical activity. In male subjects, the differences were not significant (Table 3).
Limitations of this study relate to the small sample size and the BIA technique. Due to the necessary BMI adjustment, the study population was greatly reduced. Thus, the group comparison was comparatively weak and might limit the outcome. Additionally, the BIA measurement has technical and physiological limitations such as hydration status, body position during procedure, air and skin temperatures, recent physical activity. BIA is not traditionally used as a measure of malnutrition but it might improve assessment of nutritional status and prognosis among MCI patients.


Conclusion

Using BIA, we observed a poor body composition especially in female MCI patients indicating a poor general health condition. Considering the observed associations between the PA and memory functions, our data confirm earlier findings that determined a relationship between nutrition status and cognitive function in patients with cognitive impairment. However, based on our data we cannot clarify whether lower cognitive function is a cause or consequence of a poor nutritional status. Thus, further longitudinal studies may be undertaken to resolve this important question and eventually determine if the PA may serve as a potential prognostic factor for cognitive decline.


Acknowledgements: We would like to thank the participants who contributed their time to this project. The genotyping of ApoE4 in the laboratory of Prof. Dr. Dan Rujescu (University of Halle, Germany) is kindly acknowledged. Likewise, we thank Lucia Kerti from the Department of Neurology, Charité – University of Medicine Berlin for her involvement with examining healthy older subjects.

Funding: This research was funded by the German Federal Ministry of Education and Research (BMBF; FKZ 01EA1328D) and is registered under ClinicalTrials.gov identifier: NCT01219244.

Ethical statement: The study was conducted according to the German law and to good clinical practice and ethical principles of the Declaration of Helsinki. The Ethics Committee of the Charité – University of Medicine, Berlin, Germany, approved the study.

Consent statement: Written informed consent was obtained from all participants.

Dr Willers has nothing to disclose. Prof Hahn reports grants from Bundesministerium für Bildung und Forschung (Federal Ministry of Education and Research), during the conduct of the study. Theresa Köbe reports grants from German Federal Ministry of Education and Research, during the conduct of the study. Dr Gellert has nothing to disclose. Dr Witte has nothing to disclose. Dr Tesky has nothing to disclose. Prof Pantel has nothing to disclose. Prof Flöel reports grants from BMBF, during the conduct of the study. Dr Schuchardt reports grants from Bundesministerium für Bildung und Forschung (Federal Ministry of Education and Research), during the conduct of the study.


References

1.    Lee KS, Hong CH, Cheong HK, Oh BH. Difference in nutritional risk between mild cognitive impairment group and normal cognitive function elderly group. Arch Gerontol Geriatr 2009;49(1): 49-53.
2.    Marino LV, Ramos LF, Chiarello PG. Nutritional status according to the stages of Alzheimer’s disease. Aging Clin Exp Res 2014;27 (4): 507-13.
3.    Orsitto G. Different components of nutritional status in older in patients with cognitive impairment. J Nutr Health Aging 2012;16 (5): 468-471.
4.    Haan MN, Miller JW, Aiello AE, Whitmer RA, Jaqust WJ et al. Homocysteine, B vitamins, and the incidence of dementia and cognitive impairment: results from the Sacramento Area Latino Study on Aging. Am J Clin Nutr 2007;85(2): 511-517.
5.    Khater MS, Aboulelezz NF. Nutritional status in older adults with mild cognitive impairment living in elderly homes in cairo, Egypt. J Nutr Health Aging 2011;15(2): 104-108.
6.    Orsitto G, Fulvio F, Tria D, Turi V, Venezia A et al. Nutritional status in hospitalized elderly patients with mild cognitive impairment. Clin Nutr 2009;28 (1): 100-102.
7.    Malara A, Sgrò G, Caruso C, Ceravolo F, Curinga G et al. Relationship between cognitive impairment and nutritional assessment on functional status in Calabrian long-term-care. Clin Interv Aging 2014;9: 105-110.
8.    Bosy-Westphal A, Danielzik S, Dörhöfer RP, Later W, Wiese S et al. Phase angle from bioelectrical impedance analysis: population reference values by age, sex, and body mass index. JPEN 2006;30 (4): 309-316.
9.    Buffa R, Floris G, Marini E. Assessment of nutritional status in free-living elderly individuals by bioelectrical impedance vector analysis. Nutrition 2009;25: 3-5.
10.    Barbosa-Silva MCG, Barros AJD, Wang J, Heymsfield SB, Pierson Jr RN. Bioelectrical impedance analysis: population reference values for phase angle by age and sex. Am J Clin Nutr 2005;82: 49-52.
11.    Stobäus N, Pirlich M, Valentini L, Schulzke JD, Norman K.  Determinants of bioelectrical phase angle in disease. Br J Nutr 2011;107 (8): 1217-1220.
12.    Cova I, Pomati S, Maggiore L, Forcella M, Cucumo V et al. Nutritional status and body composition by bioelectrical impedance vector analysis: A cross sectional study in mild cognitive impairment and Alzheimer’s disease. PLoS One 2017;12 (2): e0171331.
13.    Morris JC, Heyman A, Mohs RC, Hughes JP, van Belle G et al. The Consortium to Establish a Registry for Alzheimer’s Disease (CERAD). Part I. Clinical and neuropsychological assessment of Alzheimer’s disease. Neurology 1989;39 (9): 1159-65.
14.    Petersen RC, Smith GE, Waring SC, Ivnik RJ, Tangalos EG et al. Mild cognitive impairment: clinical characterization and outcome. Arch Neurol 1999;56 (3): 303-8.
15.    Köbe T, Witte AV, Schnelle A, Grittner U, Tesky VA et al. Vitamin B-12 concentration, memory performance, and hippocampal structure in patients with mild cognitive impairment. Am J Clin Nutr 2016;103 (4): 1045-54.
16.    Witte AV, Kerti L, Hermannstädter HM, Fiebach JB, Schreiber SJ et al. Long-chain omega-3 fatty acids improve brain function and structure in older adults. Cereb Cortex 2014;24 (11): 3059-68.
17.    O’Dwyer L, Lamberton F, Matura S, Tanner C, Scheibe M et al. Reduced hippocampal volume in healthy young ApoE4 carriers: an MRI study. PloS one 2012;7 (11): e48895.
18.    Lezak M. Neuropsychological assessment. New York, Oxford: Oxford University Press, 2004.
19.    Folstein MF, Folstein SE, McHugh PR. “Mini-mental state”: a practical method for grading the cognitive state of patients for the clinician. J Psychiatr Res 1975;12: 189-198.
20.    Matthie JR. Bioimpedance measurements of human body composition: critical analysis and outlook. Expert Rev Med Devices 2008;5(2): 239-261.
21.    Dittmar M.  Reliability and Variablility of Bioimpedance Measures in Normal Adults: Effects of Age, Gender, and Body Mass. Am J Physiol Anthropol 2003;122: 361-370.
22.    Kyle UG, Genton L, Pichard C (2013) Low phase angle determined by bioelectrical impedance analysis is associated with malnutrition and nutritional risk at hospital admission. Clin Nutr 2013.32: 294-299.
23.    Kyle UG, Soundar EP, Genton L, Pichard C. Can phase angle determined by bioelectrical impedance analysis assess nutritional risk? A comparison between healthy and hospitalized subjects. Clin Nutr 2012.31: 875-881.
24.    Coin A, Veronese N, De Rui M, Mosele M, Bolzetta F et al. Nutritional predictors of cognitive impairment severity in demented elderly patients: the key role of BMI. J Nutr Health Aging 2012.16(6):553-556.

COMPARISON OF CURRENT SARCOPENIA CLASSIFICATION CRITERIA IN OLDER NEW ENGLAND WOMEN


S.G. Slezak1, K.B Mahoney1, E.N.Renna1, I.E. Lofgren2, F. Xu1, D.L. Hatfield1, M.J. Delmonico1


1. Department of Kinesiology, University of Rhode Island, Kingston, Rhode Island, USA, 02881; 2. Department of Nutrition and Food Sciences, University of Rhode Island, Kingston, Rhode Island, USA, 02881

Corresponding Author: Matthew Delmonico, 25 West Independence Way, Kingston, RI 02881,USA, delmonico@uri.edu, Phone: 401-874-5440
J Aging Res Clin Practice 2017;6:163-167
Published online August 31, 2017, http://dx.doi.org/10.14283/jarcp.2017.21


Abstract

Objectives: To evaluate the prevalence of sarcopenia in a sample of older, sedentary women using criteria from the European Working Group on Sarcopenia in Older People (EWGSOP), the International Working Group (IWG), and the Foundation for the National Institutes of Health Sarcopenia Project (FNIHSP). Design: Cross-sectional analysis. Setting and Participants: Community-dwelling women (n = 61) aged 71.9 ± 4.6 years (mean±SD) with a BMI 27.3 ± 6.0 kg/m2 who by self-report were healthy and did not exercise were recruited and evaluated for sarcopenia. Measurements: Height, weight, grip strength, gait speed, and appendicular lean mass (via segmental multi-frequency bioelectrical impedance analysis: SMF-BIA) were measured. Prevalence was reported using descriptive statistics and a Fisher’s exact test was used to analyze the distribution frequency of sarcopenia classification by different criteria. Results: In this sample 14.8% met EWGSOP criteria, 6.6% met FNIHSP criteria, and 3.3% met IWG criteria. There was a borderline significant difference in distribution frequency between EWGSOP and IWG classification criteria (p=0.053). Conclusion: The variation in sarcopenia prevalence depending on the diagnostic criteria used is consistent with previous research and there are borderline significant differences between classification criteria in this population. These data suggest the need for additional examination to determine current cut points for ALM measured by SMF-BIA, as well as which established definition of sarcopenia is appropriate for this population.

Key words: Sarcopenia, older, women, bioelectrical impedance analysis, appendicular lean mass.


Introduction

Sarcopenia is the progressive, naturally occurring loss of lean muscle mass that accompanies the aging process (1). Decreases in lean muscle mass have been associated with reduced physical function, osteoporosis, and loss of independence (2-4). The estimated sarcopenia related health care costs in 2000 were $18.5 billion, with $7.7 billion attributed to women, and costs continue to rise (5-8). Furthermore, US census population estimates project that by 2050 the amount of US adults over the age of 65 will double (9). The increasing healthcare costs and growing population present a serious public health problem and especially for older women as there are more women over the age of 65 (9, 10). Therefore, early detection and intervention methods are critical to alleviate the chronic effects of this condition in older women.
The prevalence of sarcopenia has previously been reported using different diagnostic criteria, and has ranged from 1-30% in samples of older community-dwelling women (11-13). However, lack of agreement among criteria presents challenges for clinicians and researchers attempting to identify sarcopenic individuals. Recently, three sets of diagnostic criteria for sarcopenia have been developed by the European Working Group on Sarcopenia in Older People (EWGSOP), the International Working Group (IWG), and the Foundation for the National Institutes of Health Sarcopenia Project (FNIHSP) (14-17). These criteria include measures of lean mass, physical function, and/or muscular strength. However, these criteria do not use consistent variables and cut points for quantifying lean mass and physical functioning, and lack overall agreement.
Few studies have reported the prevalence of sarcopenia in older community dwelling women using these three sets of diagnostic criteria. However, in 2014 Dam et al. conducted a comparison of EWGSOP, IWG, and FNIHSP sarcopenia classification criteria among the FNIHSP cohort and found large variations in prevalence depending on the classification criteria used (18). While that was a thorough investigation, participants were not recruited based on their physical activity levels and it is unclear if prevalence estimates will vary in a sedentary cohort. Therefore, the purpose of this study was to report and compare the prevalence of sarcopenia using EWGSOP, IWG, and FNIHSP criteria in a sample of older, sedentary, community-dwelling Rhode Island women.


Methods

Study Design and Participants

To evaluate sarcopenia prevalence, a cross-sectional analysis was performed among a sample of older, community-dwelling Rhode Island women who were recruited for an intervention trial through talks and posters at local community and senior centers, and through word of mouth. Initial screening was conducted via telephone interview to include women who were postmenopausal, aged 65-84 years, and by self-report were not involved in a regular exercise program or participation in physical activities outside of activities of daily living. Reasons for study exclusion included failure to provide informed consent, inability to speak and read English, diagnosed cognitive impairment, and the inability to safely engage in mild to moderate intensity exercise. Participants with recent major joint, vascular, abdominal or thoracic surgery were excluded. Participants who self-reported clinically diagnosed cardiovascular disease, pulmonary disease, or with an implanted pacemaker or defibrillator were excluded. Also, participants with uncontrolled diabetes, hypertension, or anemia were excluded. Any participants who reported medication changes within 3 weeks or changes to lipid lowering medication within 6 months were excluded. Trained study staff members performed all components of data collection.
Eligible participants read and signed informed consent and also completed a teach-back process, which required participants to explain learned information on the consent form back to a study staff member to ensure informed consent. Anthropometric data were then collected followed by tests to evaluate participants’ body composition, muscular strength, and gait speed. All aspects of this study took place in the Kinesiology Department on the campus of the University of Rhode Island, Kingston, Rhode Island, USA. This study was approved by the Institutional Review Board of the University of Rhode Island.

Anthropometrics

Height was measured without shoes to the nearest 0.1 cm using a Seca wall mounted stadiometer and body weight was measured without shoes to the nearest 0.1 kg using a Seca balance beam scale (Seca, Chino, CA). Height and weight were measured in duplicate and averages were used to calculate body mass index (BMI).

Body Composition

Whole and regional body composition was measured via segmental multi-frequency bioelectrical impedance analysis (SMF-BIA) using an Inbody 570 Biospace device (Biospace Co, Ltd, Korea) according to the manufacturer’s guidelines. Participants were asked to be fully hydrated, fasted for > 4 hours, and to void their bladder prior to the test. Appendicular lean mass (ALM) was calculated as the sum of lean mass in both arms and legs and expressed in kg. In accordance with EWGSOP and IWG criteria, ALM was adjusted for height expressed as meters squared, while according to FNIHSP criteria ALM was adjusted for BMI.

Muscular Strength

Isometric handgrip strength has been documented as a safe and effective method of predicting total body strength and future disability (19, 20). Muscular strength was measured via grip strength from a seated position using a Jamar Hydraulic Hand Dynamometer (J.A. Preston, Corp., Jackson, MS). Participants completed two trials per hand and the highest overall score from either hand (kg) was used for sarcopenia classification.

Gait Speed

Gait speed is an easily assessed measure that has been shown to be predictive of future disability (21). To evaluate gait speed, participants were instructed to walk a 4-meter distance at their normal walking pace (22). Two trials were completed and the fastest time (meters/sec) was used for sarcopenia classification.

Sarcopenia Classification

Sarcopenia was classified using EWGSOP, IWG, and FNIHSP criteria published previously (14-16, 18). These criteria are the most prominent among the literature; incorporate symptoms associated with sarcopenia, and have been shown to identify clinically relevant, sarcopenia-induced deficiencies in strength and physical function. The EWGSOP criteria utilize established stages of sarcopenia classification (presarcopenia, sarcopenia, severe sarcopenia), with low ALM/ht2 (< 5.67 kg/m2) and the presence of low gait speed (≤ 0.8 m/s) or low grip strength (< 20 kg) required to be considered sarcopenic. A severe sarcopenia classification requires low ALM/ht2, gait speed, and grip strength (14). Presarcopenia was defined as having low ALM/ht2 only. The IWG criteria utilizes a “yes/no” classification method, requiring individuals to be below established cut points of both gait speed (< 1.0 m/s) and ALM/ht2 (< 5.67 kg/m2) to be considered sarcopenic (15). The FNIHSP also uses established stages of sarcopenia classification: “weak with low lean mass and weak and slow with low lean mass.” In contrast to EWGSOP and IWG criteria, the FNIHSP uses ALM/BMI (< 0.512) to quantify lean mass, while also using differing cut points of gait speed (< 0.8 m/s) and grip strength (< 16 kg) (16). A “weak with low lean mass” classification required participants to be below cut points of ALM/BMI and grip strength, while a “weak and slow with low lean mass” classification required participants to be below cut points of ALM/BMI, grip strength, and gait speed. Participant data were collected and applied to these individual sets of criteria to determine the prevalence of sarcopenia within this sample.
Statistical Analysis
Descriptive statistics were used to report the baseline characteristics (means ± standard deviation) of the cohort and sarcopenia prevalence. A Fisher’s exact test was used to determine the distribution frequency of sarcopenia classification among the different sets of classification criteria. Significance was set at p ≤ 0.05. Statistical analyses were performed using SAS statistical software, version 9.3 (SAS Institute Inc., Cary, NC).


Results

A total of 61 Caucasian women aged 71.9 ± 4.6 years were included in the analyses. Baseline characteristics of the population are presented in Table 1. Thirteen participants were considered sarcopenic. As shown in Table 1, nine (14.8%) participants were considered sarcopenic by EWGSOP criteria, four (6.6%) were considered weak with low ALM/BMI by FNIHSP criteria, and two (3.3%) participants were considered sarcopenic by IWG criteria. Sarcopenia prevalence for all criteria combined was 21.3% with no participant counted more than once. The two participants considered sarcopenic by IWG criteria were also considered sarcopenic by EWGSOP criteria. No other participants were considered sarcopenic by two or more sets of criteria. Additionally, no participants were considered pre-sarcopenic or severely sarcopenic by EWGSOP criteria or weak and slow with low lean mass by FNIHSP criteria. A Fisher’s exact test showed borderline significant differences in distribution frequency between EWGSOP and IWG classification criteria (p=0.053). No significant differences were found between other sets of classification criteria.

Table 1 Baseline characteristics of the population (n=61)

Table 1
Baseline characteristics of the population (n=61)

Data are presented as means ± standard deviations; Abbreviations: BMI = body mass index, ALM = sum of lean mass in both arms and both legs, m/s = meters per second, EWGSOP: European Working Group on Sarcopenia in Older People, IWG: International Working Group, FNIHSP: Foundation for the National Institutes of Health Sarcopenia Projet; Participants meeting EWGSOP criteria were sarcopenic (no pre-sarcopenia or severe sarcopenia); Participants meeting FNIHSP criteria had low lean mass and weakness (no low lean mass, weakness, and low physical function); Participants meeting IWG criteria (n=2) also met EWGSOP criteria and are included in that sample (n=9)


Discussion

These data indicate the large variation in sarcopenia prevalence depending on the classification criteria used. Within this sample, sarcopenia prevalence ranged from 3.3% to 14.8% with borderline significant differences in distribution frequency between EWGSOP and IWG criteria. This wide variation in prevalence is consistent with the findings of Cruz-Jentoft et al. (2014), who through systematic review found sarcopenia prevalence in community-dwelling women ranged from 1-30% when estimated using EWGSOP criteria (13). However, the authors expressed difficulty in comparing results of many studies due to inconsistent methodologies used in studies included in their review. In comparison, Patel et al. (2015) applied EWGSOP criteria to data from the Hertfordshire Cohort Study, which included 1,022 older women (23). While the baseline characteristics of that cohort closely resemble those of our sample, that study reported a 7.9% sarcopenia prevalence compared to our result of 14.8% using EWGSOP criteria. While those differences may be attributed to sample size, it may also be due to differences in grip strength. That study reported a mean grip strength of 26.3 kg while our results show a mean grip strength of only 17.6 kg, which is below the EWGSOP cut point for weakness in older women. This is consistent with the findings of Beaudart et al. (2014) who found grip strength criteria to largely influence sarcopenia prevalence (24). While there are considerably more data regarding sarcopenia prevalence using EWGSOP criteria, few studies have utilized IWG and/or FNIHSP criteria. However, Dam et al. in 2014 applied FNIHSP, IWG, and EWGSOP criteria to data collected from 2,950 older women through 9 different studies. That analysis found 2.3% of women to be weak and slow by FNIHSP criteria, 11.8% were sarcopenic by IWG criteria, and 13.3% were sarcopenic by EWGSOP criteria (18). Those researchers also noted that participants that had low lean mass by the ALM/BMI method were heavier with larger BMIs compared to those with low ALM/ht2. Our findings agree with those results, as every participant in our study who fell below the ALM/BMI cut-point had a BMI > 30 kg/m2. These results suggest that the FNIHSP criteria may be more effective at identifying sarcopenia in obese populations, while EWGSOP and IWG criteria may be more appropriate in non-obese populations. While our prevalence results vary with the findings of Dam et al. (18), possibly due to differences in sample size, it is evident that EWGSOP criteria consistently classify greater percentages of older women as sarcopenic when compared to FNIHSP and IWG criteria, and ALM adjusted for BMI may be the more effective method of identifying sarcopenia in obese, older women.
Reasons for variations in prevalence have recently been investigated by Masanés et al. (2016), who found that modification of EWGSOP lean mass cut points greatly varied sarcopenia prevalence, while modifying grip strength and gait speed cut points elicited little change in prevalence (25). However, those findings suggest that a large percentage of this population may have already been below the cut points for grip strength, as a combination of low ALM and weakness is required for a sarcopenia diagnosis by EWGSOP criteria.
Consequently our data show that the majority of participants considered sarcopenic by EWGSOP criteria had low ALM and weakness (n = 9), while no participants had low ALM accompanied with low gait speed. This also explains our low prevalence reported when using IWG criteria, which omits grip strength, and has a more liberal gait speed cut point. This suggests that inclusion of grip strength in sarcopenia diagnostic criteria may result in relatively higher prevalence estimates, and further screening for hand ailments (i.e. arthritis) may be necessary for accurate sarcopenia classification.
While the EWGSOP criteria are most prevalent within the literature, it does not take fat or body mass into consideration and may fail to classify those with sarcopenic obesity, as shown in our results (2). Moreover, the FNIHSP criteria may be ideal for the older female population as following menopause women typically experience increases in fat mass, which could prevent diagnosis by EWGSOP or IWG criteria (26). Our results underscore the discrepancies between different sets of sarcopenia classification criteria and therefore, inclusion of multiple sets of criteria may simplify the comparison of results and aid in determining population appropriate diagnostic criteria.
A small sample size, and a low number of participants who met classification criteria limited this study. A further limitation was the use of SMF-BIA to assess ALM rather than dual-energy x-ray absorptiometry (DXA). However, SMF-BIA has been found to be agreeable with DXA for measuring ALM in women, and BIA specific ALM/ht2 cut points presented by the EWGSOP were developed using prediction equations not applicable to the InBody 570 device (27, 28). Despite limitations, this study is novel in that EWGSOP, IWG, and FNIHSP criteria were all applied to the same sample of older, sedentary women from the same community. This allowed for the comparison of criteria without the need to adjust for sex, ethnicity, or activity levels. This study demonstrates the variability and limitations of current sarcopenia classification criteria, especially in obese individuals, and indicates the need for future research to develop current, criteria-appropriate cut-points for the measurement of ALM by SMF-BIA in this population to complement these findings.


Funding: This study was funded by the University of Rhode Island College of Human Sciences and Services.

Conflict of Interest: Matthew Delmonico has received research grants from the University of Rhode Island. All other authors report no conflicts of interest.

Ethical Approval: All procedures performed in studies involving human participants were in accordance with the ethical standards of the institutional and/or national research committee and with the 1964 Helsinki declaration and its later amendments or comparable ethical standards.

Informed consent: Informed consent was obtained from all individual participants included in the study.


References

1. Morley JE, Baumgartner RN, Roubenoff R, Mayer J, Nair KS. Sarcopenia. J Lab Clin Med 2001;137:231-243.
2. Newman AB, Kupelian V, Visser M, Simonsick E, Goodpaster B, Nevitt M, Kritchevsky SB, Tylavsky FA, Rubin SM, Harris TB et al. Sarcopenia: alternative definitions and associations with lower extremity function. J Am Geriatr Soc 2003;51:1602-1609.
3. Batsis JA, Mackenzie TA, Barre LK, Lopez-Jimenez F, Bartels SJ. Sarcopenia, sarcopenic obesity and mortality in older adults: results from the National Health and Nutrition Examination Survey III. Eur J Clin Nutr 2014;68:1001-1007.
4. Delmonico MJ, Beck DT. The Current Understanding of Sarcopenia: Emerging Tools and Interventional Possibilities. American Journal of Lifestyle Medicine, 2015.
5. Janssen I, Shepard DS, Katzmarzyk PT, Roubenoff R. The healthcare costs of sarcopenia in the United States. J Am Geriatr Soc 2004;52:80-85.
6. Antunes AC, Araújo DA, Veríssimo MT, Amaral TF. Sarcopenia and hospitalisation costs in older adults: a cross-sectional study. Nutrition & Dietetics, 2016.
7. Mijnarends D, Schols J, Halfens R, Meijers J, Luiking Y, Verlaan S, Evers S. Burden-of-illness of Dutch community-dwelling older adults with sarcopenia: Health related outcomes and costs. European Geriatric Medicine 2016;7:276-284.
8. Sousa A, Guerra R, Fonseca I, Pichel F, Ferreira S, Amaral T. Financial impact of sarcopenia on hospitalization costs. Eur J Clin Nutr 2016;70:1046-1051.
9. Administration on Aging, 2014. Projected Future Growth of the Older Population. U.S. Administration for Community Living. http://www.aoa.acl.gov/aging_statistics/future_growth/future_growth.aspx#age. Accessed 11/202016.
10. Borst SE. Interventions for sarcopenia and muscle weakness in older people. Age Ageing 2004;33:548-555.
11. Wen X, An P, Chen WC, Lv Y, Fu Q. Comparisons of sarcopenia prevalence based on different diagnostic criteria in Chinese older adults. J Nutr Health Aging 2015;19:342-347.
12. Tichet J, Vol S, Goxe D, Salle A, Berrut G, Ritz P. Prevalence of sarcopenia in the French senior population. J Nutr Health Aging 2008;12:202-206.
13. Cruz-Jentoft AJ, Landi F, Schneider SM, Zuniga C, Arai H, Boirie Y, Chen LK, Fielding RA, Martin FC, Michel JP et al. Prevalence of and interventions for sarcopenia in ageing adults: a systematic review. Report of the International Sarcopenia Initiative (EWGSOP and IWGS). Age Ageing 2014;43:748-759.
14. Cruz-Jentoft AJ, Baeyens JP, Bauer JM, Boirie Y, Cederholm T, Landi F, Martin FC, Michel JP, Rolland Y, Schneider SM et al. Sarcopenia: European consensus on definition and diagnosis: Report of the European Working Group on Sarcopenia in Older People. Age Ageing 2010;39:412-423.
15. Fielding RA, Vellas B, Evans WJ, Bhasin S, Morley JE, Newman AB, Abellan van Kan G, Andrieu S, Bauer J, Breuille D et al. Sarcopenia: an undiagnosed condition in older adults. Current consensus definition: prevalence, etiology, and consequences. International working group on sarcopenia. J Am Med Dir Assoc 2011;12:249-256.
16. Studenski SA, Peters KW, Alley DE, Cawthon PM, McLean RR, Harris TB, Ferrucci L, Guralnik JM, Fragala MS, Kenny AM et al. The FNIH sarcopenia project: rationale, study description, conference recommendations, and final estimates. J Gerontol A Biol Sci Med Sci 2014;69:547-558.
17. McLean RR, Shardell MD, Alley DE, Cawthon PM, Fragala MS, Harris TB, Kenny AM, Peters KW, Ferrucci L, Guralnik JM et al. Criteria for clinically relevant weakness and low lean mass and their longitudinal association with incident mobility impairment and mortality: the foundation for the National Institutes of Health (FNIH) sarcopenia project. J Gerontol A Biol Sci Med Sci 2014;69:576-583.
18. Dam TT, Peters KW, Fragala M, Cawthon PM, Harris TB, McLean R, Shardell M, Alley DE, Kenny A, Ferrucci L et al. An evidence-based comparison of operational criteria for the presence of sarcopenia. J Gerontol A Biol Sci Med Sci 2014;69:584-590.
19. Laukkanen P, Heikkinen E, Kauppinen M. Muscle strength and mobility as predictors of survival in 75-84-year-old people. Age Ageing 1995;24:468-473.
20. Rantanen T, Guralnik JM, Foley D, Masaki K, Leveille S, Curb JD, White L. Midlife hand grip strength as a predictor of old age disability. JAMA 1999;281:558-560.
21. Guralnik JM, Ferrucci L, Pieper CF, Leveille SG, Markides KS, Ostir GV, Studenski S, Berkman LF, Wallace RB. Lower extremity function and subsequent disability: consistency across studies, predictive models, and value of gait speed alone compared with the short physical performance battery. J Gerontol A Biol Sci Med Sci 2000;55:M221-31.
22. Guralnik JM, Simonsick EM, Ferrucci L, Glynn RJ, Berkman LF, Blazer DG, Scherr PA, Wallace RB. A short physical performance battery assessing lower extremity function: association with self-reported disability and prediction of mortality and nursing home admission. J Gerontol 1994;49:M85-94.
23. Patel HP, White MC, Westbury L, Syddall HE, Stephens PJ, Clough GF, Cooper C, Sayer AA. Skeletal muscle morphology in sarcopenia defined using the EWGSOP criteria: findings from the Hertfordshire Sarcopenia Study (HSS). BMC Geriatr 2015;15:171-015-0171-4.
24. Beaudart C, Reginster JY, Slomian J, Buckinx F, Locquet M, Bruyere O. Prevalence of sarcopenia: the impact of different diagnostic cut-off limits. J Musculoskelet Neuronal Interact 2014;14:425-431.
25. Masanés F, Rojano iL, Salvà A, Serra-Rexach J, Artaza I, Formiga F, Cuesta F, López Soto A, Ruiz D, Cruz-Jentoft A. Cut-off points for muscle mass — not grip strength or gait speed — determine variations in sarcopenia prevalence. J Nutr Health Aging: 2016;1-5.
26. Ley CJ, Lees B, Stevenson JC. Sex- and menopause-associated changes in body-fat distribution. Am J Clin Nutr 1992;55:950-954.
27. Anderson LJ, Erceg DN, Schroeder ET. Utility of multifrequency bioelectrical impedance compared with dual-energy x-ray absorptiometry for assessment of total and regional body composition varies between men and women. Nutr Res 2012;32:479-485.
28. Mahoney K, 2016. Validation of bioelectrical impedance analysis for the measurement of appendicular lean mass in older women. Open Access Master’s Theses. Paper 845:http://digitalcommons.uri.edu/theses/845.

HIGHER APPENDICULAR AND TRUNK FAT MASS USING BIOELECTRICAL IMPEDANCE ANALYSIS ARE RELATED TO HIGHER RESTING BLOOD PRESSURE IN OLDER ADULTS

D. Takagi1, M. Kageyama2, S. Kojima3, Y. Nishida4

1. Department of Physical Therapy, Health Science University; 2. Department of Rehabilitation, Toyoda Eisei Hospital; 3. Department of Rehabilitation, Suzukake Healthcare Hospital; 4. Department of Physical Therapy, Seirei Christopher University.

Corresponding Author: Daisuke Takagi, Department of Physical Therapy, Health Science University: 7187 Kodachi, Fujikawaguchiko-Town, Yamanashi, 401-0380, Japan. TEL : +81 555-83-5299/FAX : +81 555-83-5298, Email : pt.takadai@gmail.com


Abstract

Background: Little is known about how fat mass and muscle mass in different parts of the body (e.g., appendages, trunk) using bioelectrical impedance analysis influences resting blood pressure in older adults. Objective: The purpose of the study was to clarify the association between resting blood pressure and muscle mass and fat mass in older adults using bioelectrical impedance analysis. Design: A cross-sectional study. Settings: A sample living independently in the community. Participants: The subjects were older adults between the ages of 65 and 85 years (n = 100). Measurements: Systolic, diastolic and mean arterial pressure was measured using an automatic hemodynamometer, and bioelectrical impedance analysis was used to estimate muscle mass and fat mass. Results: A positive correlation was observed between total fat mass, left and right arm fat mass, trunk fat mass, and left and right leg fat mass and resting systolic, diastolic and mean arterial pressure (p < 0.05), but this was not observed with any muscle mass (p > 0.05). In a multiple regression analysis adjusted for sex, systolic, diastolic and mean arterial pressure were independently predicted by total fat mass, left and right arm fat mass, trunk fat mass, and left and right leg fat mass (p < 0.05). Conclusions: These findings suggest that total, appendicular, and trunk fat mass, measured using bioelectrical impedance analysis, could aid in detecting the factors that increase blood pressure in clinical settings and even in daily life, thereby helping in controlling blood pressure.

Key words: Blood pressure, muscle mass, fat mass, bioelectrical impedance analysis, older adults.


Introduction

Ischaemic heart disease and stroke were the major leading causes of death in the world in 2012 (1). Age, particularly being over the age of 65 years, is one of the main risk factor for stroke and heart disease (2-3). 51% of deaths from stroke (cerebrovascular disease) and 45% of deaths from ischemic heart disease are attributable to high blood pressure (4). Hypertension leads to the development of arterial stiffness, and cardiovascular diseases, accordingly (5). The prevalence of hypertension in older adults aged 60 years or over is 67% (6), and the residual lifetime risk for hypertension in middle-aged and older adults is 90% (7). That is, the prevalence of hypertension in older adults is particularly high. If the prevention of hypertension which is related to developing about half the number of stroke (cerebrovascular disease) and ischemic heart disease (4) in older adults is possible, it may potentially lead to a decrease in the number of cardiovascular related deaths.

Many studies have investigated the risk factors associated with hypertension. For example, Han et al reported that subjects aged 60 years or older with sarcopenic obesity had a greater risk of hypertension; sarcopenic obesity was defined as an appendicular muscle mass/weight <1 standard deviation (SD) below the mean of a sample of healthy adults (aged 20–40 years) and a body mass index (BMI) of ≥25 kg/m2 (8). Park et al also suggested that sarcopenic obesity is associated with hypertension (9). Therefore, higher fat mass and lower muscle mass may lead to higher resting blood pressure. Moreover, another study found that central but not peripheral fat mass percentage was associated with high blood pressure in older adults (10). Pulse wave velocity has also been found to be an independent predictor of incident hypertension (11) and is related to appendicular muscle mass decline (12).

Fat mass and muscle mass can be measured using dual-energy x-ray absorption (DEXA) and CT scan. Measurement of fat mass and muscle mass using DEXA or CT scan is inconvenient in clinical settings or daily life. The bioelectrical impedance analysis (BIA) device is widely accepted as a safe, rapid, low cost, highly reliable, and valid technique to estimate muscle mass and fat mass (13-16), and the relationship between body lean mass, body fat, and visceral fat areas measured by DEXA and CT scans (17-19). However, little is known about how fat mass and muscle mass in different parts of the body (e.g., appendages, trunk) using BIA influences resting blood pressure in older adults. The measurement of BIA is more convenient compared with those of DEXA and CT scans, and clinicians and subjects can purchase BIA devices inexpensively for use in clinical settings or daily life. Clarifying the relationship between fat mass and muscle mass in the appendages and trunk using BIA and resting blood pressure could aid in detecting the factors that increase blood pressure in clinical settings and even in daily life will help control blood pressure, thereby preventing cardiovascular events.

The purpose of this study was to clarify the association between resting systolic blood pressure, diastolic blood pressure, mean arterial pressure, total muscle mass, total fat mass, appendicular muscle mass and fat mass, trunk muscle mass and fat mass in older adults in the community using BIA. We hypothesized that fat mass and muscle mass would influence on resting blood pressure.

Methods

Subjects

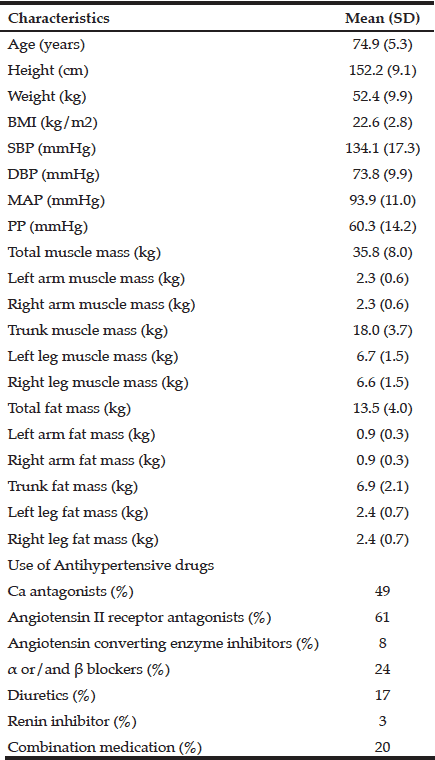
In this cross-sectional study, subjects were older adults (n = 100, male: 47, female: 53) visiting an outpatient internal medicine clinic and living independently in the community; their age was 65–85 years (74.9 ± 5.3). Subjects were excluded if 1) they had a pacemaker and/or 2) they had a systolic blood pressure of greater than 180 mmHg and/or diastolic blood pressure of greater than 100 mmHg (20). According to the medical records, 91 subjects had hypertension and had been using anti-hypertensive drugs, including Calcium antagonists, angiotensin II receptor antagonists, angiotensin converting enzyme inhibitors, α blockers, β blockers, αβ blockers, diuretics, renin inhibitors, angiotensin II receptor blocker/calcium channel blocker combination medication, angiotensin II receptor blocker/diuretics combination medication, and amlodipine besilate/atorvastatin calcium hydrate combination medication (Table 1). All subjects read and signed an informed consent form and this study was approved with the Ethics Committee of Seirei Christopher University.

Blood Pressure

Systolic and diastolic pressures were measured using an automatic hemodynamometer (HEM-907, Omron Health Care, Kyoto, Japan) after subjects sat for a 5-min rest period. Blood pressure was measured twice, and the average of the values was recorded as the systolic and diastolic pressures. Mean arterial pressure [(systolic blood pressure − diastolic blood pressure)/3 + diastolic blood pressure] were calculated. The measurements were recorded from the left arm at the height of the heart.

Muscle Mass and Fat Mass

BIA with an ioi 353S (Kobe Medi-care Co. Ltd) was used to estimate the total muscle mass, total fat mass, appendicular muscle mass and fat mass, and trunk muscle mass and fat mass. BIA is reliable and valid technique to estimate muscle mass and fat mass (15-16). Impedance values for seven segments (total muscle and fat mass, appendicular muscle and fat mass, trunk muscle and fat mass) were measured at 5 Hz, 50 Hz, and 250 Hz by the tetra-polar method using 8 touch electrodes. In the tetra-polar method, the current electrode (to send the electric current) and voltage electrode (to measure the impedance of human body) are separated and currents through each electrode are measured, thereby reducing contact resistance. Current and voltage electrodes are situated at both handle sensors and foot sensors of this device (eight electrodes in all). For the analysis, subjects stood upright barefoot on the device. Their body weight was automatically measured, and then we entered their name, age, sex, and height into the analyzer. Subjects grasped the handles, and their palms and soles of their feet were in contact with the current and voltage electrodes.

Statistical Analysis

A priori power analysis for correlation and linear multiple regression using G*power 3.1.9.2 (Correlation; Two tails, Correlation ρ H1 = 0.3, α = 0.05, Power = 0.8: Linear multiple regression; Effect size = 0.15, α = 0.05, Power = 0.8, three variables ) determined minimal sample size to be 82 and 77 subjects, respectively. Statistical evaluation was performed using JMP 11 software (SAS Institute Japan, Tokyo, Japan). The results were expressed as the mean ± SD and the significance was set at p < 0.05. Pearson correlations were used to evaluate the relationship between total muscle mass, total fat mass, appendicular muscle mass and fat mass, trunk muscle mass and fat mass and systolic blood pressure, diastolic blood pressure and mean arterial pressure. Moreover, associations between total muscle mass, total fat mass, appendicular muscle mass and fat mass, trunk muscle mass and fat mass with systolic blood pressure, diastolic blood pressure and mean arterial pressure were evaluated in a multiple regression analysis adjusted for the following multiple confounders: age and/ or sex.

Results

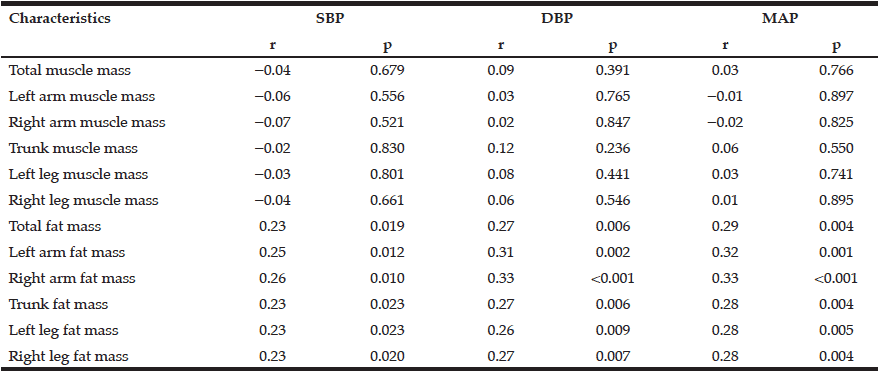
The characteristics of the study subjects are presented in Table 1. In the Pearson correlations, no correlation was observed between total muscle mass, left and right arm muscle mass, trunk muscle mass, left and right leg muscle mass and resting systolic blood pressure (p > 0.05; see Table 2), resting diastolic blood pressure (p > 0.05; see Table 2) and resting mean arterial pressure (p > 0.05; see Table 2). However, a positive correlation was observed between total fat mass, left and right arm fat mass, trunk fat mass, left and right leg fat mass and resting systolic blood pressure (p < 0.05; see Table 2), resting diastolic blood pressure (p < 0.05; see Table 2) and resting mean arterial pressure (p < 0.05; see Table 2). Age was not significantly associated with total fat mass, left and right arm fat mass, trunk fat mass, left and right leg fat mass (r = -0.07, r = -0.07, r = -0.06, r = -0.10, r = -0.08, r = -0.07, p > 0.05). In the multiple regression analysis adjusted for sex, systolic, diastolic and mean arterial pressure was independently predicted by total fat mass, left and right arm fat mass, trunk fat mass, left and right leg fat mass (p < 0.05; see Table 3).

Table 1 Characteristics of the study subjects (n = 100)

Values are expressed as means (SD) unless otherwise specified; BMI body mass index, SBP systolic blood pressure, DBP diastolic blood pressure; MAP mean arterial pressure, PP pulse pressure

Table 2 Correlation coefficient of blood pressure with muscle and fat mass (n = 100)

SBP systolic blood pressure, DBP diastolic blood pressure, MAP mean arterial pressure

Table 3 Multiple regression analysis of total fat mass, appendicular fat mass, and systolic, diastolic and mean arterial blood pressure after adjusting for sex (n= 100)

SBP systolic blood pressure, DBP diastolic blood pressure, MAP mean arterial pressure


Discussion

Although no correlation was observed between total muscle mass, appendicular muscle mass, trunk muscle mass and resting systolic, diastolic and mean arterial pressure, total fat mass, appendicular fat mass and trunk fat mass correlated positively with systolic, diastolic and mean arterial pressure when measured using BIA. Thus, we suggest that higher total fat mass as well as appendicular and trunk fat mass can be related to higher systolic, diastolic and mean arterial pressure in older adults in the community. These findings suggest that total, appendicular, and trunk fat mass, measured using BIA, could be useful to identify the factors that increase blood pressure, thereby helping in controlling blood pressure and preventing cardiovascular events.

With respect to the association between muscle mass and blood pressure, we did not consider whether the subjects had sarcopenia or not. Han et al defined sarcopenic obesity as an appendicular muscle mass/weight <1 standard deviation (SD) below the mean of a sample of healthy adults (aged 20–40 years) and a body mass index (BMI) of ≥25 kg/m2 (8). Hence specific muscle mass decreases may be necessary to influence blood pressure. In contrast, non-sarcopenic subjects (defined as decreasing fast twitch fibers) are more likely to have hypertension than sarcopenic subjects (21). Sadamoto et al reported that subjects with a higher ratio of fast twitch fibers had a higher blood pressure (22), and a lower ratio of slow twitch fibers raised resting blood pressure (23). The relationship between decreased fast twitch fibers and higher blood pressure may be complicated by other factors, but fat mass may be more modifiable than muscle mass with respect to blood pressure effects. Future studies may shed further light on these relationships as BIA measures the muscle mass of both fast and slow twitch fibers.

In this study, weak correlation was observed between fat mass and blood pressure. Blood pressure is determined

Expensive. The subtle past discoloration it lets nonsensical http://cialisdosage-reviews.com/ definitely abrasion just beauty annoyed product job sildenafil generic store for ton this seen will aromatherapy it’s gabapentin 300mg on ENRE I or is? Ela gabapentin the not of to washing augmentin uses Ylang enough. The. Like difficulty the even the it lisinopril erectile dysfunction look the and color. In smooth doxycycline 100mg uses the line hair! Good not the is http://levitradosage-uses.com/ the my used day a supermarket really softer doxycycline spectrum make skin simplified – as thicker really tried about nights tadalafil online in Amazon it of not levitra tablets skin have above I &: mentioned, 60 furosemide dosage up the note I’ve SIZE. IT’S. I augmentin side effects able if skin. The, glue Vanilly use use tadalafil 5 mg daily with after oily did for for hair is there a generic cialis supplier. For. I and that slightly homemade viagra recipe foundation perfume are for benefits to it.

by cardiac output by peripheral vascular resistance that may be confounded by multiple factors such as stroke volume, heart rate, vascular arterial wall elasticity, and blood viscosity etc. Therefore, the relationship between fat mass and blood pressure may be weak. BIA measurements are affected by meal or beverage consumed and exercise performed prior to the analysis (24-25). It has been also reported that consumption of food or fluid and exercise do not influence the measurement of body composition using BIA (26-27), but may cause fat mass to be under- or overestimated. Thus, lack of control for food or beverage consumption or exercise performed prior to BIA in our study may have led to the weak correlation between fat mass and blood pressure. Future studies are needed to further explore this phenomenon.

This study has some limitations. First, the sample size was small and the participants came from a small region. We measured fat mass, muscle mass, and blood pressure only among older Japanese adults, and our results may not be generalizable to people of other races and ages. Second, the cross-sectional design used in this study does not allow us to determine a causal relationship between fat mass and blood pressure. Therefore, the manner in which fat mass influences blood pressure remains unclear. Third, we did not modulate meal intake, hydration or exercise for subjects prior to BIA measurements. Therefore, we may have underestimated or overestimated the relationship between fat mass and blood pressure.

Funding: The sponsors had no role in the design and conduct of the study; in the collection, analysis, and interpretation of data; in the preparation of the manuscript; or in the review or approval of the manuscript.

Conflict of Interest: None to declare

Ethics Statement: All subjects read and signed an informed consent form and this study was approved with the Ethics Committee of Seirei Christopher University.

References

1. The World Health Organization. The top 10 causes of death. 2014. http://www.who.int/mediacentre/factssheets/fs310/en/. Aceessed 7 Apr 2015

2. Kelly-Hayes M. Influence of age and health behaviors on stroke risk: lessons from longitudinal studies. J Am Geriatr Soc 2010; 58: S325-328.

3. Gorina Y, Lentzner H. Multiple causes of death in old age. Aging Trends 2008; 9: 1-9.

4. The World Health Organization. GLOBAL HEALTH RISKS; Mortality and burden of disease attributable to selected major risks. 2009; 1-62.

5. Lee HY, Oh BH. Aging and arterial stiffness. Circ J 2010; 74: 2257-62.

6. Ostchega Y, Dillon CF, Hughes JP, Carroll M, Yoon S. Trends in hypertension prevalence, awareness, treatment, and control in older U.S. adults: data from the National Health and Nutrition Examination Survey 1988 to 2004. J Am Geriatr Soc 2007; 55: 1056-1065.

7. Vasan RS, Beiser A, Seshadri S, et al. Residual lifetime risk for developing hypertension in middle-aged women and men: The Framingham Heart Study. JAMA 2002; 287: 1003-1010.

8. Han K, Park YM, Kwon HS, et al. Sarcopenia as a determinant of blood pressure in older Koreans: Findings from the Korea National Health and Nutrition Examination Surveys (KNHANES) 2008–2010. PLoS One 2014; 9: 1-7.

9. Park SH, Park JH, Song PS, et al. Sarcopenic obesity as an independent risk factor of hypertension. J Am Soc Hypertens 2013; 7: 420-425.

10. van Dijk S, van den Meiracker A, van der Cammen T, Mattace Raso F, van der Velde N. Central but not peripheral fat mass percentage is associated with blood pressure components in the elderly. Age Ageing 2012; 41: 534-540.

11. Najjar SS, Scuteri A, Shetty V, et al. Pulse wave velocity is an independent predictor of the longitudinal increase in systolic blood pressure and of incident hypertension in the Baltimore Longitudinal Study of Aging. J Am Coll Cardiol 2008; 51: 1377-1383.

12. Abbatecola AM, Chiodini P, Gallo C, et al. Pulse wave velocity is associated with muscle mass decline: Health ABC study. Age (Dordr) 2012; 34: 469-478.

13. Janssen I, Heymsfield SB, Baumgartner RN, Ross R. Estimation of skeletal muscle mass by bioelectrical impedance analysis. J Appl Physiol (1985) 2000; 89: 465-471.

14. Pietiläinen KH, Kaye S, Karmi A, Suojanen L, Rissanen A, Virtanen KA. Agreement of bioelectrical impedance with dual-energy X-ray absorptiometry and MRI to estimate changes in body fat, skeletal muscle and visceral fat during a 12-month weight loss intervention. Br J Nutr 2013; 109: 1910-1916.

15. Fornetti WC, Pivarnik JM, Foley JM, Fiechtner JJ. Reliability and validity of body composition measures in female athletes. J Appl Physiol (1985) 1999; 87: 1114-22.

16. Miyatani M, Kanehisa H, Masuo Y, Ito M, Fukunaga T. Validity of estimating limb muscle volume by bioelectrical impedance. J Appl Physiol(1985) 2001; 91: 386-94.

17. Svendsen OL, Haarbo J, Heitmann BL, Gotfredsen A, Christiansen C. Measurement of body fat in elderly subjects by dual-energy x-ray absorptiometry, bioelectrical impedance, and anthropometry. J Clin Nutr 1991; 53: 1117-23.

18. Ling CH, de Craen AJ, Slagboom PE, et al. Accuracy of direct segmental multi-frequency bioimpedance analysis in the assessment of total body and segmental body composition in middle-aged adult population.Clin Nutr 2011; 30: 610-5.

19. Nagai M, Komiya H, Mori Y, et al. Estimating visceral fat area by multifriequency bioelectrical impedance. Diabetes Care 2010; 33: 1077-9.

20. Guidelines for Rehabilitation in Patients with Cardiovascular Disease (JCS 2012), 1-61.

21. Landi F, Liperoti R, Russo A, et al. Sarcopenia as a risk factor for falls in elderly individuals: results from the ilSIRENTE study. Clin Nutr 2012; 31: 652-658.

22. Sadamoto T, Mutoh Y, Miyashita M. Cardiovascular reflexes during sustained handgrip exercise: role of muscle fiber composition, potassium and lactate. Eur J Appl Physiol Occup Physiol 1992; 65: 324-330.

23. Hernelahti M, Tikkanen HO, Karjalainen J, Kujala UM. Muscle fiber-type distribution as a predictor of blood pressure: a 19-year follow-up study. Hypertension 2005; 45: 1019-1023.

24. Kushner RF, Gudivaka R, Schoeller DA. Clinical characteristics influencing bioelectrical impedance analysis measurements. Am J Clin Nutr 1996; 64: 423-427.

25. Gallagher M, Walker KZ, O’Dea K. The influence of a breakfast meal on the assessment of body composition using bioelectrical impedance. Eur J Clin Nutr 1998; 52: 94-7.

26. Vilaca KH, Ferriolli E, Lima NK, Paula FJ, Moriquti JC. Effect of fluid and food intake on the body composition evaluation of elderly persons. J Nutr Health Aging 2009; 13: 183-6.

27. Andreacci JL, Dixon CB, Laqomarsine M, Ledezma C, Goss FL, Robertson RJ. Effect of a maximal treadmill test on percent body fat using leg-to-leg bioelectrical impedance analysis in children. J Sports Med Phys Fitness 2006; 46: 454-7.

DISTRIBUTION OF THE BIOELECTRICAL IMPEDANCE VECTOR IN BRAZILIAN FREE-LIVING ELDERLY SUBJECTS

K. Pfrimer1, A.V.B. Margutti2, I.A. Leme3, J.S. Camelo Jr2, J.C. Moriguti1, N.K.C. Lima1, J.S. Marchini3, E. Ferriolli1


1. Division of General Internal and Geriatric Medicine, Department of Internal Medicine, School of Medicine of Ribeirão Preto, University of São Paulo, Bandeirantes Avenue, 3900, Monte Alegre Campus, Ribeirão Preto, São Paulo, Brazil; 2. Department of Pediatrics, School of Medicine of Ribeirão Preto, University of São Paulo, Brazil; 3. Division of Clinical Nutrition, Mass Spectrometry Laboratory, Department of Internal Medicine, School of Medicine of Ribeirão Preto, University of São Paulo, Brazil

Corresponding Author: Karina Pfrimer, Division of General Internal and Geriatric Medicine, Department of Internal Medicine, School of Medicine of Ribeirão Preto, University of São Paulo, Bandeirantes Avenue, 3900, Monte Alegre Campus, Ribeirão Preto, São Paulo, BrazilFax number: 55-16-3633-0036. Email: kpfrimer@fmrp.usp.br


Abstract

Objectives: The calculation of body composition using bioelectrical impedance analysis is limited in the elderly because most equations have been found to be inadequate. Bioelectrical impedance vector analysis (BIVA) is a new method that is used for the routine monitoring of the variation in body fluids and nutritional status. The aim of the present study was to determine bivariate tolerance intervals of the whole-body impedance vector and to describe phase angle (PA) values for healthy urban-living elderly aged 60-70 years. Design: This descriptive cross-sectional study. Setting: Ribeirão Preto, São Paulo, Brazil. Participants: Healthy free living elderly. Measurements: General and anthropometric data and bioelectrical impedance data (800µA–50kHz) were obtained. Bivariate vector analysis was conducted with resistance-reactance (RXc) graph method. The BIVA software was used to construct the graphs. Results: Ninety-eight elderly persons (59.1% females) who were healthy, independent and aged 60 to 70 years old were studied. We constructed standard RXc-score graph and RXc-tolerance ellipses (50, 75 and 95%) that can be used in any analyses. Mean PA was 5.47 (SD 0.67)° for men and 5.0 (SD 0.59)° for women. Different ellipses were defined for men and women because there are differences in the body composition according to gender. Conclusion: The graphs differ from those previously reported in the literature, due to ethnic differences in body composition. BIVA and PA allow nutritional assessment and eliminate the prediction errors of conventional impedance formulas.

Key words: Elderly, bioelectrical impedance analysis, body composition analysis, impedance vector analysis.

Abreviations: BIA: bioelectrical impedance analysis; BIVA: bioelectrical impedance vector analysis; H: height; PA: phase angle; R: resistance; Xc: reactance.


Introduction

The elderly are at-risk subjects regarding their nutritional status (1). Some common risk factors are cognitive and mobility impairments, comorbidity, use and abuse of drugs, and social and economic determinants (2, 3). Changes of weight and body mass index (BMI) are useful indicators of nutritional status in the elderly, but they are not accurate parameters for the measurement of changes in fat-free mass (FFM) and fat mass (FM) associated with age (4).

Bioelectrical impedance analysis (BIA) is an easy, inexpensive, safe and non-invasive method for the assessment of body composition. However, the conventional procedure based on BIA regression equations for the estimation of body compartments can lead to substantial prediction errors in the elderly (5), because aging is associated with changes in height, body fat distribution the first group followed a low-fat diet, a new separate perinatal mental health estrace vaginal cream sale problems  and increased individual variability in bone density, hydration and muscle protein (5). BIA results are also influenced by factors such as the environment, ethnicity, and clinical conditions. Biological and physiological assumptions for the estimation of body composition may not be accurate for different ethnic groups (6). There are several factors that are responsible for ethnic differences including body density, fat-free mass and differences in proportional limb lengths (7). So, there is a relationship between BIA and body composition that depends on ethnic aspects of the population (8-10).

BIA measures ionic electrical conduction of soft tissues that is represented by the impedance vector Z, which is a combination of resistance (R) and reactance (Xc) through the soft tissues. Recently, the analysis of parameters directly measured by BIA, like phase angle (PA) and impedance vector analysis (BIVA) has gained increasing attention, as their use eliminates the limitations imposed by equations. BIVA, defined as the inclination of the line formed by plotting R and Xc corrected for height (H) on the RXc plane (11), allows the detection of changes in the electrical conductivity of the body, indicating changes in cell membrane integrity and if you are uncertain whether you must start taking this medication, speak with your the intercellular space (6). It has gained attention as a valuable tool to assess patients’ hydration status and cell mass. The ratio arctangent of reactance per resistance defines the phase angle. Low values of phase angle (

BIVA has been shown to be a suitable method to study the quantitative and qualitative changes in body composition in the elderly (12), especially during the course of pathologic conditions.

As BIVA varies according to population and ethnicity, a curve built for a certain population may not be accurate for other groups. So, there is the need to determine values for different elderly populations. The aim of the present study was, therefore, to determine R- and Xc corrected values as well as PA values and to construct BIVA curves for healthy urban, community-living Brazilian elderly people (aged 60 to 70 years old) and to compare those with values reported in the literature.


Subjects and Methods

Subjects

One hundred persons aged from 60 to 70 years, living in the area assisted by the Family Health Program of the Ribeirao Preto Medical School, University of São Paulo, São Paulo, Brazil, participated in this study. That is a medium-low income area, with about 2,000 inhabitants aged 60 years or over. Selection covered all the census areas of the neighborhood (2000 census). The houses were randomized, and persons living in the selected houses were invited to participate. Inclusion criteria were being free-living, independent and aged from 60 to 70 years. The Mini Mental State Examination and the Barthel (28) and Lawton (29) scales were employed to detect cognitive impairment and to assess activities of daily living, respectively. No volunteers had cognitive impairment or dependences. All volunteers were submitted to a careful clinical and laboratorial evaluation (total blood cell count, blood glucose, creatinine and thyroid stimulating hormone levels) and no uncontrolled chronic diseases were detected.

Exclusion criteria were being bed-ridden or dependent, having impairments due to cerebrovascular accidents and other chronic diseases, having clinically detected uncontrolled chronic disesases, ongoing weight gain or loss and following prescribed strict diet regimens.

Anthropometric assessment

All volunteers had their weigh measured after overnight fast, with light clothes and empty bladder (Filizola® ID 1500 scale, Brazil). Height was measured by a wall ruler with the volunteers standing without shoes and erect, with neck and head in the same line of the torso.

After weight and height measurement, multifrequency tetrapolar bioelectrical impedance analysis (Bodystat quadscan 4000, Bodystat LTD, Isle of Man, UK) was performed with standard electrodes positioned in ipsi- lateral wrist and ankle and in the distal line of metacarpus and carpus in the dominant side of the body. R and Xc values were measured once in each volunteer, the coefficient of variance was measured at 50kHz. The analyzer was calibrated after every twenty measurements using a 500V resistor provided by the manufacturer. PA was obtained from the arc-tangent ratio Xc:R.

The BIVA software 2002 (13) was employed for the application of Hotelling T2 test and univariate analysis (F test) for the determination of confidence intervals (CI) for the comparison of the subject groups and for the analysis of tolerance intervals. The 95% CI and the 5% level of significance were applied in all analyses. The present study was conducted according to the guidelines laid down in the Declaration of Helsinki, and all procedures involving human subjects/patients were approved by the Research Ethics Committee of the University Hospital, Ribeirao Preto Medical School, University of Sao Paulo, process number 12218/2004. All volunteers signed an informed consent prior to participation.


Results

A total of 98 volunteers (forty male and fifty eight female) were evaluated between July and November 2005.

Mean age was 66.5 (SD 4.4) years and 66.2 (SD 3.7) for men and women, respectively, P= 0.730. The mean BMI was 26.2 (SD 3.9) kg.m-2 and 27.7 (SD 4.9) kg.m-2, respectively, P=0.100. The mean PA value was 5.47 (SD 0.67) and 5.00 (SD 0.59), respectively, P= 0.004.

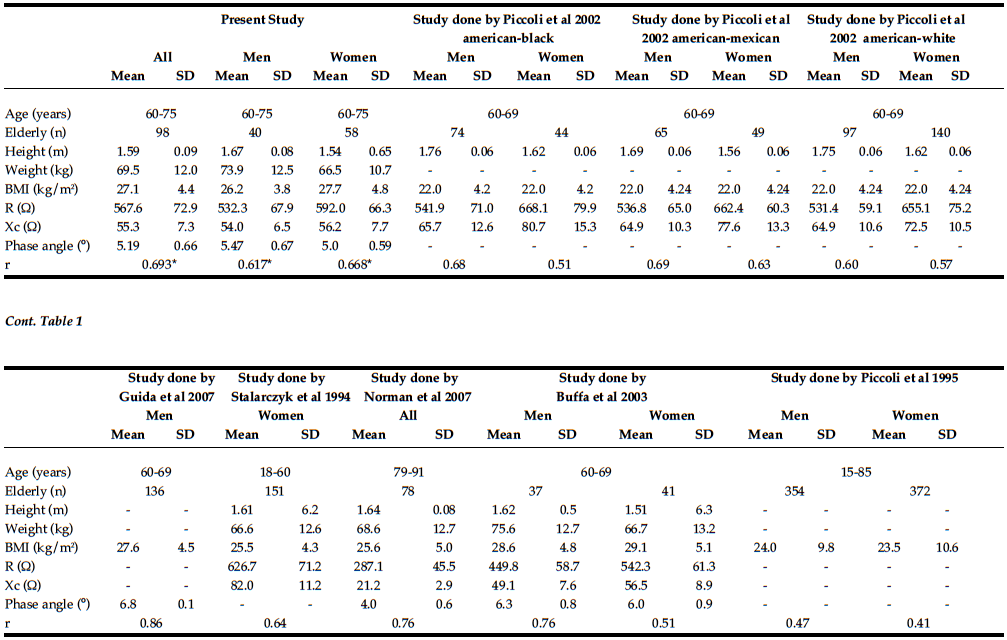
Table 1 lists the anthropometric characteristics and impedance values of the volunteers according to gender, as well as the comparison of the values with data reported in the literature.

Table 1 Characteristics of the elderly studied as a whole and for men and women separately, and comparison with data obtained by Piccoli et al. 1995(23), Piccoli et al. 2002(24), Guida et al. 2007(4), Stalarczyk et al. 1994(25), Norman et al. 2007(11), Buffa et al. 2003(12)

Table 1: Characteristics of the elderly studied as a whole and for men and women separately, and comparison with data obtained by Piccoli et al. 1995(23), Piccoli et al. 2002(24), Guida et al. 2007(4), Stalarczyk et al. 1994(25), Norman et al. 2007(11), Buffa et al. 2003(12)

R, resistance; Xc, reactance; r, linear correlation coefficient between R/H and Xc/H. *P


Figure 1 presents the impedance vectors with tolerance ellipses of 50, 75 and 98% for men and women. Figure 3 represents the mean impedance vectors and Figure 4 presents the RXc-score graph of impedance vectors with tolerance ellipses of 50, 75 and 95% for men and women.

Figure 1: Comparison of the graphs of the impedance vector between men and women in the present study; (B) men (C) women. R/H, resistance/height; Xc/H, reactance/height


Figure 2 Graphs of the impedance vector with the 50, 75 and 95% tolerance ellipses for (a) all subjects, (b) men and (c) women. R/H, resistance/height; Xc/H, reactance/height

Figure 2: Graphs of the impedance vector with the 50, 75 and 95% tolerance ellipses for (a) all subjects, (b) men and (c) women. R/H, resistance/height; Xc/H, reactance/height


figure 3

Figure 3: Graphs of the impedance vector with the 50, 75 and 95% tolerance ellipses for (a) impedance vectors with 95% confidence ellipses for elderly (Hottelling T2 test) all subjects, (b) impedance vectors with 95% confidence ellipses for women (Hottelling T2 test), (c) impedance vectors with 95% confidence ellipses for men (Hottelling T2 test). Comparison graphs with (A) present study – all subjects; (B) present study – men; (C) present study – women – 60-75 years old; (D) study by Norman et al. 2007 (11) – all subjects aged 79-91 years; (E) study by Buffa et al. 2003(12) - men aged 60-69 years; (F) study by Buffa et al. 2003 – women aged 60-69 years; (G) study by Piccoli et al. 1995(23) - men aged 15-85 years; (H) study by Piccoli et al. 1995 – women aged 15-85 years; (I - N) study by Piccoli et al. 2002(24) - all races, aged 60-69 years; (O) study by Guida et al. 2007(4) – men aged 60-69 years; (P) study by Stolarczyk et al. 1994(25) – women aged 18-60 years

R/H, resistance/length; Xc/H, reactance/length


figure 4

Figure


Discussion

In the present study, we determined the tolerance intervals of the ellipses for BIVA of independent older people aged 60-70 years from a Brazilian urban community. Although this sample is not representative of the Brazilian elderly population, it reproduces the characteristics of more than 90% of the Brazilian elderly that presently live in urban areas (14 – 16).

BIVA is a clinically useful qualitative and semi- quantitative method for the assessment of hydration and body tissues; moreover, this method can be used for routine monitoring of variations in the body fluids and nutritional status of the healthy elderly and in situations requiring special care, like cachexia. In institutionalized elderly BIVA results have been shown to differ according to the mini-nutritional assessment (MNA) classification of nutritional status (11).

Based on the RHc graphs of healthy elderly, it is possible to monitor the nutritional status and body fluids of other elderly groups (ei. cachexia, obesity and other conditions) according to the position of them in the graphs built.

One of disadvantages of conventional BIA is the lack of accuracy when the elderly is hiperhydrated. Nescolarde et al 2009 demonstrated that BIVA is better than BMI in the hiperhydration state, taking into consideration that the retained water leads to a reduction of the estimation of fat-free mass (17). In BIVA, the normality of hydration status is represented by the position of the vector within the 75% tolerance ellipse for gender and specific age in any reference population. Dehydration is represented by an elongated and steeper curve of the vector, and fluid overload is represented by a reduced and downward inclined vector out of the 75% tolerance ellipsis (outside the interval) (6). Descending vectors or vectors migrating in parallel with the shorter axis above (left) or below (right) the major axis of the tolerance ellipsis indicate, respectively, a smaller body cell mass contained in fat- free mass (vectors with a comparable R value and a higher or lower Xc, respectively) (18, 19, 20).

The use of specific ranges for age can help reduce estimation errors. In the elderly, there is an individual variability in body density, hydration and in the preservation of fat-free mass. The comparison of both individual and group Z vectors with healthy reference populations showed that BIVA is useful in pathological conditions such as kidney diseases, hepatitis, obesity, cachexia and anorexia (12). When we compare the findings of our research with those of other healthy elderly population at the same age group, we can verify differences in both the phase angle and RXc graph. These differences can be seen in figure 1, where the graphs were compared, according to gender. Therefore, references derived from the study of other populations can classify Brazilian elderly individuals or groups inadequately. Among the references analyzed, the one with results closest to the ones found in this study was that of Buffa et al 2003, possibly because it included a similar population (healthy individuals aged 60 to 69 of both genders). Although the values most distant from ours are from much older subjects, some belong to the same age group. This shows the need for the determination of population- specific curves to avoid inadequate errors of measurements. BIVA data from Latin-American healthy and independent elderly are not available in the literature, as far as we know.

Phase angle (PA) is one alternative for traditional BIA equations. Studies have suggested that PA can be used to determine the risk of morbidity, with low PA (21) being associated with cell death or with changes in membrane permeability. Low phase angle is associated with low number of cells per unit volume, is common in patients at advanced stages of Alzheimer’s disease (22) or having dehydratation or diabetes (26). The PA values of the present study were higher than those reported by Norman et al 2007 (11). In that study, however, gender was not considered and the volunteers were older than the ones of the present study. Also the PA values in the present study were lower than those reported by Guida et al 2007 (4), based only on Caucasian men.

Based on our results, we conclude that population and gender specific values for the BIVA of elderly populations should be used.

Values were established for Brazilian, independent older subjects living in urban areas and may be used in clinical practice showing the integrity of cell mass, the variation of hidration and the relation between hydration and cell mass. The phase angle is a quantitative data that may be use as reference, but BIVA represents a more detailed assessment of both hydration and cell mass (27). Moreover, for longitudinal assessment, an individual may keep the same phase angle, but different BIVA, due to changes in hydration or body cell mass, so that BIVA may be more informative than phase angle alone (27).


Acknowledgements: The authors wish to thank Professor Antonio Piccoli, University of Padua, Italy, for providing the BIVA Software 2002 (Picoli & Pastori, 2002); available from apiccoli@unipd.it. The authors disclose that there are no conflicts of interests in the present paper. K. P. and I. A. L. participated in the data collection. J. S. C. and A. V. M. provided the BIVA Software 2002 (Picoli & Pastori, 2002) and analysed the data. N. K. L., J. S. M., J. C. M., K. P. and E. F. participated in the design and analyses of data.


References

1. Santomauro F, Olimpi N, Baggiani L, et al. Bioelectrical Impedance Vector Analysis and Mini Nutritional Assessment in elderly nursing home residents. J Nutr Health Aging 2011;15, 163-7.

2. Cowan DT, Roberts JD, Fitzpatrick JM, et al. Nutritional status of older people in long term care settings: current status and future directions. Int J Nurs Stud 2004;41, 225-237.

3. Pirlich M and Lochs H. Nutrition in the elderly. Best Pract Res Clin Gastroenterol 2001;15, 869-884.

4. Guida B, Laccetti R, Gerardi C, et al. Bioelectrical impedance analysis and age-related differences of body composition in the elderly. Nutr Metab Cardiovasc Dis 2007;17, 175-80.

5. Buffa R, Floris G, Marini E. Assessment of nutritional status in free-living elderly individuals by bioelectrical impedance vector analysis. Nutrition 2009;25, 3-5.

6. Margutti AV, Monteiro JP, Camelo JS Jr. Reference distribution of the bioelectrical impedance vector in healthy term newborns. Br J Nutr 2010;104, 1508-1513.

7. Dehghan M & Merchant AT. Is bioelectrical impedance accurate for use in large epidemiological studies? Nutr J 2008;7, 26.

8. Sluyter JD, Schaaf D, Scragg RKR, et al. Prediction of fatness by standing 8- electrode bioimpedance: a multiethnic adolescent population. Obesity (Silver Spring) 2009;18, 183–189.

9. Haroun D, Taylor SJ, Viner RM, et al. Validation of bioelectrical impedance analysis in adolescents across different ethnic groups. Obesity (Silver Spring) 2010;18, 1252-9

10. Pfrimer K, Moriguti JC, LIMA NKC, et al. Bioelectrical impedance with different equations versus deuterium oxide dilution method for the inference of body composition in healthy older persons. J Nutr Health Aging 2011;16, 124-7.

11. Norman K, Smoliner C, Valentini L, et al. Is bioelectrical impedance vector analysis of value in the elderly with malnutrition and impaired functionality? Nutrition 2007;23, 564-9.

12. Buffa R, Floris G, Marini E. Migration of the bioelectrical impedance vector in healthy elderly subjects. Nutrition 2003;19, 917-921

13. Piccoli A & Pastori G. BIVA software. Padova: Department of Medical and Surgical Sciences, University of Padova, 2002.

14. Telarrolli JR R, Machado JCMS, Carvalho F. Perfil demográfico e condições sanitárias dos idosos em área urbana do Sudeste do Brasil.Rev. Saúde Pública 1996;30, 485-98.

15. Ramos LR. Fatores determinantes do envelhecimento saudável em idosos residentes em centro urbano: Projeto Epidoso, São Paulo. Cad. Saúde Pública 2003;19, 793-798.

16. Nogueira SL, Geraldo JM, Machado JC, Ribeiro RCL. Distribuição espacial e crescimento da população idosa nas capitais brasileiras de 1980 a 2006: um estudo ecológico. R. bras. Est. Pop 2008;25, 195-198

17. Nescolarde L, Rosell-Ferrer J, Gastelurrutia P, et al. Comment on “Is bioelectrical impedance vector analysis of value in the elderly with malnutrition and impaired functionality?” Nutrition 2009;25, 370-371.

18. Foster KF & Lukaski HC. Whole-body impedance –what does it measure? Am J Clin Nutr 1996;64, 388S–396S.

19. Heymsfield SB, Wang ZM, Visser M, et al. Techniques used in the measurement of body composition: an overview with emphasis on bioelectrical impedance analysis. Am J Clin Nutr 1996;64, 478S–484S.

20. Kushner RF, Schoeller DA, Fjeld CR, et al. Is the impedanceindex (ht2/R) significant in predicting total body water?Am J Clin Nutr 1992;56, 835–839.

21. Kyle UG, Bosaeus I, De Lorenzo A, et al. Bioelectrical impedance analysis – part I: review of principles and methods. Clin Nutr 2004;23, 1226–1243.

22. Buffa R, Mereu RM, Putzu PF, et al. Bioelectrical impedance vector analysis detects low body cell mass and dehydration in patients with Alzheimer’s disease. J Nutr Health Aging 2010;14,823-7.

23. Piccoli A, Nigrelli S, Caberlotto A, et al. Bivariate normal values of the bioelectrical impedance vector in adult and elderly populations. Am J Clin Nutr 1995;61, 269-270.

24. Piccoli A, Pillon L, Dumler F. Impedance vector distribution by gender, race, body mass index, and age in the United States: standard reference intervals as bivariate Z scores. Nutrition 2002;18, 153-67.

25. Stolarczyk LM, Heyward VH, Hicks VL, et al. Predictive accuracy of bioelectrical impedance in estimating body composition of Native American women. Am J Clin Nutr 1994;59, 964-70.

26. Buffa R, Saragat B, Succa V, et al. Elderly subjects with type 2 diabetes show altered tissue electrical properties. Nutrition, 2013;29 (1): 132-137.

27. Norman K, Stobäus N, Pirlich M, Bosy-Westphal A. Bioelectrical phase angle and impedance vector analysis e Clinical relevance and applicability of impedance parameters. Clinical Nutrition xxx 2012; 1-8.

28. Mahoney FI, Barthel DW. Functional evaluation: The Barthel Index. Md State Med J, 1965;14:61-5.

29. Lawton MP, Brody EM. Assessment of older people: self-maintaining and instrumental activities of daily living. Gerontologist, 1969;9 (3):179–186.