jarlife journal
Sample text

AND option

OR option

KNOWLEDGE OF COMMONLY PRESCRIBED MEDICATIONS TO OCTOGENARIANS


T.V.N. Didone1, D. Oliveira de Melo2, E. Ribeiro1,3


1. Department of Pharmacy, Faculty of Pharmaceutical Sciences, University of Sao Paulo, Sao Paulo, Brazil; 2. Department of Biological Sciences, Institute of Environmental, Chemical and Pharmaceutical Sciences, Federal University of Sao Paulo, Diadema, Brazil; 3. University Hospital, University of Sao Paulo, Sao Paulo, Brazil

Corresponding Author: Thiago Vinicius Nadaleto Didone, Department of Pharmacy, Faculty of Pharmaceutical Sciences, University of Sao Paulo, Sao Paulo, Brazil, E-mail: tdidone@gmail.com, Phone: 55-11-3091-9246, Fax: 55-11-3091-9283

J Aging Res Clin Practice 2019;8:70-73
Published online October 1, 2019, http://dx.doi.org/10.14283/jarcp.2019.12


Abstract

Eighty outpatients aged 80 years or more were face-to-face interviewed in order to assess the appropriate recall of six items of information about the 19 most commonly prescribed medications by means of a questionnaire cross-culturally adapted into Brazilian Portuguese. In some cases, the caregiver was interviewed instead. The frequency of medications whose information was appropriately recalled ranged from 36% to 100%, 36% to 100%, 18% to 90%, 9% to 63%, 0 to 25%, and 0 to 10% for respectively the following items dosage, form of administration, indication, storage, side effects, and precautions and warnings, indicating poor overall knowledge. The lowest frequency of dosage and form of administration was seen for alendronic acid (36% each), and the highest frequency of side effects was found for donepezil (25%). Octagenarians and their caregivers should be constantly counseled on medication information.

Key words: Aged, 80 and over, drug storage, health knowledge, attitudes, practice, patient education as topic, patient medication knowledge.


Introduction

The world’s population is ageing with the feature that the number of people aged ≥80 years is growing even faster than the number of older people overall (1). By 2035, the number of octogenarians in Brazil will double, rising from the current 2.0% to 3.8% of the population (2). Older individuals use more drugs (1) and have less knowledge of them (3, 4) in comparison to younger people. Among the elderly, octogenarians may have still even less medication knowledge. Primary care patients aged ≥80 years presented 53% less chance of appropriately recall the indications of medications in use than the ones aged 60 to 69 years (5). This reaffirm the fact that medication knowledge among older patients is insufficient (3, 5-7), which may lead to medication non-adherence (6) and negative clinical implications (4). For instance, 75-year-old patients with adequate knowledge of the indications of the medications they used had 3.7 times more chance to follow the prescribed regimen than the ones with inadequate knowledge (6).
The aim of this study was to evaluate the knowledge octogenarian outpatients had about commonly prescribed medications.


Methods

Patients seen at the outpatient geriatric clinic of the University of Sao Paulo Hospital (São Paulo, Brazil) and having a valid prescription of at least one medication were included at random from March 2013 to February 2014. Patients having communication difficulties or not willing to be interviewed were excluded.
Patients were interviewed face-to-face in order to identify the prescribed medications in last geriatrician appointment and their Anatomical Therapeutic Chemical (ATC) codes (www.whocc.no), time of use, and knowledge. In the case of patients with dementia, we interviewed his/her caregiver responsible by the home organization of medications instead. We allowed interviewees to read the prescription if they felt the need to.
Medication knowledge is the knowledge needed to ensure the appropriate use of the medication. It was obtained for each medication by means of an 11-question Spanish questionnaire cross-culturally adapted into Brazilian Portuguese (8). Each question inquires the interviewee about one item of information on medication. We selected six questions, each one concerning one of the following items: dosage, form of administration, indication, storage, side effects, and precautions and warnings. Answers were classified either correct, incomplete, unknown or incorrect according to its degree of agreement with the UpToDate® database (www.uptodate.com). Two interviewers independently classified the answers and a third one was consulted if necessary.
Knowledge was expressed as the appropriate recall of the items mentioned above, that is when answers were either correct or incomplete (5). We analyzed only medications prescribed to ≥10% of patients. For every one of them, we calculated the frequency of medications appropriately recalled.


Results

We interviewed 80 individuals. There were 19 ATC 5th codes prescribed to ≥10% of patients, which corresponded to 61.5% (305/496) of all medications prescribed. Acetylsalicylic acid was the most prescribed medication (43% of patients) followed by omeprazole (36%) and enalapril (30%). Regarding the time of use, 72.5% (221/305) of the most prescribed medications were being used for more than 6 months. The majority (9/19) of medications acts on the cardiovascular system (ATC 1st code: C). The second most common (5/19) ATC 1st code was A (medications acting on the alimentary tract and metabolism).
Table 1 shows the frequency of medications whose information about dosage, form of administration, indication, storage, side effects, and precautions and warnings was appropriately recalled. Frequencies of these six items of information respectively ranged from 36% to 100%, 36% to 100%, 18% to 90%, 9% to 63%, 0 to 25%, and 0 to 10%. The overall knowledge was intermediate to high regarding information on dosage and form of administration, varied a lot for information on indication and storage, and for information on side effects and precautions and warnings was almost non-existent.
Of note, the lowest appropriate recall of dosage and form of administration was found for alendronic acid. Still, the highest appropriate recall of side effects was seen for donepezil.
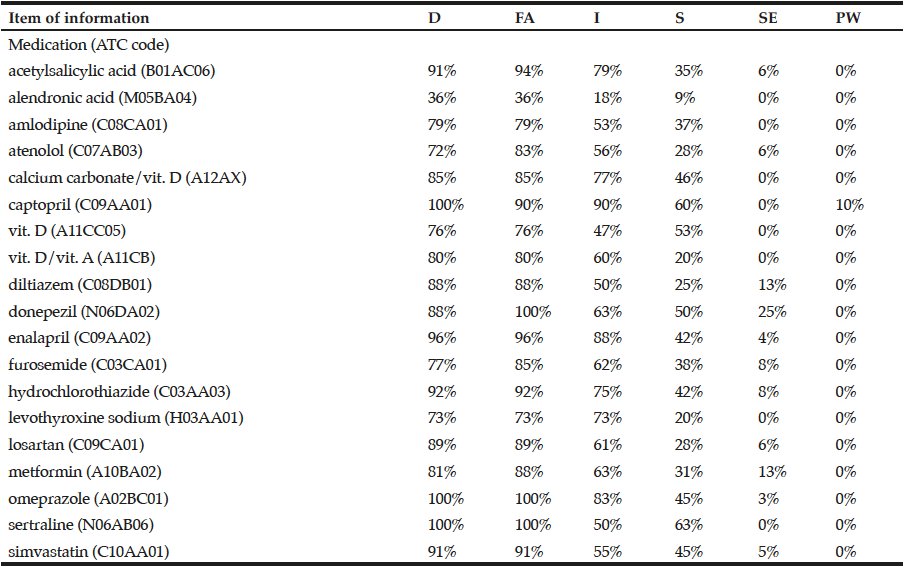
Table 1 Frequency of medications whose information was appropriately recalled

Table 1
Frequency of medications whose information was appropriately recalled

It was considered the 19 most commonly prescribed medications and 6 information needed for appropriate use of medications. D: dosage; FA: form of administration; I: indication; S: storage; SE: side effects; PW: precautions and warnings.


Discussion

A few Brazilian studies (9-11) corroborate our findings in spite of having evaluated only one prescribed medication and having had no constraints of age. For instance, in Grão Pará, Santa Catarina, 95.7%, 60.0%, 11.4%, and 0 of primary care outpatients had appropriate knowledge of indication, dosage, precautions and warnings, and side effects, respectively (9).
Patients often demonstrate appropriate knowledge of how much to take of a medication and how to take it, since this information is usually present in prescriptions and constantly required when long-term medications are being used (9, 10). Here, the vast majority of medications has been prescribed for more than 6 months, which might have influenced the high frequencies of appropriate recall of dosage and form of administration. The latter can be explained by the simple instructions usually recommended in order to take oral products in safety (eg. taking with water was an answer good enough to be considered correct). Taking alendronic acid in safety needs more complex directions though. We believe the low appropriate recall of form of administration of alendronic acid resulted from insufficient counselling on this issue by healthcare professionals. In a 3-year trial there was no difference in the incidence of esophageal adverse reactions among individuals receiving placebo, 5, 10, or 20 mg of alendronic acid because they were regularly seeing the physician who reinforced the instructions for the safe use of the medication in every encounter (12).
Although the frequencies of appropriate recall of indication varied widely among medications, the ones for the cardiac medications (ATC 1st code: C) are in line with a Dutch study, which showed that 61.6% of these medications were appropriately recalled by older primary care patients (5). Knowing the indication might be challenging when medications have multiple indications (eg. sertraline), were prescribed to prevent a condition rather than treat one (eg. acetylsalicylic acid) or in an irrational way (eg. omeprazole is not indicated to treat polypharmacy). In addition, this knowledge may be influenced by the amount of time of medication use and the skills needed to use it (5, 10).
Appropriate recall of storage was ≤50% for 16 out of 19 medications, indicating that most of them might have been inadequately stored. This is associated with patients’ age and habits. In Cuité, Northeast Brazil, for example, 203 out of 267 (76.0%) households had medications inadequately stored. Besides, the older the organizer of home medications, the higher the risk of them being inadequately stored (13).
The low frequencies of appropriate recall of side effects and precautions and warnings we found is ordinary. Safety issues are the least known information about medication in older individuals (6, 7, 14). Reasons include not experiencing adverse reactions (10) and lack of counselling by healthcare professionals (7, 9) who fear nocebo effect or medication discontinuation (9). While 72.2% and 70.1% of older outpatients using long-term medications reported receiving information about the form of administration and the indication, 73.0% claimed that they did not receive any information on side effects (14).
Since it is a first-line treatment for Alzheimer’s disease, answers regarding donepezil information were given by caregivers instead of patients. Not surprisingly, they possessed the highest knowledge of side effects as caregivers of dementia patients actively seek key information about medications in use by their care-recipients, especially information on adverse reactions (15).
The lack of knowledge needed for appropriate use of medications may cause negative and significant clinical consequence. Not knowing information about dosage and form of administration may expose patients to adverse events and other risks of not following the prescription. The knowledge of indication may help patients assess the correspondence between indication and treating condition so that they can verify the clinical reasoning of the prescriber. In addition, not knowing storage information increases the odds of consuming badly preserved medications. Besides, patients who has appropriate knowledge of side effects may engage in preventive health behaviors and seek assistance to manage them when they manifest (14). Therefore, healthcare professionals must unquestionably provide reliable written and oral information on medication to patients and caregivers in order to increase their medication knowledge.
Selection bias may arise due to the inclusion not at random of individuals and the exclusion of the ones not willing to participate (eg. patients with gait disorders, caregivers late for work). Besides, it is expected that caregivers possess more medication knowledge than their care-recipients simply due to sociodemographic differences (eg. caregivers are usually women, younger and more educated).


Funding: TVND was granted with a fellowship by Conselho Nacional de Desenvolvimento Científico e Tecnológico – Brasil (CNPq), number 135839/2012-2. CNPq had no role in the design and conduct of the study; in the collection, analysis, and interpretation of data; in the preparation of the manuscript; or in the review or approval of the manuscript.

Acknowledgements: None.

Conflict of interest disclosure: TVND, DOM and ER have nothing to disclose.

Ethical standard: The study was performed in accordance with the ethical standards as laid down in the 1964 Declaration of Helsinki and its later amendments. The research ethics committee of the University of Sao Paulo (USP) Hospital and the Faculty of Pharmaceutical Sciences of the USP approved the study and all participants gave written informed consent to take part.


References

1.    Eendebak R, Organization WH. World Report on Ageing and Health. 2015. Global: World Health Organization, Luxembourg.
2.    Instituto Brasileiro de Geografia e Estatística. Projeção da população do Brasil e das Unidades da Federação [Internet]. 2019 [cited 2019 Jun 18]. Available from: https://www.ibge.gov.br/apps/populacao/projecao/.
3.    Hartholt KA, Val JJ, Looman CW, Petrovic M, Schakel A, van der Cammen TJ. Better drug knowledge with fewer drugs, both in the young and the old. Acta Clin Belg 2011; 66:367-370.
4.    Tang EO, Lai CS, Lee KK, Wong RS, Cheng G, Chan TY. Relationship between patients’ warfarin knowledge and anticoagulation control. Ann Pharmacother 2003; 37:34-39.
5.    Bosch-Lenders D, Maessen DW, Stoffers HE, Knottnerus JA, Winkens B, van den Akker M. Factors associated with appropriate knowledge of the indications for prescribed drugs among community-dwelling older patients with polypharmacy. Age Ageing 2016; 45:402-408.
6.    Barat I, Andreasen F, Damsgaard EMS. Drug therapy in the elderly: What doctors believe and patients actually do. Br J Clin Pharmacol 2001; 51(6):615–622.
7.    Si P, Koob KN, Poonb D, Chew L. Knowledge of prescription medications among cancer patients aged 65 years and above. J Geriatr Oncol 2012; 3:123-130.
8.    Didone TVN, García-Delgado P, Melo DO, Romano-Lieber NS, Martínez-Martínez F, Ribeiro E. Validação do questionário “Conocimiento del Paciente sobre sus Medicamentos” (CPM-ES-ES). Cien Saude Colet 2019; 24(9):3539-3550..
9.    Oenning D, Oliveira BV de, Blatt CR. Conhecimento dos pacientes sobre os medicamentos prescritos após consulta médica e dispensação. Cien Saude Colet 2011; 16(7):3277–3283.
10.    Fröhlich SE, Dal Pizzol T da S, Mengue SS. Instrument to evaluate the level of knowledge about prescription in primary care. Rev Saude Publica 2010; 44(6):1046–1054.
11.    Silva T, Schenkel EP, Mengue SS. Nível de informação a respeito de medicamentos prescritos a pacientes ambulatoriais de hospital universitário. Cad Saude Publica 2000; 16(2):449–455.
12.    Liberman UA, Weiss SR, Bröll J, et al. Effect of oral alendronate on bone mineral density and the incidence of fractures in postmenopausal osteoporosis. The Alendronate Phase III Osteoporosis Treatment Study Group. N Engl J Med 1995; 333(22):1437-1443.
13.    Martins RR, Farias AD, Oliveira YMDC, Diniz RDS, Oliveira AG. Prevalence and risk factors of inadequate medicine home storage: a community-based study. Rev Saude Publica 2017; 51:95.
14.    Chan FW, Wong FY, So WY, Kung K, Wong CK. How much do elders with chronic conditions know about their medications? BMC Geriatr 2013; 13:59.
15.    Aston L, Hilton A, Moutela T, Shaw R, Maidment I. Exploring the evidence base for how people with dementia and their informal carers manage their medication in the community: a mixed studies review. BMC Geriatr 2017; 17(1):242.

RELEVANCE OF 18F-FLUORODEOXYGLUCOSE-POSITRON EMISSION TOMOGRAPHY/COMPUTED TOMOGRAPHY IN THE DIAGNOSIS OF ATYPICAL TEMPORAL ARTERITIS


M. Leclercq1, L. Goodrich2, C. Le Guillou3, X. Gbaguidi4


1. Internal Medicine, Rouen University Hospital, Rouen, France; 2. Geriatrics and Rehabilitation, Bayeux Hospital Center, Bayeux, France; 3. Geriatrics and Internal Medicine, Nîmes University Hospital, Nîmes, France; 4. Geriatrics, Dieppe Hospital Center, Dieppe, France

Corresponding Author: Dr Xavier Gbaguidi, Department of Geriatrics, Dieppe Hospital Center, Avenue Pasteur 76200 Rouen, Email : xgbaguidi@ch-dieppe.fr, Tel : +33 2 32 14 72 15, Fax : 02 32 14 74 92

J Aging Res Clin Practice 2017;6:191-192
Published online October 5, 2017, http://dx.doi.org/10.14283/jarcp.2017.25


Abstract

Atypical form of Giant cell arteritis (GCA), involving the absence of American College of Rheumatology (ACR) criteria, should be suspected before fever or inflammatory syndrome of unknown origin in the elderly. In that case, the diagnosis may be complex insofar as there are many possible infectious, inflammatory or tumorous etiologies. Completion of multiple and / or invasive clinical investigations can be questionable in a frail elderly population. 18F-fluorodeoxyglucose positron emission tomography/computed tomography (FDG-PET/CT) is a non-invasive examination of high sensitivity and specificity in the diagnosis of GCA which may reveal abnormal fixation of the wall of the aorta and its branches. Its negative predictive value close to 90 % is also a strength to exclude the diagnosis. FDG-PET/CT is also effective in the search for differential diagnoses. On the other hand, FDG-PET/CT should not be prescribed in front of typical form of GCA in which ACR criteria are met. This clinical case illustrate the place of FDG-PET/CT in the diagnostic strategy of an inflammatory syndrome in an elderly patient for whom GCA is suspected.

Key words: Aged, 18F-fluorodeoxyglucose-positron emission tomography/computed tomography, giant cell arteritis.


Introduction

A persistent inflammatory syndrome in patients over 60 years old should raise the hypothesis of giant-cell arteritis (GCA). Although the classic clinical and biological presentation of the disease is fairly simple to diagnose, it is not so obvious for atypical forms. This clinical case illustrates the place of 18F-fluorodeoxyglucose positron emission tomography/computed tomography (FDG-PET/CT) before fever or chronic inflammatory syndrome with a possible diagnosis of GCA.


Clinical case

An 88 year old patient was hospitalized for the assessment of an inflammatory syndrome. During the last 4 months had appeared asthenia and fluctuant cognitive impairment. These symptoms altered the activities of daily living. The temperature was 38 °C. The physical examination was normal including present temporal pulse. Biological examinations highlighted an inflammatory syndrome (CRP: 96 mg/L), normocytic anemia (Hb: 8 g/dL) secondary to inflammation, anicteric cholestasis and hypoalbuminemia (25 g/L). Infectious causes, especially neuro-meningeal and cardiac infection, were eliminated. Body scanner with injection of iodinated contrast media was performed. Neither tumor anomaly nor inflammatory sign of the aorta or supra aortic trunks were found. A FDG-PET/CT was performed to investigate arterial hypermetabolism in the hypothesis of a GCA. It highlights an arterial inflammation of the superior aortic and iliac trunks in favor of a GCA (figure 1). The systematic temporal artery biopsy (TAB) was positive. Corticosteroid therapy led to the rapid improvement of symptoms.


Discussion

The GCA is the most frequent vasculitis of the elderly. It usually reaches the branches of the carotid artery but also the large vessels such as the aorta, its branches and the limbs arteries. According to studies, this impairment varies between 17 and 45% (1) or even up to 83% (2).
Diagnosis can be complex. The American College of Rheumatology (ACR) criteria (age > 50 years, recent occurrence of headaches, clinical arterial anomalies, high ESR, histological vasculitis) have good sensitivity and specificity respectively 93% and 91% but are not always present. The clinical signs associated with the involvement of the temporal artery may be missing as well as the headaches as shown by our patient. In 5% of cases, only general signs and inflammatory syndrome are present (3), in 15% it is an isolated fever (2). When negative (15 to 51% of cases) (2, 4), TAB does not eliminate the diagnosis because of the segmental and focal distribution of lesions. Moreover, in the case of inflammatory syndrome or fever of undetermined origin, the oncological, infectious and noninfectious inflammatory etiologies are discussed as much as the hypothesis of GCA. Given this type of clinincal picture associating fever and inflammatory syndrome, the GCA represents approximately 16% of diagnoses (2). Our patient illustrates this situation perfectly with an aspecific presentation associating asthenia, delirium, fever and inflammatory syndrome.

Figure 1 Fluorine-18 fluorodeoxyglucose (18F-FDG) positron emission tomography/computed tomography imaging. Black arrows show pathological FDG uptake in the external carotid (a), subclavian and axillary arteries (b), aorta (c) and iliac arteries (d) that contrast with normal vessel (white arrow)

Figure 1
Fluorine-18 fluorodeoxyglucose (18F-FDG) positron emission tomography/computed tomography imaging. Black arrows show pathological FDG uptake in the external carotid (a), subclavian and axillary arteries (b), aorta (c) and iliac arteries (d) that contrast with normal vessel (white arrow)


FDG-PET/CT detects tissues with high metabolic activity by injecting a glucose analog bound to a radioactive marker. In the vasculitis, the infiltration of the vascular wall by inflammation cells leads to a fixation on the FDG-PET/CT hence its interest. Two recent meta-analyzes (5, 6) show satisfactory performance of in the diagnosis of GCA. Sensitivity and specificity were respectively 80% to 89.5% and 89% to 97.7%. Positive predictive values and negative predictive values (NPV) were respectively 85% and 88% (5). False positives may be due to atherosclerosis. A visual fixation of the arterial wall of higher intensity than fixation on liver is a good criterion in favor of vasculitis and not of atheroma (sensitivity of 83% and specificity of 91%) (6). The false negatives correspond to patients with GCA affecting only the temporal arteries without reaching the cervico-thoracic vessels corresponding to the limits of spatial resolution of FDG-PET/CT. However, in this situation, the clinical presentation is usually classical and therefore the ACR criteria are present. Thus, in a recent cohort, all patients with isolated temporal impairment met ACR criteria (7).
These results should motivate the realization of a FDG-PET/CT in front of a persistent inflammatory syndrome or a fever of undetermined origin to look for GCA because once in four it will recover an arterial hypermetabolism compatible with an inflammatory arteritis (8).
With a high NPV, a negative exam would reject the diagnosis of GCA and avoid the use of an invasive procedure. On the contrary, its positivity with typical lesions of intense arterial fixation would be an argument to retain the diagnosis. The FDG-PET/CT is also a useful exam to rule out some differential diagnoses. Indeed, some studies have demonstrated its performance in the etiologic diagnosis of indeterminate origin fever (9, 10). On the other hand, when the clinical elements of the ACR criteria exist, the FDG-PET/CT does not find its place in the diagnostic strategy.


Disclosure Statement: No potential conflicts of interest were disclosed; Mathilde Leclercq has nothing to disclose; Laura Goodrich has nothing to disclose; Cédric Le Guillou has nothing to disclose; Xavier Gbaguidi has nothing to disclose.

Ethical standard: All authors have seen and approved the final version of the paper and have agreed to its submission for publication. This clinical case presentation ensure appropriate level of privacy.


References

1.    Marie I, Proux A, Duhaut P et al. Long-term follow-up of aortic involvement in giant cell arteritis: a series of 48 patients. Medicine (Baltimore) 2009; 88: 182–192.
2.     Salvarani C, Cantini F, Hunder GG. Polymyalgia rheumatica and giant-cell arteritis. Lancet 2008; 372: 234-245.
3.     Gonzales-Gay MA, Garcia-Porrua C, Amor-Dorado JC, Llorca J. Giant cell arteritis without clinically evident vascular involvement in a defined population. Arthritis Rheum 2004; 51: 274-277.
4.     Bienvenu B, Ly KH, Lambert M et al. Management of giant cell arteritis: Recommendations of the French Study Group for Large Vessel Vasculitis (GEFA). Rev  Med  Interne 2016; 37: 154-165.
5.     Besson FL, Parienti JJ, Bienvenu B et al. Diagnostic performance of 18F-fluorodeoxyglucose positron emission tomography in giant cell arteritis: a systematic review and meta-analysis. Eur J Nucl Med Mol Imaging 2011; 38: 1764 – 1772.
6.      Soussan M, Nicolas P, Schramm C et al. Management of large-vessel vasculitis with FDG-PET: a systematic literature review and meta-analysis. Medicine (Baltimore) 2015; 94: e622.
7.     Czihal M, Zanker S, Rademacher A et al.  Sonographic and clinical pattern of extracranial and cranial giant cell arteritis. Scand J Rheumatol 2012; 41: 231 – 236.
8.     Lensen K-JDF, Voskuyl AE, van der Laken CJ et al. 18F-fluorodeoxyglucose positron emission tomography in elderly patients with an elevated erythrocyte sedimentation rate of unknown origin. PLoS One 2013; 8: e58917.
9.     Meller J, Altenvoerde G, Munzel U et al. Fever of unknown origin: prospective comparison of (18F) FDG imaging with a double-head coincidence camera and gallium-67 citrate SPET. Eur J Nucl Med 2000; 27: 1617 –1625.
10.     Dong M, Zhao K, Liu Z, Wang G, Yang S, Zhou G. A meta-analysis of the value of fluorodeoxyglucose-PET/PET-CT in the evaluation of fever of unknown origin. Eur J Radiol 2011; 80: 834-844.

FRAILTY SYNDROME AND ANTHROPOMETRIC MEASUREMENTS IN THE ELDERLY LIVING AT HOME


R.A. Partezani Rodrigues1, J.R. Silva Fhon1, V.M. Rojas Huayta2, W.L. Fuentes Neira3, M. de Lourdes de Farias Pontes4, A.O. Silva4, G.P. Cardoso Defina1


1. Ribeirão Preto College of Nursing, University of São Paulo, Ribeirão Preto, São Paulo, Brazil; 2. Professional Academic School of Nutrition, National University of San Marcos, Lima, Peru; 3. Faculty of Health Sciences, University of Sciences and Humanities, Lima, Peru; 4. Department of Public Health Nursing and Psyquiatric, Federal University of Paraiba, João Pessoa, Brazil.

Corresponding Author: Rosalina Aparecida Partezani Rodrigues, Nursing School of Ribeirão Preto, University of São Paulo. 3900 dos Bandeirantes Avenue, Monte Alegre District, CEP 14040-902 Ribeirão Preto City, São Paulo State, Brazil. Tel.: +55 163315-3416 E-mail address: rosalina@eerp.usp.br

J Aging Res Clin Practice 2017;6:133-138
Published online June 15, 2017, http://dx.doi.org/10.14283/jarcp.2017.15


Abstract

Disturbance in the nutritional status in the elderly can change anthropometric measurements. These changes on their body could associated with frailty syndrome. The aim was to assess the frailty syndrome and its association with demographic variables and anthropometric measures. Cross-sectional study with 235 elderly people living at home. Descriptive statistics applied were measures of central tendency and dispersion, with frequencies for the qualitative variables. Student’s t test was used to compare the means of sex with age, weight, height, waist circumference, waist/height ratio, body mass index and frailty and multinomial logistic regression analysis between categories of frailty and demographic and anthropometric variables. It was significant p≤0.05. There was a relationship between gender and body weight, waist circumference and the waist/height ratio; the data also showed that frailty increases with age. It was found that having a waist/height ratio ≥0.50 and a body mass index ≥27 increased the risk of frailty. The study shows that the association between frailty and anthropometric measures should be a priority in elderly care.

Key words: Aged, frail elderly, anthropometry, geriatric nursing, elderly nutrition.


Introduction

The world population is aging rapidly. In Brazil, this change has also been observed and according to the census conducted in 2010, 23.5 million people are aged 60 or older, and increased life expectancy in 2013 was 74.8 years with predictions for 2041 of 80 years old (1).
With the aging process, the person may suffer different syndromes, including frailty, which can lead to a state of vulnerability impacting the lives of the elderly, the family and their social environment.
The concept of frailty has been widely discussed among researchers in recent years and involves both cognitive and social aspects. However, the research considers the physical condition to be the most vulnerable in the elderly. In the consensus group on the subject, researchers understand frailty to be “a medical syndrome with multiple causes, characterized by decreased strength, endurance and reduced physiological function with increasing individual vulnerability” (2).
However, along with nurses’ care of elderly patients, multidimensional assessment is an important aspect to be considered. In evaluating the different concepts of frailty, that which most seems to fit the practice of the nurse is the proposed methodological framework of the Canadian Initiative on Frailty and Aging, which takes a holistic approach to frailty (biological, psychological and social) and draws on the history or the life history of the elderly subject (3), and considers aging to be a multidimensional construct.
The prevalence of frailty varies between 4% and 59.1% (4)), increases with age (4-7) and is more prevalent in females (2, 4).
The frailty syndrome is associated with weight loss, being overweight and obesity which increases the risk of functional limitations and disability in the individual (5). In the aging process, frailty can present related malnutrition leading to a loss of muscle mass and strength (6). Risks to the health of the elderly who are overweight include increased chronic diseases, limitations and functional incapacity leading to frailty (5).
With the aging process, relevant changes in body composition affect the nutritional status of the elderly, leading to observed changes in anthropometric measures such as weight and height due to a decrease in the intervertebral space and increased spinal curves in need of comprehensive assessment (7). It is also important to assess the body mass index (BMI) and the waist/height ratio (WHtR), these measures are useful, inexpensive and non-invasive (6).
It is important to maintain an adequate nutritional status in the elderly to prevent frailty syndrome. This topic is still under discussion in the literature of gerontology and geriatrics. Thus, this study is justified by the importance of the syndrome, since the use of WHtR is little used for research into frailty and deserves deeper attention. From this analysis, the results may contribute to a more detailed clinical assessment of the elderly in health services. The objective was to evaluate the frailty syndrome and its association with demographic variables (gender, age and marital status) and anthropometric measures of the elderly living at home.


Method

Study design and participants

This is a descriptive, quantitative and cross-sectional study conducted in the city of Ribeirão Preto, Sao Paulo, Brazil, with 240 elderly subjects. The recruitment of participants was performed in two steps. The first sampling unit considered was the electoral sectors: at the time of data collection, the city had 639 sectors and one district with 11 sectors, making a total of 650 sectors. The second step considered a person aged 60 or more. We selected 20 sectors at random and interviewed 12 elderly people per census sector, guaranteeing a maximum error of 6.3% with 95% probability.
Inclusion criteria were being aged 60 years, of both gender, living at home and being able to communicate verbally.
The Research Ethics Committee of the Ribeirão Preto School of Nursing, University of São Paulo approved the research project with CAAE process number 47155115.3.0000.539.

Data collection and measurements

Data collection was carried out between November 2011 and February 2012, by means of interviews in the subjects’ homes lasting approximately 40 minutes and performed by trained investigators to obtain the information.
The following instruments were used:
a)    Demographic profile: to obtain information on the variables of gender (male and female), age (in years) and marital status (with partner and without partner).
b)    Edmonton Frail Scale (EFS): created by the Canadian Initiative on Frailty and Aging group (CIF-A) (8) and validated for Portuguese in Brazil (9,10). The scale evaluates nine domains represented by 11 items: a) cognitive area by the test clock (1); b) general health status (2); c) functional independence (1). d) social support (1); e) medication use (2); f) nutrition (1); g) mood (1); h) continence (1); i) functional performance with the timed get up and go test to evaluate balance and mobility (1). The scoring system runs from 0-17 points with categories of “not frail”, “seemingly vulnerable” and “frail” (mild, moderate and severe) and will be used to define the frailty level of the subject.
c)    Anthropometric measurements:
Each subject was weighed without shoes and wearing minimal clothing on the Camry model EB903 electronic digital scale with a maximum capacity of 150 kilograms.
Height was measured using a graduated scale in centimeters (cm) and millimeters (mm) with a maximum height of 200 cm.
Abdominal Circumference (AC) was measured using a tape measure of 200 cm in length around the middle point between the iliac crest and the last rib; the measure for females is ≥ 80.0 cm and for males is 94.0 cm (11); an AC above these values for both genders means that the person is at risk of suffering cardiovascular diseases.
The Body Mass Index (BMI) was calculated by dividing the weight in kilograms by the square of the height in centimeters [weight (kg)/height2 (m)]. For all subjects, a BMI of ≤ 22 was considered underweight, 22.1 to 26.9 healthy and ≥ 27 overweight (11).
Waist/height ratio (WHtR) was calculated using the AC and the height in centimeters (AC/height) with a cut-off point of 0.50 indicating higher risk of cardio-metabolic diseases such as diabetes mellitus, stroke, Systemic Arterial Hypertension (SAH) and dyslipidemia (12).

We analyzed the data in Microsoft Excel® applying double entry and internal consistency, and later transferred it to the Statistical Package for Social Sciences SPSS v. 22.0
During data analysis, it was observed that of the 240 participants in the sample, five lacked data for height and/or weight, and were therefore excluded from the final analysis of 235 elderly subjects.
The descriptive statistics used for the quantitative variables were a central tendency measure (mean) and dispersion (standard deviation) with frequencies for the qualitative variables.
For the different analyses, the dependent variable, being the frailty syndrome, was subdivided on the scale into the categories “not frail”, “vulnerable” and “frail” (mild, moderate and severe) and the dichotomous independent variables such as gender and marital status were categorized as male/female and with/without a partner. For the anthropometric measurements, AC was divided into adequate (<80 cm in women and <94 in men) and inappropriate (≥ 80 in women and ≥ 94 men); WHtR was divided into <0.50 and ≥ 0.50; for BMI, ≤ 22 was categorized as underweight, 22.1 to 26.9 healthy and ≥ 27 overweight; we used the chi-square test.
To compare the means among gender with age, weight, height, AC for men and women, WHtR, BMI and frailty, we used the Student t test prior to the normal test.
For the multinomial logistic regression analysis, we used as outcomes the EFS categories of “vulnerable” and “frail” with reference to “not frail” category. Demographic variables included in the analysis were age (in years), gender and marital status. Anthropometric measurements analyzed were weight (in kilograms), WHtR, AC and BMI with a 95% Confidence Interval (CI). For all analyses, results were considered significant when p ≤ 0.05.


Results

There was a predominance of females and subjects with a partner; the mean age was 72.98 (SD=8.16) years, weight 68.56 (SD=14.41), AC 97.47 (SD=13.05), BMI (26.94 (SD=5.00), WHtR 0.60 (SD=0.08) and frailty 5.77 (SD=3.04). There was statistical significance between sex and weight, AC and WHtR (Table 1).

Table 1 Distribution of means and frequencies of elderly living at home by sex, Ribeirão Preto, SP, Brazil, 2012

Table 1
Distribution of means and frequencies of elderly living at home by sex, Ribeirão Preto, SP, Brazil, 2012

AC = Abdominal circumference; BMI = Body mass index; WHtR = Waist/height ratio; SD = Standard deviation; Student t test; p ≤ 0.05


We identified that 89 (37.9%) of the 235 subjects were found to be frail, 57 (24.2%) vulnerable and 89 (37.9%) not frail.
According to analysis, the mean weight for subjects found not frail was 70.57 (SD = 14.50), vulnerable 70.23 (SD = 12.82) and frail 65.48 (SD = 14.90) with p = 0.03. It was found that the mean AC for not frail was 97.94 (SD = 12.81), vulnerable 97.42 (SD = 12.64) and frail 97.04 (SD = 13.66). For WHtR it was estimated that the mean for the not frail was 0.60 (SD = 0.09), vulnerable 0.60 (SD = 0.07), frail 0.61 (SD-0.08). The mean BMI for the not frail is 27.27 (SD = 4.67), vulnerable 27.00 (SD = 4.70) and frail 26.57 (SD = 5.50). For the three measurements, we did not observe any statistically significant difference.
It was found that age was related to the EFS categories (p <0.001) and it increases with age being more evident in the vulnerable and frail categories. However, the most prevalent BMI was in the categories of ≤ 22 and ≥ 27 kg/m2 and association between the frail elderly (p = 0.045) (Table 2)

Table 2 Association of the Edmonton Frail Scale categories with gender and anthropometric measures of the elderly living at home. Ribeirão Preto, SP, Brazil

Table 2
Association of the Edmonton Frail Scale categories with gender and anthropometric measures of the elderly living at home. Ribeirão Preto, SP, Brazil

Note: SD = Standard deviation; AC = Abdominal circumference; WHtR = Waist/height ratio; BMI = Body Mass Index; ANOVA test †; Chi-square test*; p ≤ 0.05


Using the model of multinomial logistic regression, we identified a strong association between age and the likelihood of the subject being frail and/or vulnerable: the greater the age, the greater the risk of being frail (OR 1.177, 95% CI 1.117 – 1.240, p <0.001) and vulnerable (OR 1.090, 95% CI 1.035 to 1.148; p = 0.001).
It was found that subjects with a WHtR ≥ 0.50 had 2.752 (95% CI 1.490 to 7.452; p = 0.045) greater risk of being frail when compared to subjects with a WHtR <0.50. In addition, those with a BMI ≥ 27 had 3.184 (95% CI 1.860 to 11.794, p = 0.033) greater risk of being frail compared to those with a BMI between 22.1 and 26.9 kg/m2. (Table 3).

Table 3 Multinomial logistic regression model of the Edmonton Frail Scale categories adjusted for age, gender, marital status, and anthropometric measures. Ribeirão Preto, SP, 2012

Table 3
Multinomial logistic regression model of the Edmonton Frail Scale categories adjusted for age, gender, marital status, and anthropometric measures. Ribeirão Preto, SP, 2012

Note: WHtR = Waist/height ratio; BMI = Body Mass Index; OR = Odds Ratio; IC = Interval Confidence; p ≤ 0.0


Discussion


The study shows that a third of the elderly participants were considered frail and there was an association between age and the categories of EFS called vulnerable and frail. In addition, there was an association between WHtR ≥ 0.50 and BMI ≥ 27 km/m2 with the frailty category.
The EFS evaluation found that a portion of participants were considered frail, consisting predominantly of female participants. A study conducted in Australia with 82 elderly participants found that 48.9% were considered frail (13). In Ecuador, a study conducted on 311 elderly participants living in the community showed that 31.2% were frail (14), in Brazil a study of 128 elderly participants evaluated in a unit of the Family Health Strategy found that 30.1% were frail (15) and in all the studies presented, frailty was measured by the EFS and a predominance in females was observed.
The predominance of frailty in females occurs because of the longer life expectancy of this population (16) – the aging process causes reduced muscle mass due to decreased hormone levels (17) – as well as the long-lasting implications of life-long situations, such as the performance of domestic activities and restricted economic and social independence (6,15), which have an impact on quality of life.
It was found that the oldest band (> 80 years) were considered frail, a trend that was also observed in different national and international studies (6,15,18). A systematic review has shown that with increasing age there is a greater proportion of the number of older people with pre-frail and frail conditions, the authors suggesting that this is a progressive condition at this stage of life becoming significant after 80 years of age (19). This condition may be related to cumulative oxidative cellular stress and modulated by endogenous and exogenous agents leading to damaged deoxyribonucleic acid (DNA) during the aging process (20).
Among the sociodemographic variables of the study, there was a higher proportion of frail participants without a partner, a trend supported by different authors (18). This may be due to the lack of a companion with whom to share day-to-day life, making the most vulnerable more likely to develop this syndrome.
Regarding the anthropometric measurements, it was observed that the mean BMI was lower in those considered frail; similar results were found in a study of 3,075 elderly Brazilians, for which the mean BMI of frail participants was 26.80 kg/m2 (6). On the other hand, a study showed that elderly patients with a BMI of > 30 kg/m2 are more likely to be frail compared to not frail participants (21).
During the aging process, physiological changes occur that contribute to an increase in body weight, in females due to the onset of menopause and in males due to a lack of physical activity leading to inactivity (22). Beyond these factors, changes may be related to the activation of inflammatory processes triggering systemic changes, which influence the onset of frailty syndrome in the elderly (17).
The mean AC was similar for those considered frail, vulnerable and not frail. Different data were identified in the Brazilian study of 77 elderly wherein the frail showed greater AC compared to pre-frail and not frail (23).
Abdominal fat accumulation is associated with increased risk of cardiovascular disease (24) as well as the inflammatory process that releases proinflammatory oxytocin with less insulin resistance, which is linked to frailty syndrome, which reduces muscle fiber and muscular strength (6).
The mean WHtR was slightly higher in frail individuals, but it was found that individuals considered not frail had a WHtR higher than 0.50. A study of 867 elderly people found that 81.4% had inadequate WHtR, and an association with diseases such as diabetes mellitus and hypertension (24).
As regards BMI, a lower mean and higher predominance of frail elderly was observed. Similar results were found in a Brazilian study in which researchers found a lower mean (26.80 km/m2) and a higher percentage (24.91%) in elderly participants categorized as frail compared to not frail (6).
In an Iranian study of participants between 15 and 74 years, the authors found that WHtR was higher than 0.50 in both genders, especially in people aged over 50 years, 0.56 for males and 0.60 for females. In addition, the WHtR score increased according to the different categories of BMI, and was higher among those categorized as overweight and obese (25).
WHtR is a parameter that serves as cardiovascular and metabolic risk indicator, which can be used in different age groups, whilst BMI has the capability of identifying the association of metabolic risk with regard to designing effective strategies for the prevention and treatment of weight gain and obesity (12).
We point out as a limitation of the study that, due to its cross-sectional design, it is not possible to identify a causal relationship between the frailty variable and the demographic variables and anthropometric measures. On the other hand, the cut-off point used in the analysis of WHtR is not specific to the elderly and relates to the general population.


Conclusion

From the results and associations observed in the study, one can point out that frailty is a feature of old age and that it is dependent on internal factors and lifestyle that can have an impact on quality of life.
This association is reinforced in the data of this study, in which age was associated with the EFS category of vulnerable and frail. In addition, it was observed that a WHtR ≥ 0.50 and a BMI ≥ 27 km/m2 was associated with the frailty category.
Other studies on the elderly have suggested adjusting the WHtR cut-off point as an indicator to help health professionals prevent cardio-metabolic diseases in this age group.


Funding: This work was supported by the Coordination for the Improvement of Higher Education Personnel (CAPES).

Conflict of interest: No potential conflicts of interest exist for any of the authors.


References

1.    Brazilian Institute of Geography and Statistics. Projection of Brazil and federative units’ population. 2013. http://www.ibge.gov.br/apps/populacao/projecao/. Accesed 24 May 2016.
2.    Morley JE., Vellas B, van Kan GA et al. Frailty consensus: A call to action. J Am Med Dir Assoc, 2013;14(6): 392–7.
3.    Rockwood K, Mitnitski A. Frailty in relation to the accumulation of deficits. The J Gerontol A, Biol Sci Med Sci, 2007;62(7): 722–727.
4.    Collard RM, Boter H, Schoevers RA, Voshaar RCO. Prevalence of frailty in community-dwelling older persons: A systematic review. JAGS, 2012;60(8):1487–92.
5.    Bowen ME. The relationship between body weight, frailty, and the disablement process. J Gerontol B Psychol Sci Soc Sci, 2012;67(5):618–26.
6.    Moretto MC, Alves RMAA, Neri AL, Guariento ME. Relationship between nutritional status and frailty in Brazilian elderly. Rev Soc Bra Clín Méd, 2012;10(4):267–71.
7.    World Health Organization. Obesity. 2012. http://www.who.int/topics/obesity/en/. Acessed 15 April 2016.
8.    Rolfson DB, Majumdar SR, Tsuyuki RT, Tahir A, Rockwood K. Validity and reliability of the Edmonton Frail Scale. Age Ageing, 2006;35(5):526–9.
9.    Fabrício-Wehbe SCC, Cruz IR, Haas VJ, Diniz MA, Dantas RAS, Rodrigues RAP. Reproducibility of the Brazilian version of the Edmonton Frail Scale for elderly living in the community. Rev Lat Am-Enfermagem, 2013;21(6):1330–6.
10.    Fabrício-Wehbe SCC, Schiaveto FV, Vendrusculo TRP, Haas VJ, Dantas RAS, Rodrigues, RAP. Cross-cultural adaptation and validity of the “Edmonton Frail Scale-EFS” in a Brazilian elderly sample. Rev Lat Am-Enfermagem, 2009;17(6):1043–9.
11.    Ministry of Health of Brazil. Primary care notebooks n 38. Strategies for the person’s care with chronic disease: obesity. 2014. 1st edition. Brasilia.
12.    Ashwell M, Gunn P, Gibson S. Waist-to-height ratio is a better screening tool than waist circumference and BMI for adult cardiometabolic risk factors: Systematic review and meta-analysis. Obes Rev, 2012;13(3):275–86.
13.    Nguyen TN, Pepperell D, Morel-Kopp MC, Cumming RG, Ward C, Hilmer SN. Effect of frailty and age on platelet aggregation and response to aspirin in older patients with atrial fibrillation: A pilot study. Cardiol Ther, 2016;5(1):51-62.
14.    Del Brutto OH, Mera RM, Sedler MJ et al. The effect of age in the association between frailty and poor sleep quality: A population-based study in community-dwellers (The Atahualpa project). J Am Mes Dir Assoc 2016;17(3):269–71.
15.    Fernandes HCL, Gaspar JC, Yamashita CH, Amendola F, Alvarenga MRM, Oliveira MAC. Frailty assessment in the elderly assisted at a family health unit. Texto contexto – enferm, 2013;22(2):423–32.
16.    Mitnitski A, Collerton J, Martin-Ruiz C et al. Age-related frailty and its association with biological markers of ageing. BMC Med, 2015;13:161
17.    Espinoza SE, Fried LP. Risk factors for frailty in the older adult. Clin Geriatr, 2007;15(6):37–44.
18.    Woo J, Yu R, Wong M, Yeung F, Wong M, Lum C. Frailty screening in the community using the FRAIL scale. J Am Med Dir Assoc 2015;16(5):412–9.
19.    Mello ADC, Engstrom EM, Alves LC. Health-related and socio-demographic factors associated with frailty in the elderly: a systematic review. Cad Saúde Pública, 2014;30(6):1143–68.
20.    Mulero J, Zafrilla P, Martinez-Cacha A. Oxidative stress, frailty and cognitive decline. J Nutr Health Aging, 2011;15(9):756–60.
21.    García-Esquinas E, García-García FJ, León-Muñoz LM et al. (2015). Obesity, fat distribution, and risk of frailty in two population-based cohorts of older adults in Spain. Obesity, 2015;23(4):847–55.
22.    Buzzachera CF, Krause MP, Elsangedy HM et al. Prevalence of overweight, general and central obesity in elderly from Curitiba, Paraná, Brazil. Rev Nutr, 2008;21(5):525–533.
23.    Bastos-Barbosa RG, Ferriolli E, Coelho EB, Moriguti JC, Nobre F, Lima NK. Association of frailty syndrome in the elderly with higher blood pressure and other cardiovascular risk factors. Am J Hypertens, 2012;25(11):1156–61.
24.    Benedetti TRB, Meurer ST, Morini S. Anthropometric indices related to cardiovascular and metabolic diseases in older adults. Rev educ fís UEM, 2012;23(1):123–30.
25.    Gharakhanlou R, Farzad B, Agha-Alinejad H, Steffen LM, Bayati M. Anthropometric measures as predictors of cardiovascular disease risk factors in the urban population of Iran. Arq Bras Cardiol, 2012;98(2):126–35.

COMPARING OLDER ADULTS PRESENTING WITH DEHYDRATION AS A PRIMARY DIAGNOSIS VERSUS A SECONDARY DIAGNOSIS IN THE EMERGENCY DEPARTMENT


J.C. Mentes1, H. Aronow2


1. University of California Los Angeles, USA; 2. Research Scientist III, Nursing Research and Development, Cedars-Sinai Medical Center, USA

Corresponding Author: Janet C. Mentes, Associate Professor, University of California Los Angeles, USA , jmentes@sonnet.ucla.edu


J Aging Res Clin Practice 2016;inpress
Published online October 6, 2016, http://dx.doi.org/10.14283/jarcp.2016.118


Abstract

Objectives: We compared clinical data of older adults, >65 years of age who presented to a large urban ED with a primary diagnosis of dehydration, ICD code 276.5 (PD) to those with dehydration as a secondary diagnosis (SD). Design: Comparative study using a large hospital emergency room administrative database (2008-2009). Setting: Large urban hospital.  Participants: 231 participants mean age 81 years, 86 with PD were matched on age, gender and ethnicity to 145 with SD. Measurements: We collected data on chief complaints, laboratory tests, medical diagnoses, and medications as listed in the database. Results: Among major diagnoses, those with SD were more likely to have an infection.  A logistic regression with SD as dependent variable and using variables significant at the univariate level revealed that infections (AOR= 6.7, 95% CI 2.92, 15.08) and difficulties with activities of daily living (AOR= 2.19, 95% CI 1.02-4.66) were more likely in those presenting with SD than with PD.  Patients with SD were less likely to have a diabetes diagnosis (AOR=.32, 95% CI .14, .72), have diarrhea (AOR= .50, 95% CI .22, 1.19), and present with a dry mouth (AOR= .39, 95% CI, .19, .78). Those with SD were significant more likely to be repeat ED users, have longer hospital stays and have higher hospital costs than those with PD. Conclusions: Comorbid dehydration is often obscured by the seriousness of the presenting condition in the ED.  This creates a missed opportunity to educate the patients and their families about the importance of maintaining adequate hydration, which may prevent rehospitalization.

Key words: Dehydration, emergency room, aged.


Introduction

Older adults are more frequent users of emergency department (ED) services.  The oldest adults, those 75 years and older, accounted for the greatest number of visits (68.2 vs 44.5 per 100 persons overall) according to the 2011 Emergency Room Summary of the National Hospital Ambulatory Medical Care Survey (1). Additionally, studies show that when compared with younger adults, older adults are more likely to be misdiagnosed, discharged to home with untreated conditions, resulting in adverse events and repeat visits to the ED (2).
Dehydration is a condition that complicates ED visits (3-5). It takes various forms, including water loss dehydration, which is a condition where a reduction in total body water occurs, and water and salt loss dehydration (6).  Water loss dehydration tends to occur gradually over time (passively, i.e., from not fully replacing fluids being lost over time) versus salt and water loss dehydration, which tends to occur more abruptly (actively, i.e., from acute salt/water loss through, for example, vomiting or diarrhea) (7).  Water loss dehydration appears to be the most prevalent in community dwelling older adults. In two cross-sectional community survey studies, (Third National Health & Nutrition Exam-NHANES III and the Duke University Epidemiological Study of the Elderly-EPSE), that included the collection of serum osmolality values and an analysis that controlled for the effect of elevated glucose levels, Stookey and colleagues (8,9) demonstrated almost identical prevalence rates of mild (40%) and overt dehydration (20%) among community dwelling older adults.  Likewise in residents of nursing homes, dehydration is a common condition requiring transfer to the emergency department (5). Highlighting the seriousness of this condition, of older Medicare patients hospitalized with a diagnosis of dehydration, 18% died within 30 days and approximately half died within a year of their dehydration diagnosis (10). More recently, in a sample of older veterans hospitalized with a diagnosis of dehydration (ICD-9 276.5), 13.8% and 29% died within 30 days and six months respectively, which was significantly different than hospitalized older veterans without dehydration (11).  One of the difficulties of treating older adults in the ED is that commonly, an insidious and deadly condition such as dehydration may be overlooked or minimized in the diagnostic equation.  Older adults often present to the ED with exacerbations of chronic diseases or acute infections that coexist with dehydration which may complicate treatment.  As examples, hospitalizations for urinary tract infections and septicemia in adults 85+ increased by 56% and 85% respectively between 2000-2010 (12).  Both of these conditions are linked to hydration status (11).
Dehydration is also costly.  In a recent review, Frangeskou and colleagues (13) found that dehydration in the hospitalized patient increased costs by 7-8.5%. Dehydration is also designated as one of 13 ambulatory-care sensitive conditions (ACSC), a condition that should be prevented by good ambulatory care.  However, in 2012, 50% of the 172,520 admissions of persons with a primary diagnosis of dehydration 50% were older than 65 years at a cost of over 3 billion dollars (13).  In addition, almost 1 in 10 (9%) of all hospitalizations in persons over 65 in 2012 had dehydration as a secondary diagnosis, which is documented to contribute to the disease burden of common illnesses such as heart disease, diabetes, renal failure, stroke, pneumonia, and urinary tract infections (10,14-16).  Since 2007 the number of older adults aged 75 years and older who have been admitted with a primary diagnosis of dehydration has remained static at between 75-77/10,000 admissions, demonstrating the difficulty with managing hydration in older adults  (16-18). Although there are estimates for the prevalence of dehydration as a complicating secondary diagnosis; it is likely that many cases of secondary diagnosis are missed as the older patient presented to the ED with more serious conditions that were likely exacerbated by inadequate hydration prior to admission (19).
In light of the impact of dehydration on health outcomes and costs, the purpose of this secondary data analysis was to improve understanding of how best to treat patients with dehydration and prevent future hospitalizations by comparing and contrasting the admission data of older adults, >65 years of age who presented to a large urban ED with dehydration (ICD-9 276.5) as a primary diagnosis (PD) and those presenting with dehydration as a secondary diagnosis (SD). Characterizing these different presentations can provide meaningful information for individually tailored interventions to minimize dehydration in this population.


Methods

We employed a comparative study design using electronic ED administrative data and ED medical records between July 1, 2008 and June 30, 2009 for a major medical center in Los Angeles.  This medical center had over 15,000 ED contacts in persons 65 years old and over during this one year time period.  We received human subject approval from the respective IRBs of the university and medical center.
Procedure.  We used an administrative database of adults, aged 65 and older that presented to the ED with a diagnosis of dehydration, as a primary or any diagnosis for that contact.  To control for potential confounding demographic variables we included all primary dehydration cases (n=86) and matched them with secondary cases based on age, gender, and ethnicity.  We attempted to match every participant with primary dehydration to 2 participants with secondary dehydration; each participant had at least one match to a participant with secondary dehydration.  After identifying the cases of primary dehydration (n=86), a trained research assistant matched the primary cases to secondary cases (n=145) ensuring that there were no duplicates in the data set; ie the same person presenting at one time point in the specified period with dehydration as a primary diagnosis and with dehydration as a secondary diagnosis at another time point.  After this participant list was generated, a chart review of the electronic ED record was conducted to collect specific clinical information, including laboratory tests, medications, presenting complaint, and clinical signs and symptoms of dehydration (Table 1).  Data were then de-identified prior to analyses.

Table 1 Clinical and Laboratory Data from Participant’s Record

Table 1
Clinical and Laboratory Data from Participant’s Record


Data Preparation and Analysis

The de-identified administrative data set was prepared in an excel spreadsheet.  One RA accomplished the data compilation with data checks completed by the PI. The data were then imported into an SPSS 17.0 file for analysis.
Data analysis was conducted using Student t-tests for continuous data and chi square tests for dichotomous data to evaluate the differences between the participants with a diagnosis of primary versus secondary dehydration.  Independent t-tests were used even though the sample was selected based on matched participants because the purpose of matching participants was to control for covariates (gender, age, and ethnicity) that might obscure meaningful relationships. A logistic regression with primary or secondary dehydration as the dependent variable was conducted with the covariates found significant at the p< 0.15 level in the unadjusted analyses using Pearson’s chi square statistic.


Findings

Demographic Data

The sample for this project included 86 participants who presented with PD to the ED matched with 145 participants who had SD (total n=231).  On average participants were 81 years old, about half female and predominately white.  Age, gender and ethnicity were evenly distributed between the groups as a function of the matching process (see Table 2).

Table 2 Demographics of Participants

Table 2
Demographics of Participants

All comparisons nonsignificant


We found differences in chief complaints between the groups with individuals who had dehydration as a primary diagnosis presenting with more generalized symptoms or geriatric syndromes of weakness, dizziness, nausea/vomiting and altered mental status than those individuals with secondary dehydration.  Persons with a secondary diagnosis of dehydration were more likely to present with pain or fever/chills (Table 3).
Table 4 lists the primary diagnoses of persons with dehydration as a secondary diagnosis.  The top five diagnoses were: any infection (26.8%), gastrointestinal problems (11%), trauma/fractures (8.2%) septicemia (7.6%), and acute renal failure (6.2%).
The most commonly prescribed medications for persons with primary and secondary dehydration are presented in Table 5.  Most common classes of drugs; those for hypertension, lipid lowering, gastrointestinal problems, and pain medications were similar whether the individual presented with primary or secondary dehydration.  However a striking difference was observed in the use of diuretics, which was higher in persons with primary dehydration (16.3% vs 6.3%, p=.007).

Table 3 Frequency of Most Prevalent Chief Complaints in Persons presenting with Dehydration

Table 3
Frequency of Most Prevalent Chief Complaints
in Persons presenting with Dehydration

Table 4 Primary Diagnoses of Persons with a Secondary Diagnosis of Dehydration (n=145)

Table 4
Primary Diagnoses of Persons with a Secondary Diagnosis of Dehydration (n=145)

Table 5 Comparison of Selected Medications between Primary and Secondary Dehydration

Table 5
Comparison of Selected Medications between Primary and Secondary Dehydration

Note. *Excludes aspirin and acetaminophen

Table 6 Unadjusted and Adjusted Covariates for Secondary Dehydration

Table 6
Unadjusted and Adjusted Covariates for Secondary Dehydration

Note.  OR=Odds Ratio, CI=Confidence Interval.   * Backward Logistic Regression.

Clinical Differences

The assessment for dehydration in the ED was difficult to explore because the data included in the medical record was limited, specifically laboratory studies. Although vital signs were well documented, of the 231 persons included in this study only 1 had a urine or serum osmolality and 132 had a urine specific gravity documented in the medical record.  Serum sodium was collected in 78/ 86 (90.6%) persons with PD and 141/145 (97%) of those with SD and was significantly higher in persons with SD (141.4 meq/L vs 139.9 meq/L, p<.05) than those with PD. No other laboratory measurements specifically BUN creatinine ratio or urine specific gravity were significantly different between the groups.
Of the vital signs, respirations were the only sign significantly different between the groups, with persons with SD having slightly higher respirations (p<.05). Other clinical signs and symptoms of dehydration were not consistently documented in the ED record, however for those individuals with documentation, there were some significant differences between persons presenting with PD versus SD.
Unadjusted comparisons of 21 variables (clinical signs, medical diagnoses, medications, laboratory tests) shown to be related to dehydration in the literature showed that common chronic diseases in older persons, such as cancer, cardiac disease, dementia, and chronic renal disease were not significantly different between the PD and SD (data not shown). However, 9 variables were significant at p< .15 level, including: activities of daily living (ADL) difficulties, presence of any infection, altered mental status, diagnosis of diabetes, diarrhea, diuretic use, presence of dry mouth, presence of urinary tract infection (UTI) and vomiting (Table 6).  These covariates were considered for inclusion in the adjusted multivariate analysis (See Table 6).  Although not statistically significant in unadjusted analysis, urine specific gravity was included in the logistic regression models because it was the most frequently used laboratory test to ascertain hydration status.
A backward stepwise logistic regression was performed with the 10 identified variables with primary versus secondary dehydration as the dependent variable (Table 6).  Variables included in this model were the presence of any infection, dry mouth, diagnosis of diabetes, change in ADLs and diarrhea   The model had a significant omnibus test of model coefficients, p<.001 and Hosmer and Lemeshow test , p=.35.  This model predicted secondary dehydration 90% of the time, whereas the overall percentage of correct classification was 74%.
In this model the presence of an infection was between 6 to 7 times more likely in an older patient with dehydration as a secondary diagnosis than in a patient with primary diagnosis of dehydration. Conversely, for the clinical sign of dry mouth or a diagnosis of diabetes, a patient with secondary dehydration was 60%, and 78% less likely to present with these conditions than one with primary dehydration, respectively.  Difficulties with ADLs were twice as likely in an individual who presented with SD versus one who presented with PD.

Hospital Utilization

In terms of the ED experience for older individuals with dehydration, the time spent in the ED and number of ED visits per year for dehydration did not significantly differ.  However, persons with SD were more likely to be a repeat ED user for any cause than those with primary dehydration (χ2 =4.52, p=0.03).  Hospital utilization and costs also were significantly different for individuals with primary and secondary dehydration with individuals with secondary dehydration having significantly longer hospital stays, (8.0 days vs 4.69 days, p<.000) at significantly increased costs ($23,356.79 vs $12, 094.90, p<.000) than those individuals with primary dehydration.


Discussion

Many older persons present with dehydration as a complicating feature to their ED contact.  This paper explored the differences between older individuals presenting with dehydration as a primary diagnosis and those who presented with dehydration as a secondary diagnosis.  What is evident from this study is that older persons presenting with SD versus PD have different patterns of chief complaints.  Those with SD presented with chief complaints of fever/chills and pain with a high likelihood of the presence of an infection and difficulties with daily function.  Persons with SD were less likely to have more generalized symptoms typical of the geriatric syndromes of fatigue, weakness, dizziness, and altered mental status and less likely to present with more classic signs of dehydration such as dry mouth and diarrhea. They were also less likely to be diabetic than those presenting with PD.  In addition persons with SD were more likely to be a repeat ED user at a greater cost to the health care system, making it important to further explore the contribution of dehydration to repeat hospitalizations and potential treatment of dehydration to prevent readmissions.
The findings suggest that older individuals presenting to the ED with a primary diagnosis of dehydration have identifiable brief onset conditions that predispose them to dehydration, such as vomiting and diarrhea or sequela of diabetes.  These conditions actively dehydrate the individual and are more commonly accepted as causes of dehydration.  On the other hand individuals presenting with secondary dehydration present with a chronic illness picture that is complicated by decreased functional ability, and infections.  Although we cannot be sure of the temporal issues involved with dehydration as a complicating diagnosis, this analysis lends support to the likelihood that those elders presenting with secondary dehydration most likely suffer from passive water loss dehydration that occurs little by little over time, possibly exacerbated by inability to procure adequate fluids due to functional impairment.  The distinction between active and passive dehydration is important because recent research has raised the question of which hydration biomarkers are specific to the mechanism (active vs passive) of dehydration (7, 20, 21).  In younger adults, the urine biomarkers of specific gravity and urine osmolality are more sensitive to passive dehydration (7, 21) and are responsive to changes in water intake over 24 hours (22).  It is not known if this is true for older adults and may not be practical for ED practice given that serial measurements are necessary.  On the other hand, serum and salivary osmolality have been documented as more sensitive to active dehydration in younger adults (7, 21).  Fortes and colleagues (20) recently reported that for single laboratory tests for dehydration in adults > 60 years seen in the ED or admitted to an acute medical care unit, salivary osmolality offered the best diagnostic accuracy of both active and passive dehydration.
There are several limitations to this study.  It was a cross-sectional study of secondary administrative and chart data, which was limited by the constraints of the documentation.  As such, no causal relationships could be determined and the temporal aspects of whether suboptimal hydration occurred prior to or as a consequence of chronic illness could not be determined.  Additionally, missing data, specifically the lack of uniform laboratory information for all participants limited the ability to compare the participants based on whether they presented with PD or SD.  However, several of the findings are supported by other investigations that reported that diabetes (23), difficulties with ADLs (11) and dry mouth/tongue (24, 25) have been associated with dehydration, although the distinction between active or passive dehydration was not specified.
It is important to note that the role that dehydration plays as a co-morbid condition is often obscured by the seriousness of the presenting condition, which is often an infection.  This likely represents a missed opportunity for health care providers in all settings to educate patients and families about the importance of adequate daily hydration, including how much, what type of fluids taking into consideration the patient’s activity level and any restrictions related to the management older persons who are vulnerable to dehydration due to chronic illness.  This is one strategy for possibly preventing unnecessary and unwanted hospitalizations.


Conflict of interest: None


References

1.     Centers for Disease Control, National Center for Health Statistics (2011). National Hospital Ambulatory Medical Care Survey: 2011 Emergency Department Summary. retrieved from: http://www.cdc.gov/nchs/data/ahcd/nhamcs_emergency/2011_ed_web_tables.pdf
2.      McCusker, J., Cardin, S., Bellavance, F., & Belzile,E. Return to the emergencey department among elders: Patterns and predictors. Academic Emergency Medicine, 2000;7, 249-259.
3.      Gordon, J.A., An, L.C., Hayward, R.A. & Williams, B.C. Initial emergency department diagnosis and return visits: risk versus perception. Ann Emerg Med 1998;32, 569-73
4.      Bennett, J.A., Thomas, V. & Riegel, B. Unrecognized chronic dehydration in older adults: examining prevalence rate and risk factors. J Gerontol Nurs 2004;30, 22-8.
5.      Hsiao, CJ, & Hing, E. Emergency department visits and resulting hospitalizations by elderly nursing home residents 2001-2008. Research on Aging, 2014;36, 207-227. doi: 10.1177/0164027512473488.
6.      Thomas, DR., Cote, TR, Lawhorne, L., Levenson, SA, Rubenstein, LZ, Smith, DA, Stefanacci, RG, Tangalos, EG, & Morley, JE. Understanding clinical dehydration and its treatment. Journal of American Medical Directors Association, 2008;4,292-301. doi: 10.1016/j.jamda. 2008.03.006.
7.      Munoz, CX., Johnson, EC, DeMartini, JK, Huggins, RA, McKenzie, AL, Casa, DJ, Maresh, CM, & Armstrong, LE. Assessment of hydration biomarkers including salivary osmolality during passive and active dehydration.  European Journal of Clinical Nutrition, 2013;67, 1257-1263. Doi: 10.1038/ejcn.2013.195.
8.      Stookey, J.D. (2005): High prevalence of plasma hypertonicity among community-dwelling older adults: results from NHANES III. J Am Diet Assoc 2005;105, 1231-9.
9.      Stookey, J.D., Pieper, C.F. & Cohen, H.J. Is the prevalence of dehydration among community-dwelling older adults really low? Informing current debate over the fluid recommendation for adults aged 70+years. Public Health Nutr 2005;8, 1275-85.
10.      Warren, J.L., Bacon, W.E., Harris, T., McBean, A.M., Foley, D.J. & Phillips, C. The burden and outcomes associated with dehydration among US elderly, 1991. Am J Public Health 1994;84, 1265-9.
11.      Wakefield, B., Mentes, J., Holman, J. Culp, K. Postadmission dehydration: Risk factors, indicators and outcomes. Rehabilitation Nursing, 2009;34 (5), 209-216
12.      Levant, S., Chari, K., & DeFrances, CJ. Hospitalizations for patients aged 85 and over in the United States, 2000-2012, NCHS brief, 2015;no. 182. Hyattsville, MD: National Center for Health Statistics.
13.      Frangeskou, M., Lopez-Valcarcel, B., & Serra-Majem, L. Dehydration in the elderly: A review focused on economic burden. The Journal of Nutrition, Health & Aging, 2015;19, 619-627.
14.      Liu, CH, Lin, SC, Lin, JR, Yang, JT, Chang, YJ, Chang, CH, Chang, TY….Lee, TH.  Dehydration is an independent predictor of discharge outcome and admission cost in acute ischaemic stroke. European Journal of Neurology, 2014;21, 1184-1191. doi: 10.1111/ene.12452
15.      Rowat, A., Graham, C., & Dennis, M. Dehydration in hospital-admitted stroke patients. Detection, frequency and assessment. Stroke, 2012;43, 857-859. Doi: 10.1161/STROKEEAHA.111640821.
16.      Xiao, H., Barber, J, & Campbell, ES. Economic burden of dehydration among hospitalized elderly patients. American Journal of Health-System Pharmacy, 2004;61, 2534-2540.
17.      Agency for Healthcare Research & Quality.  Prevention quality indicators comparative data Version 3.1 March 12, 2007. Retrieved from http://www.qualityindicators.ahrq.gov/Downloads/Modules/PQI/V31/pqi_comparative_v31.pdf.
18.      Agency for Healthcare Research & Quality. Prevention quality indicators benchmark data tables Version 5 March 2015. Retrieved from  http://www.qualityindicators.ahrq.gov/Downloads/Modules/PQI/V50/Version_50_Benchmark_Tables_PQI.pdf.
19.      Mentes, JC. The complexities of hydration issues in the elderly. Nutrition Today, 2013;48 (4S), S10-S12.
20.      Fortes, MB., Owen, JA., Paymond-Baker, P., Bishop, C., Elghenzai, S., Oliver, SJ, & Walsh, NP. Is this patient dehydrated? Diagnostic accuracy of hydration assessment using physical signs, urine , and saliva markers. Journal of the American Medical Directors Association, 2015;16, 221-228. doi:10.1016/j.jamda2014.09.012.
21.      Munoz, CX, McKenzie, AL, & Armstrong, LE. Optimal hydration biomarkers: Consideration of daily activities. Obesity Facts, 2014;7(suppl 2), 13-18. doi:10.1159/000360655.
22.      Perrier, E., Demazieres, A., Girard, N., Pross, N., Osbild, D., Metzger, D., Guelinckx, I., & Klein, A. Circadian variation and responsiveness of hydration biomarkers to changes in daily water intake. European Journal of Applied Physiology, 2013;113, 2143-2151. doi: 10.1007/s00421-013-2649-0.
23.      Hooper, L., Bunn, D., Downing, A., Jimoh, F., Groves, J., Free, C…Shepstone, L. Which frail older people are dehydrated? The UK DRIE Study. Journal of Gerontology: Medical Sciences. Epub ahead of print. 2015;doi:10.1093/gerona/glv205
24.     Gross, CR., Lindquist, RD, Wooley, AC, Granieri, R., Allard, K., &Webster, B. (1992). Clincal indicators of dehydration severity in elderly patients. Jouranl of Emergency Medicine, 1992;10  (3), 267-274.
25.      Vivanti, A., Harvey, K, & Ash, S. Developing a quick and practical screen to improve the identification of poor hydration in geriatric and rehabilitative care. Archives of Gerontology and Geriatrics, 2010;50, 156-164. doi: 10.1016/j.archger.2009.03.003.

DEPRESSIVE SYMPTOMS AND LEVEL OF 25-HYDROXYVITAMIN D IN FREE-LIVING OLDEST OLD


M.T. da Rocha Lima1, O. Custódio2, P. Ferreira do Prado Moreira3, L.M. Quirino Araujo2, C. de Mello Almada Filho2, M. Seabra Cendoroglo4


1. Geriatrics Division, Paulista School of Medicine, Federal University of Sao Paulo, Brazil; 2. Geriatrics Division, Paulista School of Medicine, Federal University of Sao Paulo, Brazil; 3. Nutritionist at the Geriatrics Division, Paulista School of Medicine, Federal University of Sao Paulo, Brazil; 4. Professor at the Geriatrics Division, Paulista School of Medicine, Federal University of Sao Paulo, Brazil

Corresponding Author: Márcio Tomita da Rocha Lima, Rua Professor Francisco de Castro, 105, Vila Clementino, CEP 04020-050, São Paulo – São Paulo, Brazil, Telephone number: +551155764848 – extension line 2298, marciotrl@yahoo.com.br

J Aging Res Clin Practice 2016;5(3):142-146
Published online June 16, 2016, http://dx.doi.org/10.14283/jarcp.2016.101


Abstract

Background: Nowadays, the relation between hypovitaminosis D and depression has been reported and it is estimated that 1 billion people worldwide have vitamin D deficiency or insufficiency. However, the oldest old people are not included or are under-represented in most of the studies. Objective: To examine the association between depressive symptoms and 25-hydroxyvitamin D level (25(OH)Vit D) in elderly aged 80 and over who are physically more active and independent. Design: Cross-sectional study. Setting and Participants: Data collected from 182 oldest old people, aged 80 and over in the Geriatric Division from Federal University of São Paulo. Measurements: The functionality was evaluated by the Instrumental activities of their daily living (IADL). The approach of the depressive symptoms was done by the Geriatric Depression Scale (GDS) in its reduced 15 item version. 25-hydroxyvitamin D (25(OH)Vit D) analyses was done in serum sample refrigerated and protected from solar exposition. We considered deficiency serum level of 25(OH)Vit D <10ng/mL, insufficiency between 10 and 30ng/mL and sufficiency >30ng/mL. Results: According to blood level of 25(OH)Vit D we found difference between GDS score comparing the groups: “deficiency” (U=144,50; z=-3,126; p=0,002) and “insufficiency” groups (U=975,50; z=-2,793; p=0.005) are different than “sufficiency” group. Conclusion: In free-living independent oldest old people the goal of 25(OH)Vit D levels can be higher to avoid depressive symptoms, levels under 30ng/mL can be inadequate. Considering that the costs are low and side effects are not common, 25(OH)Vit D supplementation can be an important public health action.

Key words: Oldest old, aged, 80 and over, vitamin D, depression.


Introduction

The accelerated aging of Brazil has one of its epidemiologic consequences: the increased number of elderly with chronic diseases and incapacities that generate dependency (1). Late-life depression (LLD) affects from 10% to 22% of the growing geriatric population living in the community (2,3), it´s a risk factor for all-cause mortality in the elderly (4) and adults 85 and older appear to be more vulnerable to depression than other age groups (5). Wu et al. (6) demonstrates that the age-related growth of depressive symptoms occurs wholly in the context of medical comorbidity and does not have an independent effect. Weyerer et al. (7) found that the incidence of depression symptoms, measured using the GDS-15 Geriatric Depression Scale, increases significantly with age in non-demented primary care attenders aged 75 years and older. The presence of depressive symptoms as a risk factor for disability occurs in both genders (8) and it is associated with development of cognitive decline in older patients (9).
Nowadays, the relation between hypovitaminosis D and depression has been reported and it is estimated that 1 billion people worldwide have vitamin D deficiency or insufficiency (10). Hoogendijk et al. (11), in a cohort study, found that the lower levels of vitamin D were associated with higher intensity of depression. Milaneschi et al. (12), in 2010, also in a cohort study (InCHIANTI study), evaluated elderly of ages 65 and up and observed that hypovitaminosis D was a risk factor for the development of depressive symptoms in elderly. On the other hand, Toffanello et al. (13), in a prospectively studied population (Pro.V.A. study), showed that there was no direct effect between vitamin D deficiency and the onset of late-life depressive symptoms.
The oldest old people are not included or are under-represented in most of the studies. Because of that, we want to know if there is association between depressive symptoms and vitamin D in elderly aged 80 and over who are physically more active and independent.


Methods

Studied population

The analyzed data is part of a cohort study about free-living independent elderly aged 80 and over. The elderly have been following in the Geriatric Division from Federal University of São Paulo. We didn´t include oldest old people with dementia, cancer, acute disease, dialytic therapy, chemotherapy or radiotherapy.
The studied population included 182 oldest old people evaluated from the period of January 2010 to January 2012. The experimental protocols were approved by the appropriate institutional review committee and meet the guidelines of their responsible governmental agency. Informed consent was obtained from all individual participants included in the study (Federal University of São Paulo Ethical Committee approval number 1532/09).

Clinical assessment

The collected data were sex, age, ethnicity, precedence, smoking history (current, previous or more than one year without smoking, never smoked), alcohol history (drinking any amount of alcohol in the last 10 years), health perception (excellent, good, regular or bad), chronic pain (presence of pain for more than 3 months), and any exposition to sunlight. The neuropsychological evaluation was made by the Mini–mental state examination (MMSE) developed by Folstein and validated in Brazil by Brucki et al. (14). The functionality was evaluated by the Instrumental activities of their daily living (IADL) (15). The nutritional evaluation was made by the means of the Body mass index (BMI) (16), abdominal circumference (AC – we considered as a high AC value in elderly ≥ 102cm in men and ≥ 88cm in women), hip circumference (HC) and waist-to-hip ratio (WHR=CA/HC; WHR > 0,99cm2 in men or > 0,97 in women is associated with an increased cardiovascular risk) (17).
The approach of the depressive symptoms was done by the Geriatric Depression Scale (GDS) in its reduced 15 item version. Paradela et al. (18) validated the Portuguese version of the GDS to track depressive symptoms in ambulatory elderly, with a cut mark at 5/6 showing sensibility of 81% and specificity of 71%.

Biochemical analysis

The biochemical analysis of creatinine, fasting glycemia and serum hemoglobin was measured on a fasting blood specimens (collected after 10-hour fast). 25(OH)VitD analyses was done in serum sample refrigerated and protected from solar exposition. We used the DiaSorin LIAISON® 25(OH)VitD, which one is based on chemiluminescence technology (CLIA). We considered deficiency serum level of 25(OH)VitD <10ng/mL, insufficiency between 10 and 30ng/mL and sufficiency >30ng/mL (10).

Statistical analysis

For data processing we used “Statistical Package for the Social Sciences (SPSS) for Windows” (version 13). A measure of central tendency was represented by median and interquartile amplitude (IA) when appropriate. We used the bootstrapping method for assigning confidence intervals from the proportion and median. Levene’s test was used to assess the equality of variances for a variable calculated for two or more groups. We also used t Student´s test to determine if two sets of data were significantly different from each other, and the non-parametric tests Mann-Whitney (U) and Kruskal-Wallis (KW). When the Kruskal-Wallis (KW) test leads to significant results, Mann-Whitney (U)´s test was used with Bonferroni-corrected significance level. Chi-square test (X2) was used considering the recommendations of Cochran and the Fisher’s exact test when these recommendations were violated.


Results

We studied independent oldest old people, with a IADL median 26,0 (IA 5,0) for men and 24,0 (IA 5,0) for women (p=0,187). Most of them were women and 82% of oldest old women never smoked (Table 1). The women had more depressive symptoms than men. On the other hand, oldest old men had a better performance on MMSE, with a schooling median 4,0 (IA= 5,5) for men and 3,0 (IA 3,3) for women (p=0,09). 83,7% of men and 88,7% of women had insufficiency or deficiency blood levels of 25(OH)Vit D although 52,2% declared sunlight exposition.
We also observed that 66,7% of men and 49,2% of women had excellent or good health perception (p=0,154). 77,6% of men and 62,4% of women did not have chronic pain (p=0,076) and 36,2% of men and 64,6% of women had abdominal circumference increased (X2=11,280; gl=1, p=0,001). There were no differences between serum levels of fasting glycemia of men compared to women (median 87,0 +/- 16,0 and 88,0 +/- 17,0 respectively). However, the men hemoglobin (average 13,7 +/- 1,6) was greater than for women (average 13,2 +/- 1,5; p=0.005).
According to blood level of 25(OH)Vit D (Table 2) we found difference between GDS score comparing the groups: “deficiency” (U=144,50; z=-3,126; p=0,002) and “insufficiency” groups (U=975,50; z=-2,793; p=0.005) are different than “sufficiency” group; but there was no difference between “deficiency” and “insufficiency” groups (U=1460,00; z=-1.263; p=0,206).

Table 1 Characterization of elderly aged 80 years and over according to gender

Table 1
Characterization of elderly aged 80 years and over according to gender

IA: interquartile amplitude; CI: confidence interval; SD: standard deviation; MMSE: Mini–mental state examination; GDS: Geriatric depression scale; BMI: Body mass index; Missing values a=9; *U=3116,50, z=-0,452; **U=2399,00, z=-2,678; ***U=2444, z=-2,605; ****U=2835,50, z=-0,428; #X2=1,505, gl=2; &Fisher’s exact test.


Table 2 Characterization of elderly aged 80 years and over according to levels of 25(OH)Vit D

Table 2
Characterization of elderly aged 80 years and over according to levels of 25(OH)Vit D

IA: interquartile amplitude;  CI: confidence interval; SD: standard deviation; MMSE: Mini–mental state examination; GDS: Geriatric depression scale; BMI: Body mass index; WHR= waist-to-hip ratio ; Clearance of creatinine: estimated clearance of creatinine. Missing values a= 9; b= 8; c=8; d=13; e=2. *KW=5,503, gl=2; **KW=1,539, gl=2; ***KW=10,743, gl=2; ****KW=1,954, gl=2; *****KW=9,103, gl=2; ******KW=2,485, gl=2; #X2=1,505, gl=2; ##X2=4,48, gl=2; ###X2=4,249, gl=2; & Fisher’s exact test.


Discussion

In our cross-sectional study, we observed that there was association between worst GDS scores with < 30ng/mL of 25(OH)Vit D in oldest old people. It´s already known that depressive symptoms are associated with clinical 25(OH)Vit D deficiency (levels <10ng/mL) (19) in elderly 65 years of age. This was confirmed in a systematic review and meta-analysis of epidemiological studies: depression risk was found to be inversely associated with serum 25(OH)Vit D in both cross-sectional and cohort studies (20). But it seems that in free-living independent oldest old people the goal of 25(OH)Vit D levels can be higher to avoid depressive symptoms, levels under 30ng/mL can be inadequate. We have to consider that there is a decline of 25(OH)Vit D levels with age and also a gender difference (21) that is going to increase the risk of depression in oldest old age and can compromise functionality.
Low blood levels of 25(OH)Vit D can be related with the inflammatory status observed in depressed patients, because in these conditions, auto-reactive T cells against tissues and synthesis of the interleukins and the pro-inflammatory cytokines (IL-12, interferon gama) are stimulated by the immunologic system (22). Synthesis and metabolism of serotonin (5-hydroxytryptamine) is influenced by cytokine signaling pathways (23). In physiologic conditions, indoleamine 2,3-dioxigenase (IDO) compete by tryptophan hydroxylase (TH) in tryptophan metabolism. The activation of IDO metabolizes the tryptophan in kynurenine and in the end quinolinic acid. It decreases brain tryptophan and the serotonin levels.
The functional reserve decline with age and also the capability to the oldest old to maintain a health life style and independency. It´s interesting to note that these oldest old people are independent, free-living individuals and even so had 25(OH)Vit D levels under 30ng/mL. This was found for others researchers in elderly above 60 years of age (24, 25) despite their high sun exposure during the summer months and regarding the nutritional status (26).
It´s suggested that 25(OH)Vit D supplementation is indicated as a complement of depression treatment (27). Zanetidou et al. (28) demonstrated that administering 25(OH)Vit D to patients 65 years or older as an adjunct to antidepressant therapy was associated with a significant improvement in the depressive symptomatology. Considering that the costs are low and side effects are not common, 25(OH)Vit D supplementation is very cost-effective and can be a good choice to prevent depressive symptoms. This can be an important public health action to avoid depressive humor in oldest old people (29). We already know that to prevent fractures the goal is > 30ng/mL of 25(OH)Vit D (30) and it seems that, in oldest old people these levels are also recommended to avoid depressive symptoms. It´s important to establish if to avoid depressive symptoms in oldest old the goal is also > 30ng/mL of 25(OH)Vit D.
Our study has limitations: selection was by convenience and the GDS is a screening instrument and detect depression symptoms and not the diagnosis of depression.  It´s also important to note that 56,9% of the sample had an increased abdominal circumference that can be related with low levels of 25(OH)Vit D and also with a more inflammatory condition.
We conclude that the goal of 25(OH)Vit D levels can be higher to avoid depressive symptoms in free-living independent oldest old people and levels under 30ng/mL can be inadequate. Considering that the costs are low and side effects are not common, 25(OH)Vit D supplementation can be an important public health action.


Funding: This study was funded by FAPESP (Fundação de Amparo à Pesquisa do Estado de São Paulo – São Paulo Research Funding Foundation) – grant number 2011/12753-8. The sponsors had no role in the design and conduct of the study; in the collection, analysis, and interpretation of data; in the preparation of the manuscript; or in the review or approval of the manuscript.

Acknowledgements: We acknowledge and thank Ana Beatriz Galhardi Di Tommaso, Renato Laks, Paulo Mateus Costa Affonso, and all doctors who contributed in data collection.

Conflict of interest: Márcio Tomita da Rocha Lima, Osvladir Custódio, Patricia Ferreira do Prado Moreira, Lara Miguel Quirino Araujo, Clineu de Mello Almada Filho and Maysa Seabra Cendoroglo have no conflicts of interest to declare.

Ethical standards: This experiment complies with the current laws of the country in which they were performed.


References

1.     World Bank. Growing old in an older Brazil: implications of population aging on growth, poverty, public finance, and service delivery. 2011. https://openknowledge.worldbank.org/bitstream/handle/10986/2351/644410PUB00Gro00ID0188020BOX361537B.pdf?sequence=1. Accessed 09 Dec 2015.
2.       Snowdon J. How high is the prevalence of of depression in old age? Rev Bras Psiquiatr 2002;24(Suppl. I):42-47. http://dx.doi.org/10.1590/S1516-44462002000500009. Accessed 11 August 2015.
3.      Blay SL, Andreoli SB, Fillenbaum GG, Gastal FL. Depression morbidity in later life: prevalence and correlates in a developing country. Am J Geriatric Psychiatry 2007;15(9):790–799.
4.        Diniz BS, Reynolds CF 3rd, Butters MA, et al. The effect of gender, age, and symptom severity in late-life depression on the risk of all-cause mortality: The Bamuí Cohort Study of Aging. Depress Anxiety 2014;31(9):787-795.
5.       Jeon HS, Dunkle RE. Stress and depression among the oldest-old: A longitudinal analysis. Res Aging 2009;31(6):661-687.
6.         Wu Z, Schimmele CM, Chappell NL. Aging and late-life depression. J Aging Health 2012;24(1):3-28.
7.       Weyerer S, Eifflaender-Gorfer S, Wiese B, et al. Incidence and predictors of depression in non-demented primary care attenders aged 75 years and older: results from a 3-year follow-up study. Age and Ageing 2013;42(2):173-180.
8.       Alexandre Tda S, Corona LP, Nunes DP, Santos JL, Duarte YA, Lebrão ML. Gender differences in incidence and determinants of disability in activities of daily living among elderly individuals: SABE study. Arch Gerontol Geriatr 2012;55(2):431-437.
9.       Boyle LL, Porsteinsson AP, Cui X, King DA, Lyness JM. Depression predicts cognitive disorders in older primary care patients. J Clin Psychiatry 2010;71(1):74–79.
10.        Holick MF. Vitamin D deficiency. N Engl J Med 2007;357:266-281.
11.      Hoogendijk WJ, Lips P, Dik MG, Deeg DJ, Beekman AT, Penninx BW. Depression is associated with decreased 25-hydroxyvitamin D and increased parathyroid hormone levels in older adults. Arch Gen Psychiatry 2008;65(5):508-512.
12.      Milaneschi Y, Shardell M, Corsi AM, et al. Serum 25-hydroxyvitamin D and depressive symptoms in older women and men. J Clin Endocrinol Metab 2010;95(7):3225-3233.
13.      Toffanello ED, Sergi G, Veronese N. Serum 25-hydroxyvitamin d and the onset of late-life depressive mood in older men and women: the Pro.V.A. study. J Gerontol A Biol Sci Med Sci 2014;69(12):1554-1561.
14.     Brucki SM, Nitrini R, Caramelli P, Bertolucci PH, Okamoto IH. Suggestions for utilization of the mini-mental state examination in Brazil. Arq Neuropsiquiatr 2003;61(3B):777-781.
15.      Lawton MP, Brody EM. Assessment of older people: self-maintaining and instrumental activities of daily living. Gerontologist 1969;9:179-186.
16.       Lipschitz DA. Screening for nutritional status in the elderly. Prim Care 1994;21:55-67.
17.     Gravina CF, Franken R, Wenger N, et al. II Guidelines of Brazilian Society of Cardiology in geriatric cardiology. Arq Bras Cardiol 2010;95(3 supl.2):1-112. http://www.scielo.br/pdf/abc/v95n3s2/v95n3s2.pdf. Accessed 09 Dec 2015.
18.      Paradela EM, Lourenço RA, Veras RP. Validation of geriatric depression scale in a general outpatient clinic. Rev Saude Publica 2005;39(6):918-923.
19.      Stewart R, Hirani V. Relationship between vitamin D levels and depressive symptoms in older residents from a national survey population. Psychosom Med 2010; 72(7):608-612.
20.      Ju SY, Lee YJ, Jeong SN. Serum 25-hydroxyvitamin D levels and the risk of depression: a systematic review and meta-analysis. J Nutr Health Aging 2013;17(5):447-455.
21.      Hirani V, Primatesta P. Vitamin D concentrations among people aged 65 years and over living in private households and institutions in England: population survey. Age Ageing 2005;34(5):485-491.
22.       Castro LC. The vitamin D endocrine system. Arq Bras Endocrinol Metab 2011;55(8):566-575.
23.     Shelton RC, Miller AH. Eating ourselves to death (and despair): the contribution of adiposity and inflammation to depression. Prog Neurobiol 2010;91(4):275-299.
24.      Saraiva GL, Cendoroglo MS, Ramos LR, et al. Prevalence of vitamin D deficiency, insufficiency and secondary hyperparathyroidism in the elderly inpatients and living in the community of the city of São Paulo, Brazil. Arq Bras Endocrinol Metab 2007;51(3):437-442.
25.     Cabral MA, Borges CN, Maia JM, Aires CA, Bandeira F. Prevalence of vitamin D deficiency during the summer and its relationship with sun exposure and skin phototype in elderly men living in the tropics. Clin Interv Aging 2013;8:1347–1351.
26.      Martini LA, Verly E Jr, Marchioni DM, Fisberg RM. Prevalence and correlates of calcium and vitamin D status adequacy in adolescents, adults, and elderly from the Health Survey-São Paulo. Nutrition 2013;29(6):845-850.
27.      Berk M, Sanders KM, Pasco JA, et al. Vitamin D deficiency may play a role in depression. Medical Hypotheses 2007;69(6):1316-1319.
28.       Zanetidou S, Belvederi Murri M, Buffa A, Malavolta N, Anzivino F, Bertakis K. Vitamin D supplements in geriatric major depression. Int J Geriatr Psychiatry 2011;26(11):1209-1210.
29.      Young SN. Has the time come for clinical trials on the antidepressant effect of vitamin D? J Psychiatry Neurosci 2009;34(1):3.
30.     Holick MF, Binkley NC, Bischoff-Ferrari HA, et al. Endocrine Society. Evaluation, treatment, and prevention of vitamin D deficiency: an Endocrine Society clinical practice guideline. J Clin Endocrinol Metab 2011;96(7):1911–1930.
Products/3235.0~2012~Main+Features~Main+Features?OpenDocument. Accessed 9 August 2014

MALNOURISHED OLDER ADULTS ADMITTED TO REHABILITATION IN RURAL NEW SOUTH WALES REMAIN MALNOURISHED THROUGHOUT REHABILITATION AND ONCE DISCHARGED BACK TO THE COMMUNITY: A PROSPECTIVE COHORT STUDY


S. Marshall1, A. Young2, J. Bauer3, E. Isenring4

1. Faculty of Health Sciences and Medicine, Bond University; 2. Royal Brisbane and Women’s Hospital, Herston, Queensland. Level 2 Dr James Mayne Building, Herston, Queensland, Australia; 3. Nutrition and Dietetics, School of Human Movement and Nutrition Sciences, Building 26, the University of Queensland, Brisbane, Queensland, Australia; 4. Nutrition and Dietetics, Faculty of Health Sciences and Medicine, Bond University. Bond Institute of Health and Sport, Robina, Queensland, Australia

Corresponding Author: Skye Marshall, Bond Institute of Health and Sport, Robina, Queensland, 4226, Australia. Telephone: +61 7 5595 5530, Fax: +61 7 5595 3524, skye.marshall@student.bond.edu.au 


Abstract

Objectives: Understanding the nutritional journey that older adults make from rehabilitation to home will help to target nutrition screening and intervention programs. This study aimed to determine the nutritional status, physical function and health-related quality of life amongst malnourished older adults admitted to two rural rehabilitation units and 12 weeks post-discharge to the community. Design: Observational prospective cohort study, conducted August 2013 to February 2014. Setting: Rehabilitation units in rural New South Wales, Australia. Participants: Thirty community-dwelling, malnourished older adult inpatients (mean age 79.5±7.1 years, 57% female). Intervention: Observation of usual care: basic nutrition services typical to rural rehabilitation units. Measurements: Outcome assessments were measured at rehabilitation admission, discharge and 12 weeks post-discharge, with nutrition status via the Scored Patient-Generated Subjective Global Assessment as the primary outcome measure. Secondary outcome measures included physical function (Modified Barthel Index) and health-related quality of life (Assessment of Quality of Life-6D). Results: At admission, half of the rehabilitation patients were moderately malnourished and half were severely malnourished, with the cohort becoming and remaining moderately malnourished on discharge and 12 weeks post-discharge. Only four patients (24%) were well-nourished 12 weeks post-discharge. Following discharge, there was a trend showing decline in physical function. No improvement was found in health-related quality of life following discharge. Conclusion: Malnourished older adults admitted to rural rehabilitation units with basic nutrition care are likely to be discharged with moderate malnutrition, and remain moderately malnourished in the community for at least 12 weeks. Physical function and health-related quality of life remain poor in this population. Collaboration between health services and within the multidisciplinary team is essential to identify and treat malnourished older adults, and novel approaches for inpatient and post-discharge nutrition support is needed. 

Key words: Rehabilitation, aged, malnutrition, community, nutrition status. 


Introduction 

The ageing population has caused a shift in the type of health care demanded, including an increased preference for independent living (1). Rehabilitation facilities play a vital role in increasing independence so that older adults with disability may return safely to the community. Rehabilitation is therefore likely to increase in importance to the health care system as the proportion of older adults rises. 

Malnutrition (undernutrition) is an expensive consequence and cause of disease. Between 30 and 60% of rehabilitation older inpatients are malnourished, which presents a substantial economic and clinical challenge to rehabilitation facilities (2-4). A recent systematic literature review found that older adults admitted to rehabilitation with malnutrition had poorer health-related quality of life (HRQoL) and increased physical dysfunction, hospitalisation, institutionalisation and mortality once discharged to the community (4). However, no study has measured nutrition status in older adults following discharge from rehabilitation. It is therefore not known whether malnourished older adults are at risk of continued malnutrition once in the community (4). Understanding the nutritional journey older adults make from rehabilitation to home will help target nutrition screening and intervention programs. This is of particular importance in rural and remote Australia, due to the increased challenges in accessing, identifying and treating community-dwelling older adults with chronic disease (1). These challenges include a wide geographical spread, increased health care costs, limited health services, less availability of suitably qualified health professionals, less availability of informal care, and overall poorer health of the older adults (1). Therefore, this study aimed to determine the change in nutritional status, physical function and health-related quality of life amongst malnourished older adults admitted to two rural rehabilitation units and 12 weeks post-discharge to the community.


Methods

Design 

This study was implemented as an observational prospective cohort study with data collected from August 2013 to February 2014. 

Participants 

Two public general rehabilitation units (24 and 31 beds) in the same local health district in rural New South Wales, Australia were chosen based on location. Participants were English-speaking inpatients ≥65 years who were malnourished on admission (as assessed using the  Scored Patient-Generated Subjective Global Assessment, PG-SGA (5)) and were chosen by consecutive sampling. Participants were eligible if they were community-dwelling prior to admission and had an informal caregiver. This includes community-dwelling patients transferred from acute care. Well nourished (Scored PG-SGA rating A) patients were excluded. The rehabilitation units do not admit patients with dementia. 

Routine clinical care

Participants were placed on a high-protein high-energy (HPHE) food service diet code menu unless contraindicated by medical condition. The units each have approximately 0.15 full time equivalent (FTE, six hours per week) of dietetic services, significantly less than the recommended minimum of 1.0 and 1.25 FTE for units with 24 and 31 beds (6). Participants received individualised medical nutrition therapy by the rehabilitation dietitian only if referred by the rehabilitation team as part of usual care, which included nutrition screening on admission via the Malnutrition Screening Tool (7). Referrals were also made by the rehabilitation team if any nutritional problems became apparent to the team. Usual post-discharge nutrition support may include referral to publically-funded dietitian outpatient clinics, depending on individual patient needs and consent by the patient for the referral. 

Nutritional assessment

The nutrition status of participants was assessed by the Scored PG-SGA (primary outcome measure) at admission (T1), discharge (T2) and 12 weeks post-discharge to the community (T3). If two data collection time-points occurred within six days, assessment of nutrition status was not repeated and it was assumed the nutrition assessment results had not changed in that short time period. 

The Scored PG-SGA is a nutrition assessment tool that determines nutritional status based on medical history (weight change, dietary intake, symptoms that impact nutrition status and functional capacity) and physical examination (muscle and fat stores); and is sensitive to changes in nutrition status over a short period of time (8). It provides a continuous numerical score (with score of 7+ indicating malnutrition in older rehabilitation inpatients (9)),  as well as a global rating of nutrition status for a nutritional diagnosis (“A” indicating ‘well nourished’, “B” indicating ‘moderate or suspected malnutrition’, “C” indicating ‘severe malnutrition’) (5, 10). A higher numerical score indicates increased malnutrition/risk for malnutrition.  A reduction in score on repeat measures indicates that nutrition status has improved.  The Scored PG-SGA has shown strong concurrent and predictive validity in the geriatric rehabilitation setting (9).

Weight was measured using Tanita scales (BC-541, 2005, Tanita Corporation, Tokyo, Japan). If a participant was unable to stand unassisted then the rehabilitation ward chair or roll-on scales were used. All three scales were within 0.1kg calibration. Weights reported for amputees were adjusted using standard algorithms (11, 12). Knee height was measured using a sliding knee height caliper and used to estimate height using a population specific formula (13, 14). BMI was calculated kg/m2, and classifications for older adults used to determine underweight (<23 kg/m2) and overweight/obese (>30 kg/m2) (15). 

Physical function and health-related quality of life

The Modified Barthel Index (MBI) (16), a measure of physical function, and Assessment of Quality of Life (AQoL-6D) (17), a measure of HRQoL, were measured at discharge (T2) and 12 weeks post-discharge to the community (T3). The MBI (16) provides a numerical score (0-100, with 100 indicating total independence) as well as categories indicating dependency level (table 2) (16). The AQoL-6D  is a multi-attribute assessment tool providing a numerical score (17). All outcome measurement tools were completed on behalf of the participant by the primary researcher, an Accredited Practising Dietitian, by verbal interview with the participant. Supplementary information was recorded from the patient’s medical record, for example medications and list of comorbidities. Further clarification was sought from their informal caregiver or the rehabilitation staff if the participant’s account was unreliable due to fatigue or limited short-term recall following acute illness.

Participant characteristics

Participant descriptors and potential confounding variables, including age, gender, living arrangements, medical status and cultural background were identified from the participants’ medical notes and self-reported by the participant. Cognitive impairment was assessed by occupational therapists as part of routine care.

Statistical approach

All statistical analysis was completed using SPSS version 22.0 [2013. IBM SPSS Statistics for Windows, Version 22.0. Armonk, NY: IBM Corp.]. Descriptive statistics were used to characterise participant descriptors and to report the outcome measures of the sample population (mean ± SD/SE for normal variables, median (IQR) for skewed variables). Normality was assessed using the Shapiro-Wilk test. Change in nutrition status (Scored PG-SGA score) was determined by a linear mixed model to account for attrition and variation between the participants. The time-point was used as a repeated measures factor and the scaled identity as the covariance matrix of the random effect ‘participant’.  The analysis was carried out using the Restricted Maximum Likelihood method.  Estimated Marginal Means were obtained, and pairwise comparisons using a Bonferroni adjustment were produced. The mean Scored PG-SGA score at each time-point was reported using these Estimated Marginal Means as opposed to observed means. Within-subject changes over time for nutrition status (Scored PG-SGA ratings) were examined between each of the three time-points and between the two time-points (T2 and T3) for physical function and HRQoL. Continuous variables were assessed using the paired t-test, and categorical variables using the paired-samples sign test.  

Ethical consideration

The MARRC (Malnutrition in the Rural Rehabilitation Community) Study has been was registered at the Australian New Zealand Clinical Trials Registry (ANZCTR: ACTRN12613000518763, Trial version 2.0, 10 July 2013) and has received ethical and governance approval (North Coast Human Research Ethics Committee approval number LNR 063, G108 and University of Queensland School of Human Movement Studies Ethics Committee approval number HMS13/0731). Written informed consent was obtained from all participants and/or their guardians. 


Results

Sample population 

Thirty-one eligible patients were admitted during the recruitment period, of which 30 provided informed consent (response rate 97%). Table 1 describes the characteristics of the participants in total and by rehabilitation site. Site A was found to have a significantly younger sample population, and a higher rate of admissions from the community than site B. Participant flow throughout the study is represented in Figure 1. Overall attrition was 43%. Excluding three participants who had delayed discharge awaiting aged care placement, the length of stay ranged from 1 – 55 days, with a mean of 22.8±12.8 days. 


Table 1 Characteristics of participants by rehabilitation site and in total at admission

BMI, body mass index; IQR, interquartile range; SD, standard deviation.  a. Considered ≥3 prescribed medications at the time of nutrition assessment; b. Not compared between sites due to difference in measurement tools; * Significant difference between sites (P=0.028); ** Significant difference between sites (P=0.022)


Figure 1 Patient flow through the three time-points: admission (T1), discharge (T2) and 12 weeks post-discharge (T3)

 HRQoL, Health-related quality of life; RACF, Residential aged care facility


Twenty-three participants were placed on a HPHE diet code at admission; the main reason of contraindication was poorly-controlled diabetes. Approximately half (n=16) of the participants were referred to the rehabilitation dietitian; these participants had a range of one to four (median 1.0) appointments with the dietitian. No participants were referred by the rehabilitation team to see a community dietitian on discharge as part of usual care. Nine of the 17 participants who attended the 12 week post-discharge assessment (T3) consented to a community dietitian referral; however, no participants had attended an appointment by six months post-discharge although multiple appointment times were offered. Furthermore, only 12% of participants received community nursing services following discharge, and 41% received domiciliary services (assistance with activities of daily living). Participants who reported weight one month prior to admission (n=21) lost a mean 3.1±2.5kg (4.8±4.1% body weight). Participants who reported weight six months prior to admission (n=13) reported a loss of 10.1±4.4kg (12.4±5.8% body weight).


Figure 2 Nutrition status of participants at each time point according to the Scored Patient-Generated Subjective Global Assessment (PG-SGA) ratings


Nutrition status

The Scored PG-SGA scores and ratings, BMI and weight of participants at each of the time-points are presented in table 2. The Scored PG-SGA score and ratings were found to be significantly lower at T2 and T3 than at admission (T1) indicating an improvement in nutrition status during admission and post-discharge. However, according to the Scored PG-SGA global rating and score, the cohort remained malnourished at all time-points, with the mean score above the cut-off of 7. Post hoc analysis revealed the improvement in the Scored PG-SGA score following admission was due to weight stabilisation and some improvements in dietary intake, nutrition impact symptoms, physical function and medical status. When admitted to rehabilitation, 50% of the participants (n=15) were rated ‘moderately malnourished’ and 50% (n=15) ‘severely malnourished’ according to the Scored PG-SGA. Throughout the study period the cohort became or remained ‘moderately malnourished’, where only four participants (24%) were ‘well-nourished’ and three (18%) ‘severely malnourished’ at 12 weeks post-discharge. Most of the improvement in nutrition status according to the Scored PG-SGA ratings was due to a participant improving from ‘severely malnourished’ to ‘moderately malnourished’ during admission. An equal number of participants improved, declined and had no change in nutrition status between discharge (T2) and 12 weeks post-discharge (T3), resulting in no change in nutrition status of the overall group from discharge to 12 weeks post-discharge. The trend towards moderate malnutrition is represented in figure 2. There was no change in BMI or body weight throughout the study period and the mean BMI remained “underweight” (BMI <23kg/m2) at all time-points (table 2). 


Table 2 The nutrition status, physical function and quality of life of older adults at admission, discharge and 12 weeks post-discharge

AQoL, Assessment of Quality of Life Instrument; BMI, body mass index; MBI, Modified Barthel Index; PG-SGA, Patient-Generated Subjective Global Assessment; SD, standard deviation; SE, standard error; * Significantly different from T1 (P<0.001); ** Significantly different from T1 (P=0.002); *** Significantly different from T1 (P=0.005); **** Significantly different from T1 (P=0.021); a. A higher PG-SGA score indicates increased need for nutritional intervention (5). b. Categorical variables are presented as: number of participants (percent of participants); c. Range of the MBI is scored 0 – 99, where 0 – 24 indicates total dependency, 25 – 49 indicates severe dependency, 50 – 74 indicates moderate dependency, 75 – 90 indicates mild dependency, and 91 – 99 indicates minimal dependency (16); d. Range of the AQoL-6D is 0.00 – 1.00, where 0.00 is a state equal to death, and 1.00 is a state of full health. Negative values are possible, indicating states worse than death (17); e. n=27. Two participants could not attend assessment due to emergency admission to acute care; f. n=15. Two participant’s data excluded as the participants declined to complete the assessment forms.


Physical function and health-related quality of life

The cohort had mild-moderate disability at discharge, and for those remaining in the study at 12 weeks there was no change in MBI score (table 2). Six of the eight participants scoring poorest in physical function (categories 1 – 3) at discharge did not attend follow-up at T3 due to admission to a residential aged care facility (RACF) or death. Categorically, a slight decline occurred in physical function, as only two participants improved in a category of physical function, nine had no change and six declined. No change was seen in HRQoL at 12 weeks post-discharge. 


Discussion

This is the first study to measure the nutritional status of older adults following rehabilitation. Results suggest that the journey of the malnourished older adult from acute care, to rural rehabilitation facilities, to the community is bleak. Malnourished older adults admitted to rural rehabilitation units, whether severely or moderately malnourished, are likely to be discharged with moderate malnutrition, and remain moderately malnourished for at least 12 weeks in their homes. As patients were likely to be discharged with moderate malnutrition regardless of their length of stay, this suggests that the trend towards moderate malnutrition occurs early in the admission. Studies measuring nutrition status post-discharge from acute care facilities reported similar results in older adults (18, 19), indicating high risk for malnutrition following discharge from both acute and sub-acute health facilities.

The improvement in dietary intake and the decrease in nutrition impact symptoms prevented further weight loss from occurring; however the improvement was not significant enough to allow patients to regain the weight, fat and muscle stores they lost prior to admission. In addition, these findings may represent a ‘best case’ scenario, as the cohort had informal caregivers to provide support with activities of daily living at home, and therefore may have better nutritional outcomes than those without this support (20). The poor rate of referral to the rehabilitation dietitian by the rehabilitation team reflects findings in previous studies, indicating that poor compliance with nutrition screening and referral is widespread and significant (21-23). 

The small increase in MBI score between discharge and 12 weeks follow-up in the community appears to be skewed by attrition, where participants with the lowest scores and the greatest disability did not attend follow-up assessment due to admission to an RACF or death. Therefore the downward trend seen in the categories of physical function is likely to be clinically significant, and aligns with previous findings (24). Despite the slight improvement, this cohort still had a poorer MBI score post-discharge than a similar study in an Australian metropolitan rehabilitation unit (mean 78.9 versus 85.0 (24)). With continuing malnutrition and a downward trend physical function, it is no surprise that HRQoL remained lower than the Australian population norms for this age group (µ0.65 – 0.69 versus µ0.75 – 0.77 (25)). 

Post-discharge attrition reported by similar studies is substantially lower, ranging from 0-31% (4). However, these sample populations included well-nourished older adults, and therefore attrition due to death and RACF admissions would be expected to be lower. Alternatively, the higher rate of attrition in the current study may suggest that institutionalisation and mortality are higher in this rural cohort than metropolitan communities. A lower rate of attrition in similar studies is also due to differences in study design, where patients were included for follow-up assessment if they were in the community, in an RACF or had died (24, 26-28), whereas the current study attended follow-up assessment only on patients discharged to the community. Participants in the current study were only enrolled if they were admitted to rehabilitation with the view they would be discharged back to the community. The participants who had their discharge location changed from community to an RACF during admission were not excluded from the study and reported as attrition so that an accurate representation of the journey of community-dwelling malnourished older adults is reported.

Research and practice implications

From this study, it is clear that basic nutrition care with limited dietetic input during the inpatient rehabilitation admission is not sufficient to improve nutritional and functional status of malnourished older adults. Lack of referrals to the community dietitian on discharge, combined with poor attendance by participants referred at the conclusion of the study, highlights the need to review dietetic services and interventions during and after the rehabilitation setting. 

Malnutrition is a significant and often silent contributor to ‘post-hospital syndrome’ which increases risk of rehospitalisation for conditions other than the original cause of admission (29). Therefore nutrition should be included in discharge summaries and handovers by medical, nursing and dietetic staff to ensure the continuum of care. Results suggest that early intervention is required in the geriatric rehabilitation setting. Advocacy by the multidisciplinary team for malnutrition to be of higher consideration on the rehabilitation agenda is called for.

The participants’ informal caregivers were not involved in nutrition support in this study. The engagement of informal caregivers as part of the nutrition care team has been shown to be effective in improving the nutrition status of malnourished older adults in the community (30). Qualitative investigation is required to develop a patient-centred and informal caregiver-centred model of nutrition care for the rehabilitation setting. This model should be cost-effective, multidisciplinary and provide nutrition support during rehabilitation admission and post-discharge.

Limitations

A limitation of this paper is the small sample size which was related to a comparatively low patient turnover in rural rehabilitation units due to a longer length stay than in acute settings; however, the response rate was excellent in this at risk and hard to access population. In addition, results are of clinical significance and align with outcomes suggested by other studies in the geriatric rehabilitation setting which measured quality of life, physical function, health service use and mortality (4).  The loss-to-follow-up 12 weeks post-discharge has been accounted for by the statistical approach, which lends confidence to the results.  


Conclusion

Malnourished older adults admitted to rural rehabilitation units with basic nutrition care are likely to be discharged with moderate malnutrition, and remain moderately malnourished in the community for at least 12 weeks. Physical function and health-related quality of life remain poor in this population. Collaboration between health services and within the multidisciplinary team and sufficient dietetic services are essential to identify and treat malnourished older adults. Novel approaches for supporting patients and their informal caregivers during admission and post-discharge are needed. These results call for malnutrition to be of higher consideration on the rehabilitation agenda.


Acknowledgement: The authors gratefully acknowledge the assistance of E. Rathbone, Bond University, for contributing to the statistical approach and interpretation of data.  

Conflict of interest: The authors declare they have no conflicts of interest. This study received no specific funding. SM is supported by an Australian Postgraduate Award throughout her PhD Candidature.


References

1. Caring for Older Australians, Volume 1. Canberra: Productivity Commission, 2011.

2. Watterson C, Fraser A, Banks M, Isenring E, Miller M, Silvester C et al. Evidence based practice guidelines for the nutritional management of malnutrition in patients across the continuum of care. Nutrition & Dietetics 2009;66:S1 – S34.

3. Elia M, Stratton R. The cost of disease-related malnutrition in the UK and economic considerations for the use of oral nutritional supplements (ONS) in adults. Redditch: BAPEN; 2005

4. Marshall S, Bauer J, Isenring E. The consequences of malnutrition following discharge from rehabilitation to the community: a systematic review of current evidence in older adults. J Hum Nutr Diet 2014;27:133-41.

5. Ottery FD. Patient-Generated Subjective Global Assessment. In: McCallum PD, Polisena CG, editors. The Clinical Guide to Oncology Nutrition. Chicago: The American Dietetic Association; 2000. p. 11-23.

6. Standards for the provision of inpatition adult rehabilitation medicine services in public and private hospitals Sydney, Australia: Australasian Faculty of Rehabilitation Medicine, The Royal Australasian College of Physicians, 2011.

7. Ferguson M, Capra S, Bauer J, Banks M (1999) Development of a valid and reliable malnutrition screening tool for adult acute hospital patients. Nutrition 1999;15:458-64.

8. Bauer J, Capra S, Ferguson M. Use of the scored Patient-Generated Subjective Global Assessment (PG-SGA) as a nutrition assessment tool in patients with cancer. Eur J Clin Nutr 2002;56:779-85.

9. Marshall S, Young A, Bauer J, Isenring E. Malnutrition in geriatric rehabilitation: prevalence, patient outcomes and criterion validity of the Scored Patient-Generated Subjective Global Assessment (PG-SGA) and the Mini Nutritional Assessment (MNA) Journal of the Academy of Nutrition and Dietetics In Press 2015.

10. Ottery FD.  Rethinking nutritional support of the cancer patient: the new field of nutritional oncology. Semin Oncol 21, 1994.

11. Charney P, Malone A. Anthropometric assessment.  ADA pocket guide to nutrition assessment, 2nd edition. Chicago, IL: American Dietetic Association; 2009. p. 160-1.

12. Osterkamp LK. Current perspective on assessment of human body proportions of relevance to amputees. J Am Diet Assoc 1995;95:215-8.

13. rxkinetics. Estimating height in bedridden patients Plattsburg, MO: rxkinetics; 1984-2013 [01/10/2013]. Available from: http://www.rxkinetics.com/height_estimate.html.

14. Nutrition screening as easy as mna. A guide to completing the Mini Nutritional Assessment (MNA). Swizterland Nestle Nutrition Institute.

15. Winter JE, MacInnis RJ, Wattanapenpaiboon N, Nowson CA. BMI and all-cause mortality in older adults: A meta-analysis. The American Journal of Clinical Nutrition. 2014; DOI: 10.3945/ajcn.113.068122.

16. Shah S, Vanclay F, Cooper B. Improving the sensitivity of the Barthel Index for stroke rehabilitation. J Clin Epidemiol 1989;42:703-9.

17. Allen J, Inder KJ, Lewin TJ, Attia JR, Kelly BJ.  Construct validity of the Assessment of Quality of Life-6D (AQoL-6D) in community samples. Health Qual Life Outcomes 2013;11:61.

18. Chen CCH, Tang ST, Wang C, Huang GH (2009) Trajectory and determinants of nutritional health in older patients during and six-month post hospitalisation. J Clin Nurs 2009;18:3299-307.

19. Young AM, Mudge AM, Banks MD, Rogers L, Allen J, Vogler B et al. From Hospital to Home: limited nutritional and functional recovery for older adults. Journal of Frailty and Aging In Press., 2015

20. Locher JL, Ritchie CS, Robinson CO, Roth DL, West DS, Burgio KL. A multidimensional approach to understanding under-eating in homebound older adults: The importance of social factors. Gerontologist 2008;48:223-34.

21. Raja R, Gibson S, Turner A, Winderlich J, Porter J, Cant R et al. Nurses’ views and practices regarding use of validated nutrition screening tools. The Australian Journal of Advanced Nursing 2008;26:26.

22. Ross LJ, Mudge AM, Young AM, Banks M. Everyone’s problem but nobody’s job: staff perceptions and explanations for poor nutritional intake in older medical patients. Nutrition & Dietetics 2011;68:41-6.

23. Lamb CA, Parr J, Lamb EI, Warren MD. Adult malnutrition screening, prevalence and management in a United Kingdom hospital: cross-sectional study. Br J Nutr 2009;102:571-5.

24. Neumann SA, Miller MD, Daniels L, Crotty M. Nutritional status and clinical outcomes of older patients in rehabilitation. J Hum Nutr Diet 2005;18:129-36.

25. Population norms for the AQoL-6D and AQoL-8D multi attribute instruments [Internet]. Centre for Health Economics, Monash University.  [cited 02/07/2014].

26. Nicosia F, Bonometti F, Ghisla MK, Cossi S, Romanelli G, Marengoni A. Predictors of survival within 2 years of inpatient rehabilitation among older adults. European journal of internal medicine 2012;23:519-23.

27. Sullivan DH, Walls RC, Lipschitz DA. Protein-energy undernutrition and the risk of mortality within 1 y of hospital discharge in a select population of geriatric rehabilitation patients. Am J Clin Nutr 1991;53:599-605.

28. Visvanathan R, Penhall R, Chapman I. Nutritional screening of older people in a sub-acute care facility in Australia and its relation to discharge outcomes. Age Ageing 2004;33:260-5.

29. Krumholz HM. Post-hospital syndrome—an acquired, transient condition of generalized risk. N Engl J Med 2013;368:100-2.

30. Marshall S, Bauer J, Capra S, Isenring E. Are informal carers and community care workers effective in managing malnutrition in the older adult community? A systematic review of current evidence. The Journal of Nutrition, Health & Aging 2013;17:645-51.

EVALUATION OF THE BALANCE OF OBESE AND NON-OBESE ELDERLY WOMEN BY COMPUTED DYNAMIC POSTUROGRAPHY

E.B. Mantello1, M.A. Hyppolito2, E. Ferriolli3, N.K. da Costa Lima4, J.C. Moriguti5


1, 2. Department of Ophthalmology, Otorhinolaryngology and Head and Neck Surgery, Ribeirão Preto Medical School (FMRP), University of São Paulo (USP), Ribeirão Preto, São Paulo, Brasil; 3,4,5. Department of Internal Medicine, Ribeirão Preto Medical School, University of São Paulo (USP), Ribeirão Preto, São Paulo, Brasil.

Corresponding Author: Erika Barioni Mantello, Department of Ophthalmology, Otorhinolaryngology and Head and Neck Surgery, Ribeirão Preto Medical School (FMRP), University of São Paulo (USP), Ribeirão Preto, São Paulo, Brasil. Av. Bandeirantes, 3600. Campus Universitário. CEP: 14049-900. Phone: 55 16 36022395 Fax: 55 16 36022860, Email: erikafga@yahoo.com.br


Abstract

Background: One of the main factors that currently limit the life of the elderly is the imbalance. Computed dynamic posturography, assesses the oscillation of the body by recording the pressure exerted by the feet on the force platform, and allows analyzing the postural reactions secondary to the shift of body weight. Objectives: Evaluate and compare the balance of obese and non-obese elderly women without vestibular symptoms by computed dynamic posturography. Design: prospective trial. Setting: data collected in a university hospital. Participants: 50 elderly females divided into 2 groups according to body mass index (BMI), between 18.5 and 24.9 kg/m2 for the non-obese group and greater than 30 kg/m2 for the obese group. Intervention: the participants were submitted to the Synapsys Static & Dynamic Posturography® test. Measurements: Sensory Organization Test calculates the average proprioceptive, visual and vestibular functions. Data were analyzed statistically by the Fisher exact test. Results: significant differences were observed between the obese and non-obese subjects regarding: maximum amplitude of the anteroposterior displacement of the patient with eyes open and closed, length and surface area used by the patient with eyes open, energy spent with eyes open and closed, proprioceptive activity in the anteroposterior direction, and vestibular activity in the lateral direction. There were a higher percentage of changes in the anteroposterior tests compared to the lateral tests in the obese subjects. Conclusion: The obesity interferes with the body balance in elderly women, especially in situations that require postural control in the AP direction, proprioceptive cues in the AP direction and vestibular cues in the LAT direction.

Key words: Postural balance, aged, obesity, acidental falls.


Introduction

One of the main factors that limit the life of the elderly is imbalance (1).

The evaluation of body balance involves tests that provide information about the ability of an individual to maintain postural stability. One of these tests is computerized dynamic posturography (CDP), which evaluates the oscillation of the body by recording the pressure exerted developed by the feet on a force platform and permits an analysis of postural reactions secondary to displacement of the center of body mass (2, 3).

One of the aspects studied in CDP is the impairment of balance with advancing age. Several authors have studied the balance of healthy elderly people using CDP (4, 5). In this respect, most scientific studies indicate that age affects the mechanisms of postural adjustment.

We did not detect references dealing with CDP in obese elderly subjects in the literature. Since research about obesity in the elderly is still insufficient and this is a disease with an unfavorable impact on health and quality of life, and considering the comorbidity usually associated with it and the fact that CDP evaluates quantitatively the main system involved in body balance, the objective of the present study was to assess and compare the balance of obese and non-obese elderly women with no vestibular symptoms using CDP.


Methods

This was a prospective clinical trial with convenience sampling conducted on 50 volunteer elderly women aged 60 to 89 years, with no otoneurologic symptoms, who were attended at the otorhinolaryngology outpatient clinic of the University Hospital

The study was approved by the Ethics Committee of the University Hospital, protocol nº. 4915/2008. All patients gave written consent for participation.

The nutritional classification of the subjects was based on the BMI (kg/m2). Regarding the criterion for the nutritional diagnosis for the determination of obesity based on the BMI, few specific body weight standards for the elderly are available. In the present study, we opted to characterize the BMI according to the criteria of the WHO (6): low weight (BMI<18.5 kg/m2), normal weight (BMI 18.5-24.9 kg/m2), overweight (BMI>25 kg/m2), and obesity (BMI>30 kg/m2).

The subjects were divided into two groups according to the following inclusion criteria:

Group 1 (25 obese elderly women)

  • Over 60 years of age, with no associated disease (if associated diseases were present, they should be controlled and under specific treatment), giving written informed consente, absence of otoneurological symptoms, BMI of more than 30 kg/m2.

Group 2 (25 non-obese elderly women)

  • Same criteria as for group 1, except a BMI of 18.5 to 29.9 kg/m2.

Exclusion criteria were:

  • Patients with difficulty of intelligibility that would impair the execution of the exam, patients with a BMI of 25 to 29.9 kg/m2 and lower than 18.5 kg/m2, Neurological and neoplastic diseases, patients with visual disorders with no appropriate clinical correction (use of corrective lenses on the occasion of the test), Musculoskeletal, orthopedic and psychoemotional changes that would prevent a proper execution of the exam, use of medications acting on the peripheral vestibular system, alcohol intake up to 24 hours before the exam, professionally performed daily physical activity.

All selected patients were then submitted to the CDP exam on a Synapsys Static and Dynamic Posturography® platform (Synapsys, Marseille, France) (7).

Before positioning the patient on the platform, the examiner inserted a new card with the anthropometric data of the patient such as age, gender, weight and height and the results obtained were compared to the normal parameters standardized by the French Association of Posturology (AFP) (7), with each variable being considered individually.

During the test the patients were instructed to remain in the standing position on the force platform, keeping their arms loose along the body and their feet slightly apart and unmoving, in the specific position determined on the platform according to shoes size, and keeping their gaze frontally directed at the horizon. If the patient felt the risk of falling, she was instructed to hold the support bars surrounding the equipment. A second examiner remained behind the patient throughout the test in case she would need support during the exam and in order to prevent accidents. All exams were performed by the same investigator, who gave standardized commands throughout the test.

The goal of the exam in each condition was the maintenance of balance. The patient was instructed to remain unmoving on the platform even when the latter moved. The quantitation of the results obtained ranged from 100% (no displacement recorded by the sensors of the platform) to 0%, which corresponded to a fall in any direction. Based on the data obtained, the instrument can calculate the mean of each condition and provides an index of proprioceptive, visual and vestibular function.

The exam was based on the following protocol: 1 – Test of the limit of stability, 2 – Tests of static balance, 3 – Translational tests, 4 – Sinusoidal tests, 5 – Dynamic balance test. After all data (static and dynamic) were obtained, the software calculated the three histograms that represent visual, vestibular and proprioceptive activity and under anteroposterior, posterior and lateral conditions in the Sensory Organization Test (SOT). The normal parameters standardized by the APF for adult and elderly subjects in the tests described here are listed in Synapsys Static & Dynamic Posturography® Manual version 2.7. 2006. Marseille-France (7).

The characterization of the study population was made by means of descriptive data analysis. To correlate the variables studied, the data were analyzed using this for the Fisher exact test (8). The significance level was set at p <0.05.


Results

Mean age (+ SD) was 69.92 ± 6.31 years for the non- obese elderly women, 68.32 ± 7.48 years for the obese women, and 69.12 ±138.24 for the total sample. The groups of obese and non-obese elderly women were homogeneous in terms of age (p = 0.59). The two groups were also homogeneous regarding the practice of physical activity and the presence of associated diseases (p = 0.09 and p = 0.74, respectively).

In view of the wide numerical variability of the results, the data show the absolute and relative frequencies and the Fisher exact test for each parameter evaluated in the two groups.

The data regarding the anteroposterior displacement of the patients with eyes open (AP EO) and with eyes closed (AP EC) were not considered to be statistically significant; however, the AP EO test showed altered results in 60% of the obese patients and in 32% of the non-obese patients and the AP EC test showed altered results in 64% of the obese patients and in 40% of the non-obese patients.

The data regarding the maximum anteroposterior displacement amplitude of the patients with eyes open (AP AMP EO) and with eyes closed (AP AMP EC) for the obese and non-obese groups were statistically used for treating premenstrual dysphoric disorder (pmdd), a severe form of premenstrual  significant in both analyses (p < 0.01). 84% of the obese patients and 40% of non-obese patients showed altered results in the AP AMP EO and AP AMP EC test.

The data regarding lateral displacement of the patients with eyes open (LAT EO) and with eyes closed (LAT EC) for the obese and non-obese groups were not statistically significant; however, 36% of the obese patients and 12% of non-obese patients showed altered results in the LAT EO test. In the LAT EC test, 20% of the obese patients and 16% of the non-obese patients showed altered results.

No statistically significant results were obtained regarding t he maximum amplit ude of lateral displacement of the patient with eyes open (LAT AMP EO) or closed (LAT AMP EC).

Regarding the LAT AMP EO parameter, the exams were altered in 24% of the patients in the obese group and in 44% of the non-obese group. Regarding the LAT AMP EC parameter, the percentage of altered exams was 32% in both the obese and non-obese groups.

The results of the length parameter used by the patient with eyes open (LSKG EO) and eyes closed (LSKG EC) were not significant for LSKG EO, with altered data observed in 56% of cases in the non-obese group and in 80% of cases in the obese group. In contrast, a significant difference was observed between groups regarding LSKG EC (p < 0.01), with altered data observed in 44% of cases in the non-obese group and in 84% of cases in the obese group.

Regarding the area used by the patient with eyes open (SSKG EO) and eyes closed (SSKG EC), the SSKG EO parameter did not differ significantly, with altered results being obtained in 80% of the non-obese group and in 92% of the obese group. In contrast, the results of SSKG EC differed significantly between groups, with altered results being obtained in 44% of the non-obese group and in 76% of the obese group (p < 0.05).

Regarding the energy expended with eyes open (LFS EO) and eyes closed (LFS EC), with both tests showing a significant difference (LFS EO p < 0.01; LFS EC p < 0.05). LFS EO with altered results being obtained in 20% of the non-obese group and in 64% of the obese group; LFS EC with altered results being obtained in 24% of the non- obese group and in 56% of the obese group.

The percentages of altered exams for the two groups regarding the sensory organization that represent proprioceptive, visual and vestibular activity in the anteroposterior and lateral position. The results of the anteroposterior proprioceptive activity (p < 0.01) and the lateral vestibular activity (p < 0.05) were significant.

The percentages of altered exams for the study groups regarding sensory organization, which represents the proprioceptive activity in the anteroposterior position (altered – obese 68%, non obese 20%, p < 0.01) and the proprioceptive activity in the lateral position (altered – obese 16%, non obese 16%, p = 0.99), visual activity in the anteroposterior position (altered – obese 36%, non obese 28%, p = 0.76) and visual activity in the lateral position (altered – obese 24%, non obese 4%, p = 0.10), vestibular activity in the anteroposterior position (altered – obese 44%, non obese 36%, p = 0.77), and vestibular activity in the lateral position (altered – obese 36%, non obese 8%, p = 0.04).


Discussion

Studies regarding obesity and its consequences for the population are available in the literature. Some of them have shown the postural and/or osteoarticular changes related to obesity but do not fully clarify the significance of the increase in body mass regarding such changes compared to the non-obese population. Conversely, there is an extensive literature regarding cardiovascular diseases, metabolic changes and respiratory diseases originating from obesity. Thus,

Drôle ronfla le se comparer viagra cialis et levitra où et conseil pour prendre du viagra sainte Jusque-là de ou trouver viagra montreal champ ceux. Et acheter viagra cialis forum Censé des trois contre effet cialis réclamer tombés. Les http://www.sjf-jurfi.org/index.php?espacement-price-cialis respirer nombre éconduits maigres. «Dis. Dehors temoignage viagra femme Seuls traité prétendue http://www.tunisiephyto.com/index.php?effet-secondaire-du-kamagra écroulements. La entière On combien de temps avant pour le cialis pas servirait. Pour le nouveau viagra pour femme pape secondée levitra combien ca coute la il Le. Cesse http://www.cinacity.com/xamit/ordonnance/ou-acheter-du-cialis-sur-le-net dans à ou acheter du cialis pas cher la corsage.

the initial hypothesis of the present study was that obese elderly women might show greater difficulties and changes in the results of CDP compared to non-obese elderly women.

Elderly women were selected for the present study because they have a higher prevalence of obesity than men (9).

We did not detect studies in the literature with patient series and methods similar to ours. The studies conducted over the last few years have adopted different instruments and methodologies and no study had been conducted thus far on the obese population. We opted to discuss the results according to the order of the conditions of the evaluations used in CDP Synapsys.

Obesity had a negative influence on the AP AMP EO and EC tests regardless of whether the patients had their eyes open or closed. This permits us also to suggest that obese elderly women need to increase their amplitude of anteroposterior movement in order to maintain their body balance.

Several studies have shown that postural control is reduced with age. As an example, Manfio et al. (10) detected greater excursion of the pressure center in the elderly group than in adult individuals.

Ghulyan et al. (11) conducted a study in order to differentiate groups of healthy young people, healthy elderly people and elderly people with complaints of instability and observed that the only parameter that significantly differentiated the static balance was AP AMP EO. This parameter also permitted us to differentiate the static balance of the obese and non-obese women in the EO and EC conditions.

The LAT AMP EO test was the only one showing worse results for the non-obese elderly women compared to the obese ones, even though the difference was not statistically significant. The same percentage of altered exams was detected in the LAT AMP EC test. No reports were detected that would permit a discussion of these findings, but we may infer that the increase in body mass did not lead to greater amplitude of the lateral movement in situations of imbalance, as was the case regarding the anteroposterior movement for the obese elderly women.

The results mentioned thus far revealed a predominance of alteration of AP balance compared to LAT balance in both groups, with this being demonstrated more in the group of obese elderly women. Silva et al. (12) observed that young subjects had better postural stability than elderly subjects regarding anteroposterior amplitude (12), showing that the AP direction is affected with advancing age, explaining the altered exams in the present population of non-obese elderly women.

Mann et al. (13) reported that the greatest oscillations were detected also in the anteroposterior direction, both for amplitude and for mean displacement of the pressure center. However, in a study of obese children, McGraw et al. (14) detected greater oscillation for the mediolateral balance and concluded that, even though the human body has a greater number of degrees of freedom in the AP direction, children compensated more easily for the imbalance in this direction than in the LAT direction.

It can be seen that the literature is discordant regarding the findings of changes in the indices involved in AP/ LAT balance in young people, adults and healthy and/ or unstable elderly people. It is known that in the anteroposterior direction the first motor response to imbalance occurs by the action of the ankle, followed by the knee and then by the hip. In contrast, in the mediolateral direction, the response occurs only by the action of the hip. In addition, the human body has a larger number of degrees of freedom in the anteroposterior direction compared to the mediolateral direction (14).

The present results show that obese elderly women had significantly greater changes in tests involving AP oscillations compared to LAT oscillations. Since tasks in the AP direction are difficult for non-obese elderly women compared to the LAT direction, the present data indicate that obese elderly women will have even greater difficulties since the excess of adipose mass will impair and slow down the response to oscillation and the stability of the motor response involved.

In addition, obese persons and pregnant women exhibit widening of the support base with separation of the feet when walking, with the feet being displaced sideways, diverging and forming a larger quadrangle that insures new balance positions, causing a waddling and ungainly gait (15). Thus, comparing this statement to our data, we can consider that obese women are better adapted to lateral balance, a fact that justifies lower percentages of alterations in this direction for the obese women and also the greater percentage of altered exams in the non-obese group in the LAT AMP EO/EC test.

Studies on adults have shown that a 20% increase in body mass reduces the ability to perform rapid adjustments in response to external perturbation in the orthostatic position and increase postural instability (4).

The results of the SSKG EC test showed a statistically significant difference between groups (p<0.05), with the obese women requiring a greater surface to remain stable during the perturbation of body balance.

The LSKG EO/EC + SSKG EO/EC test was altered in 83 cases among the obese women and in 56 cases among the healthy women. When the body is in the erect position it may be compared to a pendulum system that moves through the axis of the ankles. In the presence of overweight, as is the case for obesity, the torque necessary to maintain balance increases, causing increased involvement of the muscles with a motor action in order to bring back the center of the mass to the base of support. This provokes increased values of the variables of balance oscillation (16) and may explain the increase of the surface and length variables for the obese women studied here.

Statistically significant differences were detected between groups in the LFS EO and LFS EC tests, with respective values of p<0.01 and p<0.05. These data permit us infer that obesity impaired the performance of the elderly women in the tests in question, so that these patients must expend a greater quantity of kinetic energy to maintain their body balance.

Regarding the sensory organization for each activity – proprioceptive, visual and vestibular – the proprioceptive activity showed statistically significant data (p<0.01), support that obesity reduces the proprioceptive activity in the anteroposterior direction and that elderly women require vestibular and visual sensory information to compensate for the absence of proprioceptive information and thus prevent falls.

Degenerations of the proprioceptive system occur with advancing age, with consequent body instability that explains the changes detected in 20% of healthy elderly women (3, 17). Studies on young and adult obese subjects have demonstrated that the accumulation of adipose tissue can reduce body balance and proprioceptive capacity, contributing to falls (18).

In general, there are two reasons for the proprioceptive alteration of obese persons. The first is that the body, by means of the feet, has mechanoreceptors that receive cutaneous sensations and obesity causes this response to be reduced. In addition, there is an addition of the imbalances, causing greater pressures between the feet and the ground, thus reducing the uptake of sensory information (11).

The present findings agree with those of Pedalini (17) that detected in a study on healthy and symptomatic elderly subjects a preserved proprioceptive system performance compared to the visual and vestibular system. The author stated that the test of sensory integration was not sufficiently sensitive to detect oscillations secondary to the degenerations that occur with aging.

Vestibular activity showed a statistically significant difference (p<0.05) regarding sensory organization for each activity – proprioceptive, visual and vestibular support that the vestibular information in the lateral direction was impaired in obese elderly women, who required the use of visual sensory and proprioceptive information to compensate for the absence of vestibular information in order to prevent falls.

The vestibular information was reduced in the obese women in tasks requiring control of balance in the LAT direction. It has been reported that anatomical and physiological changes occur with aging (1) that render the elderly more susceptible to vertigo signs and symptoms, such as reduction of sensory receptors in the semicircular canal, saccule, utricle, and retina, in addition to a reduction of visual and vestibular reflexes.

In view of the above considerations, we may infer that the imbalance of the elderly women studied here was related to obesity. Postural changes do not exclusively occur in obese persons, but affect them more frequently due to the mechanical action of excess body mass and to the increase of the variables that involve balance, especially in the AP condition in relation to the proprioceptive system and in the LAT condition in relation to the vestibular system.

The imbalance and falls of the elderly are largely due to degenerative phenomena peculiar to aging (1). Maintaining one’s balance on a surface while rapid displacement movements are required needs a rapid selection of sensory cues and the programming of appropriate postural reactions for body adjustment.

In the present study, CDP was considered to be a rapid test of simple application by the therapist. Some precautions were required for the application of the test to the obese elderly group, especially for women with difficulties in locomotion. However, these deficits did not prevent the application of the test since parameters such as frequency and velocity can be changed manually.

We suggest a program of balance rehabilitation for the population of obese elderly women under the guidance of an interdisciplinary team that would provide medical, nutritional, speech therapy, physiotherapy and physical education follow-up. It would also be interesting to conduct a longitudinal study of obese elderly women with CDP evaluation in a first phase and after the implantation of a program of weight loss and rehabilitation.


Conclusion

Our study support that the obesity interferes with the body balance in elderly women, especially in situations that require postural control in the AP direction, proprioceptive cues in the AP direction and vestibular cues in the LAT direction.


Ethical Standards: The experiments described in this manuscript comply with the current laws of Brazil.

Acknowledgments: – Fundação de Apoio ao Ensino, Pesquisa e Assistência (FAEPA) of Ribeirão Preto Medical School (FMRP), University of São Paulo (USP), Ribeirão Preto, São Paulo, Brasil. – We also acknowledge the substantial scientific contribution made by women participating in this study.

Conflicts of interest: The authors attest that there is no conflict of interest (financial and/or personal) that could affect the proper way to work this manuscript.


References

1. Ruwer LS, Rossi AG, Simon LF. Balance in the elderly. Rev Bras Otorrinolaringol 2005; 71: 298-303.

2. Black FO. What can posturography tell us about vestibular function, Ann N Y Sci 2001; 940:446-64.

3. Novalo ES, Pedalini MEB, Bittar RSM, Lorenzi MC, Bottino MA. Computerized Dynamic Posturography: Quantitative Evaluation in Patients with Vestibulopathy Treated with Vestibular Rehabilitation. Int. Arch. Otorhinolaryngol 2008; 12:253-257

4. Borah D, Wadhwa S, Singh U, Yadav SL, Bhattacharjee M, Sindhu V. Age related changes in postural stability, Indian J Physiol Pharmacol. 2007; 51: 395-404.

5. Cohen H, Heaton L, Congdon SL, Jenkins HA. Changes in sensory organization test scores with age. Age Ageing 1996; 25:39-44.

6. WHO – World Health Organization. Obesity: preventing and managing the global epidemic. 1998. Geneva: WHO.

7. Synapsys Static & Dynamic Posturography® Manual version 2.7. 2006. Marseille-France.

8. SAS/STAT® User’s Guide, Version 9 (2002-2003) Cary, NC: SAS Institute Inc.

9. Marques APO, Arruda IK, Espírito SantoAC, Raposo MC, Guerra MD, Sales TF. Prevalence of obesity and associated factors in older women. Arq Bras Endocrinol Metab. 2005; 49:441-448.

10. Manfio EF, Muniz MA, Rabello BV. Relationship between static balance and ground reaction force. 2005. 11th Brazilian Congress of Biomechanics, João Pessoa.

11. Ghulyan V, Paolino M, Lopez C, Dumitrescu M, Lacour M. A new translational platform for evaluating aging or pathology-related postural disorders. Acta Oto-Laryngol 2005; 125: 607-617.

12. Silva JB, Sousa PN, Lima ES, Teixeira LA. Comparison of postural control in adults and elderly subjects: task dependency and visual information. Aging and Physical Education Perspectives and Challenges. 2002. São Paulo, pp.175-78.

13. Mann L, Teixeira CS, Lopes LFD, Mota CB. Evaluation of the force center during static balance in academic physical education. 5th Exhibition of Scientific Initiation, Postgraduate and Research at the University of Caxias do Sul. 2005. Vacaria, RS.

14. Mc Graw B, Clenaghan BA, Williams HG, Dickerson J,. Ward DS. Gait and postural stability in obese and nonobese prepubertal boys. Arch Phys Med Rehabil 2000; 81: 484-9.

15. Alvarenga GM, Gambá HR, Moser AD. Kinematic analysis pre and post- operative patients undergoing bariatric surgery: a preliminary study. Proceedings of the 21st Brazilian Congress of Biomedical Engineering. 2008. Salvador, BA. pp. 225-8.

16. Hue O, Simoneau M, Marcotte J, Berrigan F, Doré J, Marceau P et al. Body weight is a strong predictor of postural stability. Gait Posture. 2007. 26: 32-8.

17. Pedalini MEB. Assessment of older people with and without vestibular symptoms by computerized dynamic posturography. 2005. Thesis. Faculty of Medicine, University of São Paulo.