jarlife journal
Sample text

AND option

OR option

TREATMENT SATISFACTION: A NEGLECTED BUT IMPORTANT OUTCOME MEASURE IN OLDER PEOPLE WITH TYPE 2 DIABETES


H. Langerman1,2, R. Gadsby3


1. Beds & Herts Postgraduate Medical School, Luton, UK; 2. Merck Sharp and Dohme, UK; 3. University of Warwick Medical School, Coventry, UK.

Corresponding Author: Haya Langerman, Beds & Herts Postgraduate Medical School, Luton, LU2 8LE, UK, E-mail address: haya.langerman@beds.ac.uk.

J Aging Res Clin Practice 2017;6:124-132
Published online June 15, 2017, http://dx.doi.org/10.14283/jarcp.2017.14


Abstract

Objective: To investigate the effect of comprehensive geriatric care (CGC) in elderly referred to a rehabilitation unit. This article describes the considerations behind the study. Design: Participants were randomized to either CGC or standard care. Setting: Participants were recruited from two community care rehabilitation units in Aarhus Municipality, Denmark, in the period between 2012 and 2015. Participants: Inclusion:  Elderly patients aged 65 and older admitted from home or hospital. Exclusion: Persons receiving palliative care or assessed by a geriatrician during the past month. Intervention: Medical history, physical examination, blood tests, medication adjustment and follow-up by a geriatrician. The control group received standard care with the general practitioners (GPs) as back-up. Outcomes: Primary outcome: Hospital contacts drawn from national registers. Secondary outcomes: GPs contacts, institutionalization, medication status and mortality collected from national registers and Activities of daily living (ADL), physical and cognitive function and quality of life measures collected by a blinded occupational therapist. All outcomes were assessed at day 10, 30 and 90 after arrival at the rehabilitation unit. Conclusion: A new model of care for elderly referred to community rehabilitation was developed and implemented. The potential benefits of this model were compared with usual care in a community rehabilitation unit in a pragmatic randomized clinical trial. We hypothesized that the geriatrician-performed CGC in elderly referred to a rehabilitation unit will reduce the hospital contacts by 25 % without increase in mortality and in contacts to GPs and home care services. We expect that this model will prevent deterioration in ADL, and physical and cognitive functioning, and reduce the risk of institutionalization. If the results are positive, community rehabilitation services should be encouraged to change their routines for treatment of this population accordingly..

Key words: Randomized controlled trial, Comprehensive geriatric care, rehospitalization, rehabilitation, activity of daily living.


Introduction

Older people are the fastest growing segment of the population, responsible for a large portion of the use of health care services, and a large and growing section of the population with diabetes. They are not a uniform group and can be broadly classified into those entering old age (generally 60 years and above), a transitional phase between healthy active life and frailty (the seventh or eighth decade), and frail older people (late old age) (1). Diabetes is up to five times more prevalent in patients aged 65 years or older, compared with patients below the age of 65 (2, 3). Recent estimates suggest that up to 1 in 5 older people have diabetes and that a similar proportion may have undiagnosed diabetes (4).
The management of older people with diabetes presents unique challenges. Observational studies suggest an association between diabetes and the risk of various geriatric conditions (i.e., cognitive impairment, dementia, depression, mobility impairment, disability, and falls) (5, 6). They have an increased rate of diabetes-related complications, are much more likely to present with comorbid conditions, and are more susceptiple to the adverse effects of some . glucose-lowering therapies.
Adherence to treatment is a key factor in achieving therapeutic success. Treatment satisfaction is an important determinant of patients overall health-related decisions such as adherence and willingness to continue treatment (7−9). It is defined as the patient’s evaluation of the process of taking the medication and the outcomes associated with the medication (10). It is an essential measure of treatment effectiveness as some treatments with proven efficacy in clinical trials are less effective when prescribed in routine clinical practice where there is no intensive follow-up to ensure adherence. However, treatment satisfaction is not an easy item to measure as it depends not only on the clinical outcomes achieved such as symptom resolution, control of the disease progression and prevention, but also on factors such as the route and ease of drug administration, and drug tolerability. Overall treatment satisfaction in diabetes consists of the patient’s appraisal of three main treatment-related parameters: efficacy, side effects, and treatment burden or inconvenience. However, in older people with diabetes, outcomes such as hospitalisation rates, quality of life, fall rates, instrumental daily living restrictions and admission rates to care homes assume more importance and should also be considered when assessing treatment satisfaction (11, 12).
Predictors of treatment satisfaction may differ significantly between patients and it cannot be assumed that generic or disease-specific instruments with evidence of good measurement properties in a younger population will perform as well with an older population. For example, older people with type 2 diabetes are more worried about adverse events, have trouble remembering to take their medication or require assistance from another person in order to take their medication (13). In addition, multiple comorbidities, as is commonly found in older populations, are associated with greater decrements in quality-of-life and well-being (14). Consequently, when assessing treatment satisfaction it is important to use a questionnaire that focuses on areas relevant to the target population. For example, older people with type 2 diabetes are particularly at risk of hypoglycaemia and may be less satisfied with treatments that increase this risk. There are several questionnaires that evaluate treatment satisfaction for people with diabetes: Diabetes Treatment Satisfaction Questionnaire (DTSQ) (15), Treatment Satisfaction Questionnaire for Medication (TSQM) (16), Satisfaction with Oral Anti-Diabetic Agent Scale (SOADAS) (17), Treatment Satisfaction with Medicines Questionnaire (SATMED-Q) (18), Diabetes Medication System Rating Questionnaire (DMSRQ) (19), and Oral Hypoglycaemic Agent Questionnaire (OHA-Q) (20). Currently, no treatment satisfaction questionnaires have been designed and validated specifically for older people with type 2 diabetes. This review aims to examine the main validated questionnaires in the area of treatment satisfaction in type 2 diabetes and to assess their applicability to older people.


Methods

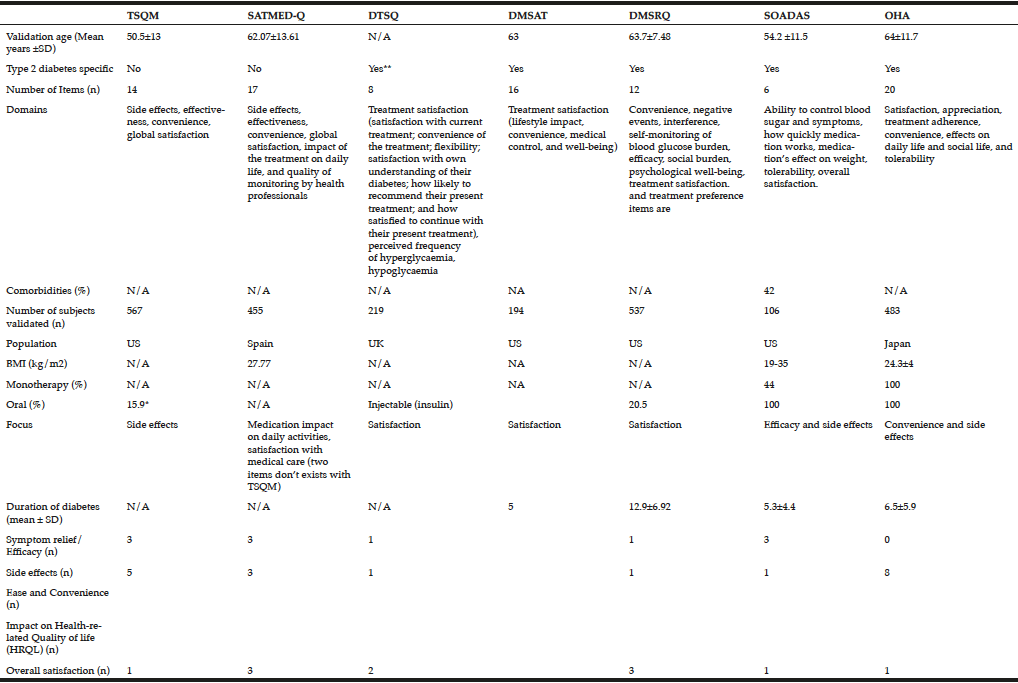
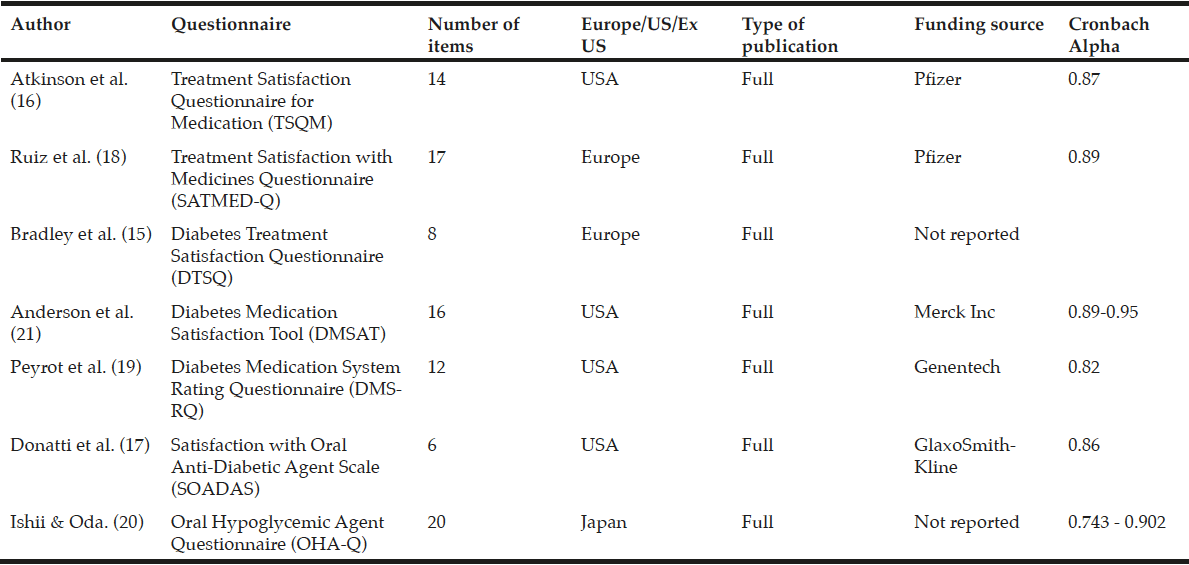
ProQuest, PubMed, HeinOnline, ScienceDirect, Academic One File, general OneFile and MEDLINE scientific literature databases were searched from 1/1/1980 to 1/4/2014 to identify treatment satisfaction questionnaires validated in diabetes for use in patients receiving oral antidiabetes therapies; insulin-specific questionnaires were not included. Search terms for ProQuest and PubMed included ‘treatment satisfaction, ‘diabetes’,’ older’, ‘elderly’, ‘questionnaires’, ‘assessment’, ‘evaluation’. Seven questionnaires were selected based on their validity in patients with diabetes (Table 1). Data extraction was performed to summarise key components of the studies including study design, demographic characteristics including age, choice of domains and items.


Table 1 Study listing

Table 1
Study listing


Results

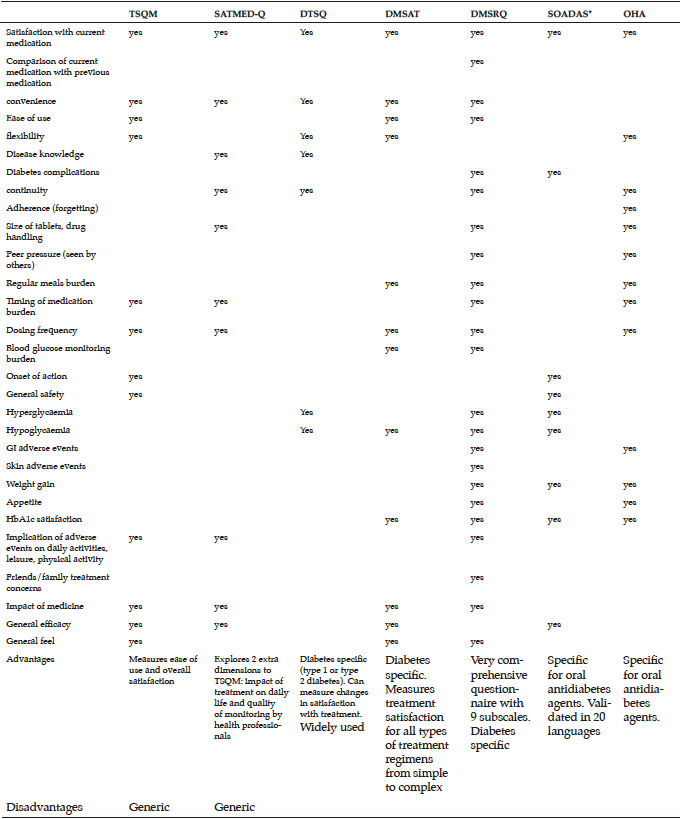
The literature search identified seven questionnaires that had been validated in diabetes. Of these, two were general questionnaires: Treatment Satisfaction Questionnaire for Medication (TSQM) (16) and Treatment Satisfaction with Medicines Questionnaire (SATMED-Q) (18); and five were diabetes-specific: Diabetes Treatment Satisfaction Questionnaire (DTSQ) (15), Diabetes Medication Satisfaction Tool (DMSAT) (21), Diabetes Medication System Rating Questionnaire (DMSRQ) (19), Satisfaction with Oral Anti-Diabetic Agent Scale (SOADAS) (17), and Oral Hypoglycaemic Agent Questionnaire (OHA-Q) (20) (Tables 2 and 3). In addition, the search also identified a quality-of-life questionnaire, the Audit of Diabetes-Dependent Quality of Life (ADDQoL) Senior, which although it looks at quality of life rather than treatment satisfaction is included here as it is the only assessment tool specifically developed for older people with type 2 diabetes (22).


General questionnaires

Treatment Satisfaction Questionnaire for Medication (TSQM)

The TSQM is a general tool for assessing patients’ satisfaction with medications designed to treat, control, or prevent a wide variety of conditions. It includes 14 items (Table 2) and has been validated across a wide range of diseases, including type 1 diabetes (16). However, unlike the DTSQ, this measure does not include diabetes-specific items and is therefore unlikely to reliably measure treatment satisfaction with oral antihyperglycaemic agents. In the validation study, respondents’ age ranged from 18 to 88 years, with a mean of 50.5 (16).


Table 2 Demographic characteristics of patients included in the studies

Table 2
Demographic characteristics of patients included in the studies

*Oral diabetes medication; **Type 1 and orally treated type 2 diabetes

Table 3 Items included in each questionnaire

Table 3
Items included in each questionnaire

*questionnaire was not available. Information based on validation and might be lacking


Although it is a general questionnaire, the TSQM has been used in several studies of people treated with oral antidiabetes agents (23−26). These studies showed that the experience of hypoglycaemia was associated with lower global satisfaction. Marrett et al also found significantly lower scores for the side-effects domain in patients reporting hypoglycaemia compared with those who did not (P ≤ 0.001) (23). Alvarez-Guisasola et al observed that experience of hypoglycaemia was associated with a negative effect on all domains (P < 0.001 for all comparisons) (25). Similar results were found in the Walz et al study, where patients (mean age 69 years) with moderate or worse symptoms of hypoglycaemia indicated several dimensions where they were less satisfied with their antihyperglycaemic medication regimen than patients with no or mild symptoms (26).

Treatment Satisfaction with Medicines Questionnaire (SATMED-Q)

The SATMED-Q is a multidimensional generic questionnaire that was developed to address some of the limitations of the TSQM questionnaire. It explores the same dimensions as the TSQM and two additional dimensions (impact of the treatment on daily life and quality of monitoring by health professionals). These dimensions have been highlighted by patients as important components of medical care. The questionnaire has been designed for use in patients with any chronic illness and undergoing any type of prolonged pharmacological treatment. The questionnaire has been shown to be a reliable and valid measure of treatment satisfaction in a number of chronic diseases including type 2 diabetes (18), and has been shown to be sensitive to changes in patients’ satisfaction with treatment, although this has not been tested in diabetes (27). A search of the literature found no further trials of its use in diabetes.


Diabetes-specific questionnaires

Diabetes Treatment Satisfaction Questionnaire (DTSQ)

In its original ‘status’ format, the DTSQ was designed to prospectively measure satisfaction with diabetes treatment regimens among patients with type 1 or type 2 diabetes. The instrument is comprised of eight items, each rated on a 7-point Likert scale ranging from 0 to 6 (15). The questionnaire has been used in a number of clinical trials evaluating new diabetes treatments. However,  the DTSQ measures satisfaction at one point in time, e.g How satisfied are you with your current treatment?  The sensitivity to change of the DTSQ is therefore limited, and ceiling effects are often seen, where maximum or close-to-maximum scores at baseline provide little opportunity for registering improvement in satisfaction with the treatment or strategy being assessed. A ‘change’ format of the DTSQ was designed to overcome the ceiling effects of the ‘status’ version and to measure change in satisfaction (28). This instrument contains the same eight items as the DTSQ-status version, but asks patients to consider their satisfaction with their current treatment compared with their previous treatment. When used together in a clinical trial setting, the status version, used at baseline, permits assessment of absolute levels of satisfaction, while the change version measures relative change, reflecting increased or decreased satisfaction or no change in satisfaction.
Using the DTSQ status version, Biderman et al found that lower treatment satisfaction was related to difficulties in adherence to taking medications (7). The mean age in this study was 67 years. They also found that insulin-treated patients were least satisfied with treatment. This was also the case in the Petterson et al study, which specifically examined treatment satisfaction in older people (≥60 years) with diabetes (mean age 71 years) (29). Aside from the obvious fact that injecting insulin is less comfortable than taking a pill, this outcome may also reflect patients’ perceptions that insulin treatment means that their health status has deteriorated. Another possible explanation is that people with type 2 diabetes who need insulin, have longer disease duration, with more complications. Diabetes complications were also found to be associated with low satisfaction. Furthermore, less satisfaction was associated with having any complication at all, and there was a constant decline in treatment satisfaction with increased number of complications. In contrast to another study, which showed better treatment satisfaction in older patients than younger patients (30), neither the Biderman nor Petterson et al studies found an association between age and treatment satisfaction (7, 29).
Some studies have reported that treatment satisfaction decreases with higher HbA1c levels (30, 31). However, as only a minority of patients may be aware of the term ’HbA1c,’ this could be a possible reason for the lack of correlation between HbA1c levels and treatment satisfaction. In the Biderman and Petterson et al studies, there was no correlation between HbA1c and satisfaction, but lower satisfaction was found at HbA1c >7%(mmol/L) (7, 29).

Diabetes Medication Satisfaction Tool (DMSAT)

The 16-item DMSAT tool measures satisfaction with the patient’s diabetes medication regimens (Table 2) (21). Responses are summed and converted to a score from 0 to 100 for each subscale and overall, with higher scores representing more satisfaction.
The scale has been used to measure treatment satisfaction in a UK survey of patients with type 2 diabetes designed to evaluate associations between hypoglycaemic events and patient-reported outcomes (32). Medication satisfaction was lower among those who experienced ≥1 hypoglycaemic event in the 4 weeks prior to the survey (P<0.0001). People in old age were not recruited, the mean age of participants in the survey was 58.8 ± 10.9 years.

Diabetes Medication System Rating Questionnaire (DMSRQ)

The DMSRQ was developed to assess satisfaction with any diabetes medication, oral or injectable, used to control blood glucose (19). The DMSRQ contains nine scales, scored on a 0-to-100 scale (a higher score indicates greater levels of the construct measured) (Table 2). It is also available in a short form (33). In the validation study patients were aged 40-64 years (19). In contrast to the DTSQ, DMSRQ can distinguish between certain components of the diabetes treatment such as medication, diet, exercise and glucose monitoring. Other than the validation studies a search of the literature found no further trials of its use in diabetes.

Satisfaction with Oral Anti-Diabetic Agent Scale (SOADAS)

SOADAS was the first questionnaire to evaluate people with type 2 diabetes on oral anti-diabetes agents (17). SOADAS has cross-cultural face validity having been translated and validated in 20 languages to ensure that new language versions are sensitive to cultural expressions. Unlike the DTSQ, which was developed based on insulin-treated patients, the six-item SOADAS scale includes items on side effects as well as medication effects on body weight, which may be critical in differentiating treatment satisfaction among patients on different oral anti-diabetes agents (Table 2). The findings from the evaluation study indicate that SOADAS is a valid and reliable measure of patient satisfaction with oral antidiabetes medications, but a limitation of the SOADAS questionnaire is that validation was only carried out on a sample of US patients, with a BMI between 19 and 35. In addition, the questionnaire does not evaluate the impact on daily life, and side effects other than weight gain are reduced to one item (tolerability). A search of the literature did not find any studies that have used SOADAS.

Oral Hypoglycaemic Agent Questionnaire (OHA-Q)

The OHA-Q was developed by Japanese researchers because of a lack of current tools to clarify differences among the oral agents for type 2 diabetes (20). For example, the SOADAS questionnaire oversimplified tolerability aspects as well as lacking evaluation of the impact on daily life. The 20-item OHA-Q provides information useful for the selection of oral agents and unlike SOADAS is also available in Japanese. Subjects in the validation study had type 2 diabetes and had been treated with a single oral antidiabetes agent for the past 1 month or longer. They had to be a least 20 years old, but there was no upper age cut-off.

The Audit of Diabetes-Dependent Quality of Life (ADDQoL)

ADDQoL is a diabetes-specific measure that assesses the impact of diabetes on 18 life domains such as “working life,” “family life,” “freedom to eat as I wish,” and “self-confidence” and has proven to be sensitive to changes in treatment (22, 34).  Individuals with diabetes complications reported a significantly greater negative impact of diabetes on QoL than those without complications (P<0.001). It is of interest to note that the overall impact of diabetes on QoL in the validation study population was profoundly negative, but accompanying DTSQ findings showed a relatively high satisfaction with treatment. Thus, if treatment satisfaction had been used as an indicator of QoL in this study (22), the negative impact of diabetes on QoL would not have been acknowledged, and the high levels of treatment satisfaction may have been misinterpreted to suggest that patients had good QoL. Use of ADDQoL with people with type 1 or type 2 diabetes has shown, on average, a negative impact of diabetes on all domains (22).
In general, these findings indicate that ADDQoL is sensitive to the effects of diabetes (including both its treatment and complications) that cannot be captured by the measurement of treatment satisfaction alone. ADDQoL identifies more negative psychological outcomes than diabetes-specific treatment satisfaction scales such as the DTSQ, and thus it is likely to be even more sensitive to improvements following change to a new treatment that protects aspects of life that are important for QoL. In particular, the DIABQoL+ study has shown that restrictions on dietary freedom have a major negative impact on QoL, suggesting that treatments that increase dietary freedom without loss of metabolic control will improve QoL for many patients (35).

ADDQoL Senior

Quality-of-life questionnaires differ from treatment satisfaction questionnaires and ADDQoL Senior is only mentioned here because it is the only assessment tool that has been specifically developed for assessing quality of life in older people with type 2 diabetes, particularly care-home residents (36). In the validation, ‘independence’ was the aspect of life reported to be most important for quality of life and had the most negative weighted impact score, followed by ‘freedom to eat as I wish’. Thus, further research is required to examine the relationship between ‘independence’ and drug administration related aspects that are likely to be affected by reduced independence and therefore to reduce the level of satisfaction. ADDQoL Senior is being validated in the ongoing MID-Frail study in frail and pre-frail subjects aged ≥70 years with type 2 diabetes (37).


Discussion

A review of the literature reveals that a number of treatment satisfaction measures are available, but few have been validated in type 2 diabetes and none appears suited to capturing the satisfaction of older adults with type 2 diabetes. Only SOADAS and OHA-Q are specific to oral antidiabetes therapies. TSQM, and SATMED-Q are general questionnaires designed to assess satisfaction with medication in chronic conditions, and are not specific to type 2 diabetes. Mean age slightly differs between the questionnaires, whilst the patient population in OHA-Q is older compared with the other questionnaires.
The main focus in OHA-Q and TSQM is safety-related items such as adverse events and their implication on physical and mental activities. OHA-Q lists eight different items referring to adverse events such as hypoglycaemia, weight gain and gastrointestinal symptoms. OHA-Q was tested among patients on monotherapy only and therefore may enable comparisons between the different classes of oral therapies to be made. While the mean age in the OHA-Q validation was slightly higher compared with the other questionnaires, none of the questionnaires has been validated in patients >70 years. The choice of items is extremely important especially as there are specific items that are more relevant to older people such as drug administration related aspects as well as adverse events. Both OHA-Q and SOADAS looked at satisfaction with current therapy, weight gain related items and efficacy of the drug. As opposed to SOADAS, OHA-Q includes more items related to safety of the therapy while SOADAS focuses heavily on efficacy-related items. Older people with type 2 diabetes are in many cases frail and suffer from comorbidities. It is therefore important to provide a balance between efficacy- and safety-related items.
Due to the prolonged and progressive nature of chronic diseases such as diabetes, poor adherence can adversely affect the long-term effectiveness of a drug. An assessment of a patient’s treatment satisfaction is therefore useful to help identify those at risk of poor adherence, and enable physicians to target their interventions toward the aspects responsible for this. An important barrier to effective diabetes self-management is hypoglycaemia associated with diabetes medication (38). A number of studies have shown that hypoglycaemia is significantly associated with poorer health-related quality of life and patient outcomes, achievement of treatment goals, and healthcare utilization (25, 32, 39−41). Older people with diabetes are at greater risk for hypoglycaemia; normal aging may contribute to failure in counter regulatory responses (neurohumoral responses, subject awareness) to hypoglycaemia (42), symptoms may be mistaken for other conditions associated more commonly with advanced aged, and several treatments, including the sulphonylureas, other insulin secretagogues, and insulin, may either contribute to or directly cause it (43). In a population-based, retrospective, 4-year cohort study in 19,932 patients, frail older individuals (>80 years) using multiple medications and frequently hospitalised were at greater risk for hypoglycaemia (risk ratio = 1.8; 95% CI, 1.4-2.3; P =0.05) than healthier individuals of the same age (44).
In addition to providing useful insight into the patient’s perspective on their current treatment, treatment satisfaction is a valuable endpoint for clinical studies of treatments for chronic conditions where treatment compliance and adherence are considered issues (45). Thus, when new treatments have comparable efficacy, treatment satisfaction can be used to examine whether drug differences other than clinical efficacy have an impact on outcomes that may be important to patients. However, direct comparisons of satisfaction scores between studies are problematic due to the diversity of assessment instruments used. There is also currently no evidence of reliability or validity of existing instruments in older individuals with type 2 diabetes.
To date, treatment satisfaction has been used in only a limited way to support EMEA drug approvals, which may be due in part to a limited number of appropriate treatment satisfaction measures. Given the high proportion of older individuals with type 2 diabetes (6, 46), there is an urgent need for treatment satisfaction questionnaires to be developed and validated in older populations with type 2 diabetes so that clinical trials can use these measures to differentiate between alternative treatments.


Conclusion

Although older people with type 2 diabetes are an important and growing group, no validated treatment satisfaction measure is available to assess satisfaction with oral antidiabetes medication in this population. Future research should focus on developing new measures or adapting existing measures and validating them in a range of older populations with type 2 diabetes to inform treatment decisions on optimal therapy. In addition to medication effectiveness, side effects, and convenience of use, such a questionnaire should include an extended range of concerns, such as dosing schedules, time spent managing diabetes, and integrating medication regimens into ones lifestyle or routine, which may become important as the treatment regimen grows in complexity. Concerns related to older people in particular should also be included such as functional autonomy, independence, fall rates, hospitalization rates, and admission rates to care home. Of the currently available questionnaires, OHA-Q and SOADAS appear best suited to assessing treatment satisfaction in older people with type 2 diabetes, although adjustments may be required to ease reading and completion of the questionnaire.


Conflict of interest: The authors declare no conflict of interest. H. Langerman is an employee of Merck Sharp and Dohme, UK. The authors were supported by a medical writer who was funded by Merck Sharp and Dohme. The authors had complete editorial control over the manuscript, which represents the views of the authors.


References

1.    Department of Health. National Service Framework for Older People. March 2001. Available from: https://www.gov.uk/government/uploads/system/uploads/attachment_data/file/198033/National_Service_Framework_for_Older_People.pdf. Last accessed March 2015.
2.     International Diabetes Federation [webpage on the Internet] IDF Diabetes Atlas. 6th ed. Brussels, Belgium: International Diabetes Federation; 2013. [Accessed January 1, 2014]. Available from:http://www.idf.org/diabetesatlas.
3.     Fagot-Campagna A, Bourdel-Marchasson I, Simon D. Burden of diabetes in an aging population: prevalence, incidence, mortality, characteristics and quality of care. Diabetes Metab 2005;31:5S35-5S52.
4.     Sinclair A, Morley JE, Rodriguez-Mañas L, Paolisso G, Bayer T, Zeyfang A, et al. Diabetes mellitus in older people: position statement on behalf of the International Association of Gerontology and Geriatrics (IAGG), the European Diabetes Working Party for Older People (EDWPOP), and the International Task Force of Experts in Diabetes. J Am Med Dir Assoc 2012;13:497-502.
5.     Lu FP, Lin KP, Kuo HK. Diabetes and the risk of multi-system aging phenotypes: a systematic review and meta-analysis. PLoS One 2009;4:e4144.
6.     Sinclair A, Dunning T, Rodriguez-Mañas L. Diabetes in older people: new insights and emaining challenges. Lancet Diabetes Endocrinol 2015;3:275-85.
7.     Biderman A, Noff E, Harris SB, Friedman N, Levy A. Treatment satisfaction of diabetic patients: what are the contributing factors? Fam Pract 2009;26:102–8.
8.     Barbosa CD, Balp MM, Kulich K, Germain N, Rofail D. A literature review to explore the link between treatment satisfaction and adherence, compliance, and persistence. Patient Prefer Adherence 2012;6:39–48.
9.     Pollack MF, Purayidathil FW, Bolge SC, Williams SA. Patient-reported tolerability issues with oral antidiabetic agents: Associations with adherence; treatment satisfaction and health-related quality of life. Diabetes Res Clin Pract 2010;87:204–10.
10.     Weaver M, Patrick DL, Markson LE, Martin D, Frederic I, Berger M. Issues in the measurement of satisfaction with treatment. Am J Manag Care 1997;3:579–94.
11.     Bourdel-Marchasson I, Sinclair A. Elderly patients with type 2 diabetes mellitus-the need for high-quality, inpatient diabetes care. Hosp Pract (1995) 2013;41:51-6.
12.     Bourdel-Marchasson I, Druet C, Helmer C, Eschwege E, Lecomte P, Le-Goff M, Sinclair AJ, Fagot-Campagna A. Correlates of health-related quality of life in French people with type 2 diabetes. Diabetes Res Clin Pract 2013;101:226-35.
13.     Brown SE, Meltzer D, Chin MH, Huang ES. Perceptions of quality-of-life effects of treatments for diabetes mellitus in vulnerable and nonvulnerable older patients. J Am Geriatr Soc 2008;56:1183–90.
14.     Wikman A, Wardle J, Steptoe A. Quality of life and affective well-being in middle-aged and older people with chronic medical illnesses: a cross-sectional population based study. PLoS One 2011;6:e18952.
15.     Bradley C. Diabetes treatment satisfaction questionnaire. In: Bradly C (ed.). Handbook of Psychology and Diabetes: A Guide to Psychological Measurement in Diabetes Research and Practice. Chur, Switzerland: Harwood Academic Publisher, 1994:111–32.
16.     Atkinson MJ, Sinha A, Hass SL, Colman SS, Kumar RN, Brod M,  et al. Validation of a general measure of treatment satisfaction, the Treatment Satisfaction Questionnaire for Medication (TSQM), using a national panel study of chronic disease. Health Qual Life Outcomes 2004;2:12.
17.     Donatti C, Wild D, Horblyuk R, Beusterien KB, Anderson RT, Arondekar B, et al. Psychometric evaluation of the Satisfaction with Oral Anti-Diabetic Agent Scale (SOADAS). Diabetes Res Clin Pract 2008;80:108-13.
18.     Ruiz MA, Pardo A, Rejas J, Soto J, Villasante F, Aranguren JL. Development and Validation of the “Treatment Satisfaction with Medicines Questionnaire” (SATMED-Q). Value Health 2008;913–26.
19.     Peyrot M, Harshaw Q, Shillington AC, Xu Y, Rubin RR. Care delivery validation of a tool to assess medication treatment satisfaction in patients with type 2 diabetes: the Diabetes Medication System Rating Questionnaire (DMSRQ). Diabet Med 2012;29:1060–6.
20.     Ishii H, Oda E. Reproducibility and validity of a satisfaction questionnaire on hypoglycemic agents: the Oral Hypoglycemic Agent Questionnaire (OHA-Q). Diabetol Int 2012;3:152–63.
21.     Anderson RT, Girman CJ, Pawaskar MD, Camacho FT, Calles J, Kelly WS, DeMuro C, Balkrishnan R. Diabetes Medication Satisfaction Tool: a focus on treatment regimens. Diabetes Care 2009, 32:51–3.
22.     Bradley C, Todd C, Gorton T, Symonds E, Martin A, Plowright R. The development of an individualized questionnaire measure of perceived impact of diabetes on quality of life: the ADDQoL. Qual Life Res 1999;8:79–91.
23.     Marrett E, Stargardt T, Mavros P, Alexander CM. Patient reported outcomes in a survey of patients treated with oral antihyperglycaemic medications: associations with hypoglycaemia and weight gain. Diabetes Obes Metab 2009;11:1138–44.
24.     Stargardt T, Gonder-Frederick L, Krobot KJ, Alexander CM. Fear of hypoglycaemia: defining a minimum clinically important difference in patients with type 2 diabetes. Health Qual Life Outcomes 2009;7:91.
25.     Alvarez Guisasola F, Tofé Povedano S, Krishnarajah G, Lyu R, Mavros P, Yin D. Hypoglycaemic symptoms, treatment satisfaction, adherence and their associations with glycaemic goal in patients with type 2 diabetes mellitus: Findings from the Real-Life Effectiveness and Care Patterns of Diabetes Management (RECAP-DM) Study. Diabetes Obes Metab 2008;10(Suppl 1):25–32.
26.     Walz L, Pettersson B, Rosenqvist U, Deleskog A, Journath G, Wändell P. Impact of symptomatic hypoglycemia on medication adherence, patient satisfaction with treatment, and glycemic control in patients with type 2 diabetes. Patient Prefer Adherence 2014;8:593-601.
27.     Rejas J, Ruiz M, Pardo A, Soto J. Detecting changes in patient treatment satisfaction with medicines: the SATMED-Q. Value Health 2013;16:88-96.
28.     Bradley C. Diabetes treatment satisfaction questionnaire. Change version for use alongside status version provides appropriate solution where ceiling effects occur. Diabetes Care 1999;22:530–2.
29.     Petterson T, Pauline L, Hollis S, Young B, Newton P, Dornan T. Well-being and treatment satisfaction in older people with diabetes. Diabetes Care 1998;31:930-5.
30.     Ken W, Koopmanshap MA, Stolk RP, Rutten GEM, Wolffenbuttel BHR, Niessen LW. Health-related quality of life and treatment satisfaction in Dutch patients with type 2 diabetes. Diabetes Care 2002;25:458-63.
31.     Bradley C, Lewis KS. Measures of psychological well-being and treatment satisfaction developed from the responses of people with tablet-treated diabetes. Diabet Med 1990;7:445–51.
32.     Mitchell BD, Vietri J, Zagar A, Curtis B, Reaney M. Hypoglycaemic events in patients with type 2 diabetes in the United Kingdom: associations with patient-reported outcomes and self-reported HbA1c. BMC Endocr Disord 2013;13:59.
33.     Peyrot M, Xu Y, Rubin RR. Development and validation of the Diabetes Medication System Rating Questionnaire-Short Form. Diabet Med 2014;31:1237-44.
34.     Speight J, Bradley C. The ADKnowl: identifying knowledge deficits in diabetes care. Diabet Med 2001;18:626-33.
35.     Bradley C, Speight J. Patient perceptions of diabetes and diabetes therapy: assessing quality of life. Diabetes Metab Res Rev 2002;18(Suppl 3):S64-9.
36.     Speight J, Sinclair AJ, Browne JL, Woodcock A, Bradley C. Assessing the impact of diabetes on the quality of life of older adults living in a care home: validation of the ADDQoL Senior. Diabet Med 2013;30:74-80.
37.     Rodríguez-Mañas L, Bayer AJ, Kelly M, Zeyfang A, Izquierdo M, Laosa O, et al;*on behalf of the MID-Frail Consortium. An evaluation of the effectiveness of a multi-modal intervention in frail and pre-frail older people with type 2 diabetes − the MID-Frail study: study protocol for a randomised controlled trial. Trials 2014;15:34.
38.     Seaquist ER, Anderson J, Childs B, Cryer P, Dagogo-Jack S, Fish L, et al. Hypoglycemia and diabetes: a report of a workgroup of the American Diabetes Association and The Endocrine Society. Diabetes Care 2013;36:1384–95.
39.     Williams SA, Shi L, Brenneman SK, Johnson JC, Wegner JC, Fonseca V. The burden of hypoglycemia on healthcare utilization, costs, and quality of life among type 2 diabetes mellitus patients. J Diabetes Complications 2012;26:399–406.
40.     Marrett E, Radican L, Davies MJ, Zhang Q. Assessment of severity and frequency of self-reported hypoglycemia on quality of life in patients with type 2 diabetes treated with oral antihyperglycemic agents: a survey study. BMC Res Notes 2011;4:251.
41.     Shi L, Shao H, Zhao Y, Thomas NA. Is hypoglycemia fear independently associated with health-related quality of life? Health Qual Life Outcomes 2014;12:167.
42.     Matyka K, Evans M, Lomas J, Cranston I, Macdonald I, Amiel SA. Altered hierarchy of protective responses against severe hypoglycemia in normal aging in healthy men. Diabetes Care 1997;20:135–41.
43.     American Diabetes Association. Standards of medical care in diabetes–2011. Diabetes Care 2011;34(Suppl 1):S11–S61.
44.     Shorr RI, Ray WA, Daugherty JR, Griffin MR. Incidence and risk factors for serious hypoglycemia in older persons using insulin or sulfonylureas. Arch Intern Med 1997;157:1681–6.
45.     Roborel de Climens A, Tunceli K, Arnould B, Germain N, Iglay K, Norquist J, et al. Review of patient-reported outcome instruments measuring health-related quality of life and satisfaction in patients with type 2 diabetes treated with oral therapy. Curr Med Res Opin 2015;31:643-65.
46.     Centers for Disease Control and Prevention. National Diabetes Fact Sheet: National Estimates and General Information on Diabetes and Prediabetes in the United States. Atlanta, GA: US Department of Health and Human Services, Centers for Disease Control and Prevention, 2011. .

COMPREHENSIVE GERIATRIC CARE VERSUS STANDARD CARE FOR ELDERLY REFERRED TO A REHABILITATION UNIT – A RANDOMIZED CONTROLLED TRIAL


D. Zintchouk1, T. Lauritzen2, E.M. Damsgaard1


1. Aarhus University Hospital, Department of Geriatrics, Aarhus C, Denmark; 2. Department of Public Health, Section of General Medical Practice, Aarhus University, Aarhus C, Denmark.

Corresponding Author: Dmitri Zintchouk, MD, Aarhus University Hospital, Department of Geriatrics, P.P. Oerumsgade 11, 8000 Aarhus C, Denmark, dmizin@rm.dk, tel. 004526700903, fax 004578461930.

J Aging Res Clin Practice 2017;inpress
Published online December 15, 2016, http://dx.doi.org/10.14283/jarcp.2016.126


Abstract

Objective: To investigate the effect of comprehensive geriatric care (CGC) in elderly referred to a rehabilitation unit. This article describes the considerations behind the study. Design: Participants were randomized to either CGC or standard care. Setting: Participants were recruited from two community care rehabilitation units in Aarhus Municipality, Denmark, in the period between 2012 and 2015. Participants: Inclusion: Elderly patients aged 65 and older admitted from home or hospital. Exclusion: Persons receiving palliative care or assessed by a geriatrician during the past month. Intervention: Medical history, physical examination, blood tests, medication adjustment and follow-up by a geriatrician. The control group received standard care with the general practitioners (GPs) as back-up. Outcomes: Primary outcome: Hospital contacts drawn from national registers. Secondary outcomes: GPs contacts, institutionalization, medication status and mortality collected from national registers, activities of daily living (ADL), physical and cognitive function and quality of life measures collected by a blinded occupational therapist. All outcomes were assessed at day 10, 30 and 90 after arrival at the rehabilitation unit. Conclusion: A new model of care for elderly referred to community rehabilitation was developed and implemented. The potential benefits of this model were compared with usual care in a community rehabilitation unit in a pragmatic randomized clinical trial. We hypothesized that the geriatrician-performed CGC in elderly referred to a rehabilitation unit will reduce the hospital contacts by 25 % without increase in mortality and in contacts to GPs and home care services. We expect that this model will prevent deterioration in ADL, physical and cognitive functioning, and reduce the risk of institutionalization. If the results are positive, community rehabilitation services should be encouraged to change their routines for treatment of this population accordingly.

Key words: Randomized controlled trial, comprehensive geriatric care, hospitalization, rehabilitation, activity of daily living.


Introduction

Older people are the fastest growing sector of the population and they account for the largest increase in hospital admissions (1). More survivors with chronic diseases mean increasing numbers of overlapping comorbidities and increased risk of acute illness (2,3). Admissions to hospital for older people are combined with risk of rapid decline in functional ability, cognitive impairment, and change to residential care (4, 5). Despite a multitude of efforts to reduce hospital attendances and admissions worldwide, the numbers are increasing year after year (6).
To give patients the best life possible and to save health care resources, we intend to evaluate the effect of Comprehensive Geriatric Care performed by a geriatrician in a community operated rehabilitation unit.

Comprehensive geriatric assessment (CGA) and comprehensive geriatric care (CGC)

CGA is defined as a “multidimensional interdisciplinary diagnostic process focusing on a frail older person’s medical, psychological and functional capability”(7). In practice the assessment is followed by an intervention and sometimes by a follow-up based on the assessment. The recently suggested concept of comprehensive geriatric care (CGC) covers the combined assessment and follow-up interventional process more precisely (8).
Several models of CGA and CGC have been proposed. The last meta-analysis from Ellis et al. (9) showed that only inpatient CGA in acute geriatric units is effective and results in an increased likelihood of a patient returning home and avoiding admission to residential care or deterioration and death. Randomized studies of post-hospital discharge CGA found inconsistent benefits in functional status, acute care visits, depression, and patient satisfaction (10, 11). However, post-discharge intervention was associated with reduction in costs and readmission rates (12, 13), and CGC may be beneficial for hip fracture patients by reducing complications, mortality, readmissions, and delirium (8, 14-17).
A few randomized studies on different care models were published in the last five years. Senior and colleagues (18) showed that the model of restorative care services delivered within both residential care and at home by a multi-disciplinary team, included a case manager, nurse, occupational therapist and physiotherapist, tend to reduce the risk of death or permanent residential care. The absolute risk reduction for death or permanent residential care of 14.3% was not significant compared to usual care group at 24 months follow-up. Moreover, the intervention group had more frequent utilization of personal care, home help, career support, respite, day center and day activity centers than the usual care group. The same research group (19) showed that locally based care model managed by experienced nurses working with strong partnerships with family physicians reduces the risk of death and permanent residential care placement in frail older adults by 10.2% compared to usual community care coordinated by a centrally based needs assessor.
A recent Danish study shows that home-visits by a geriatrician and a specialized nurse on the first days after discharge from hospital reduce the readmission rate for acute medical patients by almost 50%, compared to patients accompanied home or subsequently receiving a telephone call. Rehospitalization was reduced, but 30-day mortality did not differ significantly between groups (20).

Geriatrician-performed comprehensive geriatric care in community rehabilitation settings

Physicians alone can perform many aspects of CGA followed by intervention. Often this is not practicable given the limited time available and the workload of instituting a complex care plan (21). We have deliberately chosen to focus on the role of the geriatrician in community rehabilitation. The staff of community rehabilitation units has some expertise in care of elderly with deteriorating function. Involvement of a larger team from the geriatric department may confuse the patients and cause unnecessary expenditure.
To our knowledge, no randomized studies have evaluated the effect of geriatrician-performed CGC comprising CGA and intervention with follow-up in elderly referred to a community rehabilitation unit.


Objective

The objective of this study is to investigate the effect of the geriatrician-performed CGC compared to a control group with standard care in elderly referred to a community rehabilitation unit.


Methods

The study is a pragmatic open assessor-blinded randomized clinical trial with 90 days’ follow-up.

Participants and settings

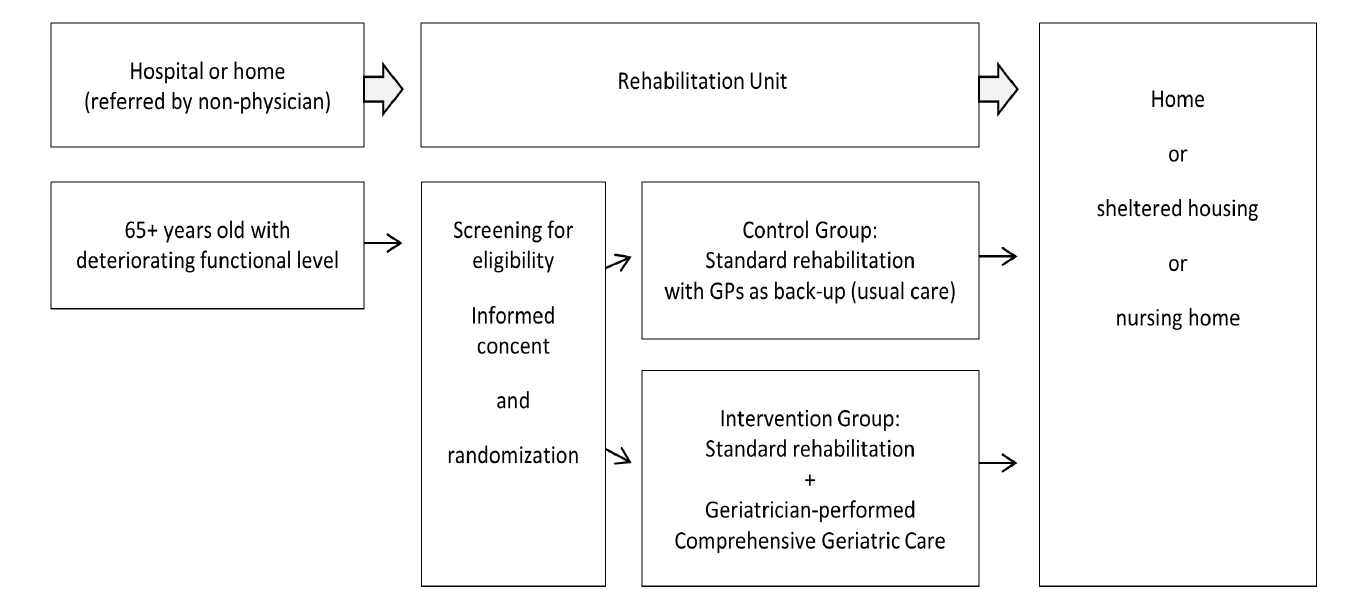
The inclusion criteria were: 1) age 65 years or older; 2) referral to a community rehabilitation unit from home or a hospital department. The exclusion criteria were: 1) palliative care; 2) assessment by a geriatrician during the past one month. The participants were all residents of two community rehabilitation units, Vikaergaarden (64 rooms) and Thorsgaarden (24 rooms) in Aarhus Municipality, Denmark. For study flow, see Figure.

Figure 1 Study flow in the Comprehensive Geriatric Care versus Standard Care for Elderly referred to a Rehabilitation Unit – a Randomized Controlled Trial

Figure 1
Study flow in the Comprehensive Geriatric Care versus Standard Care for Elderly referred to a Rehabilitation Unit –
a Randomized Controlled Trial

Recruitment

Participants were consecutively recruited from unit Vikaergaarden in the period January 17, 2012 to May 29, 2015, and from unit Thorsgaarden from October 20, 2014 to May 29, 2015. Eligible elderly and/or their relatives were contacted by the project manager or research nurse, who provided the oral and written information. Participants with cognitive impairment were also included. All had twenty-four hours to consider or discuss with relatives before the written informed consent was obtained.
During the study enrolment the following adjustments were made to accelerate the inclusion of the participants: inclusion age was lowered from 70+ to 65+ from May 14, 2012, previous contact with a geriatrician within three months was reduced to one month from December 2, 2012. All the changes have been submitted to Clinical.Trials.gov (NCT01506219).

Randomization

The random allocation of the participants to the intervention and control groups was done by an independent external organization (“TrialPartner”, Public Health and Quality Improvement, Central Denmark Region). The permuted block sizes stratified the randomization according to sex, age and place of referral. The randomization took place within three days after the participants’ arrival to the rehabilitation unit. In the intervention group the geriatrician informed participants and relatives about the allocation and gave the personal contact information card to participants or relatives.

Blinding

Owing to the nature of this study, it was impossible to blind participants and their relatives to the allocation group. The project manager screened the patients for eligibility, collected data on age, gender, place of referral and comorbidity before randomization, and conducted the intervention. The project manager had no contact with the control participants after randomization. The project manager was blinded to the study outcomes, which were collected from the registers or by the blinded research occupational therapist. Rehabilitation units’ staffs, particularly physiotherapists, were not blinded.

Standard care in the rehabilitation unit

The patients were referred for rehabilitation either from hospital or home by the hospital personnel or by the home care staff. Rehabilitation services are not free of charge, and a moderate fee for the stay is paid by the patients themselves. The typical standard rehabilitation and care program lasts five weeks. The interdisciplinary approach is based on the patient’s whole situation, capability and wishes/needs. On the first day of rehabilitation, the patient’s functional status is observed by the rehabilitation unit’s physiotherapists and occupational therapists, and a nutritional screening is performed by the rehabilitation unit’s nutritionist. The team members discuss the patient’s discharge destination and necessary arrangements with the patient and his/her relatives at the mid-term meeting and before discharge from the rehabilitation unit. Municipality nurse participates in these meeting personally or by telephone. Destination after discharge is based upon the patient’s motivation, functional and medical status.
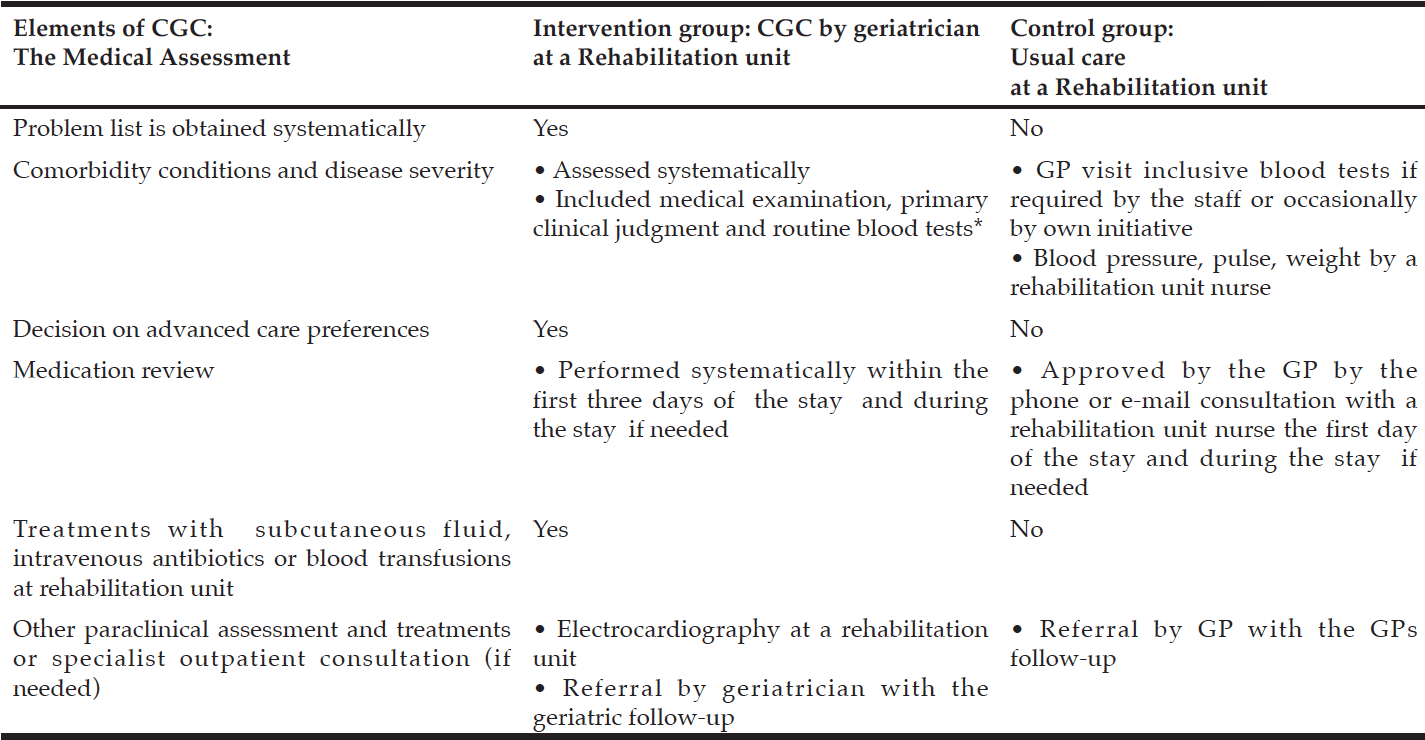
The patient’s GPs visit the patients during the stay if required or occasionally by own initiative depending on practice routine and geographical distance. GPs mostly visit frail and high-risk elderly patients especially if recently hospitalized. Acute medical aid is called for in case of illness after 4.p.m. and on weekends and public holidays.

Care in the intervention group

Participants randomized to the intervention group underwent the geriatrician-performed CGC during the rehabilitation stay. The intervention was performed by a physician specialized in geriatric medicine. The primary assessments lasted about an hour and included review of diagnoses, organ functional status, medication, and life expectancy evaluation. Individual disease management and coping was provided using the holistic approach during the face-to-face counselling, where the actual problems, expectations and aims were defined in dialogue with the patient and/or relatives. Afterwards, targeted problem solving with focus on the potentially reversible causes of functional deterioration was established. Finally, medication adjustment was carried out with particular attention to drugs which may lead to iatrogenic functional deterioration, delirium, falls, and malnutrition. A simple tool like the STOPP (Screening Tool of Older Person’s Prescriptions) and START (Screening Tool to Alert doctors to Right Treatment) criteria have been used as an evidence-based approach to reduce inappropriate prescribing and to encourage appropriate prescribing in the older adult (22, 23). When no evidence base existed for drug use, the approach was based on clinical judgment only, and the balance of risks and benefits of the drug for the individual was presented to the participants and/or relatives. In collaboration with rehabilitation unit’s staff the geriatrician followed the participants with regard to any change in symptoms, signs, or relevant laboratory and diagnostic test results that might indicate a restart of a specific medication, which had been discontinued.
The geriatrician was present at the rehabilitation unit for about four days a week, and could be contacted on telephone for any reason by participants, their relatives or the unit’s staff on weekdays from 8 a.m. to 3 p.m. In acute situations the geriatrician could also be contacted. The follow-up period by the geriatrician at the rehabilitation units was individualized (generally four weeks). The geriatrician sent the discharge summary for each intervention group participant to the GP. The geriatrician also provided education and support to the staff of the rehabilitation units and informed and advised the GPs and primary care services if needed. After discharge from the rehabilitation units GP are responsible for treatment.
See Table 1 for patient treatment in the intervention versus control group.

Table 1 Patient treatment in the Comprehensive Geriatric Care versus Standard Care for Elderly referred to a Rehabilitation Unit - a Randomized Controlled Trial

Table 1
Patient treatment in the Comprehensive Geriatric Care versus Standard Care for Elderly referred to a Rehabilitation Unit – a Randomized Controlled Trial

* Hemoglobin, Leucocytes, C-reactive protein, P-albumin, P-Potassium, P-Sodium, glomerular filtration rate.


Outcomes

Baseline data

Baseline characteristics were registered by the project manager from medical records and/or interview, comprising age, gender, place of referral (own home or hospital), marital status, residential status, diagnoses, comorbidity, and list of medications. The functional tests and quality of life at baseline (day 3) were done by the research occupational therapist after randomization.

Primary outcome

Primary outcome was total number of hospital contacts within 90 days after admission to the rehabilitation units.

Secondary outcomes

Secondary outcomes included all hospital and GPs contacts and number of participants with the hospital and GPs contacts, number of days spent in hospital, use of homecare services, transfer to nursing homes or sheltered housing, changes in medication status and number of deaths within 90 days. Moreover participant’s ADL, cognitive and physical functioning, and quality of life were assessed at day 3, 10, 30 and 90 after admission to the rehabilitation units. Trial outcome follow-up was completed August, 27. 2015.

Measurements

1) Mini-mental state (MMSE) (24). MMSE is a 10-minute bedside measure of impaired thinking. The items of the MMSE include tests of orientation, registration, recall, calculation and attention, naming, repetition, comprehension, reading, writing and drawing (25).
2) The Confusion Assessment Method (CAM) (26).
CAM is a standardized evidence-based tool that enables non-psychiatrically trained clinicians to identify and recognize delirium quickly and accurately in both clinical and research settings. The CAM includes four features found to be most effective in distinguishing delirium from other types of cognitive impairment.
3) Modified Barthel-100 Index (MBI) (27).
MBI is a 10-item instrument that provides a score of basic daily activities (feeding, bathing, grooming, dressing, bowels, bladder, toilet use, transfer, mobility, and stair climbing). The scores range from 0-100, with a higher score indicating greater independence.
4) The 30-second chair stand test (28).
The 30-second chair stand test measures body strength, by determining the number of times the participant can stand up fully and sit down in 30 seconds, with the arms crossed over the chest. We have used the modified version of this test, where use of armrest is allowed.
5) Depression List (DL) (29).
DL is a fifteen-item questionnaire, designed to assess quality of life in frail nursing home residents. DL addresses emotional well-being, social relationships, life satisfaction, comfort, functional competence, and autonomy. The scale ranges from 0 (best quality of life) to score 30 (poorest quality of life).
6) Charlson Comorbidity Index (CCI) (30) is used to categorize comorbidity in three levels:
0 = low, 1-2 = moderate, and 3 or more = high.
All the functional measurements, except for the modified version of “The 30-second chair stand test”, are validated for use in an elderly population. All questionnaires were performed as structured interviews. Trial outcome follow-up was completed August, 27. 2015.

Data collection

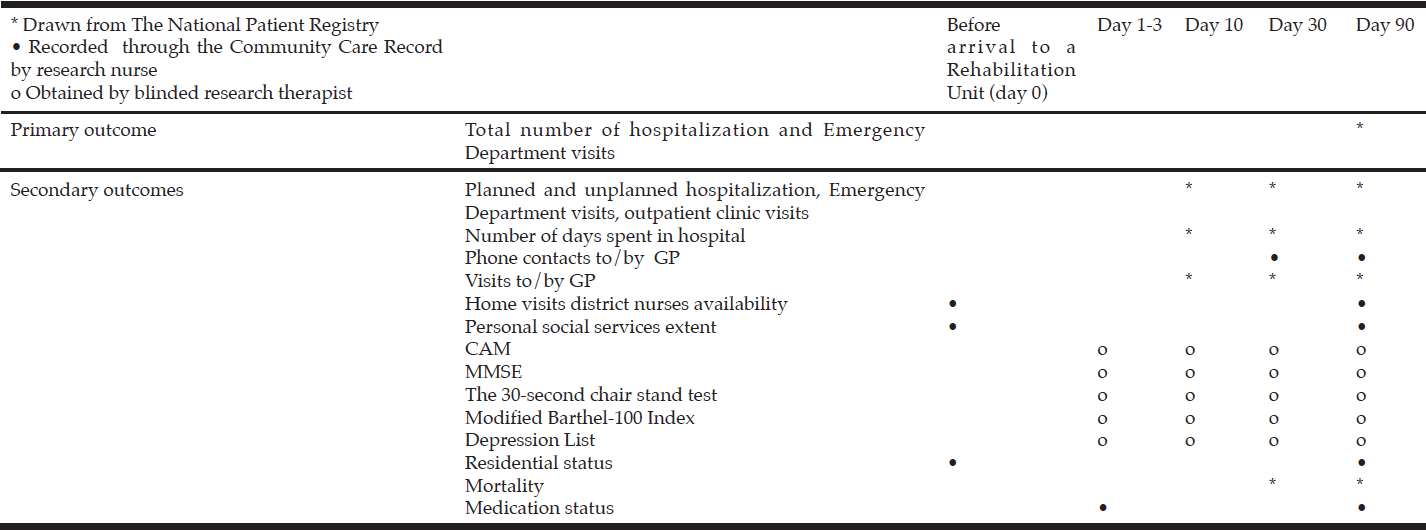
Data on hospital contacts and GPs contacts and mortality were collected from The National Patient Registry, The National Health Insurance Service Register and Danish Civil Registration System via Researcher Service, Statens Serum Institut, Danish Ministry of Health. Data on causes on hospital contacts were collected by the primary investigator from the Electronic Patient Record. Data on district nurses availability, extent of personal social services, walking aids and residential status were recorded through the Aarhus Community Care Record.
The actual medication usage and the number of Defined Daily Doses (DDD) within the different The Anatomical Therapeutic Chemical (ATC) Classification System were clarified and recorded under the personal medication review and through the Electronic Patient Record and the Aarhus Community Care Record by the primary investigator and the research nurse.
The functional tests and evaluation of the health-related quality of life during the follow-up period were performed by the research occupational therapist.
For data collection details, see Table 2.


Table 2 Outcomes in the Comprehensive Geriatric Care versus Standard Care for Elderly referred to a Rehabilitation Unit – a Randomized Controlled Trial

Table 2
Outcomes in the Comprehensive Geriatric Care versus Standard Care for Elderly referred to a Rehabilitation Unit –
a Randomized Controlled Trial


Ethics

Written informed consent was obtained from the participants by the project manager or research nurse within two days of arrival at the rehabilitation unit. Under the consent procedure the project manager assessed the elderly’s cognitive capacities. Cognitive impairment was defined by: (1) MMSE score of < 25; (2) CAM indicating delirium; or (3) a clinical cognitive evaluation undertaken by the project manager. Patients who were not cognitively impaired gave their written informed consent. Consent of cognitively impaired patients was given by a relative.
The project manager informed the participant’s GPs by letter about the study participation without information about the allocation. In the intervention group the GPs were shortly informed by the geriatrician about the treatment plan per mail in the Electronic Patient Record.
The CGC contained all known and commonly used and approved testing methods. All data are treated in confidence and participants are assured anonymity. The study is approved by the Danish Data Protection Agency, journal no. 2012-58-006, and the Ethical Committee of Central Denmark Region, journal no. M-20110262.
An interim-analysis was performed on the mortality when 50 % of participants have been randomized and have completed the 90 days’ follow-up. The interim-analysis was performed by an independent statistician, blinded for the treatment allocation. Results were evaluated by an independent researcher in order to stop the study prematurely if significant mortality differences were found.


Sample size and data analysis

Power calculation

For power calculation we used data on hospital contacts from The National Patient Registry in persons receiving rehabilitation at the rehabilitation unit Vikaergaarden from 1 April 2009 to 31 March 2010. There were 153 hospital contacts among 550 65+ year old persons within three months after the admission at rehabilitation. An analysis of hospital contacts over 30 days in 68 participants in a pilot project showed 33% fewer hospital contacts in the intervention group (number of persons with hospital contacts=7, total number of contacts=12) compared to the control group (number of persons with hospital contacts=7, total number of contacts=19).
For the sample size calculation we expected a 25% reduction of the hospital contacts, which we regarded as a clinically relevant change. Estimated dropout was set to 20% in both groups, as mortality was expected to be high. To obtain 80% statistical power and a significance level at 0.05 we had to recruit 370 patients.

Data analysis

All data are being entered in a database (Access 2010) by the research nurse. The statistical analyses will be conducted based on a predefined statistical protocol using STATA (version 13, STATA Corporation, Texas). Both descriptive and analytic analysis will be performed. Descriptive data will be calculated in percent, while median, average and minimum and maximum will be used for continuous variables. Continuous variables will be analyzed for normal distribution with the Kolmogorov-Smirnov test. The principle of repeated measurements will be used to analyze continuous variables. Variables with dichotomous outcomes will be analyzed using the logistic regression. Non-normally distributed data will be analyzed with the Mann-Whitney U test/Wilcoxon matched-pair’s test. Mortality will be analyzed with Kaplan-Meier analysis. Survival analysis will be performed with Cox Regression model adjusting for the sex, age, comorbidity and place of referral. In order to ensure the statistical robustness of the intervention outcomes, two different longitudinal imputation methods (last value carried forward and worst value imputation) will be used in case of missing values on sensitive analysis. There will be a bilateral significance level of 5% for evaluation of statistical significance in the primary and secondary endpoints. Intention-to-treat analysis will be performed.


Discussion

To our knowledge this is the first randomized controlled study to evaluate the effect of the CGC performed by a geriatrician in elderly citizens referred to community rehabilitation. In a systematic review the authors found that no particular model of geriatric care in community rehabilitation facilities could be recommended (31). In spite of multiple recent advances in providing rehabilitation in community settings, organization of these services, particularly the role of the geriatrician, remains poorly addressed.

Strengths and limitations of the study

Design

The RCT design was chosen to investigate the broad population of elderly with functional loss and multimorbidity, often excluded from RCTs (32-34). This must be considered as a strength. However, it has a price because the heterogeneity of the study population requires a much greater number of participants to demonstrate a possible significant difference.

Study population

The strength of the study population was the broad inclusion criteria, which insured enrolment of participants with a wide range of medical conditions.
We also decided to include elderly with dementia or confusion on arrival at the rehabilitation unit. We expected these persons to benefit most from the geriatrician-performed CGC.
On the other hand the recruitment was expected to be challenged due to difficulties in obtaining written informed consent. In order to detect possible selection bias among participants information about age, gender, place of referral and comorbidity (CCI) was obtained for participants as well as non-participants.

Intervention

The intervention was individualized and holistic based on a dialogue with the patient and/or relatives setting realistic common aims and expectation for treatment. This pragmatic clinical approach attempts to maximize external validity (35). The individual needs of the elderly are complicated by medical, functional, psychological, and social problems (36).This may lead to an atypical clinical presentation requiring flexibility and variation of the treatment.
Yet, the intervention was as systematic as possible in order to be reproducible. However, the medication adjustments by the geriatrician were not standardized. We were not able to use the STOPP-START tool strictly due to a systematic lack of the patient dimension. Medicine adjustments in elderly may conflict with established guidelines not addressing the care of people with multiple conditions (37). Such discrepancies may confuse the participant, the home career or the GP and result in readministration of discontinued drugs.
A specialist physician in geriatric medicine performed the intervention. This has strengths: the rehabilitation units’ staff could easily contact the geriatrician, who was physically available at an office in the rehabilitation units. In the majority of cases the primary investigator/project manager was also the geriatrician who conducted the intervention. It makes continuity possible and optimizes communication with the patients, their relatives and the staff of the rehabilitation units. It may promote the compliance and be more cost effective. On the other hand when the intervention depends on one physician the results are less generalizable and should be confirmed by further studies.
A stronger cooperation was established between the geriatric department and the rehabilitation units, likewise educational courses on common geriatric problems were carried out for the staff during the study period. Both the intervention and the control group were treated by the same personnel, which may have a positive spillover effect reducing a possible difference between the groups.

Blinding

A strength of our study was the systematical efforts tried to minimize information bias. The geriatrician was blinded to the primary endpoint data that were drawn from The National Patient Registry via Researcher Service. The dataset was generated by the Registry’s staff blinded to the patient allocation.
It was a weakness that it was impossible to blind the participants and their relatives or the geriatrician and the rehabilitation units’ staff to the allocation group. The research nurse was not blinded to patient allocation for practical reasons. The research occupational therapist was blinded to treatment allocation, but it could not be ruled out that the participants may have mentioned their allocation during the assessment. Thus, the performance-based measure of physical and cognitive functioning could be biased.

Outcome measures

A strength of this study was the use of functional measurements and questionnaires well validated for elderly. The modified version of the “30-second chair stand test”, in which the use of armrest is allowed, was the only test not validated. However, it is suited for our study population, as the majority of the participants were not able to perform the original version of the test.


Conclusion

A new model of care for elderly referred to community rehabilitation was developed and implemented. The potential benefits of this model were compared with usual care in a community rehabilitation unit in a pragmatic randomized clinical trial. This pragmatic approach closely mimics the true clinical situation. We hypothesize that the geriatrician-performed CGC in elderly referred to a rehabilitation unit will reduce the hospital contacts by 25 %. This should be done without increasing mortality, GP contacts or home care services. We expect this model to prevent deterioration in ADL, physical and cognitive functioning, and to reduce the risk of institutionalization. Data collection was recently completed. The results may soon be published.


Acknowledgements: This trial is funded by Geriatric Department Aarhus University Hospital and received donations from the Health Insurance Fund (Helsefonden) and Public Health in the Central Region Fund (Folkesundhed i Midten).
Authors’ contributions: DZ in collaboration with EMD and TL designed the study. DZ carried out the interventions. DZ drafted the manuscript. All authors revised the manuscript critically and have given their final approval of this version to be published.

Conflict of Interest: There is no conflict of interest to declare. DZ is a specialist in geriatrics and a member of network of Danish physicians and medical students “Physicians without sponsor”.


References

1. OECD. “Elderly population”(indicator). DOI: http://dx.doi.org/10.1787/8d805ea1-en (Accessed on 02 July 2016). 2014 Jun 25.
2. Barnett K, Mercer SW, Norbury M, Watt G, Wyke S, Guthrie B. Epidemiology of multimorbidity and implications for health care, research, and medical education: a cross-sectional study. Lancet 2012 Jul 7;380(9836):37-43.
3. Roberts DC, McKay MP, Shaffer A. Increasing rates of emergency department visits for elderly patients in the United States, 1993 to 2003. Ann Emerg Med 2008 Jun;51(6):769-774.
4. Covinsky KE, Palmer RM, Fortinsky RH, Counsell SR, Stewart AL, Kresevic D, et al. Loss of independence in activities of daily living in older adults hospitalized with medical illnesses: increased vulnerability with age. J Am Geriatr Soc 2003 Apr;51(4):451-458.
5. Mudge AM, O’Rourke P, Denaro CP. Timing and risk factors for functional changes associated with medical hospitalization in older patients. J Gerontol A Biol Sci Med Sci 2010 Aug;65(8):866-872.
6. van Walraven C, Bennett C, Jennings A, Austin PC, Forster AJ. Proportion of hospital readmissions deemed avoidable: a systematic review. CMAJ 2011 Apr 19;183(7):E391-402.
7. Rubenstein LZ, Stuck AE, Siu AL, Wieland D. Impacts of geriatric evaluation and management programs on defined outcomes: overview of the evidence. J Am Geriatr Soc 1991 Sep;39(9 Pt 2):8S-16S; discussion 17S-18S.
8. Prestmo A, Hagen G, Sletvold O, Helbostad JL, Thingstad P, Taraldsen K, et al. Comprehensive geriatric care for patients with hip fractures: a prospective, randomised, controlled trial. Lancet 2015 Apr 25;385(9978):1623-1633.
9. Ellis G, Whitehead MA, O’Neill D, Langhorne P, Robinson D. Comprehensive geriatric assessment for older adults admitted to hospital. Cochrane Database Syst Rev 2011 Jul 6;(7):CD006211. doi(7):CD006211.
10. Siu AL, Kravitz RL, Keeler E, Hemmerling K, Kington R, Davis JW, et al. Postdischarge geriatric assessment of hospitalized frail elderly patients. Arch Intern Med 1996 Jan 8;156(1):76-81.
11. Naylor MD, Brooten D, Campbell R, Jacobsen BS, Mezey MD, Pauly MV, et al. Comprehensive discharge planning and home follow-up of hospitalized elders: a randomized clinical trial. JAMA 1999 Feb 17;281(7):613-620.
12. Naylor MD, Aiken LH, Kurtzman ET, Olds DM, Hirschman KB. The care span: The importance of transitional care in achieving health reform. Health Aff (Millwood) 2011 Apr;30(4):746-754.
13. Hesselink G, Schoonhoven L, Barach P, Spijker A, Gademan P, Kalkman C, et al. Improving patient handovers from hospital to primary care: a systematic review. Ann Intern Med 2012 Sep 18;157(6):417-428.
14. Bjorkelund KB, Hommel A, Thorngren KG, Gustafson L, Larsson S, Lundberg D. Reducing delirium in elderly patients with hip fracture: a multi-factorial intervention study. Acta Anaesthesiol Scand 2010 Jul;54(6):678-688.
15. Gregersen M, Zintchouk D, Borris LC, Damsgaard EM. A geriatric multidisciplinary and tailor-made hospital-at-home method in nursing home residents with hip fracture. Geriatr Orthop Surg Rehabil 2011 Jul;2(4):148-154.
16. Fisher AA, Davis MW, Rubenach SE, Sivakumaran S, Smith PN, Budge MM. Outcomes for older patients with hip fractures: the impact of orthopedic and geriatric medicine cocare. J Orthop Trauma 2006 Mar;20(3):172-8; discussion 179-80.
17. Marcantonio ER, Flacker JM, Wright RJ, Resnick NM. Reducing delirium after hip fracture: a randomized trial. J Am Geriatr Soc 2001 May;49(5):516-522.
18. Senior HE, Parsons M, Kerse N, Chen MH, Jacobs S, Hoorn SV, Anderson CS. Promoting independence in frail older people: a randomised controlled trial of a restorative care service in New Zealand. Age Ageing, 2014, 43, 3, 418-424.
19. Parsons M, Senior H, Kerse N, Chen MH, Jacobs S, Vanderhoorn S, et al. Should care managers for older adults be located in primary care? A randomized controlled trial. J Am Geriatr Soc 2012 Jan;60(1):86-92.
20. Pedersen LH, Gregersen M, Barat I, Damsgaard EM. Early geriatric follow-up after discharge reduces readmissions – A quasi-randomised controlled trial. European Geriatric Medicine. In Press.
21. Moore AA, Siu AL. Screening for common problems in ambulatory elderly: clinical confirmation of a screening instrument. Am J Med 1996 Apr;100(4):438-443.
22. Gallagher P, O’Mahony D. STOPP (Screening Tool of Older Persons’ potentially inappropriate Prescriptions): application to acutely ill elderly patients and comparison with Beers’ criteria. Age Ageing 2008 Nov;37(6):673-679.
23. Gallagher P, Ryan C, Byrne S, Kennedy J, O’Mahony D. STOPP (Screening Tool of Older Person’s Prescriptions) and START (Screening Tool to Alert doctors to Right Treatment). Consensus validation. Int J Clin Pharmacol Ther 2008 Feb;46(2):72-83.
24. Folstein MF, Folstein SE, McHugh PR. “Mini-mental state”. A practical method for grading the cognitive state of patients for the clinician. J Psychiatr Res 1975 Nov;12(3):189-198.
25. Cockrell JR, Folstein MF. Mini-Mental State Examination (MMSE). Psychopharmacol Bull 1988;24(4):689-692.
26. Inouye SK, van Dyck CH, Alessi CA, Balkin S, Siegal AP, Horwitz RI. Clarifying confusion: the confusion assessment method. A new method for detection of delirium. Ann Intern Med 1990 Dec 15;113(12):941-948.
27. Shah S, Vanclay F, Cooper B. Improving the sensitivity of the Barthel Index for stroke rehabilitation. J Clin Epidemiol 1989;42(8):703-709.
28. Jones CJ, Rikli RE, Beam WC. A 30-s chair-stand test as a measure of lower body strength in community-residing older adults. Res Q Exerc Sport 1999 Jun;70(2):113-119.
29. Gerritsen DL, Steverink N, Ooms ME, de Vet HC, Ribbe MW. Measurement of overall quality of life in nursing homes through self-report: the role of cognitive impairment. Qual Life Res 2007 Aug;16(6):1029-1037.
30. Charlson ME, Pompei P, Ales KL, MacKenzie CR. A new method of classifying prognostic comorbidity in longitudinal studies: Development and validation. J Chronic Dis 1987; 40 (5): 373–83.
31. Parker G, Bhakta P, Katbamna S, Lovett C, Paisley S, Parker S, et al. Best place of care for older people after acute and during subacute illness: a systematic review. J Health Serv Res Policy 2000 Jul;5(3):176-189.
32. Bourgeois FT, Olson KL, Tse T, Ioannidis JP, Mandl KD. Prevalence and Characteristics of Interventional Trials Conducted Exclusively in Elderly Persons: A Cross-Sectional Analysis of Registered Clinical Trials. PLoS One 2016 May 19;11(5):e0155948.
33. Konrat C, Boutron I, Trinquart L, Auleley GR, Ricordeau P, Ravaud P. Underrepresentation of elderly people in randomised controlled trials. The example of trials of 4 widely prescribed drugs. PLoS One 2012;7(3):e33559.
34. Van Spall HG, Toren A, Kiss A, Fowler RA. Eligibility criteria of randomized controlled trials published in high-impact general medical journals: a systematic sampling review. JAMA 2007 Mar 21;297(11):1233-1240.
35. Zwarenstein M, Treweek S, Gagnier JJ, Altman DG, Tunis S, Haynes B, et al. Improving the reporting of pragmatic trials: an extension of the CONSORT statement. BMJ 2008 Nov 11;337:a2390.
36. Gray L. Geriatric consultation: is there a future? Age Ageing 2007 Jan;36(1):1-2.
37. Guthrie B, Payne K, Alderson P, McMurdo ME, Mercer SW. Adapting clinical guidelines to take account of multimorbidity. BMJ 2012 Oct 4;345:e6341.

DIETARY HABITS AND FUNCTIONAL LIMITATION OF OLDER BRAZILIAN ADULTS: EVIDENCE FROM THE BRAZILIAN NATIONAL HEALTH SURVEY (2013)


E. Alves Valle1, J. Vaz de Melo Mambrini1, S. Viana Peixoto1,2, D. Carvalho Malta2, C. de Oliveira3, M.F. Lima-Costa1


1. Oswaldo Cruz Foundation, René Rachou Research Centre, Belo Horizonte-MG, Brazil; 2. Federal University of Minas Gerais, School of Nursing, Belo Horizonte-MG, Brazil; 3. Department of Epidemiology & Public Health, University College London, London, UK

Corresponding Author: E. Alves Valle, CPQRR/Fiocruz Belo Horizonte, Av. Augusto de Lima, 1715 – Barro Preto, Belo Horizonte – MG, 30190-002, Brazil, +55 31 3349-7700, estevaovalle@gmail.com

J Aging Res Clin Practice 2016;inpress
Published online August 25, 2016, http://dx.doi.org/10.14283/jarcp.2016.112


Abstract

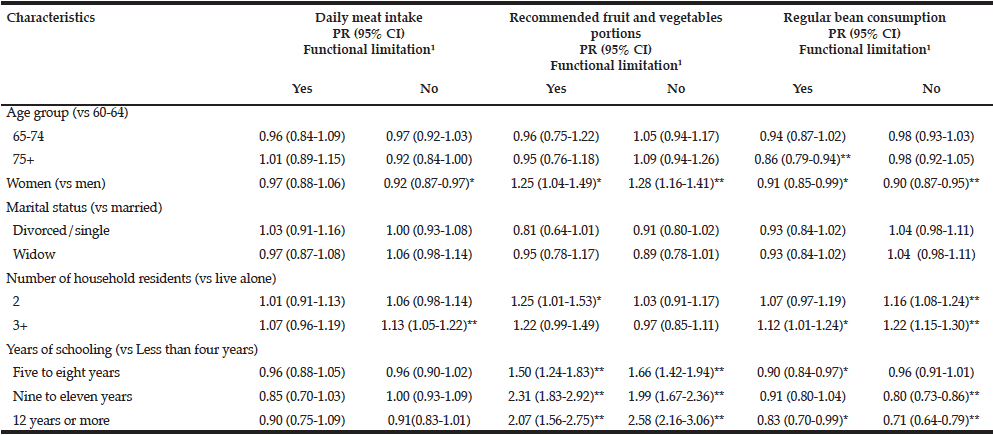
Abstract: Objective: To compare the consumption of selected healthy and unhealthy food groups among elderly Brazilians with daily living activity limitations relative to those with no limitations. Design: Cross-sectional analyses of a nationally representative survey. Setting: The Brazilian National Health Survey, conducted in 2013. Subjects: 11,177 Brazilians aged 60 and over. Results: The prevalence of daily living limitations was 29% (95% CI 27.6,30.5). The consumption of daily meat, beans on a regular basis, and recommended fruit and vegetables intake were 67.1% (95% CI 66.5,68.7), 71.3% (95% CI 69.9,72.8) and 37.3% (95% CI 35.6,39.9), respectively. Compared to those without functional limitation, the consumption of these three food groups was significantly lower among those older adults with functional limitation (Prevalence Ratio = 0.89, 95% CI 0.80,0.98; 0.90, 95% CI 0.82,0.99 and PR 0.86, 95% CI, 0.76,0.96, respectively), independently of age, sex, marital status, living arrangements and education. Level of education showed a strong positive association with fruit and vegetable consumption, and a negative association with bean consumption, a staple diet in Brazil. Conclusions: Our findings highlight the need for public health policies to increase consumption healthy food consumption among those older adults with functional limitations, especially fruit and vegetable intake among those who have low education levels.

Key words: Older adults, nutrition, activity of daily living, disability, healthy ageing, national health survey, Brazil.


Introduction

Nutrition among older adults is a significant public health issue in middle income countries overwhelmed with the rapid demographic ageing (1-3). Furthermore, this scenario generates great concern among policy makers because of the burden of disability in old age. There is evidence that a diet rich in vegetables, fruit, fish, nuts and wine is associated with more disability free days, compared to a diet rich in fast food, fried foods, sweets and fizzy drinks (2). A healthy diet is also associated with better cognition and mental health (3). However, physical, mental and financial barriers experienced by people with disabilities may limit their access to a healthier diet (4). A recent study, based on a nationally representative sample of US adults, showed that people with disabilities are less likely to meet recommended levels of saturated fat, fiber, vitamins A and C, calcium and potassium intakes compared to those without disability (4). These findings highlight the need for further research to investigate the association between poorer diet and disability in different countries and cultures.
Brazil has the world’s fifth largest population and has experienced considerable economic growth over the last decades. As a rapidly ageing middle-income country, social policy development for the elderly is of paramount importance (5, 6). From a nutritional perspective, the prevalence of obesity among Brazilians has increased, while the prevalence of undernutrition has an impressive decline (6). Recently, the Ministry of Health developed a guideline to promote healthy diet, as part of the national strategy for the control of non-communicable diseases and associated risk factors (7). As part of the public national health system (in Portuguese, “Sistema Único de Saúde”), Brazil has a national policy for the elderly, which considers the importance of individual functional status (5).  No previous study has compared nutritional patterns between Brazilians with and without disabilities, an essential issue to guide health policies for the elderly.
In the present study, we used data from the most recent Brazilian National Health Survey (8) to describe the dietary habits of older Brazilians, to compare the consumption of selected healthy and unhealthy food groups between those with and without functional limitations and, finally, to identify sociodemographic factors associated to a lower consumption of certain food groups among those individuals with functional limitations.


Methods

The Brazilian National Health Survey (PNS)

Data are derived from the National Health Survey (“Pesquisa Nacional de Saúde”) (8), a nationally representative household survey conducted by the Brazilian Institute of Geography and Statistics (IBGE) and Ministry of Health in 2013. The survey employs a complex sampling design. The primary sampling units are census tracts based on the 2010 census and randomly selected from the IBGE national master sampling plan. Within each census tract, households were randomly selected. Within selected households, a randomly selected respondent aged 18 or over was invited to take part in the study. The final sample size of persons aged 18 years and over was 62,986 (8). All survey participants aged 60 years and older were selected for this analysis.

Functional limitation

Physical functioning limitation was defined as reporting having any difficulty in one or more of the following ten basic (ADL) and/or instrumental activities of daily living (IADL): dressing, walking across a room, bathing or showering, eating, getting in or out of bed, using the toilet, going outside the house using a transportation, managing medications, shopping and managing finances.

Dietary habits

Dietary pattern was assessed by daily or weekly frequency consumption of certain healthy and unhealthy food groups. The following groups, with definitions used, were: regular fish intake (in one or more days per week); regular intake of beans (five or more days per week); recommended fruit and vegetable intake (five or more daily portions, five or more days per week, including wholesome food, in salads or juices); red meat or chicken with visible fat (once or more times per week); full fat milk (any weekly frequency); regular consumption of sweets (five or more days a week); regular ingestion of fizzy drinks or artificial juices (five or more days a week) and high levels of salt (according respondent’s self-perception).In addition, the daily meat consumption (beef, pork and/or chicken) was measured since it is an important marker of protein intake in older adults (9).

Sociodemographic characteristics

Sociodemographic characteristics include age group (60-64, 65-74, 75 and older), sex, marital status (married, divorced/single and widow), number of residents within the household (live alone, two, three or more) and educational attainment. Educational attainment was categorized into: less than four years of schooling, five to eight years of schooling, nine to eleven years of schooling, and 12 years or more.

Statistical analysis

Descriptive analyses were based on prevalence and their respective 95% confidence intervals. In the unadjusted analyses, Pearson Chi Squared test was used to assess the significance of differences between the sociodemographic variables and the dietary patterns of older adults with and without functional limitations. Multivariate analyses, investigating the association between dietary patterns and functional limitations, were performed using prevalence ratios and their 95% confidence intervals through Poisson regression models (10). This was also the statistical approach used to examine the associations between sociodemographic characteristics and daily meat intake, recommended daily intake of fruit and vegetables and regular ingestion of beans of older adults with and without functional limitations. The estimated prevalence ratios from the Poisson regression models were adjusted simultaneously by age, sex, educational attainment, marital status and number of residents within the household. All analyses were performed using Stata version 13.0 and results incorporate appropriate procedures to control for weights and the complex PNS sample design (11).

Ethical approval

The National Health Survey was approved by the National Commission of Ethics in Research on Human Beings (in Portuguese, “Comissão Nacional de Ética em Pesquisa”), of the Ministry of Health, (Process number 328.159 of June 2013). All participants signed a consent form.


Results

The present analysis was based on 11,177 survey participants aged 60 years and over. 3,340 (29.0%; 95% CI: 27.6-30.5%) reported some functional limitation. Table 1 presents descriptive statistics for the sample. Overall, participants predominantly aged between 65 and 74, were female, married, residents in households with 3 or more residents and had five to eight years of schooling. The prevalence of women with functional limitation was significantly higher compared to those without functional limitations (62.4% versus 53.9%). Statistically significant differences (p<0.05) between those with functional limitation compared to those without were observed for oldest age (46.5% vs. 16.7%aged 75 and older, respectively), widowed (39% vs 21.5%) and those with educational attainment less than four years of schooling (47.7% vs 25.7%).

Table 1 Sociodemographic characteristics of the sample of older Brazilians, and by functional limitation status (The Brazilian National Health Survey, 2013)

Table 1
Sociodemographic characteristics of the sample of older Brazilians, and by functional limitation status (The Brazilian National Health Survey, 2013)

1. At least one difficulty in the following ten activities: dressing, walking across a room, bathing or showering, eating, getting in or out of bed, using the toilet, handling transportation (driving or navigating public transit), managing medications, shopping and managing finances; %: (95% CI): weighted prevalence and 95% confidence interval; * To test differences between those with and without functional limitation (Pearson Chi-squared test)


The prevalence of selected food groups intake among study participants, and by functional limitation, is displayed in Table 2. Overall, higher prevalence rates were found for weekly consumption of full fat milk (73.8%), regular intake of beans (71.3%), daily consumption of meat (67.1%) and regular fish intake (58.4%). On the other hand, lower prevalence rates were observed for the recommended intake of fruit and vegetables (37.3%), weekly intake red meat or chicken with visible excess of fat (28.2%), regular sweets (17.2%), regular fizzy drinks/artificial juices (12.0%) and high salt intake (7.9%). Significant associations (p<0.05) with functional limitation were found with daily meat consumption (64.1 vs 68.4%, those with and without limitations, respectively), regular fish intake (53.3% and 60.4%, respectively), recommended amount of fruit and vegetable intake (32.1% vs 39.4%, respectively) and excessive salt intake (6.3% vs 8.6%, respectively).

Table 2 Dietary habits of older Brazilians, and by functional limitation status (The Brazilian National Health Survey, 2013

Table 2
Dietary habits of older Brazilians, and by functional limitation status (The Brazilian National Health Survey, 2013

1. At least one difficulty in the following ten activities: dressing, walking across a room, bathing or showering, eating, getting in or out of bed, using the toilet, handling transportation (driving or navigating public transit), managing medications, shopping and managing finances; %: (95% CI): weighted prevalence and 95% confidence interval; * To test differences between those with and without functional limitation (Pearson Chi-squared test)


Table 3 presents results of multivariate Poisson regression models for each outcome. After adjusting for sociodemographic characteristics, the dietary patterns that remained significantly associated with functional limitation were: daily meat intake (PR = 0.89, 95% CI: 0.80-0.98), recommended fruit and vegetables intake (PR = 0.86, 95% CI: 0.76-0.96) and regular bean consumption (PR = 0.90, 95% CI: 0.82-0.99).

Table 3 Multivariate analysis of dietary habits and functional limitation among older Brazilians (Brazilian National Health Survey, 2013)

Table 3
Multivariate analysis of dietary habits and functional limitation among older Brazilians (Brazilian National Health Survey, 2013)

1. At least one difficulty in the following ten activities: dressing, walking across a room, bathing or showering, eating, getting in or out of bed, using the toilet, handling transportation (driving or navigating public transit), managing medications, shopping and managing finances; PR (95% CI): weighted prevalence ratios and their 95% confidence intervals estimated by Poisson regression models and adjusted for age, sex, marital status, household number of residents and educational attainment; *p < 0.05


Results from the multivariate analysis of the association of sociodemographic characteristics with selected dietary habits among those participants with and without functional limitation are shown in table 4.  Generally, the association was similar in both functional groups, as follows: women had a positive association with the recommended fruit and vegetable intake and a negative association with regular bean consumption; the number of residents within the household (i.e. three or more) was positively associated with regular bean consumption; schooling level was positively correlated with recommended vegetable intake, and negatively correlated with regular bens intake. Conjugal status showed no significant association with the consumption of all the above mentioned foods in any group. Oldest aged showed a negative association with regular bean intake among those with functioning limitations.

Table 4 Multivariate analysis of sociodemographic factors, selected dietary habits and functional limitation among older Brazilians (Brazilian National Health Survey, 2013)

Table 4
Multivariate analysis of sociodemographic factors, selected dietary habits and functional limitation among older Brazilians (Brazilian National Health Survey, 2013)

1. At least one difficulty in the following ten activities: dressing, walking across a room, bathing or showering, eating, getting in or out of bed, using the toilet, handling transportation (driving or navigating public transit), managing medications, shopping and managing finances;  *p < 0.05; ** p <= 0.001; PR (95% CI): weighted prevalence ratios and their 95% confidence intervals estimated by Poisson regression models and adjusted for age, sex, marital status, household number of residents and educational attainment


Discussion

The key findings from this study, based on a nationally representative sample of non-institutionalised older Brazilian adults, are: (1) those with functional limitations were less likely to a daily intake of meat, recommended intake of fruit and vegetables and regular ingestion of beans, independent of age, sex and other sociodemographic characteristics; (2) educational attainment was the strongest sociodemographic factor associated to recommended fruit and vegetables intake (higher intake among those with higher educational attainment).
Our findings corroborated previous research based on data from the Brazilian National Household Survey (PNAD) conducted in 1998, 2003 and 2008 that showed higher prevalence of functional limitation among the oldest old, women and those with a low level of education (12,13). Regarding dietary patterns, our study found similar results to earlier descriptive analyses from the Brazilian National Health Survey (2013), based on data from the population aged 18 and older, showing high consumption of healthy foods (such as beans and fish), in contrast with low consumption of fruit vegetables and high intake of food rich in saturated fat (non-lean red meat, chicken or full fat milk) (14, 15).
After adjusting for sociodemographic factors, the dietary patterns of older Brazilians with and without functional limitations were similar, regarding the regular consumption of fish, food rich in fat, fizzy drinks or artificial juices, sweets and salt. On the other hand, the daily meat intake (red meat, chicken and/or fish) was smaller among those with functional limitation. To note that low protein intake may lead to an increased risk to sarcopenia, frailty, falls and fractures resulting into an even greater risk to develop functional limitations (9, 16). Brazilian guidelines (7) and others (17, 18) recommend a diet rich in fruit, vegetables and pulses, like beans, for its important preventive role against the development of non-communicable diseases (17, 18). The current analysis shows that older adults with functional limitations are 10% and 14% less likely to eat regularly beans and the recommended intake of vegetables, respectively.
It is worth mentioning that there are physical, mental and financial barriers which could prevent older adults with functional limitation to have a healthier diet (4). Unfortunately, data from national health surveys usually do not generate information that allows us to identify these barriers. Therefore, the present analysis was focused on sociodemographic factors associated to some healthy diet habits. Overall, the sociodemographic factors associated to daily intake of meat, recommended intake of fruit and vegetables and regular ingestion of beans were similar among those participants with and without functional limitations. Compared to men, women with and without functional limitation reported less meat and beans intake and higher fruit and vegetable consumption. Similar findings regarding women eating more fruit and vegetables were found in Canada (19) but not in South Africa and Iran (20, 21). Furthermore, a qualitative study showed that Canadian women were more aware of the benefits of such food group compared to men (22). Regular ingestion of beans also had a positive and independent association with household number of residents.
As previously mentioned, educational attainment was the strongest sociodemographic factor associated to fruit and vegetable and intake among both those with and without functional limitation. The prevalence of recommended fruit and vegetable intake increased by each level of educational attainment in both functioning groups (with and without functional limitation), with those with 12 or more years of schooling having the highest intake levels. Older Brazilian adults with and without functional limitations with 12 or more years of schooling degree were 207% and 258% more likely to regularly eat fruits and vegetables compared to those with low educational attainment. The positive association between the recommended fruit and vegetables intake and education or income has also been observed in other countries (19, 21, 23). An interesting study conducted in Brazil using data from the Brazilian National Family Budget Survey showed that the total household expenditure on fruit and vegetables is inversely proportional to the price of such food and directly proportional to the household income (24).
In contrast, regular consumption of beans, an important ingredient of the Brazilian staple diet, decreased gradually according to level education in both those with and without functional limitation. Older adults with and without functional limitation with 12 or more years of schooling were17% and 29%, respectively, less likely to eat beans regularly than those with lower education level. A negative association between educational level and beans intake among adults residing in large cities in Brazil has been previously reported (25,26). Beans are an important source of protein, fibre, minerals, vitamins and flavonoids with potential benefits to health (27). This type of food has been considered by some authors as the “meat of the poor” due to its important nutritional value in low income countries (28) and perhaps it has been replaced by other types of food culturally considered “posh” by higher socioeconomic groups’ individuals.
This study has some strengths and limitations. The strength of the present study lies in its large nationally representative sample of older Brazilian with data on functional limitation and dietary habits. Therefore, to the best of our knowledge, this is the first study to compare dietary habits of older Brazilian with and without functional limitations. However, because the data are cross-sectional, we are unable to determine causal relationships and directionality of the observed associations. We are not able to establish if dietary habits were adopted before the development of functional limitation or vice-versa. In addition, the dietary habits module of the interview is rather concise and like any questionnaire on diet is prone to recall bias, leading to under or overestimation of amount of consumption (29).  However, it is unlikely that differential associations have affected those with and without functional limitations. Finally, in our analyses we could not establish an individual and/or household income which could directly affect the food choice purchase (24). This limitation was partially addressed by using data on educational attainment which is an important socioeconomic position indicator.
In 2006, the Brazilian Ministry of Health implemented the National Health Policy for the Elderly raising the issue of how important it is to include functional limitation as one of its policies (5).  27 million Brazilian people are currently aged 60 and older (30). Taking into account the findings from the present study, about 5.4 million older adults in Brazil eat less than the recommended amount of fruit and vegetables as indicated by the WHO (31). In conclusion, our findings highlight the importance of assessing dietary habits when investigating functional limitation in older adults. Our findings also highlight the need for public health policies to increase consumption healthy food consumption among those older adults with functional limitations, especially fruit and vegetable intake among those who have low education levels.


Acknowledgements: This study was funded by the Brazilian Ministry of Health, Secretariat of Health Surveillance. MFLC and SVP are fellowship researchers of the Brazilian National Council for Scientific and Technological Development (CNPq).


References

1.     United Nations. Department of Economic and Social Affairs. Population Division. World Population Prospects. The 2015 Revision, 2015. http://esa.un.org/unpd/wpp/. Accessed April 2016.
2.     Struijk EA, Beulens JWJ, May AM, et al. Dietary patterns in relation to disease burden expressed in Disability- Adjusted Life Years 1 – 3. Am J Clin Nutr  2014;100(4), 1158-1165.
3.     Milte CM, McNaughton SA. Dietary patterns and successful ageing: a systematic review. Eur J Nutr 2016;55(2), 423-50.
4.     An R, Chiu CY, Zhang Z, Burd NA. Nutrient intake among US adults with disabilities. J Hum Nutr Diet 2015;28(5), 465-475.
5.     BRASIL. Ministério da Saúde. Portaria nº 2.528 de 2006. http://bvsms.saude.gov.br/bvs/saudelegis/gm/2006/prt2528_19_10_2006.html. (Accessed April 2016.
6.     Conde WL, Monteiro CA. Nutrition transition and double burden of undernutrition and excess of weight in Brazil. Am J Clin 2014;100(6),1617S – 1622S.
7.     Monteiro CA, Cannon G, Moubarac JC, et al. Dietary guidelines to nourish humanity and the planet in the twenty-first century. A blueprint from Brazil. Public Health Nutr 2015;18(13),2311-2322.
8.     Szwarcwald CL, Malta DC, Pereira CA, et al. Pesquisa Nacional de Saúde no Brasil: concepção e metodologia de aplicação. Cien Saude Colet. 2014;19(2); 333-342.
9.     Nowson C, O’Connell S. Protein Requirements and Recommendations for Older People: A Review. Nutrients 2015;7(8), 6874-6899.
10.     Long S, Freese J. Regression Models for Categorical Dependent Variables Using Stata. Stata Press, College Station, Texas, 2014.
11.     Souza-Júnior PRB, Freitas MPS, Antonaci G et al. Desenho da amostra da Pesquisa Nacional de Saúde 2013. Epidemiol e Serviços Saúde 2015;24(2), 207-216.
12.     Lima-Costa MF, De Oliveira C, Macinko J, Marmot M. Socioeconomic Inequalities in Health in Older Adults in Brazil and England. Am J Public Health.  2012;102(8),1535-1541.
13.     Lima-Costa MF, Matos DL, Camargos VP, Macinko J. Tendências em dez anos das condições de saúde de idosos brasileiros: evidências da Pesquisa Nacional por Amostra de Domicílios (1998, 2003, 2008). Cien Saude Colet. 2011;16, 3689-3696.
14.     Claro RM, Aline M, Santos S et al. Consumo de alimentos não saudáveis relacionados a doenças crônicas não transmissíveis no Brasil: Pesquisa Nacional de Saúde, 2013 Epidemiol e Serviços Saúde 2015;24(2), 257-265.
15.     Jaime PC, Stopa SR, Oliveira TP et al. Prevalência e distribuição sociodemográfica de marcadores de alimentação saudável, Pesquisa Nacional de Saúde, Brasil 2013. Epidemiol e Serviços Saúde.  2015;24(2),267-276.
16.     Imai E, Tsubota-Utsugi M, Kikuya M, et al. Animal protein intake is associated with higher-level functional capacity in elderly adults: The Ohasama study. J Am Geriatr Soc.  2014;62(3), 426-434.
17.     FAO/WHO. Fruit and Vegetables for Health: Report of a Joint FAO/WHO Workshop, 1-3 September, Kobe, Japan, 2004
18.     NICE Guidelines, 2015. Dementia, Disability and Frailty in Later Life – Mid-Life Approaches to Delay or Prevent Onset.http://nice.org.uk/guidance/ng16. Accessed April 2016.
19.     Riediger ND, Moghadasian MH. Patterns of fruit and vegetable consumption and the influence of sex, age and socio-demographic factors among Canadian elderly. J Am Coll Nutr. 2008;27,1541-1087.
20.     Salehi L, Eftekhar H, Mohammad K et al. Consumption of fruit and vegetables among elderly people: a cross sectional study from Iran. Nutr J. 2010;9(1):2.
21.     Peltzer K, Phaswana-Mafuya N. Fruit and vegetable intake and associated factors in older adults in South Africa. Glob Health Action. 2012;5,1-8.
22.     Paquette M-C. Perceptions of healthy eating: state of knowledge and research gaps. Can J Public Health 96, Suppl. 2005;3, S15-S19.
23.     Gregory-Mercado KY, Staten LK, Ranger-Moore J, et al. Fruit and vegetable consumption of older Mexican-American women is associated with their acculturation level. Ethn Dis. 2006;16(1), 89-95.
24.     Claro RM, Monteiro CA. Renda familiar, preço de alimentos e aquisição domiciliar de frutas e hortaliças no Brasil. Rev Saude Publica 2010;44(6), 1014-1020.
25.     Velásquez-Meléndez G, Mendes LL, Pessoa MC, et al. Tendências da frequência do consumo de feijão por meio de inquérito telefônico nas capitais brasileiras, 2006 a 2009. Cien Saude Colet.  2009;17(12), 3363-3370.
26.     Malta DC, Campos MO, Oliveira MM De, Pinto B, et al. Prevalência de fatores de risco e proteção para doenças crônicas não transmissíveis em adultos residentes em capitais brasileiras, 2013. Epidemiol. Serv. Saúde, 2015;24(3), 373-387.
27.     Hayat I, Ahmad A, Masud T et al. Nutritional and health perspectives of beans (Phaseolus vulgaris L.): an overview. Crit Rev Food Sci Nutr.  2014;54, 580-592.
28.     Tharanathan RN, Mahadevamma S. Grain legumes – A boon to human nutrition. Trends Food Sci Technol.  2003;14(12), 507-518.
29.     Molag ML, De Vries JHM, Ocké MC, et al. Design characteristics of food frequency questionnaires in relation to their validity. Am J Epidemiol.  2007;166(12),1468-1478.
30.     Instituto Brasileiro de Geografia e Estatística – IBGE. Sinopse Do Censo Demográfico 2010.; 2011. http://portal.mte.gov.br/data/files/8A7C816A2E7311D1013003524D7B79E4/IBGE_CENSO2010_sinopse.pdf Accessed April 2016.
31.     World Health Organization, 2004. Global Strategy on Diet, Physical Activity and Health. Fifty-Seventh World Health Assembly. http://www.who.int/dietphysicalactivity/strategy/eb11344/strategy_english_web.pdf Accessed April 2016.