
S. Nazari1, M. Bakhtiyary1, A.N. Shabestari2, F. Sharifi3, P.F. Afshar4
1. School of Nursing and Midwifery, Tehran University of Medical Sciences, Tehran, Iran; 2. Department of Geriatric Medicine, School of Medicine, Tehran University of Medical Sciences, Tehran, Iran; 3. Elderly Health Research Center, Endocrinology and Metabolism Research Institute, Tehran University of Medical Science, Tehran, Iran; 4. Department of Gerontology, School of Behavioral Sciences and Mental Health (Tehran Institute of Psychiatry), Iran University of Medical Sciences, Tehran, Iran
Corresponding Author: Pouya Farokhnezhad Afshar, School of Behavioral Sciences and Mental Health (Tehran Institute of Psychiatry), Shahid Mansouri Street, Niyayesh Street, Satarkhan Avenue, Tehran, Iran. Postal code: 1445613111, Tel: 0098 21 63471352). ORCID: 0000-0002-6450-7084; E-mail: farokhnezhad.p@iums.ac.ir
J Aging Res & Lifestyle 2023;12:93-99
Published online November 28, 2023, http://dx.doi.org/10.14283/jarlife.2023.16
Abstract
BACKGROUND: Aging affects physical, mental, and social functions, which can lead to an increase in frailty. Old adults with frailty syndrome are prone to disabilities and hospitalization. Lifestyle is a context-based factor that has the potential to prevent frailty.
OBJECTIVES: This study aimed to assess the relationship between lifestyle and frailty among Iranian community-dwelling older adults.
DESIGN, SETTING: This is a descriptive-analytical cross-sectional study. The participants were 513 older adults over 60 years by the convenience sampling method from the retirement center.
MEASUREMENTS: Data were collected using Tilberg’s frailty index, the Iranian elderly lifestyle questionnaire, and the Mini-Cog test. Data were analyzed with SPSS v.26 software by chi-square and logistic regression tests.
RESULTS: The age of the participants was 66.43 ± 4.69 years. The male-to-female sex ratio was 1.5 (39.2% women). The lifestyle of 96 (19.3%) old adults was unfavorable. 18.7 percent of older adults had Frailty syndrome. The logistic regression test showed that moderate and favorable lifestyle (OR= 0.06; 95% CI: 0.02-0.16), age over 75 years (OR= 5.25; 95% CI: 2.35-11.69), retired employment status (OR= 0.13; 95% CI: 0.29-0.05) are factors that have a significant relationship with frailty (P< 0.05).
CONCLUSION: The findings showed that lifestyle can predict frailty. Therefore, it seems that an optimal lifestyle can prevent the frailty of older adults.
Key words: Aged, life style, healthy lifestyle, frail elderly, frailty.
Introduction
Age-related changes adversely affect normal functions such as physical, psychological, and social functioning (1-3). Frailty syndrome is a set of defects that ultimately causes a decrease in physiological reserve capacities and fragility against stressful factors (4). The incidence of frailty varies among older adults. The prevalence of frailty syndrome varies between 0.4% and 59.1%, depending on the criteria. The prevalence of frailty in low and middle-income countries is around 18%, in high-income countries is 10% (5-8).
The prevalence of CI in Nigeria is less studied than in high income countries . In a survey of cognitive impairment among Yoruba speaking sample from Ibadan Nigeria, 152 (62%) out of 423 individuals studied were diagnosed with cognitive impairment no dementia (CIND) while 28 (6.61%) were diagnosed with dementia (7). In northern Nigeria (8), survey of 323 older adults showed dementia prevalence at 2.79% (CI 1– 4.58%) representing 66.67% of all the cases of dementia in the sample. In south-west Nigeria, 10.1% prevalence of probable dementia were found (9) using the 10 Word Delay Recall test adapted from Consortium to Establish a Registry for Alzheimer’s Disease CERAD (10) . In the North Central Nigeria, Ochayi and Thatcher (11) using the Community Screening Instrument for Dementia (CSID), showed a 6.4% overall prevalence of dementia and in south east Nigeria, 23.1% depression prevalence was shown in older adult sample with 20.7% complaining of forgetfulness (12).
Old adults with frailty syndrome are more vulnerable to health-related problems, including falls, delirium, fractures, disabilities, hospitalizations, and death (9-11). Frailty is associated with energy imbalance, sarcopenia, and reduced function and strengh (12). Some studies have shown that several risk factors can increase the incidence of frailty syndrome, including demographic characteristics (such as old age, female, low educational status, and unfavorable economic status), multiple chronic diseases, malnutrition, and insufficient physical activity, cognitive disorders, and poor function (13-16). Some of these factors are in the lifestyle field. Successful aging is the opposite of frailty, and a healthy lifestyle can predict successful aging (17). Lifestyle is related to the dimensions of nutrition, physical activity, sleep and daily patterns, so it is possible to improve the organs reserve and prevent vulnerability (18).
A person’s lifestyle includes physical, mental, and social domains (19, 20). World Health Organization (WHO) stated lifestyle is approximately 60% of the quality of life related to health (19). Lifestyle is defined in two levels macro (society) and micro (individual-level). The micro level refers to diet and physical activity, alcohol use, smoking, habits, choices, goals, and beliefs (21). The macro level refers to consumption behaviors, social support, social cohesion. People choose their own lifestyle and generally people’s behavior is the result of their choices in the available opportunities (22). The lifestyle is very culture-oriented and varies according to different societies. An unhealthy lifestyle is associated with an increase in mortality (23). It has been stated that a healthy lifestyle can reduce the death rate from chronic diseases by 50% (24).
Lifestyle is influenced by culture and environmental conditions (23, 25). On the other hand, a healthy lifestyle can predict successful aging. Therefore, it can be assumed that frailty maybe is influenced by lifestyle, and it is necessary to examine lifestyle in a context-based method. Lifestyle is a behavioral and situational framework in every person’s life. But first, it is necessary to assess these questions: Is lifestyle related to frailty? Can lifestyle affect frailty? This study cannot answer a comprehensive response to these questions, but it can be a start for future studies. So, this study aimed to assess the relationship between lifestyle and frailty among Iranian community-dwelling older adults.
Method
Design Study
This is a descriptive-analytical cross-sectional study. This is a pilot study. The research population was elderly people aged 60 and above from the retirement center of the Tehran University of Medical Sciences.
Sampling Method
The sampling method was convenient in this study. The sample size was calculated using the formula n= ![]() .
.
The prevalence of frailty is about 14.3% (26, 27). Z= 1.96 and d is considered to be 0.3. The sample size was 523 people. Five questionnaires were incomplete and five people were excluded from the study due to cognitive impairment. The sample size was 513 people.
Inclusion and exclusion criteria
The inclusion criteria included the willingness to participate in the study, and the ability to communicate, and the exclusion criteria included movement limitations, hearing and vision impairments, and cognitive disorders (according to Mini-Cog), incomplete questionnaire.
Measurements
Demographic characteristics
Demographic characteristics include age, sex, education, employment status (employed, retired, unemployed), the number of co-morbidities.
Tilburg Frailty Indicator (TFI)
Gobbens et al. developed TFI in 2010. TFI consists of two parts. Part A contains ten questions including age, sex, education and income, marital status, country of birth, types of Stressful Life Events in the past year, comorbidities, place satisfaction, and self-evaluation of living conditions. Part B refers to the main factors of frailty and includes fifteen questions that are divided into three physical, psychological, and social dimensions. Eleven questions are answered with two options (yes and no) and four questions with three options (yes, no, and sometimes). The physical dimension includes eight questions about physical health (physical function), unwanted weight loss, difficulty walking, difficulty maintaining balance, hearing impairment, visual impairment, reduction (lack of) strength in hands, and physical fatigue. The psychological dimension includes four questions related to cognitive status, depression, neurological symptoms, as well as coping with problems, and finally, the social dimension also includes three questions related to living alone, social relationships, and social support (28). The scoring of TFI is from zero to fifteen and the cut point is five. A score of five or more is considered to mean an elderly person is frail. Cronbach’s alpha was 0.81 in the Persian version of TFI and its validity has confirmed the existence of all three dimensions using the construct validity method. The accuracy of this index was 0.88. Its sensitivity and specificity in the point 4.5 cut-offs were obtained as 0.95 and 0.86 in a study by Mazzuchi et al. (2020) (29). Cronbach’s alpha was 0.71 in this study.
The Healthy lifestyle assessment questionnaire
The Healthy lifestyle assessment questionnaire was designed by Eshaghi et al. in 2007. This questionnaire contains 46 questions, which include fifteen questions about prevention, fourteen questions about healthy nutrition, five questions about stress management, seven questions about social and interpersonal relationships, and five questions about physical activity, exercise, recreation, and entertainment. The face and content validity has been confirmed and its Cronbach’s alpha was 0.76. The scoring of this questionnaire is done in the form of a Likert scale from one to five. The lowest score of the questionnaire is 42 and the highest score is 211. The total score is placed in one of three levels « undesirable, medium, and optimal». Score 42-98: undesirable lifestyle, score 99-155: medium lifestyle, and score 156-211: optimal lifestyle. This tool could be used in the Iranian elderly population due to its simplicity of sentences, as well as appropriate validity and reliability (30). Cronbach’s alpha was 0.97 in this study.
Mini-Cog test
The Mini-Cog test is a screening test used to identify people with cognitive disorders (31). The evaluation time is about three to five minutes (32). The older adult is taught to memorize three unrelated words together, and we ask him to repeat those three words. Then the clock-drawing test is assessed by drawing the clock. After that, we asked older adults those three words again. To calculate the score of this test, we will give one point for each correctly remembered word out of the three. If the older adults cannot remember the three words, they may have a cognitive disorder category (score = zero). Still, if they remember all three words correctly, they will be in the non-cognitive disorder category (score = 3). Older adults who only remember one or two words are divided into two groups based on the results of the clock drawing test: if the clock test is correct, the older adult is considered to have no cognitive impairment, but if his/her clock test was also impaired, then it means that he has a cognitive disorder (33). Rezaei et al. psychometrically evaluated Mini-Cog in Iranian older adults. Cronbach’s alpha was 0.83. Its sensitivity and specificity were 88% and 63%, respectively (34).
Ethical considerations
We confirm that this study was following the guidelines and regulations of the Declaration of Helsinki. This study was approved by the research ethics committee of the Tehran University of Medical Sciences (ref.: IR.TUMS.MEDICINE.REC.1400.638). We explained the objectives to the participants and obtained informed written consent.
Data analysis
Descriptive statistics were shown by frequency, mean, and standard deviation. Data were analyzed using chi-square tests and logistic regression. The normality of the data was also determined using the Kolmogorov-Smirnov test. Data were analyzed using SPSS v.26.
Results
The age of the participants was 66.43 ± 4.69 years. The participants included 201 (39.2%) women and 312 (60.8%) men. 96 old people (18.7%) have Frailty syndrome, and 99 people (19.3%) have an unfavorable lifestyle (other information is shown in Table 1).
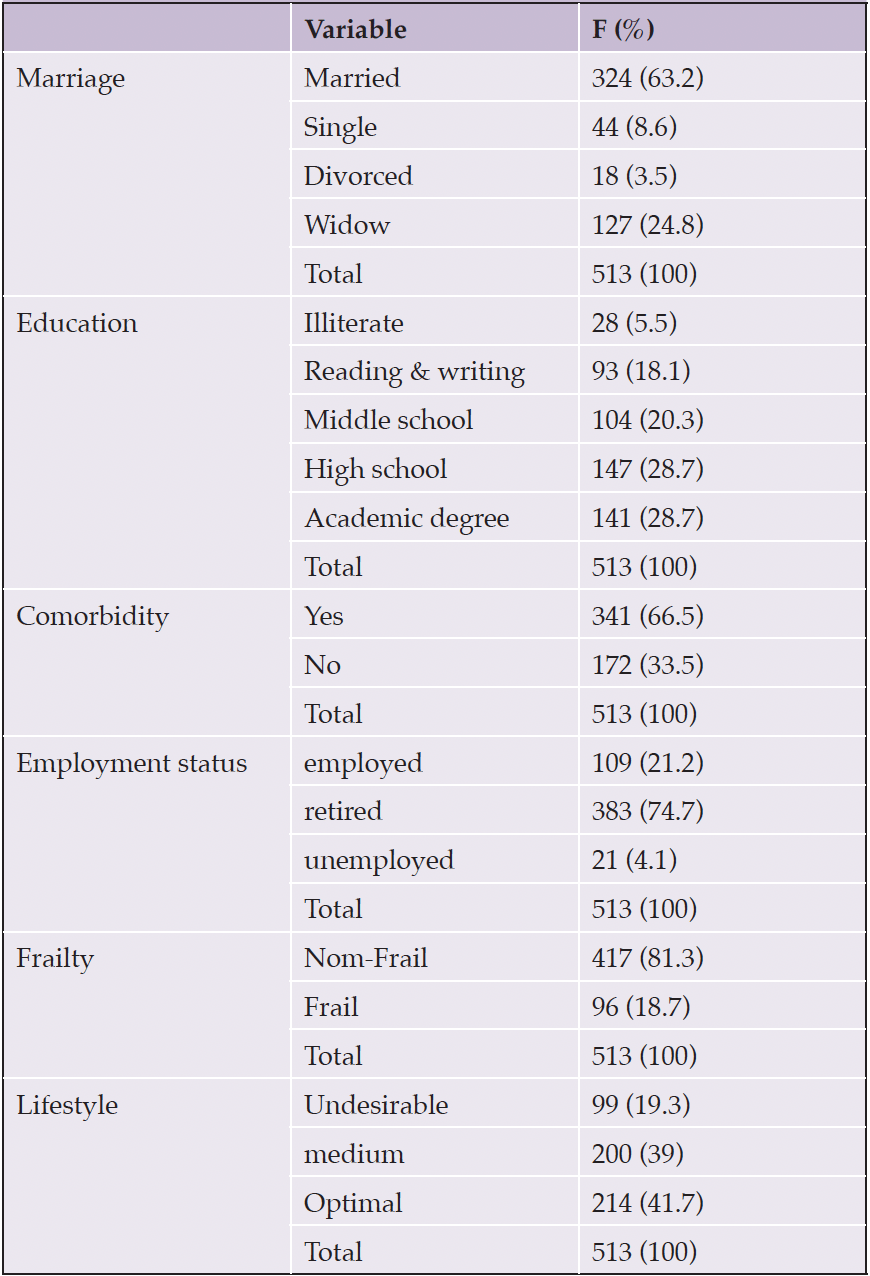
Table 1. Demographic characteristics of study participants
The average scores of frailty and lifestyle of the elderly in this study were 3.69 ± 2.579 and 146.15 ± 40.174, respectively. The Mean and standard deviation of their dimensions are shown in Table 2. The distribution was non-normal in all frailty and lifestyle subscales based on the Kolmogorov-Smirnov test (P< 0.01).
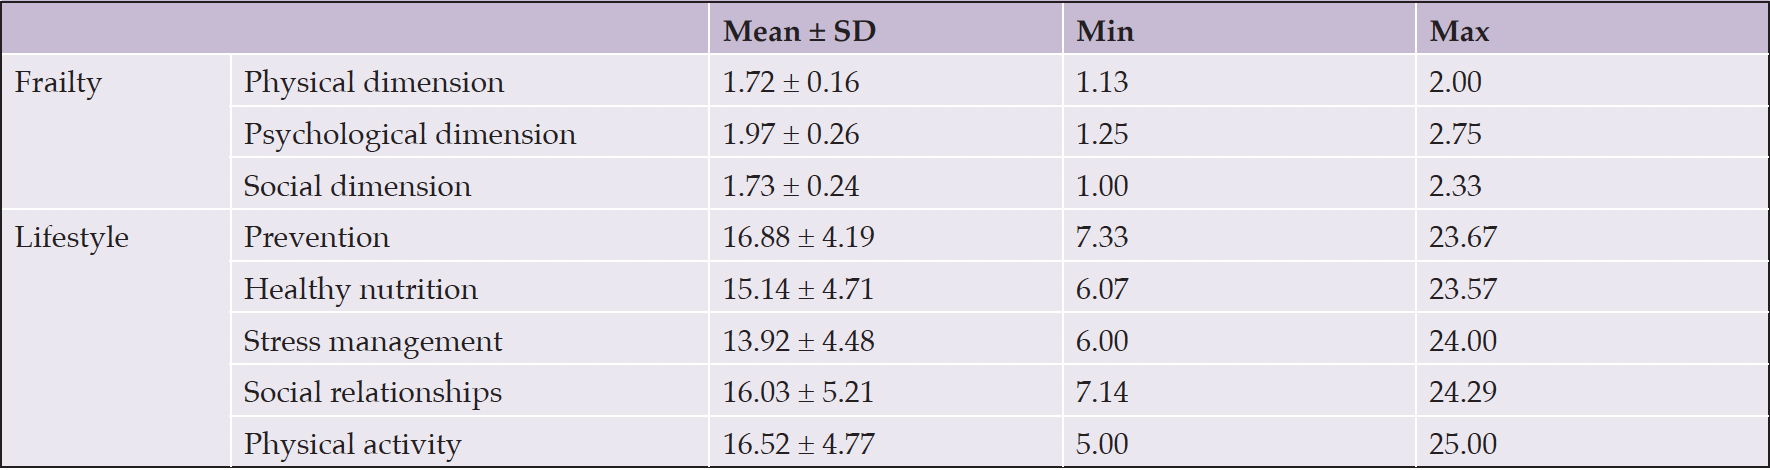
Table 2. Mean and standard deviation of frailty and lifestyle dimensions
The highest frailty was seen in over 75 years of age (30.1%), women (18.9%), single (61.4%), and illiterate (46.4%) (Table 3).
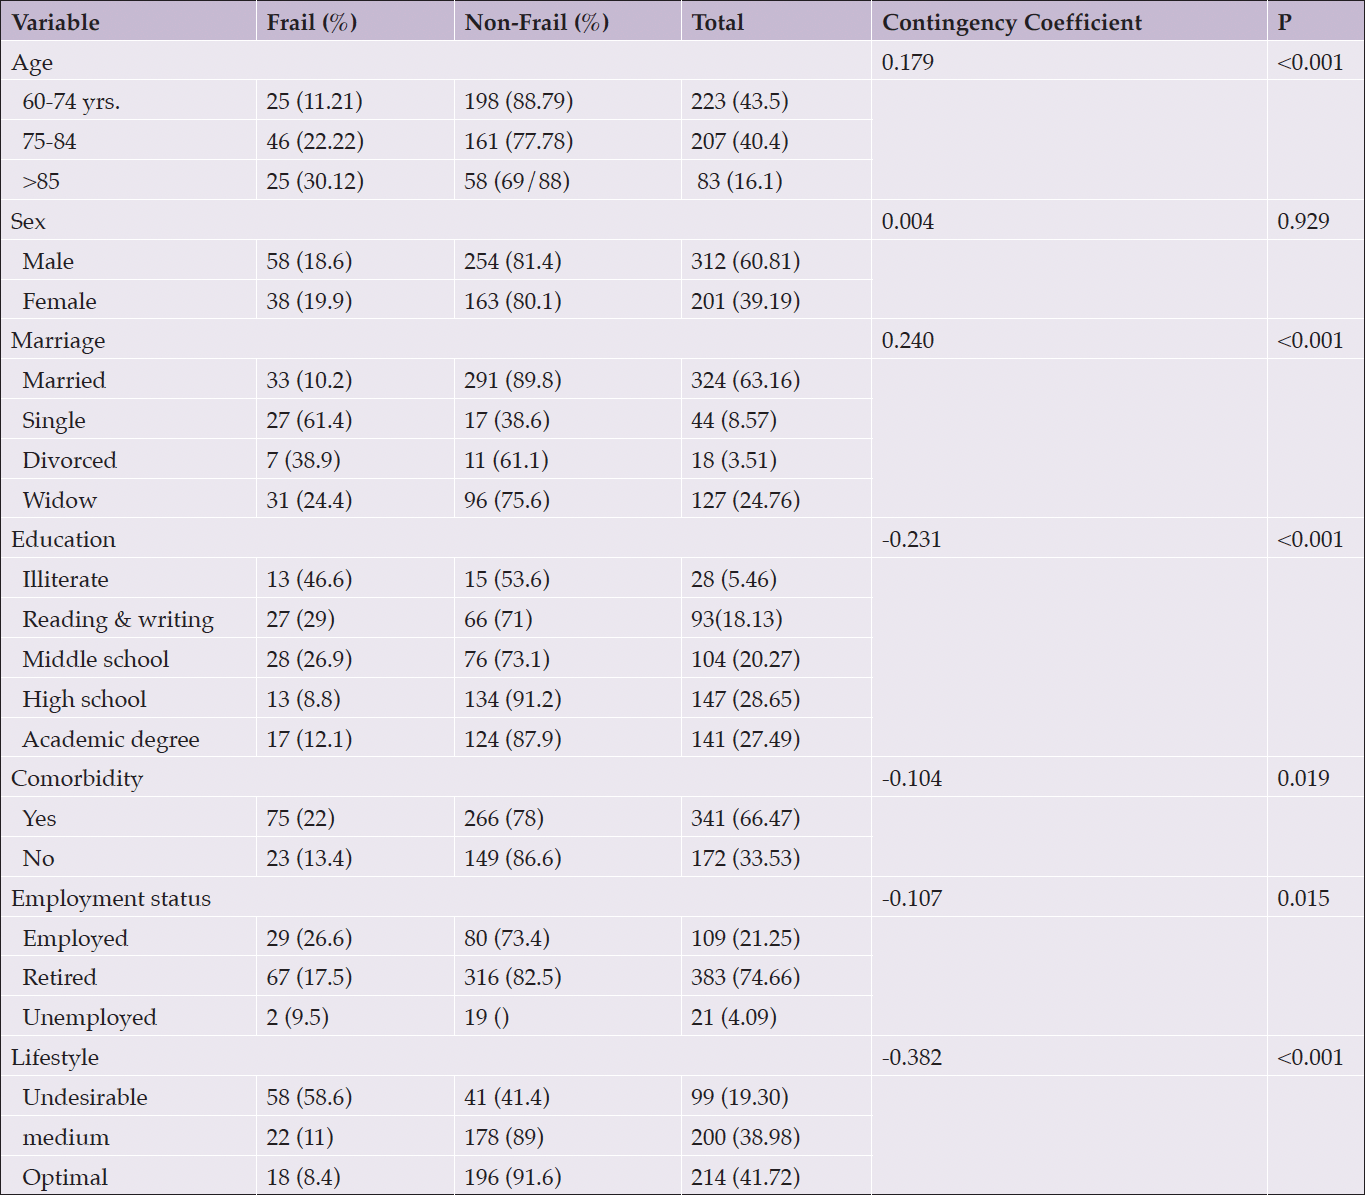
Table 3. Frequency of frailty based on demographic characteristics
The results of the logistic regression showed that lifestyle, age, employment status are factors that have a significant relationship with frailty (Table 4). Above 75 years of age is a risk factor for frailty (OR= 5.25; 95% CI: 2.35-11.69). A medium and optimal lifestyle (OR= 0.06; 95% CI: 0.02-0.16), retired employment status (OR= 0.13; 95% CI: 0.05-0.29) were protective factors. The result of the Hosmer and Lemeshow Test was (P= 0.35).
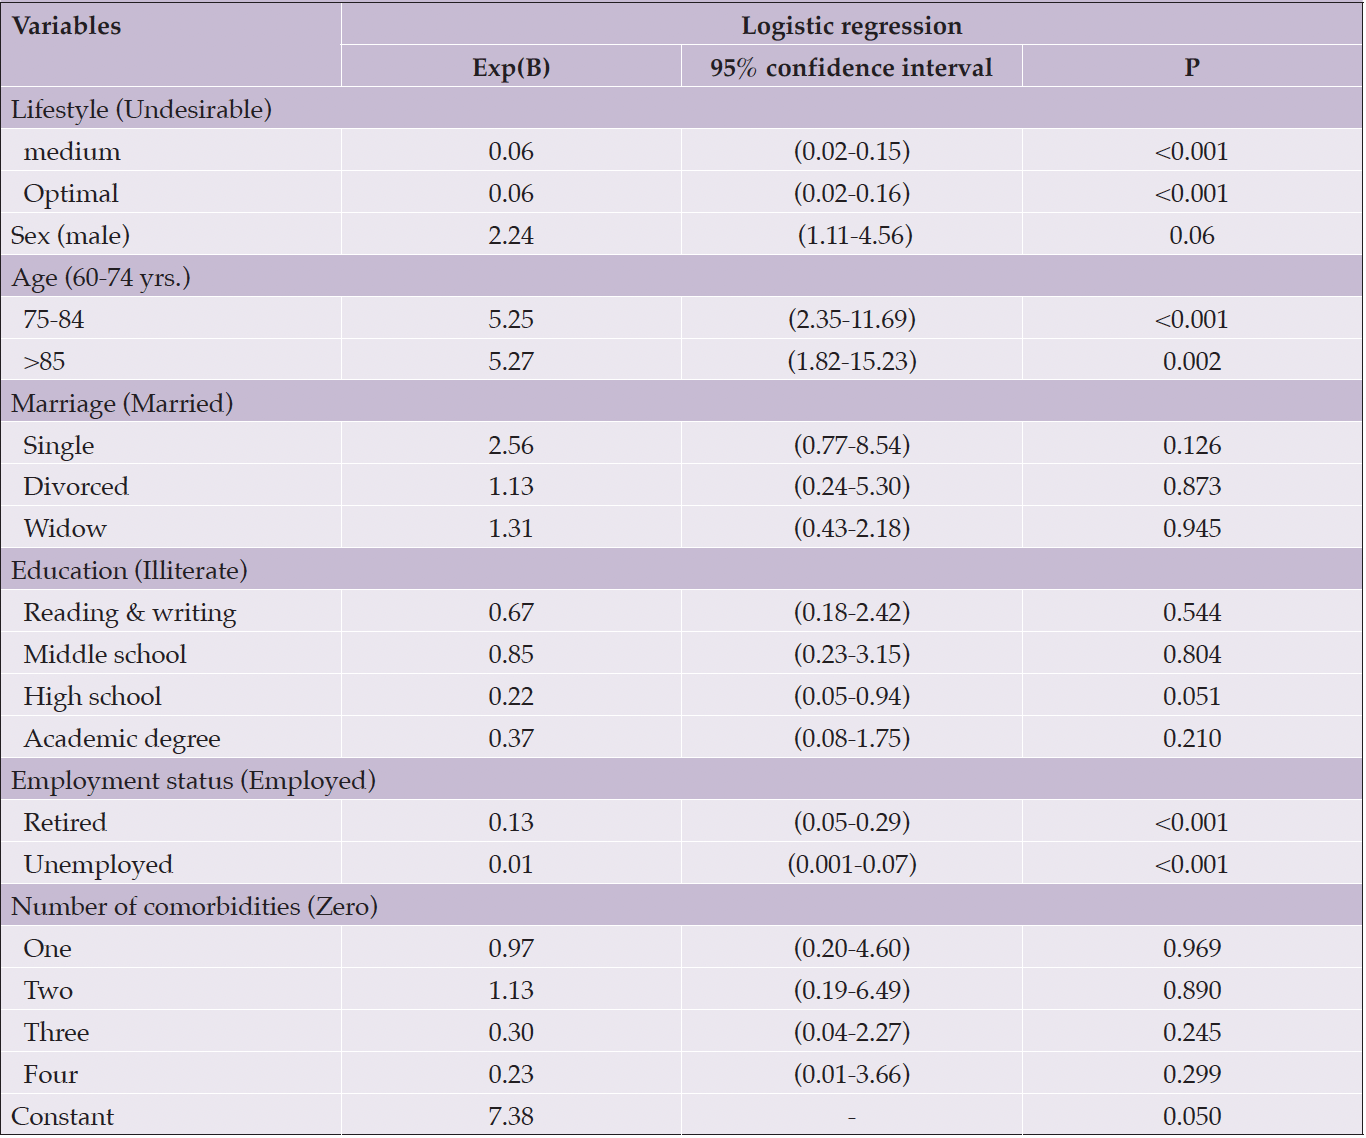
Table 4. Logistic regression of frailty and related factors
Discussion
This study showed that 18.7% of the old participants had frailty. The findings showed that there is a significant relationship between frailty syndrome and lifestyle. An optimal lifestyle is associated with a decrease in the frailty of old people.
The prevalence of frailty in other studies was estimated as 14.3% to 33.4% (35, 36). A study found that the prevalence of frailty was about 24% among community-dwelling older adults (37). Many reasons can explain these differences in the studies. The first reason is the different frailty measurement tools because each of these tools can measure various components of frailty and even focus on a series of specific dimensions of frailty. Also, this difference could be the sampling method. The second reason is the statistical population; if nursing homes or hospitals are selected for sampling, we will likely see a higher prevalence of frailty.
Participants who had an optimal lifestyle were less likely to suffer from frailty syndrome, optimal lifestyle can be one of the protective factors to prevent this syndrome. For example, an old person who does not comply with risk prevention and personal hygiene or does not have a proper diet, or does not have enough daily physical activity, has a high chance of suffering from frailty. On the contrary, those who have an optimal lifestyle, that is, follow health and preventive measures well, have proper nutrition and physical activity, and have good psychological and social conditions, are less likely to get frailty syndrome. Gobens et al. concluded that lifestyle cannot predict frailty (38). the results of the research by Khodamoradi et al. show the existence of modifiable risk factors such as obesity and insufficient physical activity, which are important. It is necessary to use appropriate strategies to prevent frailty, due to the complications and high costs of frailty.
Katayama et al. found that elderly with physical frailty have reduced any activity in their lifestyle including social activities, physical and cognitive activities. Older adults with frailty showed a significant relationship with fewer activity patterns compared to non-frail elderly. Katayama et al stated that frail elderly suffer from disturbances in activity patterns (19).
Abe et al found that it was seen with a lower probability of frailty and its related consequences in participants who did agriculture, sports, activity, and social participation (39). The results of Wang et al.’s study also indicated that participation in social activities was less among people who were frail than non-frail old people. In addition, frailty risk decreased with a healthy diet in old age (40).
This study showed that there is a significant relationship between age and frailty. People with frailty in this study are generally in the age range of 60 to 75 years. The highest prevalence of frailty is seen in people over 75 years old. We can conclude that physical and mental capacities decrease with aging and the possibility of suffering from frailty syndrome increases (41-43).
This study showed that there is no significant difference in frailty between women and men. Some studies have stated that the prevalence of frailty is higher in women (5, 44, 45), and some studies found that frailty is higher in men than women (43, 46). On the other hand, some studies showed that there is no significant relationship between gender and frailty (41, 47, 48). Demographic and community differences can partially explain these variable results.
The frequency of frail old people in retirees was higher than in other employment statuses, but this is due to the larger number of people in this category. The highest percentage of frailty is in the employed category. Employed elderly probably have jobs that are not suitable for their physical and mental conditions due to their financial needs. Unsuitable working conditions can put the elderly under all kinds of physical and mental pressures, and as a result, put them in conditions where they are prone to or suffer from frailty syndrome. Previous studies had found that there is a significant relationship between employment status and frailty, they found that the employed elderly have the least frailty, and this disparity could be due to the difference in people’s jobs or volunteer activities (26, 49).
Conclusion
According to the results of this study, the prevalence of frailty was 18.7%. Lifestyle is related to all physical, mental, and social aspects of people. The state of frailty, especially in the elderly, is directly related to lifestyle. Probably, frailty is reduced by improving lifestyle.
Limitations
This study coincided with the covid-19 epidemic, which led to reduced cooperation of participants, which may have affected the data and results. This is a pilot study and it is necessary to conduct it in the future in a larger and more diverse population. It would have been better to separate the lifestyle dimensions, but the Healthy lifestyle assessment questionnaire did not have this possibility.
Acknowledgments: We are grateful to the participants and staff of the Tehran University of Medical Sciences Retired Center who helped us in this study.
Conflicts of interest and source of funding: The authors declare that they have no conflicts of interest. There was no specific funding for this study.
Ethical standard: We confirm that this study was following the guidelines and regulations of the Declaration of Helsinki. This study was approved by the research ethics committee of the Tehran University of Medical Sciences (ref.: IR.TUMS.MEDICINE.REC.1400.638). We explained the objectives to the participants and obtained informed written consent.
Open Access: This article is distributed under the terms of the Creative Commons Attribution 4.0 International License (http://creativecommons.org/licenses/by/4.0/), which permits use, duplication, adaptation, distribution and reproduction in any medium or format, as long as you give appropriate credit to the original author(s) and the source, provide a link to the Creative Commons license and indicate if changes were made.
References
1. Limón Mendizabal MR. Envejecimiento activo: un cambio de paradigma sobre el envejecimiento y la vejez / Active Aging: a change of paradigm on aging and old age. Aula Abierta. 2018;47(1):45-54.
2. Machado Cuétara RL, Bazán Machado MA, Izaguirre Bordelois M. Principales factores de riesgo asociados a las caídas en ancianos del área de salud Guanabo. MEDISAN. 2014;18(2):158-64.
3. Velasco Rodríguez R, Bejines Soto M, Sánchez Gutiérrez R, Mora Brambila AB, Benítez Guerrero V, García Ortiz L. Aging and functional capacity in elderly home care of west of Mexico. NURE Investigación. 2015;12(74):1-11.
4. Sacha J, Sacha M, Soboń J, Borysiuk Z, Feusette P. Is It Time to Begin a Public Campaign Concerning Frailty and Pre-frailty? A Review Article. Frontiers in Physiology. 2017;8.
5. Collard RM, Boter H, Schoevers RA, Oude Voshaar RC. Prevalence of frailty in community-dwelling older persons: a systematic review. J Am Geriatr Soc. 2012;60(8):1487-92.
6. Ofori-Asenso R, Chin KL, Mazidi M, Zomer E, Ilomaki J, Zullo AR, et al. Global Incidence of Frailty and Prefrailty Among Community-Dwelling Older Adults: A Systematic Review and Meta-analysis. JAMA Netw Open. 2019;2(8):e198398.
7. Pengpid S, Peltzer K. Prevalence and Associated Factors of Frailty in Community-Dwelling Older Adults in Indonesia, 2014-2015. 2019;17(1).
8. Siriwardhana DD, Hardoon S, Rait G, Weerasinghe MC, Walters KR. Prevalence of frailty and prefrailty among community-dwelling older adults in low-income and middle-income countries: a systematic review and meta-analysis. 2018;8(3):e018195.
9. Chamberlain AM, Finney Rutten LJ, Manemann SM, Yawn BP, Jacobson DJ, Fan C, et al. Frailty Trajectories in an Elderly Population-Based Cohort. J Am Geriatr Soc. 2016;64(2):285-92.
10. Koyama S, Katata H, Ishiyama D, Komatsu T, Fujimoto J, Suzuki M, et al. Preadmission frailty status as a powerful predictor of dependency after discharge among hospitalized older patients: A clinical-based prospective study. 2018;18(12):1609-13.
11. Ofori-Asenso R, Chin KL, Sahle BW. Frailty Confers High Mortality Risk across Different Populations: Evidence from an Overview of Systematic Reviews and Meta-Analyses. 2020;5(1).
12. Xue QL. The frailty syndrome: definition and natural history. Clinics in geriatric medicine. 2011;27(1):1-15.
13. Etman A, Burdorf A, Van der Cammen TJ, Mackenbach JP, Van Lenthe FJ. Socio-demographic determinants of worsening in frailty among community-dwelling older people in 11 European countries. Journal of epidemiology and community health. 2012;66(12):1116-21.
14. Robertson DA, Savva GM, Kenny RA. Frailty and cognitive impairment–a review of the evidence and causal mechanisms. Ageing research reviews. 2013;12(4):840-51.
15. Sánchez-García S, Sánchez-Arenas R, García-Peña C, Rosas-Carrasco O, Avila-Funes JA, Ruiz-Arregui L, et al. Frailty among community-dwelling elderly Mexican people: prevalence and association with sociodemographic characteristics, health state and the use of health services. Geriatrics & gerontology international. 2014;14(2):395-402.
16. Sathasivam J, Kamaruzzaman SB, Hairi F, Ng CW, Chinna K. Frail Elders in an Urban District Setting in Malaysia: Multidimensional Frailty and Its Correlates. Asia-Pacific journal of public health. 2015;27(8 Suppl):52s-61s.
17. Bosnes I, Nordahl HM, Stordal E, Bosnes O, Myklebust TÅ, Almkvist O. Lifestyle predictors of successful aging: A 20-year prospective HUNT study. PLOS ONE. 2019;14(7):e0219200.
18. Kassis A, Fichot M-C, Horcajada M-N, Horstman AMH, Duncan P, Bergonzelli G, et al. Nutritional and lifestyle management of the aging journey: A narrative review. Frontiers in Nutrition. 2023;9.
19. Katayama O, Lee S, Bae S, Makino K, Shinkai Y, Chiba I, et al. Lifestyle Activity Patterns Related to Physical Frailty and Cognitive Impairment in Urban Community-Dwelling Older Adults in Japan. Journal of the American Medical Directors Association. 2021;22(3):583-9.
20. Shinohara T, Saida K, Tanaka S, Murayama A. Association between frailty and changes in lifestyle and physical or psychological conditions among older adults affected by the coronavirus disease 2019 countermeasures in Japan. Geriatrics & gerontology international. 2021;21(1):39-42.
21. Beard JR, Officer A, de Carvalho IA, Sadana R, Pot AM, Michel JP, et al. The World report on ageing and health: a policy framework for healthy ageing. Lancet (London, England). 2016;387(10033):2145-54.
22. Ghasemi Yngyknd S, Asghari Jafarabadi M, Ghanbari-Homayi S, Laghousi D, Mirghafourvand M. A systematic review of social determinants of healthy lifestyle among Iranian women. 2021;8(5):2007-17.
23. Jensen M. Defining lifestyle. Environmental Sciences. 2007;4(2):63-73.
24. Fallah Mehrabadi E, Pakgohar M, Asadi S, Haghani H. Lifestyle of Elderly People With Osteoporosis and Its Related Factors. Salmand: Iranian Journal of Ageing. 2017;12(2):132-45.
25. Melnyk BM, Amaya M, Szalacha LA, Hoying J. Relationships Among Perceived Wellness Culture, Healthy Lifestyle Beliefs, and Healthy Behaviors in University Faculty and Staff:Implications for Practice and Future Research. Western Journal of Nursing Research. 2016;38(3):308-24.
26. Delbari A, Zanjari N, Momtaz YA, Rahim F, Saeidimehr S. Prevalence of frailty and associated socio-demographic factors among community-dwelling older people in southwestern Iran: a cross-sectional study. Journal of Diabetes & Metabolic Disorders. 2021;20(1):601-10.
27. Shohani M, Mohammadi I, Seidkhani H, Mohamadnejad S. The prevalence of frailty and its associated factors among Iranian hospitalized older adults. Nursing and Midwifery Studies. 2022;11(3):215-20.
28. Gobbens RJ, van Assen MA, Luijkx KG, Wijnen-Sponselee MT, Schols JM. The Tilburg Frailty Indicator: psychometric properties. Journal of the American Medical Directors Association. 2010;11(5):344-55.
29. Mazoochi F, Gobbens RJJ, Lotfi MS, Fadayevatan R. Diagnostic accuracy of the Tilburg Frailty Indicator (TFI) for early frailty detection in elderly people in Iran. Archives of gerontology and geriatrics. 2020;91:104187.
30. Seyed Reza Eshaghi, Ziba Farajzadegan, Anahita Babak. Healty lifestyle assessment questionnaire in elderly: translation, reliability and validity. Payesh (Health Monitor) Journal. 2010;9(1):91-9.
31. Yang L, Yan J, Jin X, Jin Y, Yu W, Xu S, et al. Estimation of diagnostic performance of dementia screening tests: Mini-Mental State Examination, Mini-Cog, Clock Drawing test and Ascertain Dementia 8 questionnaire. Aging Ment Health. 2018;22(8):942-6.
32. Li X, Dai J, Zhao S, Liu W, Li H. Comparison of the value of Mini-Cog and MMSE screening in the rapid identification of Chinese outpatients with mild cognitive impairment. Medicine (Baltimore). 2018;97(22):e10966.
33. Carolan Doerflinger DM. How To Try This: The Mini-Cog. AJN The American Journal of Nursing. 2007;107(12):62-71.
34. Rezaei M, Rashedi V, Lotfi G, Shirinbayan P, Foroughan M. Psychometric Properties of the Persian Adaptation of Mini-Cog Test in Iranian Older Adults. International journal of aging & human development. 2018;86(3):266-80.
35. Hosseini SR, Bijani A, Mouodi S, Ghadimi R, Bijani A. Frailty Syndrome in Older Adults and Related Sociodemographic Factors in the North of Iran: A Population-Based Study. Iranian Red Crescent Medical Journal. 2021;23(1):2-6.
36. Saeidimehr S, Delbari A, Zanjari N, Fadaye Vatan R. Factors Related to Frailty Among Older Adults in Khuzestan, Iran. Salmand: Iranian Journal of Ageing. 2021;16(2):202-17.
37. Rajini RS, Gour R. A Community based Cross Sectional Study on Frailty and its Correlates among Elderly Population of Puducherry. Annals of the Romanian Society for Cell Biology. 2021;25(2):1619-45.
38. Gobbens RJ, van Assen MA. Explaining frailty by lifestyle. Archives of gerontology and geriatrics. 2016;66:49-53.
39. Abe T, Nofuji Y, Seino S, Murayama H, Yoshida Y, Tanigaki T, et al. Healthy lifestyle behaviors and transitions in frailty status among independent community-dwelling older adults: The Yabu cohort study. Maturitas. 2020;136:54-9.
40. Wang X, Lu Y, Li C, Larbi A, Feng L, Shen Q, et al. Associations of lifestyle activities and a heathy diet with frailty in old age: a community-based study in Singapore. Aging. 2020;12(1):288-308.
41. Arakawa Martins B, Visvanathan R, Barrie H, Huang CH, Matsushita E, Okada K, et al. Frailty prevalence using Frailty Index, associated factors and level of agreement among frailty tools in a cohort of Japanese older adults. Archives of gerontology and geriatrics. 2019;84:103908.
42. Gobbens RJJ, van Assen M. Associations between multidimensional frailty and quality of life among Dutch older people. Archives of gerontology and geriatrics. 2017;73:69-76.
43. Jafarian Yazdi A, Pashaee Sabet F, Farokhnezhad Afshar P. The relationship between Frailty and Quality of life in hospitalized old patient. Journal of Gerontology. 2022;7(2):1-8.
44. Khamis R, Sabbah H, Sabbah S, Peters L, Droubi N, Sabbah I. Evaluating the psychometric properties of the Arabic version of the Groningen Frailty Indicator among Lebanese elderly people. The Journal of the Egyptian Public Health Association. 2019;94(1):28.
45. Thompson MQ, Theou O, Karnon J, Adams RJ, Visvanathan R. Frailty prevalence in Australia: Findings from four pooled Australian cohort studies. Australasian journal on ageing. 2018;37(2):155-8.
46. Jafarian Yazdi A, Pashaii sabet F, Moosavi arfa N, Hasani MM. Prevalence of frailty and factors associated with frailty in the hospitalized elderly. Iranian Journal of Nursing Research. 2021;16(1):1-9.
47. Çakmur H. Frailty among elderly adults in a rural area of Turkey. Medical science monitor : international medical journal of experimental and clinical research. 2015;21:1232-42.
48. Vaingankar JA, Chong SA, Abdin E, Picco L, Chua BY, Shafie S, et al. Prevalence of frailty and its association with sociodemographic and clinical characteristics, and resource utilization in a population of Singaporean older adults. Geriatrics & gerontology international. 2017;17(10):1444-54.
49. asadi h, habibi soola a, iranpour s. Prevalence of Frailty and Related Factors in the Elderly Referred to the Emergency Department of Ardabil Medical Education Centers in 2020. Journal of Gerontology. 2021;6(2):64-76.
© The Authors 2023