
A.M. Nelson1, S.L. Casperson1, L. Jahns1,2, D.G. Palmer1, J.N. Roemmich1
1. USDA, Agriculture Research Service, Grand Forks Human Nutrition Research Center; 2. USDA, National Institute of Food and Agriculture
Corresponding Author: Alese M. Nelson, Grand Forks Human Nutrition Research Center, 2420 2nd Ave. North, Grand Forks, ND 58203, USA.
Email: alese.nelson@usda.gov, https://orcid.org/0000-0002-3848-0228
J Aging Res & Lifestyle 2022;11:20-25
Published online July 1, 2022, http://dx.doi.org/10.14283/jarlife.2022.4
Abstract
Objective: The purpose of this longitudinal, observational study was to examine whether age and seasonal changes in sedentary activity (sedAct), moderate-to-vigorous physical activity (MVPA), and energy intake (EI) predict changes in body composition among midlife women. We hypothesized that reductions in MVPA and increases in sedAct and EI in winter, along with greater baseline age would predict increases in percentage body fat (%BF) across seasons. Design: This study used a longitudinal, within-subjects design. Setting: This study took place in Grand Forks, North Dakota. Participants: Participants included 52 midlife women (aged 40-60 years) who were observed over the course of one year. Measurements: Percentage body fat measures were obtained via whole body Dual Energy X-ray absorptiometry. Participants were scanned once per season. We measured EI using the ASA24®. We used a GTX3 accelerometer to measure physical activity. Each season, participants wore the monitors for 7 days, 12 hours per day. All measures began in summer. Results: Results of hierarchical multiple regression (MR) analyses showed that age increases (β = 0.310, p = 0.021) and summer-to-fall increases in EI (β = 0.427, p = 0.002) predicted seasonal increases in %BF (R2 = .36, F(5, 42) = 4.66, p = 0.02). Changes in MVPA and sedAct were not significant predictors. Repeated measures ANCOVA revealed that summer (M = 37.7263, 95% CI [35.8377, 39.6149]) to winter (M = 38.1463, 95% CI [36.1983, 40.0942]) increases in %BF are not reversed by spring (M = 37.8761, 95% CI [35.9365, 39.8157]). Conclusions: To minimize increases in %BF and maintain health, midlife women, particularly older women, should be encouraged to pay extra attention to their diet in the fall months.
Key words: Physical activity, energy intake, age, body composition.
Introduction
Approximately 76% of US women have overweight (body mass index (BMI) ≥ 25) or obesity (BMI ≥ 30; 1). The greatest prevalence of obesity is among women aged 40 years and older, with 43.3% classified as obese (2). Obesity is associated with greater risk for heart disease, diabetes, and some cancers (3-6). Women with obesity have a greater risk of type 2 diabetes than men (7), and the risk of diabetes increases with age (8). As such, understanding factors that contribute to greater rates of obesity in midlife women is crucial.
Age is positively correlated with weight gain in women (9, 10). This is true even when exercise remains constant (10). Weight gain is especially prevalent in women who are midlife and of menopausal age (11); however, changes in body composition (e.g., increases in body fat (12) and visceral fat (13) can occur even in the absences of weight gain (12). While this may be partly due to biological changes with aging (13), it is important to examine additional predictors that could be exacerbating midlife weight gain.
Weight gain may be more likely during certain seasons due to alterations in usual eating and physical activity. Indeed, diet, physical activity, and body weight change with season (14-16). Over the course of a year, American adults consumed more energy (kcal) per day in fall relative to spring (14). Physical activity (PA) differs across seasons as well; PA is lowest (14, 15, 17-19) and sedentary activity (sedAct) is greatest (17, 20) during winter relative to the other seasons. Weather is likely to drive physical activity changes, with conditions such as snowfall (21) and extreme weather (19) being frequently cited as barriers to engaging in physical activity. Another contributing factor to physical activity changes may be daylight; women who experience more than 14 hours of daylight engage in more moderate-to-vigorous physical activity (MVPA) than women who live in an area that is receiving less than 10 hours of daylight (22). As a result, body weight is greatest in winter (14). A study of Mexican American women reported similar findings; women gained the most weight in fall (15). Fall-winter weight gain presents a risk for gradual increases in body weight during adulthood as weight gained is not lost during spring and summer (23).
The purpose of the present secondary analysis of a longitudinal, observational study was to examine whether age and changes in sedAct, MVPA, and energy intake (EI) across seasons predict changes in body composition among midlife women. We hypothesized that reductions in MVPA and increases in sedAct, and EI in winter, along with greater baseline age would predict increases in %BF from summer to spring. As secondary aims, we investigated the changes in each of the predictor variables across seasons. As these data were derived in a location where the spring months can be as intemperate as winter months, we hypothesized that there would be greater levels of EI and sedAct in winter and spring relative to summer and fall. We also hypothesized that MVPA would be lower in winter and spring relative to summer and fall.
Methods
Participants
The study was completed by a total of 52 ambulatory women ranging in age from 40-60 years as previously reported (16, 24-26). Women were non-overweight, overweight, or obese as classified by BMI ranging from 18-35 kg/m2. Most women were menopausal at the beginning of the study (N = 27), as measured by follicle-stimulating hormone (FSH) levels of 25.8 mIU/mL or greater, with 5 additional participants reaching menopausal status by winter. FSH measurement methods have been previously described (25, 26).
Participants were required to have stable weight, defined as fluctuation not exceeding ±4.5 kg for at least 6 months prior to the beginning of the study. Women were excluded from the study if they were smokers, pregnant or lactating, or had health conditions that would limit their physical activity. Furthermore, women who took medications that could potentially influence weight/appetite were excluded. Participants were asked to refrain from engaging in intentional changes in diet or physical activity while the study was in progress.
Participants were recruited from the Grand Forks, North Dakota area through advertising throughout the community. This study was reviewed and approved by the University of North Dakota Institutional Review Board and registered with ClinicalTrials.gov (#NCT01674296). Informed consent was documented prior to the beginning of the study.
Materials and Measures
Body Composition
Percentage body fat (%BF) was estimated with whole body Dual Energy X-ray Absorptiometry (DXA, GE Lunar, Madison, WI, enCORE Software Version 13.60.033). The instrument was calibrated before each session using the manufacturer’s calibration phantom. For the 248 calibrations over the 21 months of the study, mean calibration %BF was 60.53% with a standard deviation of 0.01 and a coefficient of variation of 0.016% body fat. All calibration results were within the tolerance limits recommended by the manufacturer. Participants were scanned wearing light clothing or scrubs. Analysis was conducted using iDXA proprietary software.
Energy Intake
EI, defined as mean calories reported consumed across each season, was derived using the National Cancer Institute’s Automated Self-Administered 24-hour Dietary Recall (27). The ASA24® is an online measure in which participants self-report the food that they have consumed over the last 24 hours, including all meals, snacks, and drinks. From these data, outcomes such as total intake of energy, carbohydrates, fat, and protein are calculated. Participants completed the ASA24® 36 times throughout the study, each completion spaced approximately 10 days apart.
Physical Activity
We measured physical activity using a GTX3 accelerometer (ActiGraph Corp., Pensacola, FL USA). Each season, participants wore the monitors at the hip for 7 consecutive days, 12 hours per day. Data were cleaned to remove non-wearing data (i.e., periods during which consecutive zeros were recorded for 20 min). Epochs of 15s were used for data collection. From this, we calculated total minutes of sedAct and MVPA for each season using the Crouter, Kuffel (28) algorithm and Freedson cut-points (29).
Procedures
The present study had two cohorts; the first began in July of 2012, the second began in July of 2013. Participants visited the Research Center weekly. For the purposes of this study, we defined seasons as summer (June, July, August), fall (September, October, November), winter (December, January, February), and spring (March, April, May). All visits were conducted in the middle month of each season (i.e., July, October, January, and April).
While the visits to the Research Center were otherwise identical, the participants’ very first visit, Day 0 of the summer visit, had two unique components that occurred only at the first visit: (1) participants signed an informed consent document and (2) participants were trained during this visit on how to wear accelerometers.
On Day 0 of each season, participants came to the Research Center after a 12 h fast to complete the DXA body scan, along with other tests including completing a series of online questionnaires. The additional Day 0 tests are described in previous publications (24, 25). Before leaving the Research Center, participants were given their physical activity monitors and instructed to wear them 12 hours per day for the following 7 days. On Day 8, participants returned the physical activity monitors to the Research Center.
Statistical Analysis
To determine whether there were changes in %BF across seasons, a multivariate repeated measures analysis of covariance (ANCOVA) was conducted with season as the repeated measure and age as the continuous covariate. Due to a violation of the sphericity assumption of compound symmetry, we used Greenhouse-Geisser corrected p values in the ANCOVA tables. For pairwise multiple comparisons of least squares means of age by season, we used Tukey-Kramer adjusted p values. We calculated difference scores for %BF, EI, sedAct, and MVPA between summer and fall, winter, and spring. We then mean-centered these scores for regression analyses. A significance level of ∝ = 0.05 was chosen a priori to determine significant p values. We used SAS 9.4 TS1M7 for these analyses.
We used 3 hierarchical multiple regression/correlation (MRC) models to predict summer to spring Δ%BF. In each model, age was placed in Step 1 to serve as the variable to be controlled because it was a salient predictor of Δ%BF, and all other predictors were placed in Step 2. Model 1 measured summer-fall difference scores for sedAct, MVPA, and EI. Model 2 measured summer-winter difference scores for sedAct, MVPA, and EI. Model 3 measured summer-spring difference scores for sedAct, MVPA, and EI. As secondary analyses, we used repeated measures ANOVA to investigate whether there were seasonal changes in sedAct and MVPA; one person was excluded from this analysis due to incomplete data. We used bivariate correlational analyses to further assess the relationships between the predictors and Δ%BF across seasons, as well as FSH and %BF/Δ%BF. We used SPSS Version 27.0 for these analyses.
Results
Primary Outcomes
There was a significant season by age interaction for %BF, F(1.93, 94.53) = 4.09, p = .021. No pairwise comparisons were statistically significant. Most (60%) participants experienced increases in %BF from summer (M = 37.7263, 95% CI [35.8377, 39.6149]) to winter (M = 38.1463, 95% CI [36.1983, 40.0942]). Summer to winter increases in %BF (ΔM = 0.4200, adjusted 95% CI [-0.1669, 1.0069]) were not reversed by spring (ΔM = -0.2702, adjusted 95% CI [-0.7754, 0.2350]). These %BF increases were not reversed by spring in 30% of the sample that were younger than the mean age of 49 years (i.e., 3 of the 10 people younger than 49 years who gained %BF,), whereas 37% the women who were older than 49 years (i.e., 7 of the 19 people over the age of 49 who gained %BF from summer to winter) did not reverse increases in %BF by the following spring. Age in the between-subjects table yielded a test statistic of F(1, 49) =3.77, p = .058. See Table 1 for means and standard deviations and Table 2 for frequencies of season-to-season changes for primary predictors.
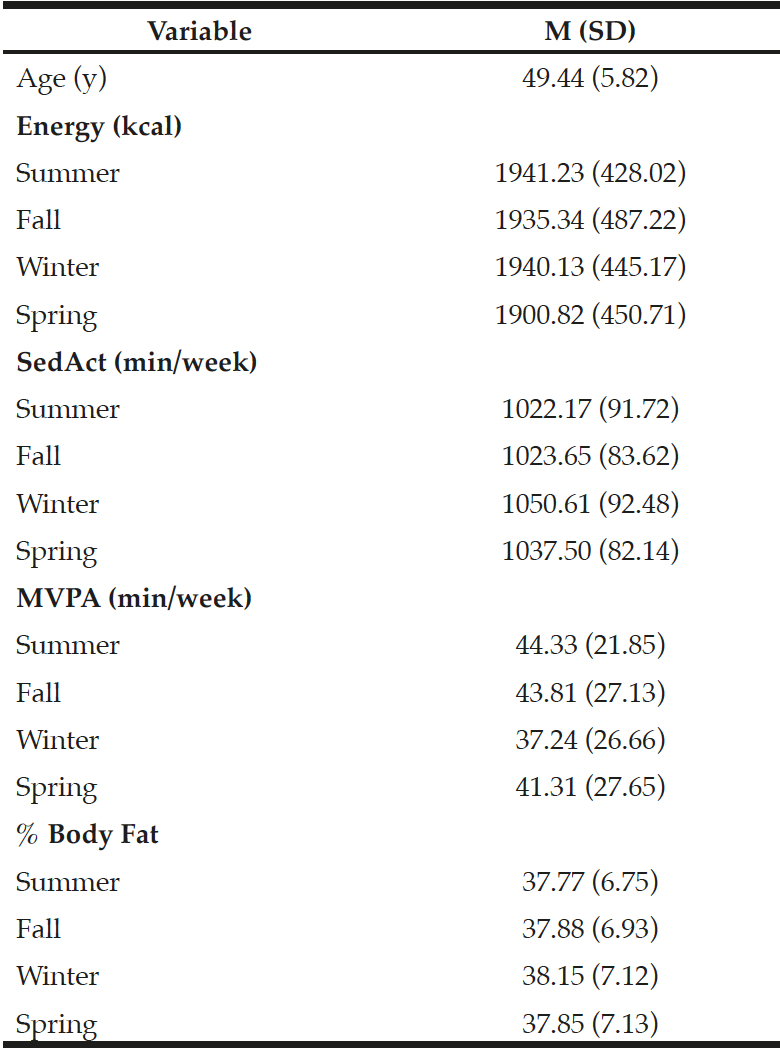
Table 1
Means and Standard Deviations for Regression
Predictors
Note: Age represents baseline age.
Table 2
Frequencies for Seasonal Changes in Primary Predictors
Note: D/NC represents the number of participants whose measured units decreased or did not change from season to season. I represents the number of participants whose measured units increased at least 5% from season to season.
Hierarchical MRC model 1 predicted Δ%BF, R2 = .25, F(4, 47) = 3.89, p = .008. Age was a significant predictor in Step 1, R2 = .12, F(1, 50) = 6.90, p = .011. Adding seasonal changes in sedAct, MVPA, and EI from summer to fall [ΔR2 = .13, Fchange(3, 47) = 2.66, p = .059] did not increase the model’s ability to predict Δ%BF. In the context of the full model, increases in age and increases in EI had significant unique contributions in predicting increased %BF in spring. See Table 3 for coefficients.
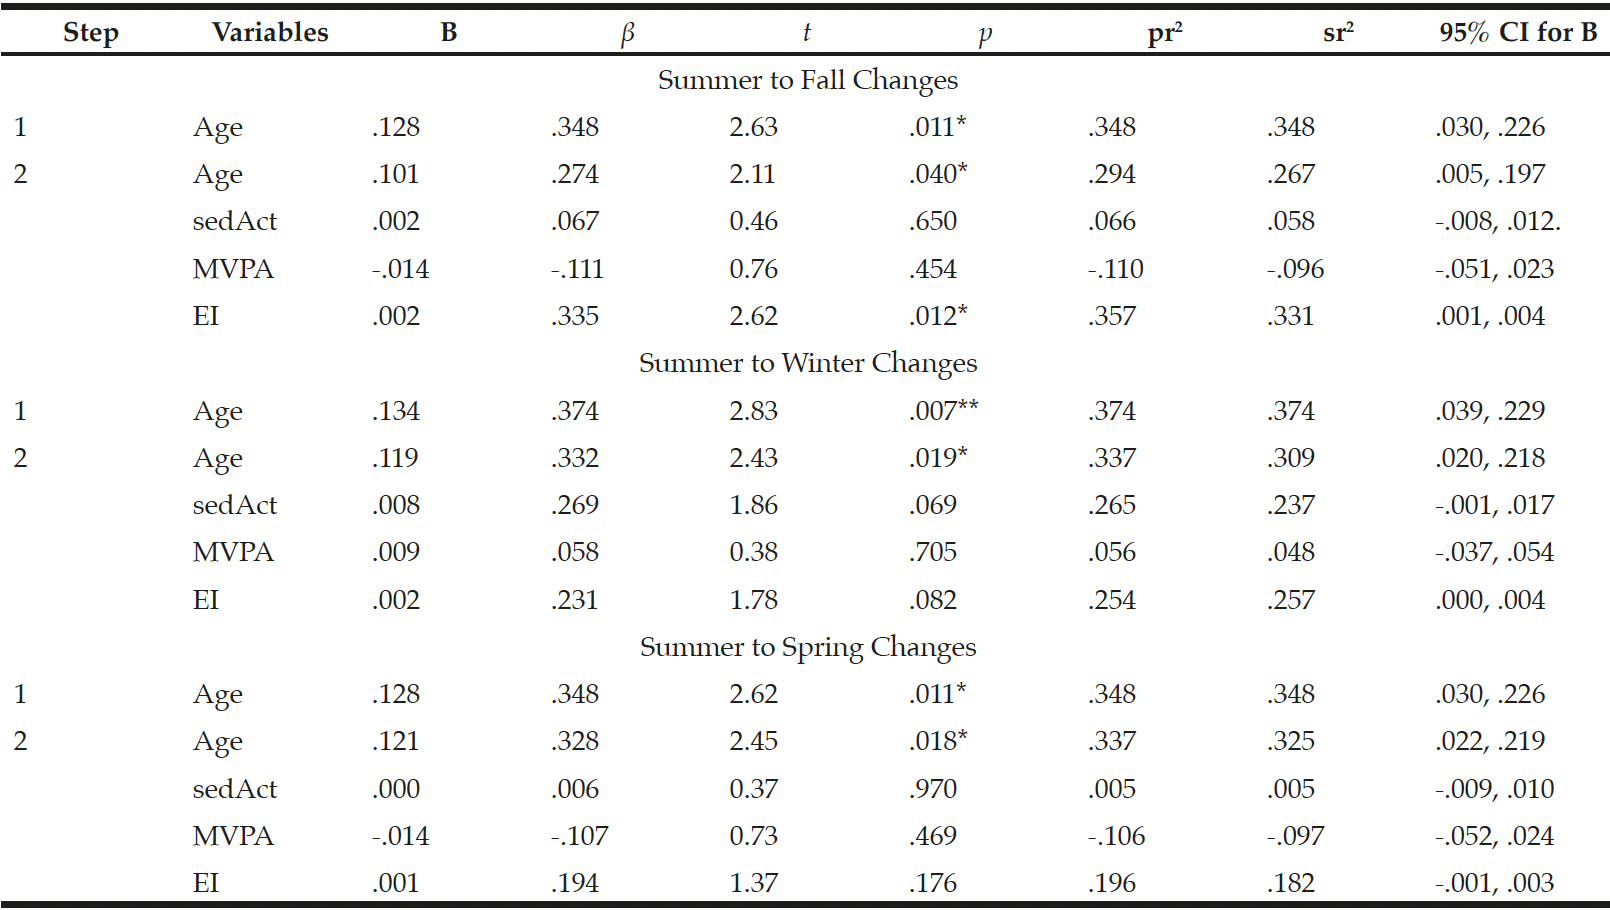
Table 3
Coefficients for Hierarchical MRC Models Predicting Changes in %BF
Note: *p < .05, **p < .01
Model 2 also predicted Δ%BF, R2 = .26, F(4, 46) = 3.93, p = .008. Age was a significant predictor in Step 1, R2 = .14, F(1, 49) = 7.99, p = .007. However, adding seasonal changes in sedAct, MVPA, and EI from summer to winter did not improve the model, ΔR2 = .12, Fchange(3, 46) = 2.36, p = .084. In the context of the full model, age was the only significant predictor of Δ%BF. See Table 3 for coefficients.
Model 3 did not yield a better fit than the reduced model (age as only predictor) for Δ%BF, R2 = .18, F(4, 47) = 2.51, p = .054. Though age was a significant predictor in Step 1, R2 = .12, F(1, 50) = 6.90, p = .011, adding seasonal changes in sedAct, MVPA, and EI from summer to spring did not significantly improve the model, ΔR2 = .10, Fchange(3, 47) = 1.05, p = .382. See Table 3 for coefficients.
Secondary Outcomes
Though they were not found to predict Δ%BF, we investigated whether there were seasonal changes in sedAct and MVPA. We found that sedAct changed across seasons [F(2.55, 127.62) = 5.48, p = .003], increasing during winter relative to summer, F(1, 50) = 9.56, p = .003. Likewise, we found changes in MVPA across seasons [F(3, 150) = 4.74, p = .004]; MVPA in winter was lower than summer MVPA, F(1, 50) = 15.52, p < .001.
Results of bivariate correlational analyses revealed that summer-fall increases in EI were associated with sustained increases in %BF into both Winter [(50) = .37, p = .009] and spring, r(50) = .37, p = .007. SedAct in summer, fall, and winter were positively correlated with %BF in spring (ps < .01). There was no relationship between %BF and FSH levels seasonally, nor in the change in %BF and change in FSH levels across seasons.
Discussion
This one-year, longitudinal study examined predictors of changes in %BF of midlife women from summer to the following spring. While we hypothesized that age and changes in EI, sedAct, and MVPA would all predict %BF changes, the most important predictors of increases in %BF from summer to spring were greater age and increases in EI from summer to fall. The magnitude of yearly increases in %BF were greater in the older women, consistent with past research (9, 10). Likewise, we found that greater EI in fall relative to summer was associated with greater increases in %BF, again consistent with past research (14, 15, 17-19). These findings suggest that while %BF increases with age, it is exacerbated by greater EI, especially during the fall. Notably, for the group as a whole there were no increases in EI from summer to fall, yet those women who reported the greatest increases in EI from summer to fall had the greatest increases in %BF during this period. (30, 31) Humans may experience similar circannual weight gain patterns to hibernating mammals; storing fat in fall seasons in preparation for food shortage in winter (30, 31). As such, excess EI in fall may be more likely to be stored as excess body fat. To our knowledge, there has not yet been work done to study this hypothesis. Though the mechanism behind the relationship between EI and %BF remains unclear, these data suggest that limiting seasonal increases in EI, especially in older women, during the fall is important because not all of the weight gained may be lost the following spring leading to the gradual weight gain with age (23).
Though not significant predictors of body composition changes, secondary analyses showed that sedAct and MVPA differed across seasons, with sedAct being greatest and MVPA being lowest in winter relative to summer. This is consistent with past research that shows people have the lowest PA and greatest sedentary behavior during winter months (14, 15, 17-20). Given the health concerns of sedentary activity (e.g., increased risk of cardiovascular disease, cancer, and diabetes; 32) and health benefits of physical activity independent of weight management (e.g., greater cardiorespiratory fitness is associated with decreased risk of mortality regardless of BMI; 33) health benefits would likely occur by limiting increases in sedAct and increasing MVPA during winter months. Contrary to our hypothesis seasonal changes in MVPA did not predict changes in %BF. Depending on the season, the women in our study engaged in 37 to 44 min/week of MVPA, far below the recommended amount of 150 min/week (34). The small magnitude of absolute MVPA limited the ability for energy expenditure to have an impact on %BF of the women in our study and the finite range of seasonal change in MVPA reduced its ability to predict change in %BF.
Strengths of the current study include the use of accelerometers to measure PA, DEXA to assess the primary outcome, %BF, and collecting three dietary recalls per month to estimate usual EI during each season. Retention was high, with only 2 women dropping out, and compliance was high for completion of PA and EI study tasks.
This study has limitations as well. The study lasted 9 months, and while it represents all four seasons over the course of one year, it is unknown whether participants would have modified EI or PA or reduced %BF if followed through a second summer. The sample is small and specialized regarding age and gender, which limits generalizability but does provide evidence for a group at risk of gaining excess adipose tissue (12, 13). The study is also limited in that the sample was from northern North Dakota, USA, an area which has great changes in both weather and sunlight throughout the year, and therefore not applicable to areas with long, hot summers and cool winters, or places where it is temperate year-round.
Conclusions
Overall, the results of this study suggest that as women age, attention should be given to achieving or maintaining appropriate energy intake and exercise during the fall and winter months to reduce increases in %BF. Limiting increases in sedentary behavior and energy intake during the fall and winter may help women reduce seasonal increases in %BF.
Ethical Standards: This study complies with current laws of the country in which it was performed. This study received IRB approval.
Acknowledgments: None.
Competing Interests: The authors (AMN, SLC, LJ, DGP, & JNR) have no competing interests to report. This work was supported by the U.S. Department of Agriculture, Agricultural Research Services #5450-51530-057-00D. The U.S. Department of Agriculture prohibits discrimination in all its programs and activities on the basis of race, color, national origin, age, disability, and where applicable, sex, marital status, familial status, parental status, religion, sexual orientation, genetic information, political beliefs, reprisal, or because all or part of an individual’s income is derived from any public assistance program. (Not all prohibited bases apply to all programs.) Persons with disabilities who require alternative means for communication of program information (Braille, large print, audiotape, etc.) should contact USDA’s TARGET Center at (202) 720-2600 (voice and TDD). To file a complaint of discrimination, write to USDA, Director, Office of Civil Rights, 1400 Independence Avenue, S.W., Washington, D.C. 20250-9410, or call (800) 795-3272 (voice) or (202) 720-6382 (TDD). USDA is an equal opportunity provider and employer.
Open Access: This article is distributed under the terms of the Creative Commons Attribution 4.0 International License (http://creativecommons.org/licenses/by/4.0/), which permits use, duplication, adaptation, distribution and reproduction in any medium or format, as long as you give appropriate credit to the original author(s) and the source, provide a link to the Creative Commons license and indicate if changes were made.
References
1. Fryar CD, Carroll MD, Afful J. Prevalence of Overweight, Obesity, and Severe Obesity Among Adults Aged 20 and Over: United States, 1960–1962 Through 2017–2018. In: Statistics NCfH, editor. 2020. p. 1208-10.
2. Hales CM, Carroll MD, Fryar CD, Ogden CL. Prevalence of Obesity and Severe Obesity Among Adults: United States, 2017–2018. 2020.
3. Wang YC, McPherson K, Marsh T, Gortmaker SL, Brown M. Health and economic burden of the projected obesity trends in the USA and the UK. The Lancet. 2011;378(9793):815-25.
4. Zhang H, Rodriguez-Monguio R. Racial disparities in the risk of developing obesity-related diseases: A cross-sectional study. Ethnicity & Disease. 2012;22:308-16.
5. Dehal A, Garrett T, Tedders SH, Arroyo C, Afriyie-Gyawu E, Zhang J. Body mass index and death rate of colorectal cancer among a national cohort of U.S. adults. Nutr Cancer. 2011;63(8):1218-25.
6. Vranian M, Blaha M, Silverman M, Michos E, Minder C, Blumenthal R, et al. The interaction of fitness, fatness, and cardiometabolic risk. Journal of the American College of Cardiology. 2012;59(13).
7. Kautzky-Willer A, Harreiter J, Pacini G. Sex and gender differences in risk, pathophysiology and complications of type 2 diabetes mellitus. Endocrine Reviews. 2016;37(3):278–316.
8. Censin JC, Peters SAE, Bovijn J, Ferreira T, Pulit SL, Magi R, et al. Causal relationships between obesity and the leading causes of death in women and men. PLoS Genetics. 2019;15(10):e1008405.
9. Stenholm S, Vahtera J, Kawachi I, Pentti J, Halonen JI, Westerlund H, et al. Patterns of weight gain in middle-aged and older US adults, 1992-2010. Epidemiology. 2015;26(2):165-8.
10. Williams PT, Wood PD. The effects of changing exercise levels on weight and age-related weight gain. International Journal of Obesity. 2006;30(3):543-51.
11. Kapoor E, Collazo-Clavell ML, Faubion SS. Weight gain in women at midlife: A concise review of the pathophysiology and strategies for management. Mayo Clinic Proceedings. 2017;92(10).
12. St-Onge MP. Relationship between body composition changes and changes in physical function and metabolic risk factors in aging. Current Opinion in Clinical Nutrition & Metabolic Care. 2005;8(5):523-8.
13. Hunter GR, Gower BA, Kane BL. Age related shift in visceral fat. International Journal of Body Composition Research. 2010;8(3):103-8.
14. Ma Y, Olendzki BC, Li W, Hafner AR, Chiriboga D, Hebert JR, et al. Seasonal variation in food intake, physical activity, and body weight in a predominantly overweight population. European Journal of Clinical Nutrition. 2006;60(4):519-28.
15. Lloyd L, Miller B. The impact of seasonality on changes in body weight and physical activity in Mexican-American women. Women Health. 2013;53(3):262-81.
16. Jahns L, Johnson LK, Scheet AJ, Raatz SK, Subar AF, Tande D. Measures of diet quality across calendar and winter holiday seasons among midlife women: A 1-Year longitudinal study using the automated self-administered 24-hour recall. Journal of the American Academy of Nutrition and Dietetics 2016;116(12):1961-9.
17. Buchowski MS, Choi L, Majchrzak KM, Acra S, Matthews CE, Chen KY. Seasonal changes in amount and patterns of physical activity in women. Journal of Physical Activity and Health. 2009;6(2):252-61.
18. Pivarnik JM, Reeves MJ, Rafferty AP. Seasonal variation in adult leisure-time physical activity. Medicine & Science in Sports & Exercise. 2003;35(6):1004-8.
19. Tucker P, Gilliland J. The effect of season and weather on physical activity: a systematic review. Public Health. 2007;121(12):909-22.
20. O’Connell SE, Griffiths PL, Clemes SA. Seasonal variation in physical activity, sedentary behaviour and sleep in a sample of UK adults. Annals of Human Biology. 2014;41(1):1-8.
21. Ogawa S, Seko T, Iro T, Mori M. Differences in physical activity between seasons with and without snowfall among elderly individuals residing in areas that receive snowfall. The Journal of Physical Therapy Science. 2019;31:12-6.
22. Schepps MA, Shiroma EJ, Kamada M, Harris TB, Lee IM. Day length is associated with physical activity and sedentary behavior among older women. Scientific Reports. 2018;8(1):6602.
23. Yanovski JA, Yanovski SZ, Sovik KN, Nguyen TT, O’Neil PM, Sebring NG. A prospective study of holiday weight gain. New England Journal of Medicine. 2000;342(12):861-7.
24. Jahns L, Conrad Z, Johnson LK, Scheett AJ, Stote KS, Raatz SK. Diet quality is lower and energy intake is higher on weekends compared with weekdays in midlife women: A 1-year cohort study. Journal of the Academy of Nutrition and Dietetics. 2017;117(7):1080-6 e1.
25. Jahns L, Johnson LK, Conrad Z, Bukowski M, Raatz SK, Jilcott Pitts S, et al. Concurrent validity of skin carotenoid status as a concentration biomarker of vegetable and fruit intake compared to multiple 24-h recalls and plasma carotenoid concentrations across one year: a cohort study. Nutrition Journal. 2019;18(1):78.
26. Laugero KD, Paul DR, Jahns L. Energy intake and season interact to influence physiological stress load among midlife women. The International Journal on the Biology of Stress. 2021.
27. Baranowski T, Baranowski JC, Watson KB, Martin S, Beltran A, Islam N, et al. Children’s accuracy of portion size estimation using digital food images: effects of interface design and size of image on computer screen. Public Health Nutrition. 2011;14(4):418-25.
28. Crouter SE, Kuffel E, Haas JD, Frongillo EA, Bassett DR, Jr. Refined two-regression model for the ActiGraph accelerometer. Med Sci Sports Exerc. 2010;42(5):1029-37.
29. Freedson PS, Melanson E, Sirard J. Calibration of the Computer Science and Applications, Inc. accelerometer. Medicine & Sciene in Sports & Exerise. 1998;30(5):777-81.
30. Martin SL. Mammalian hibernation: a naturally reversible model for insulin resistance in man? Diabetes and Vascular Disease Research. 2008;5(2):76-81.
31. Gangwisch JE. Seasonal variation in metabolism: evidence for the role of circannual rhythms in metabolism? Hypertens Res. 2013;36(5):392-3.
32. Park JH, Moon JH, Kim HJ, Kong MH, Oh YH. Sedentary lifestyle: Overview of updated evidence of potential health risks. Korean Journal of Family Medicine. 2020;41(6):365-73.
33. Barry VW, Baruth M, Beets MW, Drustine JL, Liu J, Blair SN. Fitness vs. fatness on all-cause mortality: A meta-analysis. Progress in Cardiovascular Diseases. 2014;56(4):382-90.
34. Bull FC, Al-Ansari SS, Biddle S, Borodulin K, Buman MP, Cardon G, et al. World Health Organization 2020 guidelines on physical activity and sedentary behaviour. Br J Sports Med. 2020;54(24):1451-62.