
T. Vassilakou1, G. Triantafillou1,2, L. Evrenoglou3
1. National School of Public Health – Dept. of Nutrition & Biochemistry. 196, Alexandras Ave., GR-115 21 Athens, Greece; 2. Athens-Technological Institute of Athens, Faculty of Health and Caring Professions, Dept. of Public Health, Athens, Greece. Ag Spyridona, GR-122 10 Egaleo, Greece; 3. National School of Public Health -Dept. of Environmental and Public Health Engineering. 196, Alexandras Ave., GR-115 21 Athens, Greece
Corresponding Author: Vassilakou Tonia, Ph.D, National School of Public Health – Dept. of Nutrition and Biochemistry. 196, Alexandras Ave., GR-115 21 Athens, Greece, Email address: toniavass@gmail.com, tvasilakou@esdy.edu.gr, Tel: +30 213 2010 288, Fax: +30 210 6207149
J Aging Res Clin Practice 2017;6:193-199
Published online October 5, 2017, http://dx.doi.org/10.14283/jarcp.2017.26
Abstract
Background: Malnutrition is a serious problem, which cannot be easily detected among free-living elderly people, and may lead to various health and social problems and deteriorate their quality of life. Objectives: To determine the prevalence of malnutrition and malnutrition risk among free-living elderly in the community of an urban municipality of Attica and to identify socio-economic, health and dietary factors that may increase malnutrition risk. Design: Cross-sectional. Setting: Elderly people attending the Open Care Community Centers at N. Philadelphia (an urban municipality of Attica). Participants: 151 free-living people aged over 65 years (78 women and 73 men). Measurements: Mini Nutritional Assessment (MNA) questionnaire was completed, as well as socio-demographic, medical history, physical activity and alcohol consumption data was collected through a personal interview with the participants. Results: None of the individuals was found to be malnourished, but 25,8% of the sample was at risk of malnutrition. After performing backward regression analysis recent appetite (p<0,009) and weight loss (p<0,003), latest development of psychological stress or acute disease (p<0,0001), number of full-course meals (p<0,0001), protein intake index (p<0,002), minimum daily consumption of 2 portions of fruits or vegetables (p<0,0001), daily consumption of liquids (p<0,004), individual’s self-evaluation of health (p<0,0001) and nutritional status (p<0,0001) all correlated significantly with MNA Screening Score. Conclusions: A significant number of free-living elderly persons were found at risk of malnutrition. Several dietary variables were found to correlate significantly with malnutrition risk. Early identification of nutritional risk of malnutrition in the community could ameliorate the nutritional status of seniors and consequently their health and quality of life.
Key words: Malnutrition, longevity, free-living elderly, community, nutritional status.
Introduction
The number of elderly people worldwide is rapidly increasing. In Europe persons over 60 years old account for 22%, while the percentage of people over 65 years is expected to increase to 27% by the end of 2020 (1) and to approximate 30% by 2030 (2). Most of the researchers working on the elderly population are concerned about health status of vulnerable groups and hospitalized people in nursing homes or hospitals (3). As far as senior’s nutritional status is examined epidemiological studies have shown that 10-20% of free living and up to 60% of the institutionalized suffer from nutritional deficiencies, in parallel with weight loss (4). More specifically, in EURONUT-SENECA study, plasma of 2500 older people from 17 different cities of 11 European countries was analyzed and it was found that: 36% of men and 47% of women presented deficiency of vitamin D, 2,7% of older people had low vitamin B12 levels and 23,3% of older people had rather low vitamin B6 levels (5). The problems that lead older people to malnutrition or poor nutrition are both physical and psychosocial (6). Malnutrition is defined as ‘the condition of insufficient energy or protein intake or body absorption, characterized by body weight loss grater than the normal rates and changes in body composition’ (7). Decreased taste and olfaction sense, previous weight loss, the presence of a chronic disease, inability to prepare food, use of a large number of medications and bad dentures are frequent physical problems, as well as social exclusion, depression, dementia, urban or country geographical area, age, belonging to a minority or living on his/her own are frequent psychosocial problems (7).
It is well established that malnutrition among elderly leads to serious consequences, including increase morbidity and mortality (8). Nevertheless, because malnutrition symptoms (i.e. decrease in muscle strength) may appear before the decrease of serum albumin or body weight loss and prevention of malnutrition of older people in the community is of a greater importance that its treatment, it is suggested in bibliography to use special nutritional screening tools to detect people at malnutrition risk (3). Moreover, it is well known that malnutrition treatment may be effective in its early stages. Nutritional screening is a process where several assessments are combined to enable the evaluation of an individual’s nutritional status (9). It usually comprises aspects of clinical, anthropometrical, biochemical, functional or other data. Its overall aim is to provide useful variables to define the nutritional status of the older adult in community and clinical settings (9).
A very common tool used widely for the nutritional screening of the older adult is the ‘Mini Nutritional Assessment’ (MNA) questionnaire developed by Guigoz et al at 1994 (10). This questionnaire contains four subcategories: anthropometric data, nutritional assessment, subjective evaluation and global assessment of the person (10). The graduated system categorizes people as wellnourished (>24 points), at risk of malnutrition (17-23,5 score points) or malnourished (<17 points). The sensitivity of this particular tool is estimated at 96%, its expertise at 98% and positive predictive value for detecting malnutrition at 97%.
Two field studies, which have used MNA or similar questionnaires on populations of healthy free-living in the community older people, have found prevalence of malnutrition risk at 13% and at 47,5% of the sample (9, 11). The researchers themselves mention that prevalence of older people at risk of malnutrition was relatively increased in their studies, whilst they point out that nutritional screening in these groups could prevent a possible aggravation of their nutritional status in the future (11). More recent similar studies found higher prevalence of malnutrition and risk of malnutrition. More specifically, in a study of a free-living elderly population in northwestern Spain 12,5% of the subjects was classified as under-nourished, while 57,5% was at risk of malnutrition (12). Moreover in a study conducted at three regions in Italy 22,8% of the free-living elderly population was classified as malnourished (13). In Greece, in a study conducted in a municipality of Athens among free-living elderly people, prevalence of malnutrition was found at 5,8% and malnutrition risk at 35,8% (14). The existing large-scale data about older people’s nutritional habits in Greece come either from Specially Designed Nutritional Researches (like EPIC-Elderly Project research) or from Food Balance Sheets of Food and Agriculture Organization of the United Nations (FAO) and Household Budget Survey (15).
In Greece, the principal social care services for the elderly in the community are Open Care Community Centers, Friendship Clubs, Day Care Centers for Older People and the program ‘Help at home’ (16). Within the framework of medical treatment in these social care services physiotherapy, occupational therapy, instructions and care for medical treatment and help at home for those who need it are provided (16). The O.C.C.C.’s purpose is to prevent biological, psychological and social problems of elderly people in order for them to remain autonomous, equal and active members of the community (16). From this point of view, detection of nutritional risk and application of necessary interventions at the O.C.C.C’s may help preventing malnutrition of elderly people (biological problem) and improve their quality of life and subsequently their autonomy (16). Nevertheless, it is not mentioned in bibliography whether or not nutritional interventions take place in social care settings.
Materials and Methods
The present study aims at the detection of malnutrition and malnutrition risk in Open Care Community Centers at N. Philadelphia (an urban Municipality of Attica) by using Mini Nutritional Assessment (MNA) questionnaire. More specifically, this procedure aimed at estimating the number of older people of the community, who are malnourished or at risk of malnutrition and at identifying the quality characteristics of this sub-sample. It also aimed at evaluating possible correlations between the Mini Nutritional Assessment Screening Score (as estimated by the graduated MNA questionnaire) and social-economic variables, certain health indicators and MNA nutritional factors.
Sample
In the present study the sample size was 151 people over 65 years old (78 women (51,7%) and 73 men (48,3%)), who visited daily the three Open Care Community Services departments of N. Philadelphia municipality for psychological, medical or recreational reasons. The approach in the three Open Care Community Services departments was effectuated after the consent of N. Philadelphia’s O.C.C.C. manager. No specific sampling method has been used. Participation in the study was voluntary. All old people present at the O.C.C.S. at the particular days of the researcher’s visit were invited to participate in the study. Questionnaires were collected on a daily basis (1-2 hours per day) from September until October 2009.
Procedure
MNA graduated questionnaire detects elderly people malnourished or at risk of malnutrition and includes four subcategories: anthropometric data, nutritional evaluation, subjective evaluation and a global evaluation of the person. The classification system categorizes people as wellnourished (MNA Screening Score>24 points), at risk (17<MNA Screening Score<23,5 points) and malnourished (MNA Screening Score<17 points). The sensitivity of this particular tool is estimated at 96%, its expertise at 98% and its positive diagnostic value for detecting malnutrition at 97%. The copyright belongs to Nestle Nutrition Institute (NNI).
For the purposes of this study the developed by NESTLE and translated in Greek Mini Nutritional Assessment questionnaire has been used. The questionnaires were completed through a personal interview for every older person, by applying the interview guide at www.mna-elderly.com. People attending the O.C.C.S. were informed in advance with a written notification about the scientific aim of the study and the confidentiality applied on their personal data and have signed that they agreed to participate in the study. In cases where the interview was not complete (due to whichever cause), the questionnaires where excluded from any further analysis. The collection of anthropometric data, included in MNA Questionnaire, (height, weight, arm and calf circumferences) was undertaken by using a height measure, a tape measure and a weight scale.
For the collection of socio-demographic, financial and health data, as well as smoking, alcohol consumption, dietary supplements’ consumption, daily activities and physical activity, a questionnaire was designed and administered by the field researcher. The variables included in this questionnaire were those mentioned in the relevant bibliography as factors possibly associated with malnutrition.
Statistical analysis was performed with IBM SPSS Statistics v.21. The level of statistical significance was set at 5%. Descriptive statistics were initially performed. The effect of risk factors on MNA score was evaluated via independent sample t-test for factors with two levels and with Analysis of Variance (ANOVA) for factors with more than two levels. Bonferroni Post-Hoc Pairwise Comparisons were performed, when ANOVA yielded statistically significant results. Backward regression analysis was also performed for MNA score, using as independent variables all risk factors in order to identify those, which mainly affected MNA score.
The present study was submitted and approved by the Bioethics Committee of the National School of Public Health.
Results
Sample characteristics
The mean age of the individuals was 75,63 years of age varying from 65 to 93 years (SD=6,619). The dominant age of the sample was 65 years of age (11,9% of the sample). As far as education level is concerned, 20,5% of the sample reported that hadn’t completed primary school, the majority of the sample (54,3%) had completed primary school, while just 6,0% of the sample had graduated from a technological institute or a university. Concerning the economic status, the majority of the sample (85,4% of the sample) referred to it as moderate, 9,3% referred to it as bad and just 5,3% referred to it as satisfactory.
Concerning family status and cohabitation, the majority of the sample was married (58,2%) and lived with their partners (56,3%). Finally, concerning those who lived by themselves, 85,7% of the elderly live in their own place. In conclusion, the majority of the sample was people of low educational level (74,8%) and moderate economic status (85,4%).
Classification of the sample according to MNA screening score and characteristics of persons at risk of malnutrition
In the total sample of 151 people, none was malnourished, while 39 (25,8%) were at risk of malnutrition (Table 1). The average age of people at risk of malnutrition (MNA Screening Score between 17 and 23,5 points) were 75,59 years old (SD=6,619), whereas the dominant age of these people was 65 years of age (15,4% of the sample). Most of the people at risk of malnutrition were women (64,1% of the sample). Concerning the family status of these people, most of them were married (48,7% of the sample, or widowed (38,5% of the sample). Over 50% of the sample at risk had only graduated from primary school (53,8% of the sample), while people that hadn’t completed primary school accounted for 28,2% of the sample. Concerning the economic status, most of the people characterized it as moderate (62,9% of the risk sample), 25,6% as poor, while just 5,1% characterized it satisfactory. Most of the people at risk of malnutrition lived in their own house (82,1% of the sample). Most of the people at risk lived with their partners (46,2% of the sample), several lived alone (28,2% of the sample) and some lived with their children (17,9% of the sample) or with other people (5,1% of the sample).
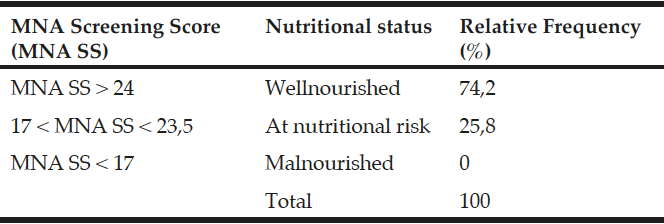
Table 1
Percentage of the sample according to MNA screening score
Correlations of MNA Screening Score with socio-economic variables and health indicators (Tables 2, 3 and 4)
Sex (p<0,04), alcohol consumption (p<0,004), physical activity (p<0,02), presence of Diabetes Mellitus (p<0,05), hypertension (p<0,03), osteoporosis (p<0,0001), constipation (p<0,002) (Table 2) and economic status (p<0,0001) (Table 3) were the health, lifestyle and socio-economic factors correlated significantly with MNA screening score. The variables of MNA questionnaire correlated with the MNA screening score were the following: appetite loss in the past 3 months (p<0,0001), weight loss in the past 3 months (p<0,0001), existence of psychological stress or acute illness in the past 3 months (p<0,0001), daily consumption of more than 3 prescribed medications (p<0,0001), minimum daily consumption of one portion of dairy products (p<0,003), daily consumption of meat/fish or chicken (p<0,03), minimum daily consumption of 2 portions of fruits and vegetables (p<0,0001), daily consumption of liquids (p<0,0001), feeding difficulty (p<0,003) (Table 2), daily number of full-course meals consumed (p<0,0001), protein intake index (p<0,0001), self-evaluation of his/her health status in comparison with other people of the same age (p<0,0001) and self-evaluation of his/hers nutritional status (p<0,0001) (Tables 2 and 3). Furthermore, Bonferroni Post-Hoc Pairwise Comparisons indicate the statistically significant differences among variable subgroups (Table 3). In Table 3 appear only statistically significant Bonferroni comparisons between subgroups.
In order to determine which risk factors are mainly correlated with MNA score, backward regression analysis was performed (Table 4). Only variables of the MNA questionnaire were found to significantly correlate with MNA score, more specifically: appetite loss in the past 3 months (p<0,009), weight loss in the past 3 months (p<0,003), existence of psychological stress or acute illness in the past 3 months (p<0,0001), daily number of full-course meals consumed (p<0,0001), protein intake index (p<0,002), minimum daily consumption of 2 portions of fruits and vegetables (p<0,0001), daily consumption of liquids (p<0,004), self-evaluation of his/her health status in comparison with other people of the same age (p<0,0001) and self-evaluation of his/hers nutritional status (p<0,0001).
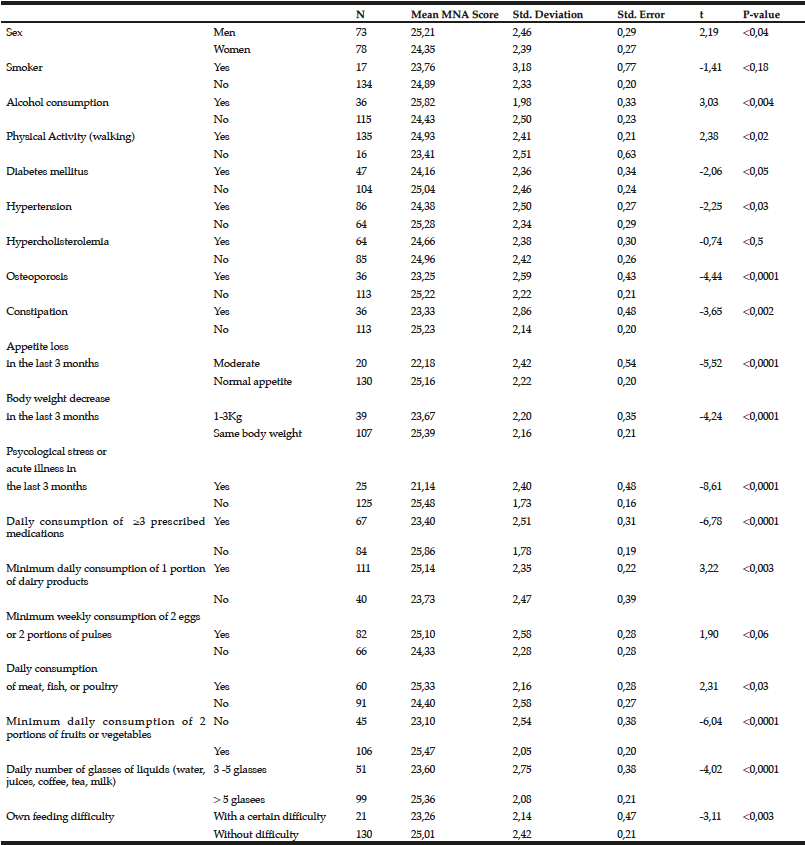
Table 2
Independent sample t-test for MNA score in relation with several risk factors
(significant statistical association p ≤ 0,05)
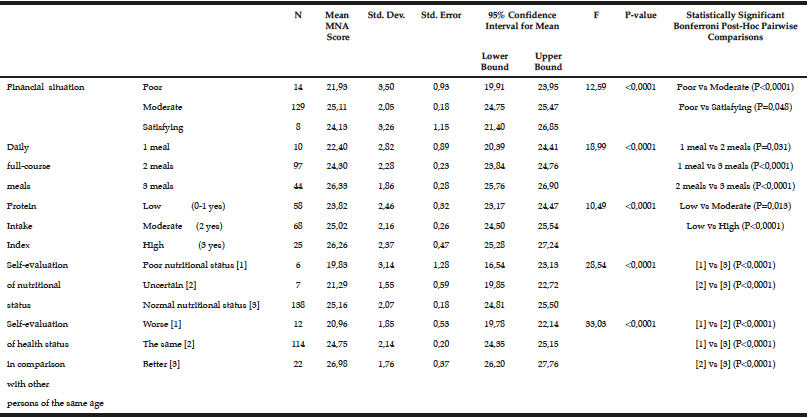
Table 3
One-way analysis of variance (ANOVA) for MNA score in relation with risk factors (with more than two levels)
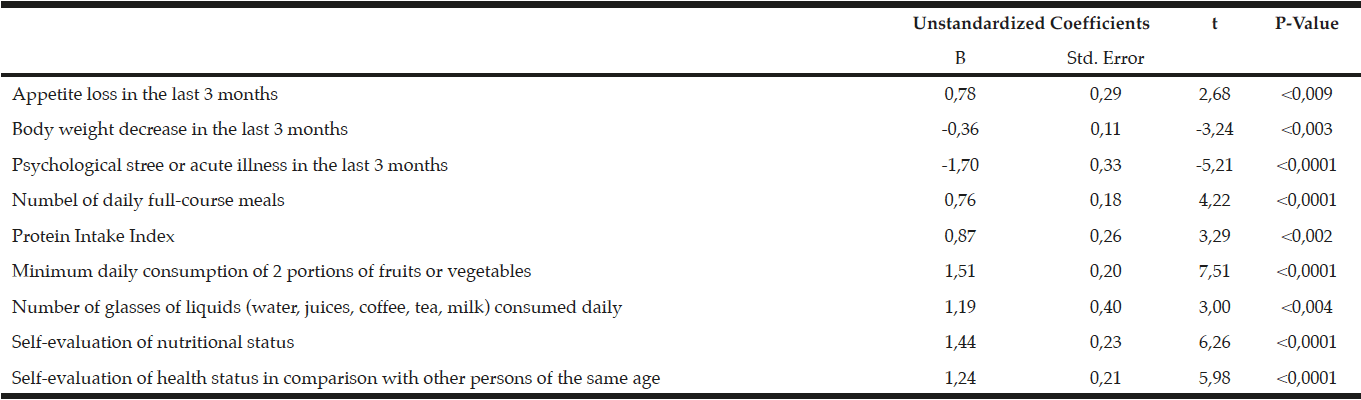
Table 4
Statistically significant variables from the backward regression analysis for “MNA score”
Discussion
In the present study, an important number of elderly who were free-living inhabitants of the community were at risk of malnutrition (25,8% of the total sample), while no person was found to be malnourished.
This percentage is rather high, given that the sample was not composed of nursing home inmates or hospitalized, but of an apparently healthy population. Similar or even higher prevalence of malnutrition risk however is found also in other studies conducted in different countries (9, 11-14, 17). In Greece, in a similar study conducted in a municipality of Athens with the same methodology, prevalence of malnutrition was found at 5,8% and malnutrition risk at 35,8% (14). Worse results are reported in studies conducted in Iran and South India, where malnutrition prevalence was found 12% and 14% and malnutrition risk prevalence was 45,3% and 49% respectively among free-living elderly (18-19).
In the present study MNA Screening Score was initially significantly correlated to several socio-economic, health, lifestyle and dietary variables. More specifically, sex (p<0,04), alcohol consumption (p<0,004), physical activity (p<0,02), presence of Diabetes Mellitus (p<0,05), hypertension (p<0,03), osteoporosis (p<0,0001), constipation (p<0,002) and economic status (p<0,0001) were the health, lifestyle and socio-economic factors significantly correlated with the MNA screening score. The variables of MNA questionnaire correlated with the MNA screening score were the following: appetite loss in the past 3 months (p<0,0001), weight loss in the past 3 months (p<0,0001), existence of psychological stress or acute illness in the past 3 months (p<0,0001), daily consumption of more than 3 prescribed medications (p<0,0001), minimum daily consumption of one portion of dairy products (p<0,003), daily consumption of meat/fish or chicken (p<0,03), minimum daily consumption of 2 portions of fruits and vegetables (p<0,0001), daily consumption of liquids (p<0,0001), feeding difficulty (p<0,003) (Table 2), daily number of full-course meals consumed (p<0,0001), protein intake index (p<0,0001), self-evaluation of his/her health status in comparison with other people of the same age (p<0,0001) and self-evaluation of his/hers nutritional status (p<0,0001).
Recent weight loss, presence of a chronic disease (Diabetes Mellitus, hypertension, constipation and osteoporosis, polypharmacy (consumption of more than 3 prescribed medications per day), poor economic status and depression (the existence of psychological stress or acute disease during the previous 3 months in the present study), have been associated in the past with nutritional status’s aggravation of older people (7, 20). On the contrary, the adherence to a Mediterranean nutritional model (consumption of at least one portion of dairy products per day, daily consumption of meat/fish or chicken, consumption 2 or more portions of fruits and vegetables per day, daily consumption of liquids) has been previously correlated to a good nutritional status at older people (21). More specifically, the clinical examination of men of 60-70 years old practicing a heavy work activity and following a Mediterranean nutritional model (high monounsaturated fatty acids consumption, high whole grain bread and fruits consumption and medium protein consumption) revealed that they were not at risk of malnutrition (121. The findings of the above mentioned study are in agreement with the results of the present study and support the important role of Mediterranean Diet in the preservation of a adequate nutritional status among the elderly. Moreover the Position paper of the Academy of Nutrition and Dietetics on food and nutrition for older adults (22) points out the importance of socio-demographic, health and lifestyle risk factors for malnutrition developments.
After performance of backward regression analysis only variables of the MNA questionnaire were found to significantly correlate with MNA score, more specifically: appetite loss in the past 3 months (p<0,009), weight loss in the past 3 months (p<0,003), existence of psychological stress or acute illness in the past 3 months (p<0,0001), daily number of full-course meals consumed (p<0,0001), protein intake index (p<0,002), minimum daily consumption of 2 portions of fruits and vegetables (p<0,0001), daily consumption of liquids (p<0,004), self-evaluation of his/her health status in comparison with other people of the same age (p<0,0001) and self-evaluation of his/hers nutritional status (p<0,0001). These appear to be the most important factors for the development of malnutrition in the present study. The variables mentioned above are in close agreement with the findings reported in the bibliography.
The present study is one of the first studies conducted in Greece aiming at the identification of malnutrition and malnutrition risk among free-living elderly persons. Most studies in Greece do not focuss on the early identification of malnutrition or malnutrition risk, but rather on certain nutritional deficiencies, like vitamin D deficiency, which is very common among the elderly (23). These results, as well as those of the other researchers (9, 11-14, 17), point out that elderly people who live in the community possibly need nutritional screening and nutritional interventions in order to improve their nutritional status. The identification of people at risk of malnutrition in the community using simple methods, like MNA graduated questionnaire is a simple procedure of low cost, which could lead to nutrition programmes for the older adults aiming at ameliorating their nutritional status and consequently their health and quality of life (11).
In the USA there are ongoing community programs to help seniors to cover their nutritional needs (24). Community based Older Americans Act Nutrition Program targets to the entire elderly population, specifically to those who are poor and especially the frail, homebound older adult (22). The services offered include provision of meals, nutritional screening and seniors’ control of nutritional status, transportation, and recreational activities (24). Participants in this kind of programs have significantly higher intakes, as a percentage of the Recommended Dietary Allowances for energy, calcium, zinc and vitamin B6 than non-participants (25).
Limitations
The major limitation of the present study was, as in all cross-sectional studies, its limited ability to draw valid conclusions about any association or possible causality because the presence of risk factors and outcomes are measured simultaneously. Furthermore, because the sample came from one municipality of Athens, the conclusions of the study cannot be considered as valid for a greater area. The participants were volunteers, so it is uncertain whether their characteristics were the same as those of non-participants. Due to the structure of MNA questionnaire the possibility for recall bias is considered as low.
Conclusions
An important percentage of free-living elderly people were at risk of malnutrition, while no person was found to be malnourished. The most important factors for the development of malnutrition were recent appetite or weight loss, latest development of psychological stress or acute illness, daily number of full-course meals consumed, protein intake index, minimum daily consumption of 2 portions of fruits and vegetables, daily consumption of liquids, self-evaluation of his/her health status in comparison with other people of the same age and self-evaluation of his/hers nutritional status.
Acknowledgments: TThe authors would like to thank all participants of the study because without their contribution this project would never have been accomplished and also would like to thank the N. Philadelphia Open care Community Centers’ Mr Athanassopoulos for the facilitation and services provided to the researcher during her visits at O.C.C.C. and Dr A. Tsoga for the technical assistance.
Funding: Authors received no funding for this project.
Conflicts of interest: On behalf of all authors, the corresponding author states that there is no conflict of interests.
References
1. Buckley BM. 1: Healthy ageing: ageing safely. Eur Heart J. Nov. 2001; 3 Suppl N: N6-10. Review.
2. European Commission DG Joint Research Center. JRC Science and Policy Reports: The role of nutrition in active and healthy ageing. For prevention and treatment of age-related diseases: evidence so far. European Union, Luxembourg (2014)
3. Iizaka S, Tadaka E, Sanada H. Comprehensive assessment of nutritional status and associated factors in the healthy, community-dwelling elderly. Geriatr Gerontol Int. 2008 Mar; 8 (1): 24-31.
4. Mucci E, Jackson SH. Nutritional supplementation in community-dwelling elderly people. Ann Nutr Metab 2008; (2) Suppl 1: 33-37
5. Haller J, Löwik MR, Ferry M, Ferro-Luzzi A. Nutritional status: blood vitamins A, E, B6, B12, folic acid and carotene. Euronut SENECA investigators. Eur J Clin Nutr 1991 Dec; 45 Suppl 3: 63-82
6. Dorner B, Niedert KC, Welch PK; American Dietetic Association Reports. Position of the American Dietetic Association: liberalized diets for older adults in long term care. J Am Diet Assoc 2002; 102 (9): 1316-1323
7. Morley JE. Anorexia of aging: physiologic and pathologic. Am J Clin Nutr. 1997 Oct; 66 (4): 760-73.
8. Lundin H, Sääf M, StrenderLE, Salminen H. Mini Nutritional Assessment and 10-year mortality in free-living elderly women: a prospective cohort study with 10-year follow-up. Eur J Clin Nutr 2012; 66 (9); 1050-1053
9. Charles RP. Nutrition assessment methods for the older Irish adult in the clinical and community settings. Proc Nutr Soc. 1998 Nov; 57 (4): 599-602
10. Guigoz Y, Vellas B. The Mini Nutritional Assessment (MNA) for grading the nutritional ststae of elderly patients, presentation of the MNA, history and validation. Facts, Res and Intervention Geriatr Newsletter: Nutrition 1997; 6: 2
11. Skarupski KA, Pelkowski JJ. Multipurpose senior centers: opportunities for community health nursing. J Community Health Nurs. 2003; 20 (2): 119-32.
12. De La Montana J, Miguez M. Suitability of the short-form Mini Nutritional Assessment in free-living elderly people in the northwest of Spain. J Nutr Health Aging 2011; 15 (3): 187-191
13. Donini LM, Poggiogalle E, Morrone A, et al. Agreement between different versions of MNA. J Nutr Health Aging 2013; 17 (4): 332-338
14. Plexida A, Vassilakou T, Kaba E, Fasoi G, Kelesi M, Zyga S. Assessment of the nutritional index of the elderly in an Open Care Center and correlation with their socioeconomic status and health indicators. Archives of Hellenic Medicine 2015; 32 (5): 622-628
15. Naska A., Mpamia H., Valanou E., Trihopoulou A. Nutritional Surveys. Object, Methodology and their application on Greek people. Review. Archives of Hellenic Medicine 2003, 20(2): 142-171.
16. Kourea-Kremastinou T. Public Health, Theory-Act-Policies (pages 557-581), 2007. Technorama Editions, Athens
17. Bauer JM, Matthias JK, Anthony P, Guigoz Y, Sieber CC. The Mini Nutritional Assessment – Its history, today’s practice and future perspectives” – Nutrition in clinical practice 2008; 23 (4): 388-396
18. Aliabadi M, Kimiagar M, Ghavour-Mobarhan M, et al.Prevalence of malnutrition in free living elderly people in Iran: a cross-sectional study. Asia Pac J Clin Nutr 2008; 17 (2): 285-289
19. Vedantam A, Subramanian V, Rao NV, John KR. Malnutrition in free-living elderly in rural south India: prevalence and risk factors. Public Health Nutr; 2010: 13 (9): 1328-1332
20. De Morais C, Oliveira B, Afonso C, Lumbers M, Raats M, de Almeida MD. Nutritional risk of European elderly. Eur J Clin Nutr 2013; 67 (11): 1215-1219
21. Trichopoulou A, Orfanos P, Norat T, et al. Modified Mediterranean diet and survival: EPIC-elderly prospective cohort study. BMJ 2005; 330 (7498): 991-997
22. Bernstein M, Munoz N; Academy of Nutrition and Dietetics. Position Paper: food and nutrition for older adults: promoting health and wellness. J Acad Nutr Diet 2012; 112 (8): 1255-1277
23. Singhellakis PN, Malandrinou Fch, Psarrou CJ, Danelli AM, Tsalavoutas SD, Constandellou ES. Hormones 2011; 10 (2); 131-143
24. Mahan K., Escott-Stump S. Krause’s Food Nutrition and Diet Therapy (p. 318-336, 342-347). 2003, 11th edition. Saunders eds.
25. Ponza M, Ohls JC, Millen BE. Serving Elders at Risk (The Older Americans Act Nutrition Programs, National Evaluation of the Elderly Nutrition Program, 1993–1995), 1996. Washington, DC: Mathematica Policy Research