S. Gao, H. Tang, BH. Zhou, KL. Tang
Department of Orthopedic Surgery, Third Military Medical University Affiliated Southwest Hospital, Gaotanyan Str. 30, Chongqing 400038, People’s Republic of China
Corresponding Author: BH. Zhou, KL. Tang, Department of Orthopedic Surgery, Third Military Medical University Affiliated Southwest Hospital, Gaotanyan Str. 30, Chongqing 400038, People’s Republic of China, yijian510868@hotmail.com
J Aging Res Clin Practice 2017;6:168-175
Published online September 7, 2017, http://dx.doi.org/10.14283/jarcp.2017.22
Abstract
Objectives: The mechanistic target of rapamycin (mTOR) controls cell growth and proliferation via translation regulation in eukaryotes. The present study investigated the effects of mTOR on the proliferation and differentiation of tendon stem cells (TSCs). Methods: The proliferation and differentiation ability of TSCs was tested in response to antagonist (MHY1485), and a depressor of mTOR (Rapamycin and KU0063794). CCK test was performed to test cell proliferation; quantitative real-time PCR (RT-PCR) and Western blot test were performed to evaluate the differentiation of TSCs. Results: Blocking of mTOR1 inhibited the proliferation of TSCs and blocking of mTOR2 enhanced the proliferation of TSCs; however, the effects of mTOR1 surpassed the effects of mTOR2. Blocking of mTOR1 or activation of mTOR2 induced the expression of TNC, and blocking of mTOR2 inhibited the expression of TNC. Blocking of mTOR1 by rapamycin decreased the expression of ap2. Both blocking of mTOR1 or mTOR2 had little effects on the expression of Runx2 and Sox9; however, activation of mTOR2 induced the expression of Runx2 and Sox9. Moreover, the Western blot test showed that blocking of mTOR1 by Rapamycin or the blocking of both mTOR1 and mTOR2 by KU-0062794 enhanced the expression of TNC; in addition, blocking of mTOR1 by Rapamycin enhanced the expression of c-EBPα and Sox9. However, activation of mTOR1 and mTOR2 by MHY1485 increased the expression of Runx2. Conclusions: mTOR played important roles in the proliferation and differentiation of TSCs. Furthermore, mTOR1 and mTOR2 played different roles on the proliferation and differentiation of TSCs. Blocking mTOR1 inhibited the proliferation of TSCs and played a dominant function.Blocking of mTOR1 enhanced the expression of tenocyte related genes; however, blocking of mTOR2 inhibited the expression of TNC. Blocking of mTOR1 by rapamycin decreased the expression of ap2 and activation of mTOR2 induced the expression of Runx2.
Key words: mTOR, proliferation, differentiation, tendon, stem cells.
Introduction
The primary function of tendons is to transfer mechanical loads from muscle to bone, which can easily lead to tendinopathy (1). Tendinopathy commonly affects adult athletes and aged population; it occurs in the rotator cuff (2), Achilles, patellar tendons (3), and medial epicondyle (4). Bi firstly identified tendon stem/progenitor cells (TSPCs) in 2007 (5). More and more evidence showed that pluripotent tendon cells (PTCs), also termed tendon stem cells (TSCs), play important roles in the development of tendinopathy via proliferation and non-tenocyte differentiation (6-9).
The mechanistic target of rapamycin (mTOR) is a specific target of the natural compound rapamycin (10-12). mTOR is a highly conserved protein kinase and a member of a family of phosphatidylinositol-3-kinase-related kinases (PIKKs), which are protein kinases (10, 13, 14). mTOR signaling was confirmed to regulate cell growth, proliferation, and differentiation in different kinds of cells. mTOR1 and mTOR2 are two structurally and functionally distinct protein complexes. Raptor is a component of mTORC1 that determines the specificity of mTORC1 (15); mTOR2 contains mTOR, mLST8, and mAVO3 (14). Rapamycin inhibits the regulation and functions of mTOR1, but not mTOR2 (10). MHY1485 is a small-molecular synthesized compound and mTOR activator, based on its morpholinotriazine structure. MHY1485 promotes follicle growth through the activation of both mTORC1 and mTOR2 (16). In addition, MHY1485 inhibits the autophagy process of rat hepatocytes by inhibiting of fusion (17). KU0063794, a well-known inhibitor of mTOR, inhibited both mTOR1 and mTOR2. Moreover, KU0063794 reportedly enhanced the inhibition of the phosphorylation of Akt or downstream molecules of mTOR1, and it then maintained cell cycle arrest at the G0/G1 phase (18). KU0063794 demonstrated a significant synergistic growth inhibition effects in HepG2 cell growth in mice (19). Recent studies suggested that mTOR played important roles in the translation of mRNA into proteins involved in cancer, diabetes, cardiovascular disease, and neurological disorders (20-22), which sense and respond to nutrient availability, energy sufficiency, stress, hormones, and mitogens (23). However, there is few report about the effects of mTOR on TSCs. We assume that mTOR might have an effect on the proliferation and differentiation of TSCs.
Chronical tendinopathy has been verified by abnormal tissue structures and hypercellularity by histological findings (24). Moore reported that mTOR was inactivated by rosemary extract, which inhibited the proliferation of human lung cancer cells (25). However, Gharibi found that blocking mTOR enhanced muscle stem cells ‘(MSC) proliferative capacity and it also induced osteogenic differentiation mediated by the expression of pluripotency (26). In addition, mTOR was reported to be essential for skeletal muscle regeneration by controlling the expression of myogenic genes in satellite cells (27). Collectively, mTOR showed different effects on the proliferation and differentiation of different types of cells. Whether and how mTOR regulates the proliferation and differentiation of TSCs remains to be fully understood. It is essential to delineate the response of TSCs to mTOR to better understand tendon physiology and tendinopathy.
Therefore, this study aimed to determine the response of TSCs to mTOR in vitro. To this end, we examined the expression of mTOR in TSCs and compared the ability of TSCs to proliferate, and differentiate in response to an agonist and depressor of mTOR.
Materials and methods
Ethics statement
The ethics committee at the Southwest Hospital approved all of the experimental protocols applied when using rats for tendon samples and for culturing the TSCs in this study.
Isolation of TSCs The TSCs isolation procedures were carried out as previously described (6, 7). TSCs were isolated from the Achilles tendons of SD rats. In brief, after removing the surrounding tendon sheath and paratenon, the Achilles tendons were minced into fine pieces. Then, 10 mg of an Achilles tendon sample was digested in 1 ml of phosphate buffer saline (PBS) containing 3 mg of collagenase type I and 4 mg of dispase at 37˚C for 3 hours and centrifuged at 3,500 rpm for 15 minutes to obtain cell pellets. Tendon cells in the pellets were re-suspended in Dulbecco’s Modified Eagle Medium (DMEM; Lonza, Walkersville, MD, USA) containing 20% fetal bovine serum (FBS), 100 U/ml of penicillin, and 100 µg /ml of streptomycin (Atlanta Biologicals, Lawrenceville, GA, USA). Next, the cell suspension was cultured in T75 flasks with growth medium (DMEM plus 20% FBS). After 10–16 days in culture, TSCs that formed colonies on the surface of the flask were removed and sub-cultured for up to three passages to obtain sufficient numbers of TSCs for in vitro experiments.
CCK test
TSCs were seeded into 96-well culture plates at a density of 3,000 cells/well in 100 µl of growth medium maintained in 20 % O2 culture conditions. Then, 10 µl of CCK-8 solution was added to each well of the plate, 24 hours after seeding, and they were incubated for an additional 2 hours to measure absorbance at 450 nm using a microplate reader (SpectraMax Plus384 Absorbance Microplate Reader, Molecular Devices, LLC, CA, USA).
Western blotting
Total proteins were extracted by using a cell total protein extraction kit. We then used a BCA protein assay kit for determination of protein concentration. A total of 50μg of protein per sample was resolved on 10% sodium dodecyl sulfate-polyacrylamide gel electrophoresis (SDS-PAGE), and then transferred onto a polyvinylidene fluoride (PVDF) membrane. After being closed with 5% skim milk powder, they were incubated in an anti-dilution (anti-p-S6K antibody, anti-S6K antibody, anti-p-AKT antibody, ant-AKT antibody, anti-TNC antibody, and anti-c-EBPa antibody) overnight at 4℃. A second antibody was incubated at room temperature for 2 hours; finally, the membrane was washed with an ECL developing kit. The Quantity One software (Bio-Rad Laboratories, Hercules, CA, USA) was used to analyze the protein expression level.
Quantitative Real-time PCR (qRT-PCR)
We determined the expression of tenocyte related gene (Collagen type I) and non-tenocyte related genes (collagen type II, PPARg, Runx-2) using qRT-PCR. Total RNA was extracted from TSCs at passage one from TSCs using an RNeasy Mini Kit with an on-column DNase I digest (Qiagen, Inc., Hilgen, Germany) and first-strand cDNA was synthesized following the manufacturer’s instruction. qRT-PCR was carried out using 2 µl cDNA (approximately 100 ng RNA) in a 25 µl PCR reaction volume using QIAGEN QuantiTect SYBR Green PCR Kit (Qiagen) in a Chromo 4 Detector (MJ Research, Inc., Waltham, MA, USA). Glyceraldehyde-3-phosphate dehydrogenase (GAPDH) was used as an internal control. Forward and reverse primers for all genes were designed based on previously published sequences and were synthesized by Thermo Fisher Scientific (Waltham, MA, USA). All reactions had three replicates.
Statistical analysis
The Statistical Package for the Social Sciences for Windows, version 21.0 (SPSS Inc, Chicago, IL, USA) was used for the statistical analyses. All data are presented as mean ± standard deviation (SD). Independent t-tests and analysis of variance (ANOVA) were used for the statistical analysis. Differences between two groups were considered significant when the p-value was ≤ 0.05.
Results
The results of CCK test showed proliferation ability of TSCs decreased in all 3 groups: blocking mTOR1 by rapamycin group, blocking of both mTOR1 and mTOR2 by KU-0062794 group, and activation of mTOR1 and mTOR2 by MHY1485 group.
We tested the effect of mTOR on the proliferation capability of TSCs by performing CCK assays. Blocking of mTOR1 by rapamycin, blocking both mTOR1 and mTOR2 by KU-0062794, and activation of both mTOR1 and mTOR2 by MHY1485 significantly decreased the OD values of TSCs, respectively, compared with the control group. However, the OD value of TSCs in the MHY1485 group was significantly higher when compared with the rapamycin group or the KU-0062794 group. The OD values of TSCs cultured with the negative control group, the rapamycin 5 μM group, the MHY1485 2 μM group, and KU-0062794 0.5 μM group were 1.66 ± 0.15, 0.81 ± 0.39,1.48 ± 0.26, and 1.30 ± 0.11, respectively. Both blocking of mTOR by rapamycin (p<0.001) or KU-0062794 (p<0.001) and the activation of mTOR by the MHY1485 significantly decreased the OD values of TSCs (p=0.018), compared with the negative control. The OD value of TSCs cultured with MHY1485 was significantly higher when compared with those of rapamycin 5μM group (p<0.001) and KU-0062794 0.5 μM group (p=0.018) (Figure 1).
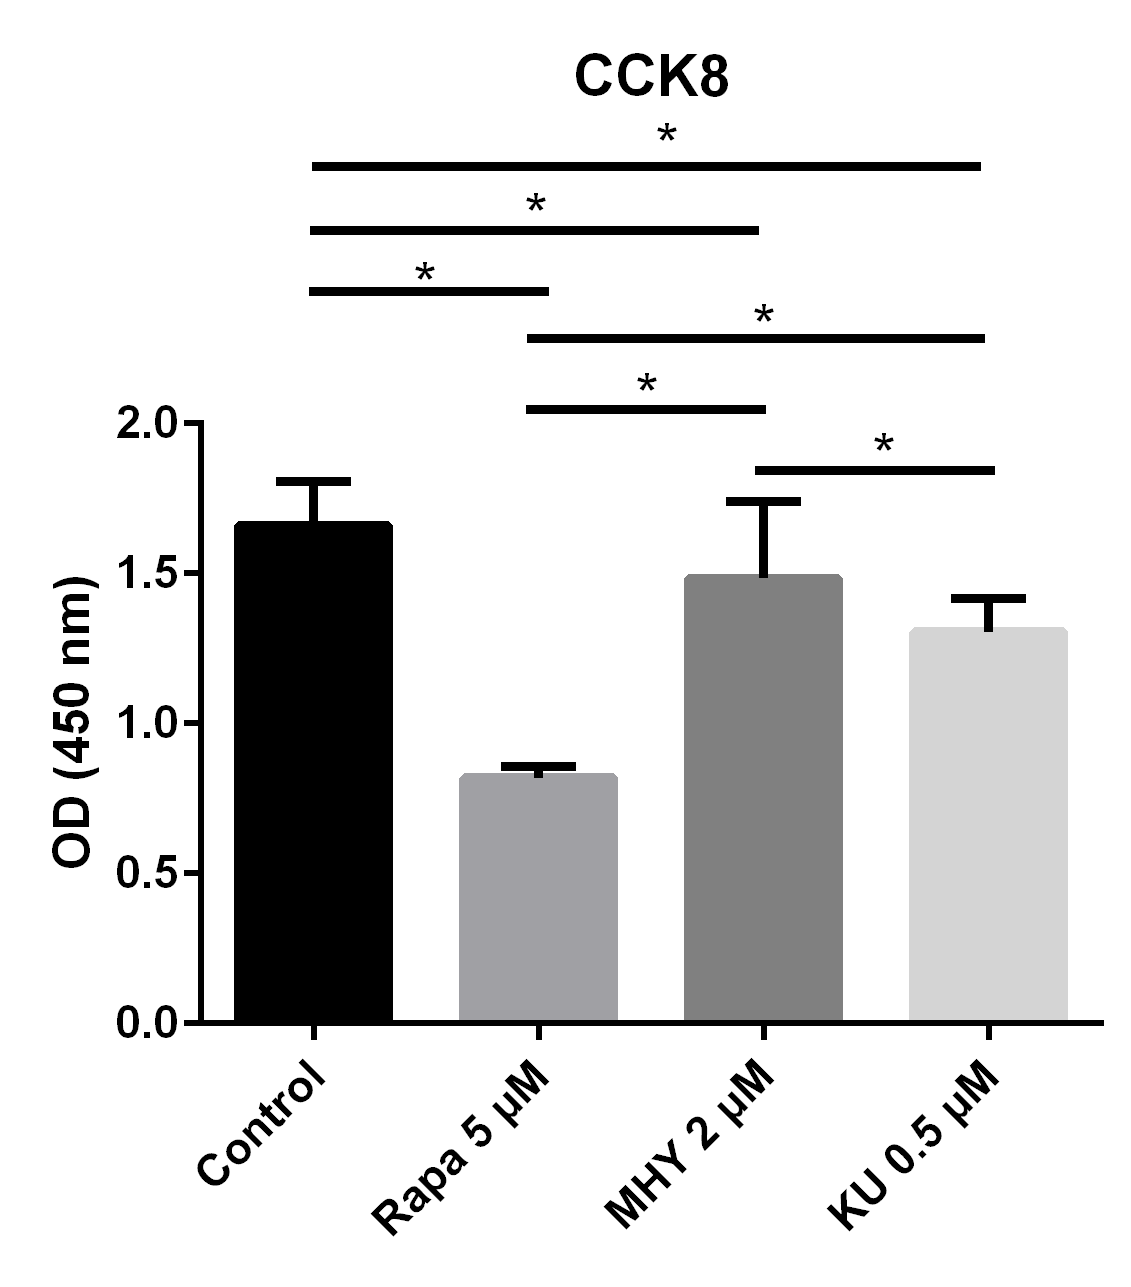
Figure 1
The results of CCK test showed proliferation ability of TSCs decreased in all 3 groups: blocking mTOR1 by rapamycin group, blocking of both mTOR1 and mTOR2 by KU-0062794 group, and activation of mTOR1 and mTOR2 by MHY1485 group
The OD values of TSCs cultured with negative control group, rapamycin 5μM, MHY1485 2 μM and KU-0062794 0.5 μM were 3.37 ± 0.14, 1.60 ± 0.08, 3.16± 0.17, 3.00 ± 0.11, respectively. Both of locking of mTOR by rapamycin (p<0.001 = or KU-0062794 (p<0.001) and activation of mTOR by MHY1485 significantly decreased the OD values of TSCs (p=0.005), compared with negative control. The OD value of TSCs cultured with MHY1485 is significantly higher compared with the one in rapamycin 5 μM group (p<0.001) and KU-0062794 0.5 μM group (p=0.018). Blocking of mTOR1 or the activation of mTOR2 induced the expression of TNC and blocking of mTOR2 inhibited the expression of TNC.
Blocking of mTOR1 inhibited the proliferation of TSCs and blocking of mTOR2 enhanced the proliferation of TSCs; however, the effects of mTOR1 surpassed the effects of mTOR2.
In addition, we further evaluated the effects of mTOR1 andmTOR2 on the proliferation of TSCs; we evaluated the proliferative capability of TSCs in the control, rapamycin 5 μM group, rapamycin 5 μM + MHY1485 2μM group, and KU-0062794 0.5 μM group. The results showed that the OD values of TSCs cultured with negative control group, rapamycin 5 μM group, rapamycin 5 μM + MHY1485 2 μM group, and KU-0062794 0.5 μM group, are 1.57 ± 0.25, 0.83 ± 0.54, 0.80 ± 0.11, and 1.30 ± 0.14, respectively. The OD values of TSCs cultured with rapamycin 5 μM (p<0.001), rapamycin 5 μM + KU-0062794 0.5 μM (p<0.001), and rapamycin 5μM + MHY1485 2 μM (p<0.001), significantly decreased, compared with negative control group. However, The OD values of TSCs cultured with KU-0062794 0.5 μM was higher, as compared with rapamycin 5 μM + MHY1485 2 μM group (p<0.001) (Figure 2).
We performed RT-PCR to examine the effects of mTOR on the differentiation of TSCs. The expression of TNC cultured in rapamycin 5 μM and rapamycin 5 μM + MHY1485 2 μM increased by 56% (p=0.025) and 185% (p<0.001) respectively. Furthermore, the expression of TNC cultured in rapamycin 5 μM + KU-0062794 0.5 μM significantly decreased by 48% (p=0.039) (Figure 3).
Blocking of mTOR1 by rapamycin decreased the expression of ap2; however, activation of mTOR1 and mTOR2 simultaneously by MHY decreased the expression of ap2 too.
Blocking of mTOR1 by rapamycin and activation of mTOR1and mTOR2 by MHY1485 decreased the expression of ap2. The expression of ap2 in TSCs cultured with rapamycin 5 μM group, rapamycin 5 μM + MHY1485 2 μM group, and rapamycin 5 μM KU-0062794 0.5 μM group decreased by 75% (p=0.005), 94% (p=0.002) and 52% (p=0.019) respectively, compared with negative control group. Further, the expression of ap2 in rapamycin 5 μM + KU-0062794 0.5 μM group is significantly higher compare with the one in the rapamycin 5 μM + MHY1485 2 μM group (Figure 4).
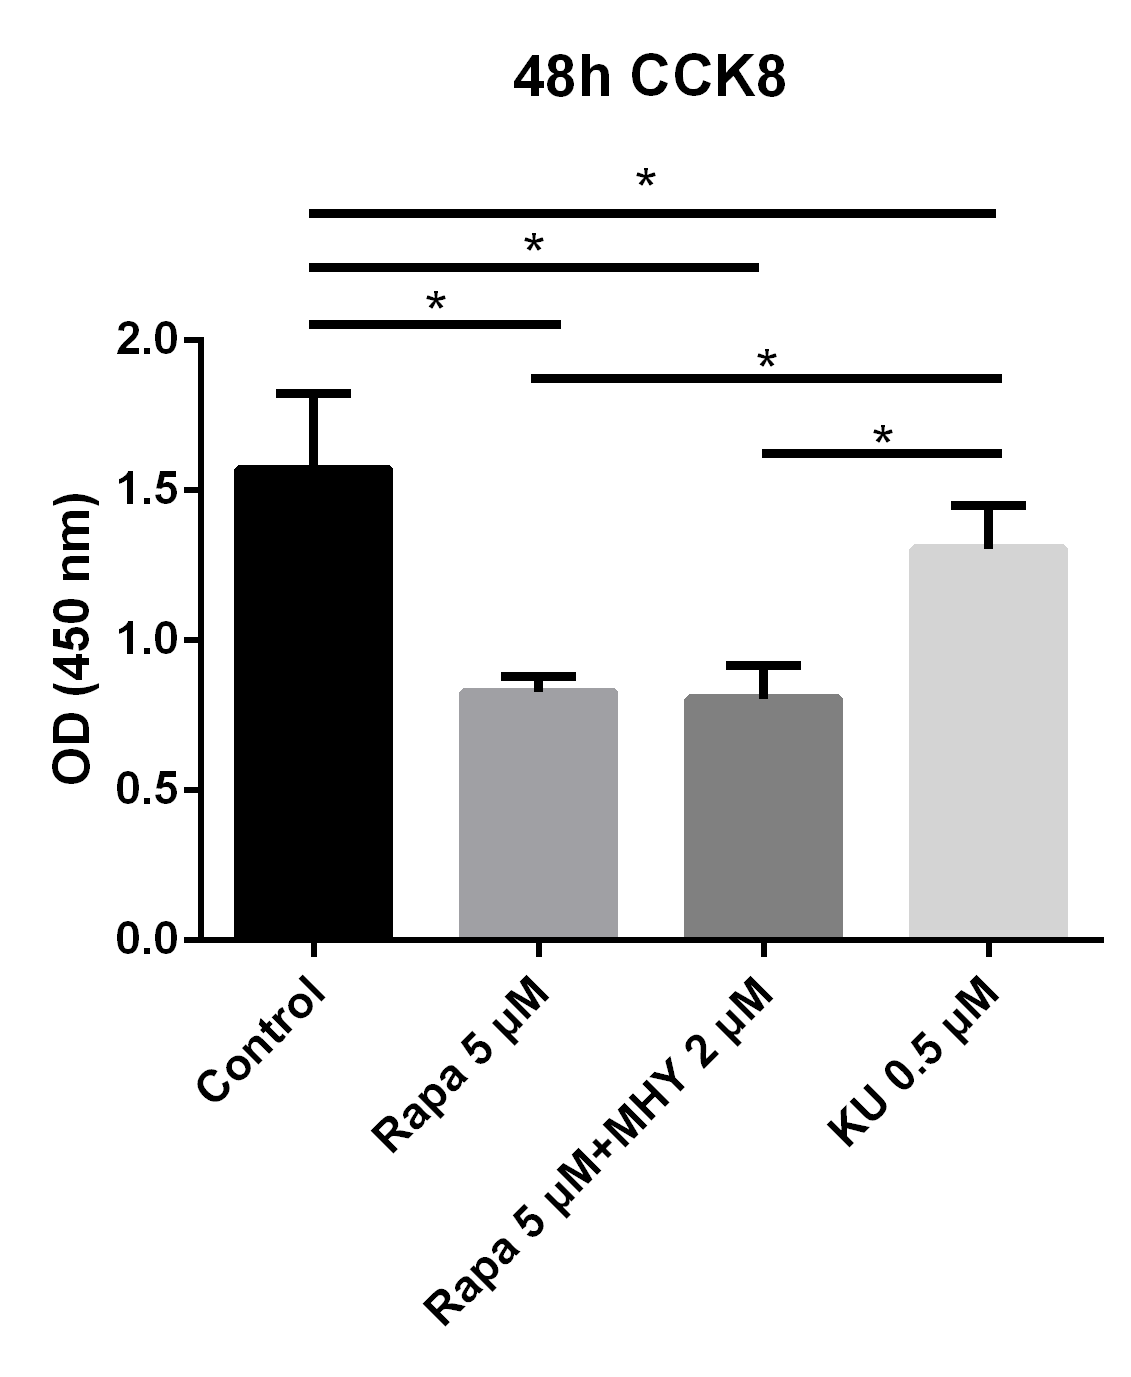
Figure 2
Blocking of mTOR1 inhibited the proliferation of TSCs and blocking of mTOR2 enhanced the proliferation of TSCs; however, the effects of mTOR1 surpassed the effects of mTOR2
To evaluate the effects of mTOR1 and mTOR2 on TSCs respectively, We performed proliferation capability test of TSCs in control, rapamycin 5 uM, rapamycin 5 uM + KU-0062794 0.5 uM, and rapamycin 5 uM + MHY1485 2 uM. The results showed that the OD values of TSCs cultured with negative control group, rapamycin 5 uM, rapamycin 5uM+ KU-0062794 0.5uM, and rapamycin 5 uM+ MHY1485 2uM are 1.57 ± 0.25, 0.83 ± 0.54, 0.80 ± 0.11, 0.57 ± 0.34 respectively. The OD values of TSCs cultured with rapamycin 5 uM (p<0.001), rapamycin 5uM+ KU-0062794 0.5 uM (p<0.001), and rapamycin 5uM+ MHY1485 2uM (p<0.001), significantly decreased, compared with negative control group. However, The OD values of TSCs cultured with rapamycin 5 uM+ KU-0062794 0.5 uM was higher, compared with rapamycin 5uM+ MHY1485 2uM group (p<0.001).
Both blocking mTOR1 or mTOR2 had little effects on the expression of Runx2; however, activation of mTOR2 induced the expression of Runx2.
Rapamycin or rapamycin combined with KU0062794 did not significantly change the expression of Runx2; however, the expression of Runx2 was increased when simultaneously blocked by rapamycin and activated by MHY1485. The expression of Runx2 in TSCs cultured with rapamycin 5 μM, rapamycin 5 μM+ MHY1485 2 μM, and rapamycin 5 μM + KU-0062794 0.5 μM increased by 49% (p=0.111), 123% (p=0.006) and 45% (p=0.134) respectively, compared with negative control. Also there was significant difference between the rapamycin 5 μM group and rapamycin 5 μM + MHY1485 2 μM (p=0.030); and between the rapamycin 5 μM + MHY1485 2 μM group, and rapamycin 5 μM+ KU-0062794 0.5 μM group (p=0.026) (Figure 5).
Blocking of either mTOR1 or mTOR2 had little effect on the expression of Sox9; however, activation of mTOR2 can induced a lower expression of Sox9, when compared with the one in the rapamycin group.
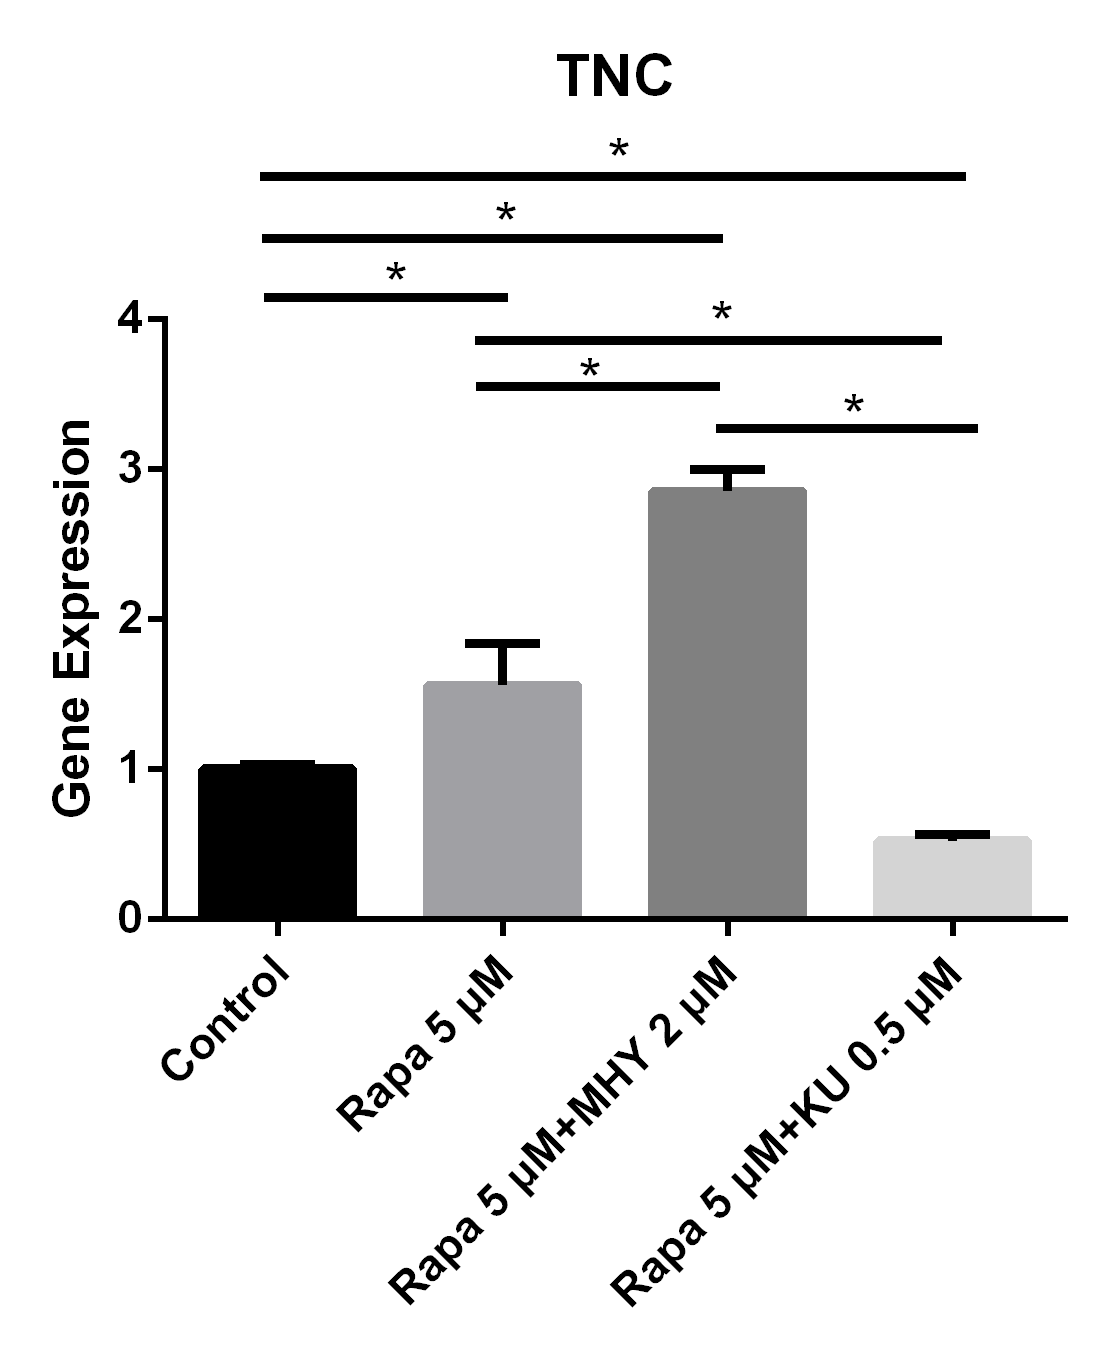
Figure 3
Blocking of mTOR1 or the activation of mTOR2 induced the expression of TNC and blocking of mTOR2 inhibited the expression of TNC
The expression of TNC cultured in rapamycin 5uM and rapamycin 5 uM + MHY1485 2 uM increased 56% (p=0.025) and 185% (p<0.001) respectively. And the expression of TNC cultured in rapamycin 5 uM+ KU-0062794 0.5 uM significantly decreased 48% (p=0.039).
Blocking of mTOR by rapamycin or rapamycin combined with KU-0062794 decreased the expression of Sox9; while expression of Sox9 had decreased the most when simultaneously in the rapamycin combined MHY1485 group. The expression of Sox9 in TSCs cultured with rapamycin 5 μM, rapamycin 5 μM + MHY1485 2 μM, and rapamycin 5 μM + KU-0062794 0.5 μM decreased 10% (p=0.43), 33% (p=0.045), 23% (p=0.11) respectively, compared with control group (Figure 6).
We further performed Western blot tests to evaluate the effects of mTOR on the differentiation tendency of TSCs. The results of Western blot showed that rapamycin and KU-0062794 blocked the phosphoration of Raptor and S6k; also, mTOR2 was activated by MHY1485, which was confirmed by the phosphorylation of AKT. Blocking of mTOR1 by Rapamycin or blocking both mTOR1 and mTOR2 by KU-0062794 enhanced the expression of TNC; in addition, blocking of mTOR1 by Rapamycin enhanced the expression of c-EBPα and Sox9. However, activation of mTOR1 and mTOR2 by MHY1485 increased the expression of Runx2.
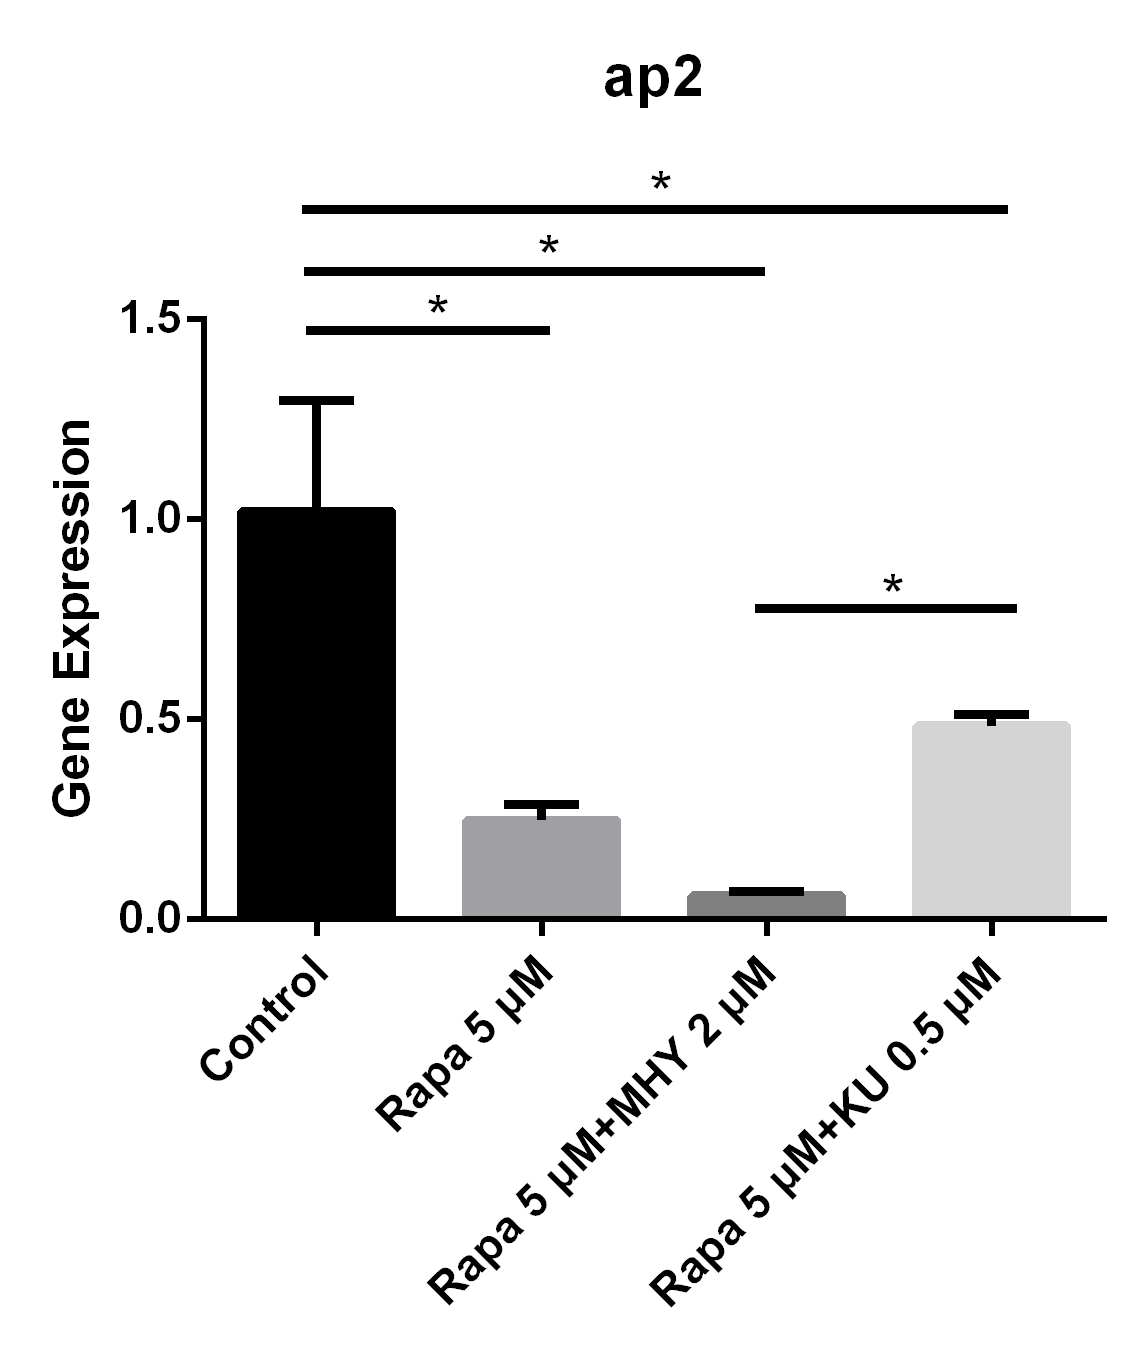
Figure 4
Blocking of mTOR1 by rapamycin decreased the expression of ap2; however, activation of mTOR1 and mTOR2 simultaneously by MHY decreased the expression of ap2 too
The expression of ap2 in TSCs cultured with rapamycin 5 uM, rapamycin 5 uM+ MHY1485 2 uM, and rapamycin 5 uM+ KU-0062794 0.5 uM decreased 75% (p=0.005), 94% (p=0.002) and 52% (p=0.019) respectively, compared with negative control group. And the expression of ap2 in rapamycin 5 uM+ KU-0062794 0.5 uM group is significantly higher compared with the one in the rapamycin 5 uM+ MHY1485 2 uM group.
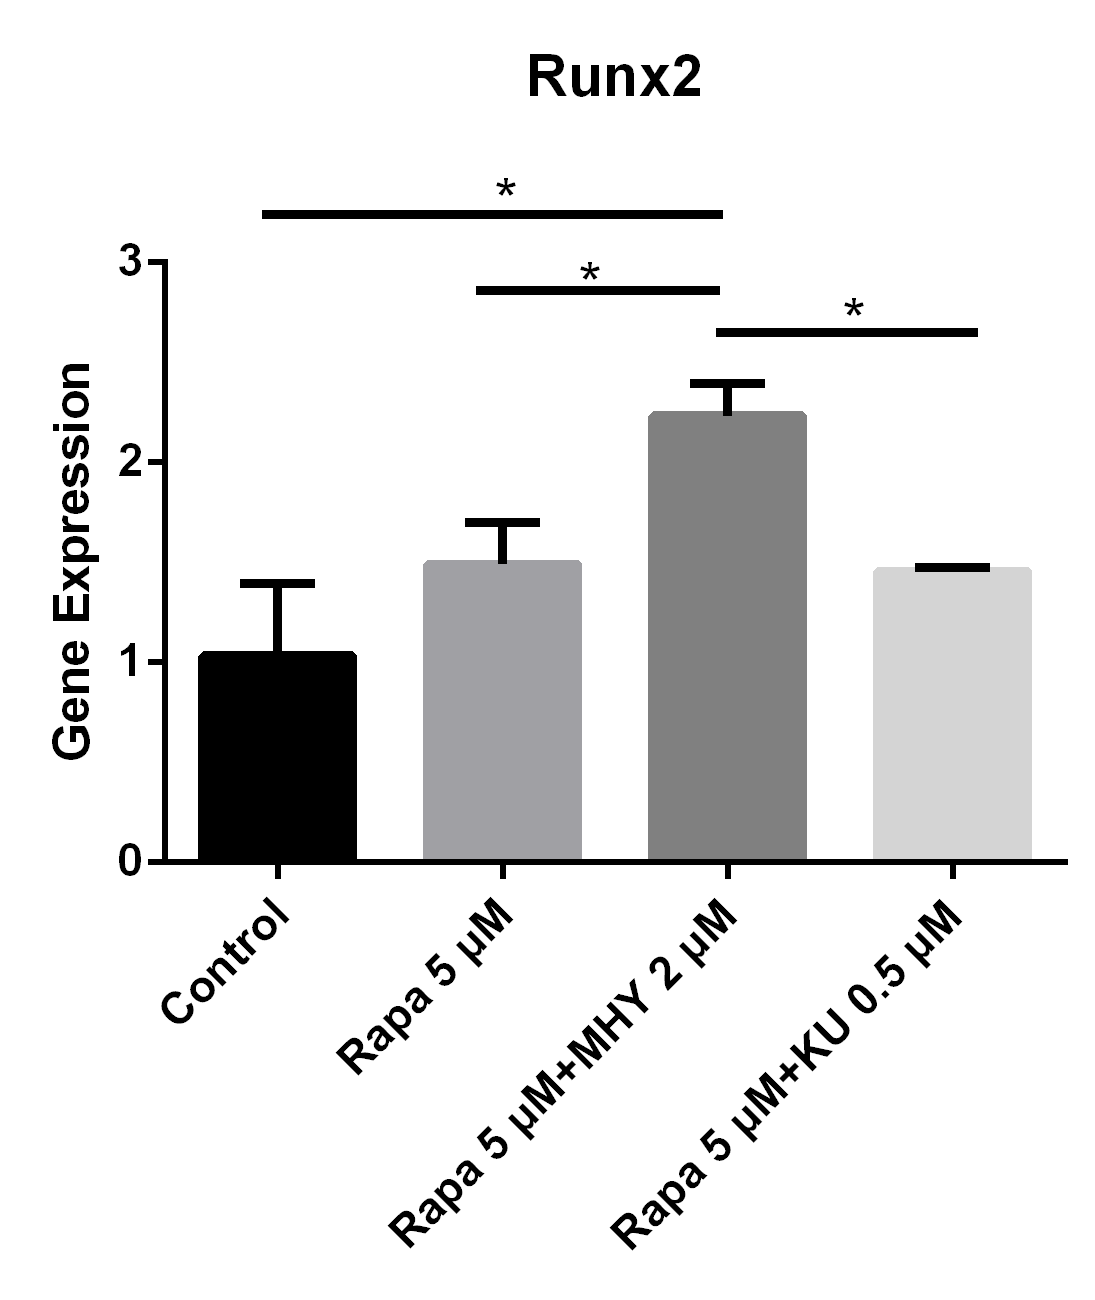
Figure 5
Both blocking mTOR1 or mTOR2 had little effects on the expression of Runx2; however, activation of mTOR2 induced the expression of Runx2
The expression of Runx2 in in TSCs cultured with rapamycin 5 uM, rapamycin 5 uM+ MHY1485 2 uM, and rapamycin 5 uM + KU-0062794 0.5 uM increased 49% (p=0.111), 123% (p=0.006) and 45% (p=0.134) respectively, compared with negative control. Also there was significant difference between the rapamycin 5uM group and rapamycin 5 uM+ MHY1485 2uM (p=0.030); or between rapamycin 5 uM+ MHY1485 2 uM and rapamycin 5 uM+ KU-0062794 0.5 uM (p=0,026).
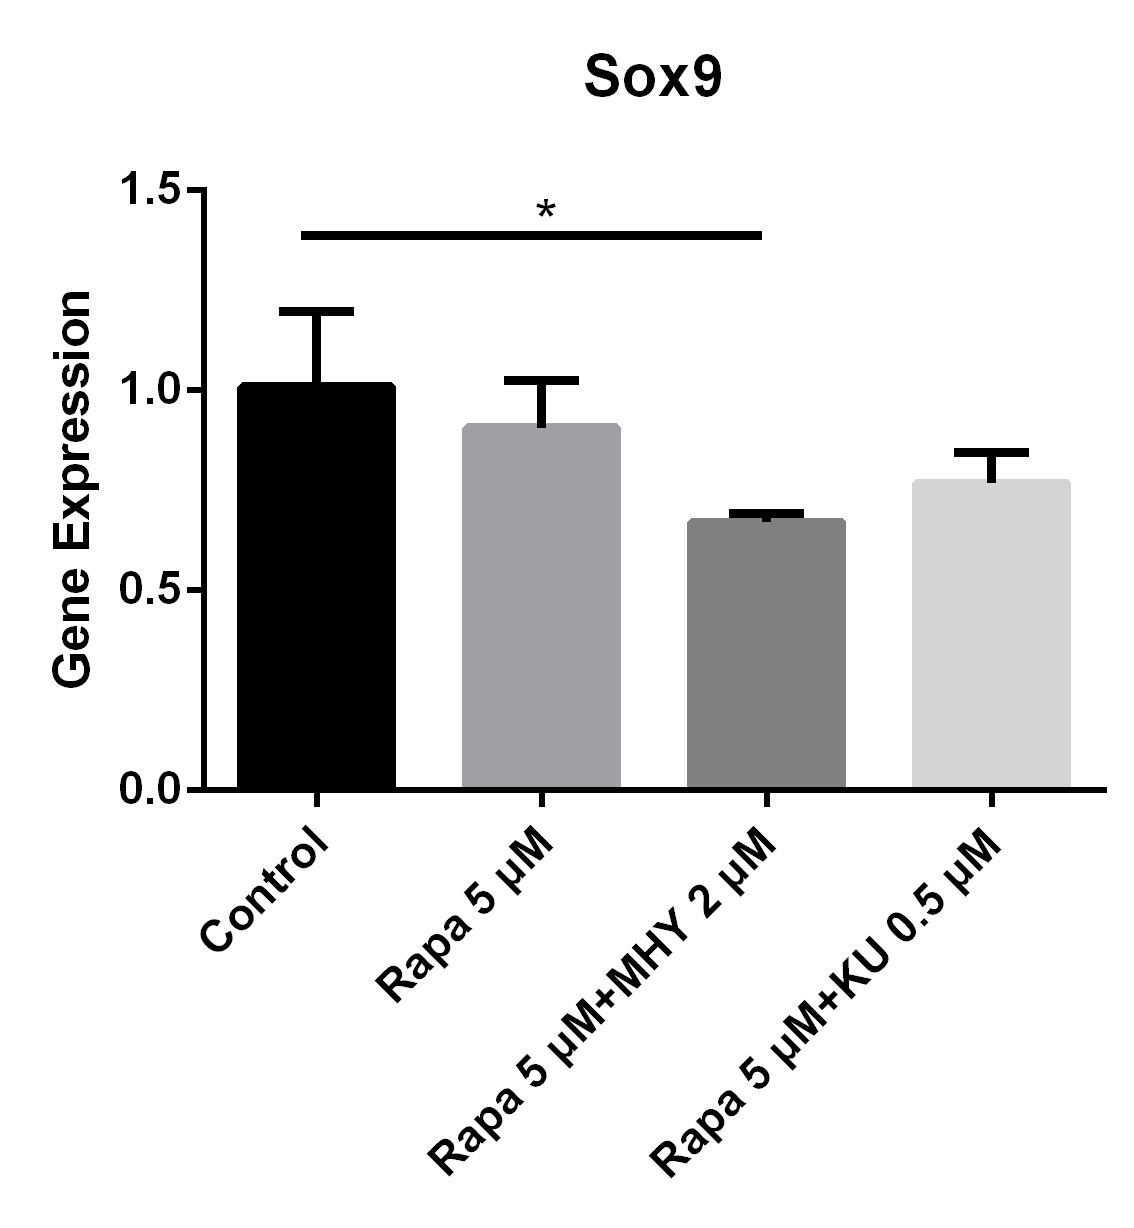
Figure 6
Blocking of either mTOR1 or mTOR2 had little effect on the expression of Sox9; however, activation of mTOR2 can induced a lower expression of Sox9, when compared with the group blocked by rapamycin
The expression of Sox9 in TSCs cultured with rapamycin 5 uM, rapamycin 5 uM+ MHY1485 2 uM, and rapamycin 5 uM+ KU-0062794 0.5 uM decreased 10% (p=0.43), 33% (p=0.045), 23% (p=0.11) respectively, compared with control group.
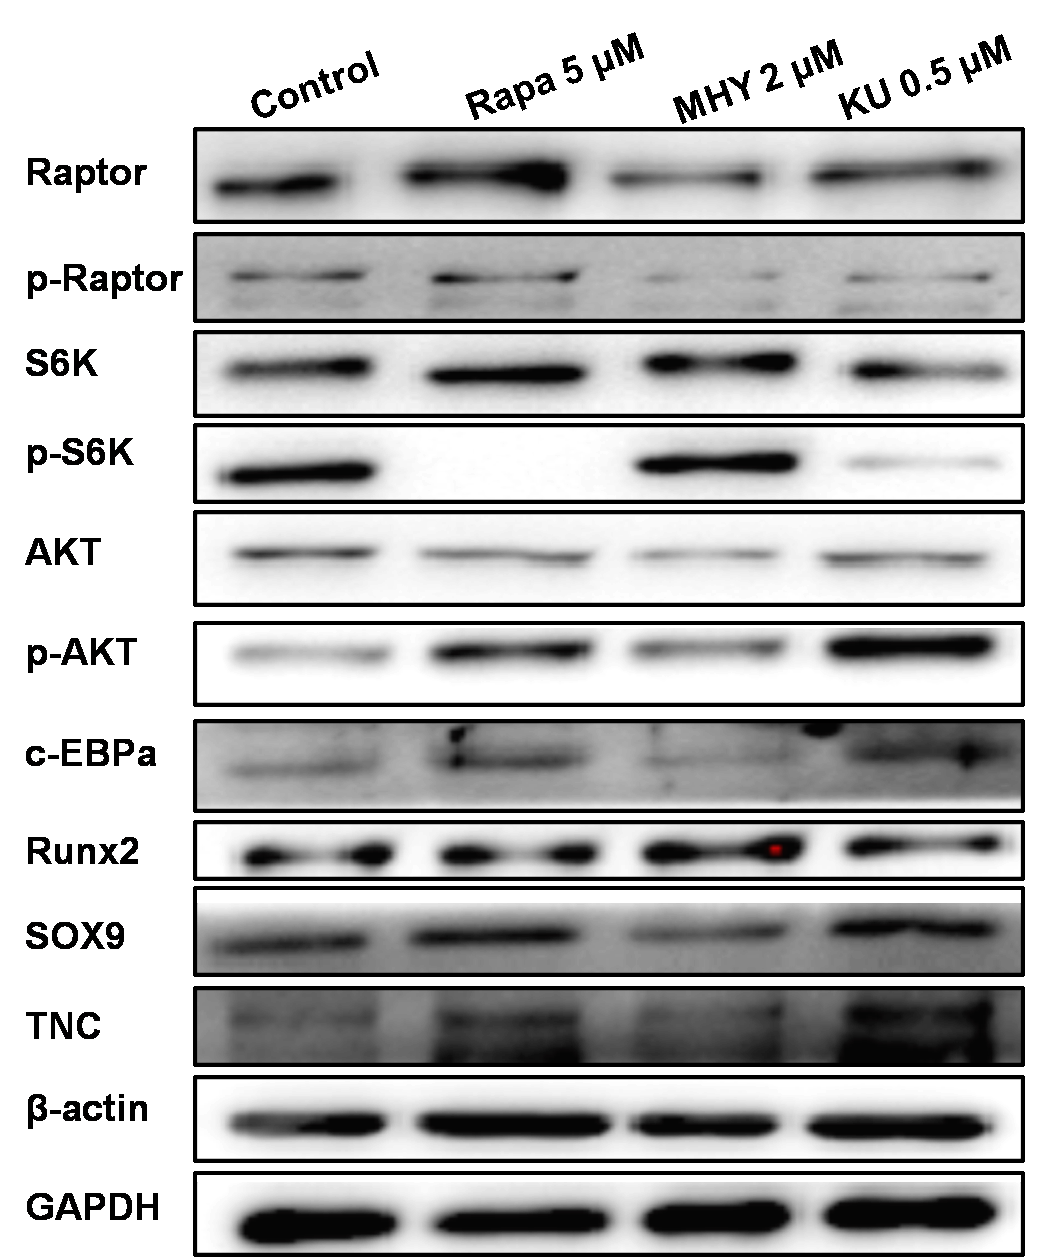
Figure 7
Western blot showed that rapamycin and KU-0062794 blocked the phosphoration of Raptor and S6k; also mTOR2 was activated by MHY1485, which confirmed by the phosphoration of AKT. MHY1485 effectively activated the phosphoration of S6k and AKT. Blocking of mTOR1 by Rapamycin or blocking both of mTOR1 and mTOR2 enhanced the expression of TNC; in addition, blocking of mTOR1 enhanced the expression of c-EBPα and Sox9. However, activation of mTOR1 and mTOR2 by MHY1485 increased the expression of Runx2
Discussion
mTOR played very important roles in modulating protein synthesis modulation by translational control (23). Numerous studies showed that mTOR regulated the proliferation and differentiation in different cell lines (20, 28, 29); however, few report are available on the effects of mTOR on TSCs. It is essential to define the effects of mTOR on TSCs in order to gain a better understanding of tendon metabolic balance and tendinopathy. In this study, we found that mTOR1 and mTOR2 played different roles on the proliferation and non-tenocyte differentiation of TSCs.
The underlying tissue changes during tendinopathy mainly constitute hypercellularity (1, 30, 31). Cell growth and proliferation are orchestrated by signaling networks in response to environmental cues such as nutrients, growth factors, and hormones. As we know, conserved protein kinases play important roles in the control of cell growth. mTOR was reported to regulate cell proliferation in a wide range of cells, including cancers (20, 28, 29, 32), and vascular endothelial cell (33). mTOR inhibited the proliferation of DU145 cells by activating apoptosis and autophagy (34). Da Silva reported that rapamycin reduced HEPG2 cell proliferation via an increase of free radicals and apoptosis (35). Furthermore, Fernandes-Silva G reported that mTOR inhibitors disrupted autophagy and inhibited cell proliferation (36). In our study, we found that blocking mTOR1 by rapamycin inhibited the proliferation of TSCs. The OD value was significantly higher when both mTOR1 and mTOR2 were blocked, which mean that blocking of mTOR2 promoted the proliferation of TSCs. However, it did not increase the OD value when the mTOR2 was activated by MHY1485; on the contrary, the OD value significantly decreased when mTOR2 was blocked using KU0062794. The results showed that blocking mTOR1 inhibited the proliferation of TSCs, while the blocking of mTOR2 enhanced the proliferation of TSCs; however, mTOR1 was dominate in the proliferation of TSCs.
The mechanism by which rapamycin inhibits mTOR activity in TSCs is still unclear. Rodrik-Outmezguine delineated the resistance mechanisms likely involved in the existing mTOR inhibitors in human cell lines (37). The mTOR pathway can be induced by a variety of mechanisms, including cytokine receptors such as PDGF receptors and by environmental cues (26), phosphoinositide 3 kinase (PI3K)–AKT–mTOR pathway in human cancers (38). Ma found that the PI3K–AKT pathway and the extracellular signal regulated cell growth and proliferation by inhibiting the tumor suppressor complex (23). MHY1485 has an inhibitory effect on the autophagic process by inhibiting the fusion between autophagosomes and lysosomes (17). mTOR2 mediated spatial control of cell growth by polarizing the actin cytoskeleton (39). In brief, the function and mechanism of mTOR in cell proliferation involves cell type specific regulation. An important avenue for future researches is to delineate between upstream signals and downstream effectors that are crucial for dictating mTOR1 activity in different cell types. Taken together, blocking of mTOR inhibited the proliferation of TSCs, and mTOR1 might play more important roles in proliferation. The mechanisms though which mTOR regulates TSC’ proliferation may be dependent on the ratio of phosphoinositide in mTOR1 and mTOR2. Further research is needed to investigate the upstream signals that modulate mTOR activity and the associated downstream components; we also need to confirm the conditions that regulated the ratio of phosphoinositide in mTOR1 and mTOR2.
Non-tenocyte differentiation of TSCs was thought to be an underlying factor in tendinopathy. mTOR regulated differentiation in different eukaryotic cells, including dendritic cells (40), retinal pigment epithelium cells (41), the leukocytes (42), and they are also involved in early neural development (43). Takayama reported that mTOR signaling accelerated aging in muscle-derived stem/progenitor cells isolated from a murine model (44). Moreover, activating the mTOR signaling pathway could induce myogenic differentiation and myotube hypertrophy (45). In our study, we found that blocking of mTOR1 by rapamycin enhanced the expression of TNC; however, blocking of mTOR2 led to the decreased expression of TNC. Moreover, the expression of TNC significantly increased when activated by MHY1485. These results highlighted that mTOR2 positively promoted the differentiation of tenocyte; however, mTOR1 might negatively modulate tenogenesis.
We found when mTOR1 was blocked by rapamycin and when mTOR2 was activated by MHY1485, addipogenesis differentiation was inhibited. In addition, blocking both mTOR1 and mTOR2 decreased the expression of AP2 as well. This meant that mTOR2 played more important roles in the adipogenesis of TSCs. Our results coincided with those of Bezzerri V, reported that adipose-specific disruption of rictor increased body size in a striking defect mouse model (46). The inhibition of mTORC1-mediated PPARγ expression decrease the adiposity in adipocytes (10).
Hu reported that mTOR attenuated osteoplastic differentiation of MC3T3‑E1 cells (47). In addition, mTOR activated by MHY1485 promoted osteoblastic differentiation in T-cell differentiation (48). In this study, the results showed that blocking mTOR1 by rapamycin or both of mTOR1 and mTOR2 by Ku0063794 did not significantly change the expression of Runx2; however, the expression of Runx2 increased when mTOR2 was activated. Collectively, the results indicated that mTOR2 was inclined to lead TSCs’ differentiation into osteogenesis when compared with mTORC1.
Zaseck found that age-associated calcification of Achilles tendons and accompanying elevations in expression of chondrocyte and osteoblast markers were all lower in old eRAPA-fed mice. Their results suggested that long-term administration of rapamycin responsible for aging of tendon extracellular matrix. And Gharibi B found that inhibition of Akt/mTOR attenuates age-related changes in mesenchyme stem cells too (49). As we found in our research, mTOR played important roles in the proliferation and differentiation of TSCs. That is probably the reason that mTOR affects the aging process.
Collectively, mTOR2 and mTOR1 were both positively and negatively implicated in the differentiation of tenocyte, respectively. However, mTOR2 played more important roles in the adipogenesis and osteogenesis of TSCs. In addition, In addition, these effects might be does-dependent. Therefore, the exact mechanism of how mTOR regulates the differentiation of TSCs remains to be further examined.
There are some limitations of this study. Firstly, we did not investigate the probable molecular mechanisms which mTOR regulated the proliferation and differentiation of TSCs. Also, we did not perform the positive regulation of mTOR1 or mTOR2, as we did not use a transfection technique (10, 13). However, this study focused on characterizing the effects of mTOR on TSCs. Thus, this limitation does not undermine our conclusion. Further studies are needed to shed light on the mechanisms and the roles of mTOR1 and mTOR2, respectively.
In summary, this is the first study to delve into the effects of mTOR on TSCs in vitro. The findings reported herein show that mTOR played important roles in the proliferation and differentiation of TSCs. Furthermore, mTOR1 and mTOR2 played different roles on the proliferation and differentiation of TSCs. Blocking mTOR1 inhibited the proliferation of TSCs and played a dominant function. Blocking of mTOR1 enhanced the expression of tenocyte related genes; however, blocking of mTOR2 inhibited the expression of TNC. Blocking of mTOR1 by rapamycin decreased the expression of ap2 and activation of mTOR2 induced the expression of Runx2.
Acknowledgments: This research was supported by grants from the National Natural Science Foundation of China (81572152), and we would like to thank Journal Prep for assistance in the polishing of this manuscript. .
Conflict of interest: We declare no conflicts of interest.
References
1. Zhou B, Zhou Y, Tang K. An overview of structure, mechanical properties, and treatment for age-related tendinopathy. The journal of nutrition, health & aging. 2014;18(4):441-8.
2. Lewis J, McCreesh K, Roy J-S, Ginn K. Rotator cuff tendinopathy: navigating the diagnosis-management conundrum. journal of orthopaedic & sports physical therapy. 2015;45(11):923-37.
3. Cassel M, Baur H, Hirschmüller A, Carlsohn A, Fröhlich K, Mayer F. Prevalence of Achilles and patellar tendinopathy and their association to intratendinous changes in adolescent athletes. Scandinavian journal of medicine & science in sports. 2015;25(3):e310-e8.
4. Mishra A, Pirolo JM, Gosens T. Treatment of Medial Epicondylar Tendinopathy in Athletes. Sports medicine and arthroscopy review. 2014;22(3):164-8.
5. Bi Y, Ehirchiou D, Kilts TM, Inkson CA, Embree MC, Sonoyama W, et al. Identification of tendon stem/progenitor cells and the role of the extracellular matrix in their niche. Nature medicine. 2007;13(10):1219-27. Epub 2007/09/11. doi: 10.1038/nm1630. PubMed PMID: 17828274.
6. Zhou B, Zhou Y, Tang K. The effects of substance P on pluripotent tendon cells: an in vitro and in vivo study. Journal of musculoskeletal & neuronal interactions. 2014;14(3):349-58.
7. Zhou Y, Zhou B, Tang K. The effects of substance P on tendinopathy are dose-dependent: An in vitro and in vivo model study. The journal of nutrition, health & aging. 2015;19(5):555-61.
8. Stanco D, Viganò M, ORFEI CP, Di Giancamillo A, Thiebat G, Peretti G, et al. In vitro characterization of stem/progenitor cells from semitendinosus and gracilis tendons as a possible new tool for cell-based therapy for tendon disorders. Joints. 2014;2(4):159.
9. Alberton P, Dex S, Popov C, Shukunami C, Schieker M, Docheva D. Loss of tenomodulin results in reduced self-renewal and augmented senescence of tendon stem/progenitor cells. Stem cells and development. 2014;24(5):597-609.
10. Oh WJ, Jacinto E. mTOR complex 2 signaling and functions. Cell Cycle. 2011;10(14):2305-16.
11. Hay N, Sonenberg N. Upstream and downstream of mTOR. Genes & development. 2004;18(16):1926-45.
12. Wullschleger S, Loewith R, Hall MN. TOR signaling in growth and metabolism. Cell. 2006;124(3):471-84.
13. Frias MA, Thoreen CC, Jaffe JD, Schroder W, Sculley T, Carr SA, et al. mSin1 is necessary for Akt/PKB phosphorylation, and its isoforms define three distinct mTORC2s. Current Biology. 2006;16(18):1865-70.
14. Loewith R, Jacinto E, Wullschleger S, Lorberg A, Crespo JL, Bonenfant D, et al. Two TOR complexes, only one of which is rapamycin sensitive, have distinct roles in cell growth control. Molecular cell. 2002;10(3):457-68.
15. Kwiatkowski DJ, Manning BD. Tuberous sclerosis: a GAP at the crossroads of multiple signaling pathways. Human molecular genetics. 2005;14(suppl 2):R251-R8.
16. Cheng Y, Kim J, Li XX, Hsueh AJ. Promotion of ovarian follicle growth following mTOR activation: synergistic effects of AKT stimulators. PloS one. 2015;10(2):e0117769.
17. Choi YJ, Park YJ, Park JY, Jeong HO, Kim DH, Ha YM, et al. Inhibitory effect of mTOR activator MHY1485 on autophagy: suppression of lysosomal fusion. PloS one. 2012;7(8):e43418.
18. Ayub A, Yip WK, Seow HF. Dual treatments targeting IGF-1R, PI3K, mTORC or MEK synergize to inhibit cell growth, induce apoptosis, and arrest cell cycle at G1 phase in MDA-MB-231 cell line. Biomedicine & Pharmacotherapy. 2015;75:40-50.
19. Yongxi T, Haijun H, Jiaping Z, Guoliang S, Hongying P. Autophagy inhibition sensitizes KU-0063794-mediated anti-HepG2 hepatocellular carcinoma cell activity in vitro and in vivo. Biochemical and biophysical research communications. 2015;465(3):494-500.
20. Hers I, Vincent EE, Tavaré JM. Akt signalling in health and disease. Cellular signalling. 2011;23(10):1515-27.
21. Jacinto E, Facchinetti V, Liu D, Soto N, Wei S, Jung SY, et al. SIN1/MIP1 maintains rictor-mTOR complex integrity and regulates Akt phosphorylation and substrate specificity. Cell. 2006;127(1):125-37.
22. Yu JS, Cui W. Proliferation, survival and metabolism: the role of PI3K/AKT/mTOR signalling in pluripotency and cell fate determination. Development (Cambridge, England). 2016;143(17):3050-60. Epub 2016/09/01. doi: 10.1242/dev.137075. PubMed PMID: 27578176.
23. Ma XM, Blenis J. Molecular mechanisms of mTOR-mediated translational control. Nature reviews Molecular cell biology. 2009;10(5):307-18.
24. Alfredson H. The chronic painful Achilles and patellar tendon: research on basic biology and treatment. Scandinavian journal of medicine & science in sports. 2005;15(4):252-9.
25. Moore J, Megaly M, MacNeil AJ, Klentrou P, Tsiani E. Rosemary extract reduces Akt/mTOR/p70S6K activation and inhibits proliferation and survival of A549 human lung cancer cells. Biomedicine & Pharmacotherapy. 2016;83:725-32.
26. Gharibi B, Farzadi S, Ghuman M, Hughes FJ. Inhibition of Akt/mTOR attenuates age-related changes in mesenchymal stem cells. Stem cells. 2014;32(8):2256-66.
27. Zhang P, Liang X, Shan T, Jiang Q, Deng C, Zheng R, et al. mTOR is necessary for proper satellite cell activity and skeletal muscle regeneration. Biochemical and biophysical research communications. 2015;463(1):102-8.
28. Liu Y, Bi T, Wang Z, Wu G, Qian L, Gao Q, et al. Oxymatrine synergistically enhances antitumor activity of oxaliplatin in colon carcinoma through PI3K/AKT/mTOR pathway. Apoptosis : an international journal on programmed cell death. 2016. Epub 2016/09/28. doi: 10.1007/s10495-016-1297-3. PubMed PMID: 27671687.
29. Wang Y, Sun Y, Wu Y, Zhang J. Cucurbitacin E inhibits osteosarcoma cells proliferation and invasion through attenuation of PI3K/AKT/mTOR signaling. Bioscience reports. 2016. Epub 2016/09/23. doi: 10.1042/bsr20160165. PubMed PMID: 27653525.
30. Fong G, Backman LJ, Andersson G, Scott A, Danielson P. Human tenocytes are stimulated to proliferate by acetylcholine through an EGFR signalling pathway. Cell and tissue research. 2013;351(3):465-75. Epub 2012/12/06. doi: 10.1007/s00441-012-1530-5. PubMed PMID: 23212463; PubMed Central PMCID: PMCPMC3582816.
31. Andersson G, Forsgren S, Scott A, Gaida JE, Stjernfeldt JE, Lorentzon R, et al. Tenocyte hypercellularity and vascular proliferation in a rabbit model of tendinopathy: contralateral effects suggest the involvement of central neuronal mechanisms. British journal of sports medicine. 2011;45(5):399-406. Epub 2010/07/08. doi: 10.1136/bjsm.2009.068122. PubMed PMID: 20605910.
32. Kwon S, Jeon JS, Ahn C, Sung JS, Choi I. Rapamycin regulates the proliferation of Huh7, a hepatocellular carcinoma cell line, by up-regulating p53 expression. Biochemical and biophysical research communications. 2016;479(1):74-9. Epub 2016/09/13. doi: 10.1016/j.bbrc.2016.09.035. PubMed PMID: 27616194.
33. Wang S, Lu J, You Q, Huang H, Chen Y, Liu K. The mTOR/AP-1/VEGF signaling pathway regulates vascular endothelial cell growth. Oncotarget. 2016. Epub 2016/07/28. doi: 10.18632/oncotarget.10756. PubMed PMID: 27458160.
34. Nie C, Zhou J, Qin X, Shi X, Zeng Q, Liu J, et al. Diosgenininduced autophagy and apoptosis in a human prostate cancer cell line. Molecular medicine reports. 2016. Epub 2016/09/27. doi: 10.3892/mmr.2016.5750. PubMed PMID: 27667394.
35. da Silva EF, Krause GC, Lima KG, Haute GV, Pedrazza L, Mesquita FC, et al. Rapamycin and fructose-1,6-bisphosphate reduce the HEPG2 cell proliferation via increase of free radicals and apoptosis. Oncology reports. 2016. Epub 2016/09/27. doi: 10.3892/or.2016.5111. PubMed PMID: 27665945.
36. Fernandes-Silva G, Ivani de Paula M, Rangel EB. mTOR inhibitors in pancreas transplant: adverse effects and drug-drug interactions. Expert opinion on drug metabolism & toxicology. 2016:1-19. Epub 2016/09/24. doi: 10.1080/17425255.2017.1239708. PubMed PMID: 27659512.
37. Rodrik-Outmezguine VS, Okaniwa M, Yao Z, Novotny CJ, McWhirter C, Banaji A, et al. Overcoming mTOR resistance mutations with a new-generation mTOR inhibitor. Nature. 2016;534(7606):272-6.
38. Vivanco I, Sawyers CL. The phosphatidylinositol 3-kinase–AKT pathway in human cancer. Nature Reviews Cancer. 2002;2(7):489-501.
39. Jacinto E, Loewith R, Schmidt A, Lin S, Rüegg MA, Hall A, et al. Mammalian TOR complex 2 controls the actin cytoskeleton and is rapamycin insensitive. Nature cell biology. 2004;6(11):1122-8.
40. Sukhbaatar N, Hengstschlager M, Weichhart T. mTOR-Mediated Regulation of Dendritic Cell Differentiation and Function. Trends in immunology. 2016. Epub 2016/09/12. doi: 10.1016/j.it.2016.08.009. PubMed PMID: 27614799.
41. Jiang C, Qin B, Liu G, Sun X, Shi H, Ding S, et al. MicroRNA-184 promotes differentiation of the retinal pigment epithelium by targeting the AKT2/mTOR signaling pathway. Oncotarget. 2016. Epub 2016/07/16. doi: 10.18632/oncotarget.10566. PubMed PMID: 27418134.
42. Bezzerri V, Vella A, Calcaterra E, Finotti A, Gasparello J, Gambari R, et al. New insights into the Shwachman-Diamond Syndrome-related haematological disorder: hyper-activation of mTOR and STAT3 in leukocytes. Scientific reports. 2016;6:33165. Epub 2016/09/24. doi: 10.1038/srep33165. PubMed PMID: 27658964; PubMed Central PMCID: PMCPMC5034238.
43. Garza-Lombo C, Gonsebatt ME. Mammalian Target of Rapamycin: Its Role in Early Neural Development and in Adult and Aged Brain Function. Frontiers in cellular neuroscience. 2016;10:157. Epub 2016/07/06. doi: 10.3389/fncel.2016.00157. PubMed PMID: 27378854; PubMed Central PMCID: PMCPMC4910040.
44. Takayama K, Kawakami Y, Lavasani M, Mu X, Cummins JH, Yurube T, et al. mTOR signaling plays a critical role in the defects observed in muscle-derived stem/progenitor cells isolated from a murine model of accelerated aging. Journal of orthopaedic research : official publication of the Orthopaedic Research Society. 2016. Epub 2016/08/31. doi: 10.1002/jor.23409. PubMed PMID: 27572850.
45. Kitakaze T, Sakamoto T, Kitano T, Inoue N, Sugihara F, Harada N, et al. The collagen derived dipeptide hydroxyprolyl-glycine promotes C2C12 myoblast differentiation and myotube hypertrophy. Biochemical and biophysical research communications. 2016;478(3):1292-7. Epub 2016/08/25. doi: 10.1016/j.bbrc.2016.08.114. PubMed PMID: 27553280.
46. Cybulski N, Polak P, Auwerx J, Rüegg MA, Hall MN. mTOR complex 2 in adipose tissue negatively controls whole-body growth. Proceedings of the National Academy of Sciences. 2009;106(24):9902-7.
47. Hu XK, Yin XH, Zhang HQ, Guo CF, Tang MX. Liraglutide attenuates the osteoblastic differentiation of MC3T3E1 cells by modulating AMPK/mTOR signaling. Molecular medicine reports. 2016;14(4):3662-8. Epub 2016/09/08. doi: 10.3892/mmr.2016.5729. PubMed PMID: 27600753.
48. Pai C, Walsh CM, Fruman DA. Context-Specific Function of S6K2 in Th Cell Differentiation. Journal of immunology (Baltimore, Md : 1950). 2016. Epub 2016/09/11. doi: 10.4049/jimmunol.1600167. PubMed PMID: 27613697.
49. Gharibi B, Farzadi S, Ghuman M, Hughes FJ. Inhibition of Akt/mTOR attenuates age-related changes in mesenchymal stem cells. Stem Cells. 2014;32(8):2256-66. Epub 2014/03/25. doi: 10.1002/stem.1709. PubMed PMID: 24659476.
