C. Siordia1, A.N. Lewis2
1. PhD, Graduate School of Public Health, University of Pittsburgh; 2. PhD, College of Health and Behavioral Studies, James Madison University
Corresponding Author: C Siordia, 30 North Bellefield Ave, Pittsburgh, PA 15213. Phone: 1-142-383-1708. Email: cas271@pitt.edu
Abstract
The term “mobility disability” is used in different academic disciplines to discuss conceptualizations of physical movement. Inadequate attention has been paid to how this umbrella term refers to various forms of measurements on both hypothetical and enacted function. Refining what is meant by mobility disability may impact clinical practice by providing more specific information to clinicians. Less ambiguous labeling may have the potential to advance research by lowering measurement imprecision. We complement discussion by presenting empirical analysis on 5,995 participants (aged > 65) from National Health and Aging Trends Study (NHATS-2011). Ambiguous labeling of mobility may unintentionally obscure what is known about perceived capacity for ambulation and stair-climbing. Because creating low-cost and readily-available measures of health in the population has the potential to advance public health knowledge, efforts should continue to standardize and clarify measures of mobility. Key words: Ambulation, disability, function, labeling; measurement, mobility.
Key words: Ambulation, disability, function, labeling, measurement, mobility.
Introduction
The term “mobility” is widely used in health, disability, clinical, and rehabilitation research. The term is broad and encompasses a wide variety of phenomena. The term “mobility” was recently defined in the Disability and Society journal as “the capacity to navigate one’s way through different spaces and places” (1). The term mobility also accompanies other forms of movements, such as those with “power mobility devices” (2) and has been used to define migratory behaviors such as “cross-border mobility” (3). Measuring movement, be it independent or with assistance, is important as it quantifies “existential implications of the performance of place through mobility” (4). The “mobility disability” label generally refers to: ability to perform physical function tasks. The term has been defined in one or multiple items from a wide variety of subjective and objective measurements (5-12), like two consecutive self-reports of having difficulty walking ¼ mile or climbing 10 stairs (13). A review of instruments used to assess mobility in older adult populations is available elsewhere (14). Research has used a wide array of measures for mobility disability. While common language facilitates discourse, imprecise terminology has the potential to hide the fact that inter-study comparability on (what appears to be) the same topic is not possible. Standardizing the use of highly specified labels through public consensus may help solve this issue.
As eloquently explained by others (15), it is important to understand how “capacity to function” and “actual performance” differ: the first refers to function in the hypothetical sense while the latter to function in the enacted sense. More specifically, self-reports on ability to perform physical function tasks measure hypothetical movements while observed performance measures enacted movements. Technically, hypothetical movement refers to an individual’s perceived potential to perform a particular task while enacted movements refer to an individual’s ability to perform a task as per validation by an external evaluator. Treating hypothetical and enacted mobility as the same thing—by using one label—has the potential to obscure what is understood about an individual’s physical capacity.
Unlike enacted physical movements that are objectively measured by a trained observer or electronic device like an accelerometer, assessment of hypothetical mobility is undertaken by asking individuals to self-evaluate and report their ability to perform a particular task. The labeling of subjective measures is the primary concern of this commentary. In particular, we are concerned with self-reported ability to walk long distances and climb-steps. Self-reported ability to walk long distances measures an individual’s perceived potential to walk. Thus, the following “root label” is recommended: Perceived Potential for Ambulation Ability (PPAA). The root label PPAA could be more highly specified by including a “sub-label”—like the “distance” mentioned in the question. For example, if a 1 mile or 1 kilometer question is used, the following sub-labels could be added: PPAA1m; PPAA1k.
Note the term “ambulation ability” has been used before (16) and to refer to something different than what is being discussed in this commentary. Because survey questions pertaining to ability to walk over long distances presumably refer to “linear ambulation” (i.e., walking horizontally on a flat surface with 0° of incline), walking up steps is framed in this commentary as being radically different. Hypothetically, stair-climbing in the respondent’s mind refers to “non-linear ambulation” (i.e., walking upwards on flat surfaces over a non-0° incline). Because linear and non-linear ambulation may differ in terms of physical demands, they should be labeled separately. Self-reported ability to walk-up stairs/steps measures an individual’s perceived potential to climb stairs/steps. Thus, the following root label is recommended: Perceived Potential for Stair-Climbing Ability (PPSCA). If a survey question on ability to walk-up “one flight of steps” or “20 steps” is used, the root label PPSCA could be further specified with sub-labels as follows: PPSCA1flight; PPSCA20stairs.
Research on the biomechanics of ambulation has shown that stair-climbing is more demanding than linear ambulation (15). Perceived potential to walk over a long distance or climb steps can be evaluated by at least two methods: (1) memory retrieval of relevant event; (2) or by evaluating capacity from a cognitive model. Perceived Potential from Memory Retrieval (PP-MR) refers to self-evaluations from actual events retrieved from memory. For example, when asked about ability to walk up 20 steps, a person may remember attempting the task and failing (or succeeding) and use that as the method for determining their capacity. Perceived Potential from Cognitive Model (PP-CM) is more difficult to describe and refers to using mental scenarios to self-evaluate ability to perform tasks. Because survey questions, in theory, have the ability to lead a respondent to self-evaluate his or her ability to perform a particular physical function task by, presumably, invoking cognitive representations of the environments, PP-CM is presumed to be possible.
Because linear and non-linear ambulation exert different biomechanical demands and because their subjective assessment may magnify how self-evaluation processes (i.e., PP-MR or PP-CM) affect perceived potential to perform tasks, walking (PPAA) and climbing (PPSCA) should be explored separately (17). By extension, these arguments could be used to explain why combining PPAA and PPSCA into one composite score has the potential to create an ambiguous measure of physical capacity—where (PPAA + PPSCA) = increased potential for measurement bias (18-20). In order to show evidence of how our discussion may be able to disambiguate research by highlighting the presence of “ambiguous mobility disability phenotypes”, we provide a brief empirical analysis.
Methods
Our analysis uses “Round 1” data (year 2011) from the National Health and Aging Trends Study (NHATS) of persons aged > 65 designed to investigate physical function in later life (22). Details of the study have been published before (22). Our brief analysis includes Latinos (LAT), Non-Latino-Blacks (NLB), and Non-Latino-Whites (NLW) who completed a 3-meter walk test without the use of any assistive device or person. A total of 5,995 NHATS participants are used in the analysis.
PPAA is computed from answers to the following NHATS questions: In the last month, were you able to walk 3 blocks by yourself and without your cane or walker?—could be labeled as “PPAA3blocks”; and In the last month, were you able to walk 6 blocks, or about half a mile, by yourself and without your cane or walker?—could be labeled as “PPAA6blocks”. Those responding “yes” receive a “1” on a binary variable for each question. We then combined them as follows: PPAA=0 if unable to walk 3 or 6 blocks; PPAA=1 if only able to walk 3 blocks; and PPAA=2 if able to walk 3 and 6 blocks. PPSCA is computed from answers to the following NHATS questions: In the last month, were you able to walk up 10 stairs by yourself and without your cane or walker?—could be labeled as “PPSCAA10steps”; and In the last month, were you able to walk up 20 stairs, about two flights, by yourself and without your cane or walker?—could be labeled as “PPAA20steps”. Those responding “yes” receive a “1” on a binary variable for each question. We then combined them as follows: PPSCA=0 if unable to walk up 10 stairs; PPSCA=1 if only able to walk up 10 stairs; and PPSCA=2 if able to walk up 20 stairs. PPAA and PPSCA were summed to create the Composite Score (CS) and produce the following groups: “clearly” able disability” (CS=0); “ambiguous mobility disability phenotype” (CS= 1); and “clearly” unable to perform tasks (CS=2).
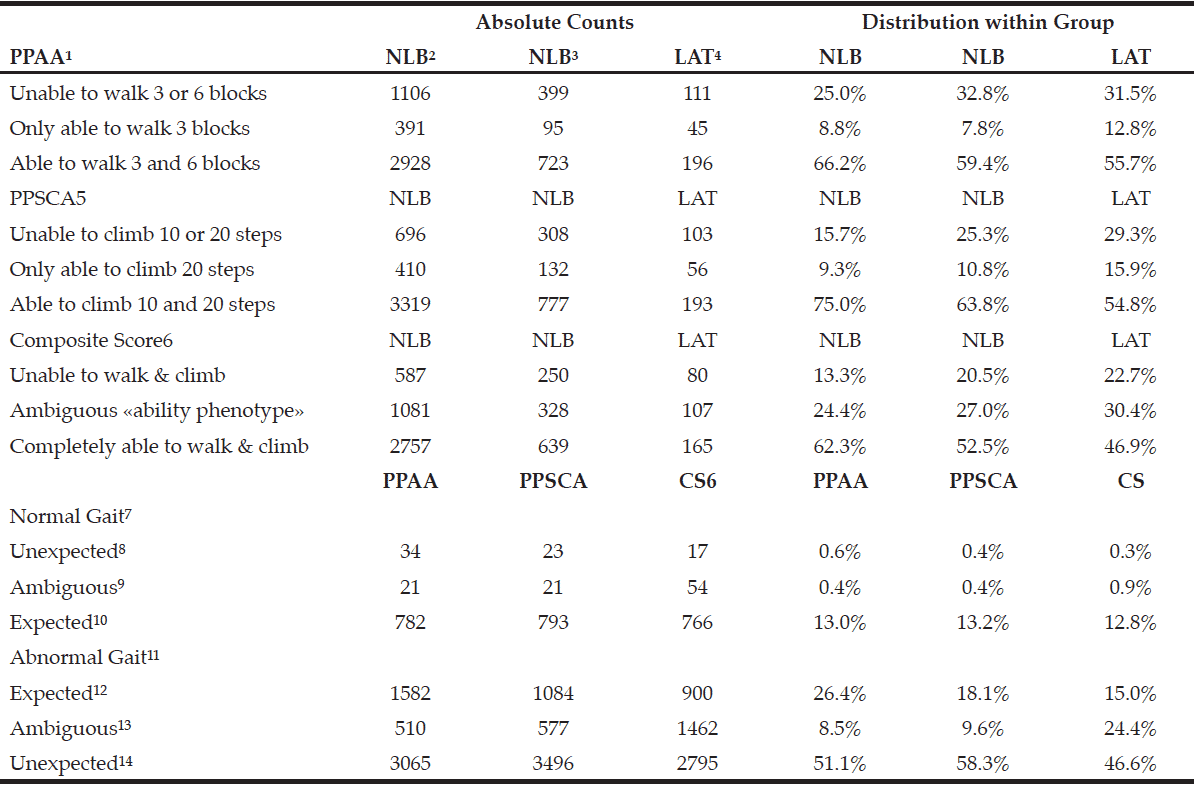
Because PPAA, PPSCA, and SC represent “subjective” measures, we contrast their distribution by an “objective” measure”: gait speed. The three-meter “usual pace” gait speed was used as part of the short physical performance battery (SPPB) test and was assessed at the participant’s home by a trained interviewer (22). We measure gait speed as “meters per-second” (m/sec). We then combined PPAA scores with “normal” gait speed (i.e., >1.01 m/sec) as advised elsewhere [22] and “abnormal” gait speed (i.e., <1.00 m/sec) to create the “PPAA by normality of gait speed” groups presented in Table 1. We also combined PPSCA scores with normal and abnormal gait speed to create the “PPSCA by normality of gait speed” groups and additionally combined CS scores with normal and abnormal gait speed to create the “CS by normality of gait speed” groups.
We present the distribution of PPAA, PPSCA, and CS scores by race-ethnic groups and by normality of gait speed. We also provide multivariate logistic regression results predicting “ambiguous mobility disability phenotype” (i.e., CS=1) while adjusting for: race; ethnicity; sex; age; and educational attainment—using the following categories: < junior high school (>1st-8th grade); high school (includes 9th-12th grade and high school graduates); some college (includes vocational, technical, business, or trade school certificate or diploma beyond high school level); and > college graduate (includes: some college but no degree; associate’s degree; bachelor’s degree; and master’s, professional, or doctoral degree). We managed data and regressions using SAS 9.3® software. We discussed “percent change in the expected likelihood”: [100×(OR-1)]—i.e., [100×(eβx-1)].
Results
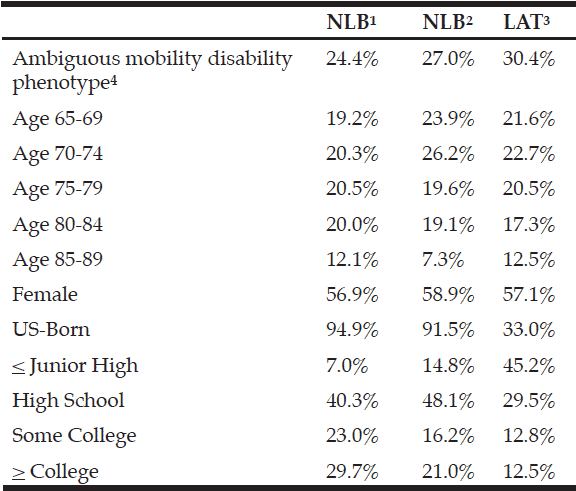
Table 1 shows descriptive statistics for sample of 5,995 observations. Table 2 presents how NLBs, NLWs, and LATs are distributed over the variables used to predict ambiguous mobility disability phenotype. From Table 2, see that about one-fourth of all study subjects
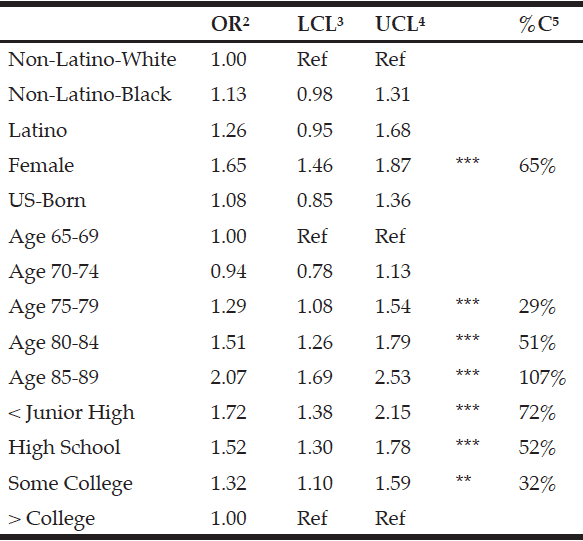
in the analysis sample are categorized as having an ambiguous mobility disability phenotype; the majority are NLWs; females; born in the US; and have a high school education or below. Table 3 presents the regression results. As may have been expected from a previous publication (22), the following groups are associated with having a greater likelihood of having an ambiguous mobility disability phenotype: females; those over age 75; and those with some college education or below. For example, when compared to those with a college education, individuals with a junior high education or below are 72% more likely to have an ambiguous mobility disability phenotype—i.e., a complex combination between ability to walk blocks and climb stairs. When compared to those males, females are 65% more likely to self-report their perceived potential for mobility over the counter alternative to report an ambiguous mobility disability phenotype. The regression results suggest that ambiguous mobility disability phenotype is not normally distributed when “markers of social stratification” are considered (23).
1. Perceived Potential for Ambulation Ability; 2. Non-Latino-White; 3. Non-Latino-Black; 4. Latino; 5. Perceived Potential for Step-Climbing Ability; 6. Composite score (PPAA+PPSCA); 7. Gait > 1.01 m/sec; 8. Has normal gait and report inability to walk or climb steps; 9. Has normal gait and reports some inability to walk or climb steps; 10. Has normal gait and reports full ability to walk and climb steps; 11. Gait < 1.00 m/sec; 12. Has abnormal gait and report inability to walk or climb steps; 13. Has abnormal gait and reports some inability to walk or climb steps; 14. Has abnormal gait and reports full ability to walk and climb steps
1. Non-Latino-White; 2Non-Latino-Black; 3. Latino; 4. Has a Composite Score (PPAA+PPSCA) that is between 2 and 3—which may represent a multitude of different scenarios between perceived potential to walk blocks and climb-steps

Table 3 Results from multivariate logistic regression model predicting “ambiguous mobility disability phehotype”1
***α<0.001 **α<0.01; 1. Has a Composite Score (PPAA+PPSCA) that is between 2 and 3—which may represent a multitude of different scenarios between perceived potential to walk blocks and climb-steps; 2. Odds ratio; 3. 95% Wald lower confidence limit; 4. 95% Wald upper confidence limit; 5. Percent change:[(odds ratio-1)*100]
Conclusions
From our introductory discussion, we concluded that advancing research may be plausible through clear labeling of mobility-related measures. Although cumbersome, the use of technical labels has the potential to improve the level of precision in the public discourse over “mobility disability.” Improving clarity in the labeling of measures may help clinicians better understand risk factors for abnormal lower extremity mobility. Use of the label mobility disability to refer to some measure of physical capacity is not only customary; it also empowers authors in the development of manuscripts with persuasive rhetoric. Unfortunately, the use of common language has the potential to simultaneously facilitate the consumption of technical information and slows scientific progress through the use of ambiguous terms. To be clear, although the use of common language facilitates discussion, it may concurrently limit scientific knowledge by unintentionally encouraging inappropriate inter-study comparisons. As we continue to explore how best to produce low-cost and readily available measures of sub-clinical physical capacity in population studies (21), efforts should continue to use existing data sources and to provide more precise labels of physical function.
Author Contribution: CS had the original idea and completed the first draft of the manuscript after completing data analysis. ANL significantly improved the draft by framing the discussion and focusing the goals of the project. Both CS and ANL were fully involved in the study and preparation of the manuscript. The material within our manuscript has not been and will not be submitted for publication elsewhere.
Conflict of Interest: Neither CS nor ANL have any conflict of interest with JARCP.
Funding: CS was supported by the NIH grant number U01 AG023744.
References
1. Porcelli P., Ungar M., Liebenberg L., & Trépanier N. (2014). (Micro) mobility, disability and resilience: exploring well-being among youth with physical disabilities. Disability & Society, (ahead-of-print), 1-14.
2. Korotchenko A., & Hurd Clarke L. (2014). Power mobility and the built environment: the experiences of older Canadians. Disability & Society, 29(3), 431-443.
3. Mirza M. (2011). Disability and cross-border mobility: comparing resettlement experiences of Cambodian and Somali refugees with disabilities. Disability & Society, 26(5), 521-535.
4. Jonasson, M. (2014). The AKKA-board–performing mobility, disability and innovation. Disability & Society, 29(3), 477-490
5. Launer LJ, Harris T, Rumpel C, et al. Body mass index, weight change, and risk of mobility disability in middle-aged and older women: the epidemiologic follow-up study of NHANES I. JAMA. 1994;271(14);1093-1098.
6. Collen F M, Wade DT, Robb GF, et al. The Rivermead mobility index: a further development of the Rivermead motor assessment. Disability & Rehabilitation. 1991;13(2):50-54.
7. Fried LP, Bandeen-Roche K, Chaves PH, et al. Preclinical mobility disability predicts incident mobility disability in older women. Journals of Gerontology-Biological Sciences and Medical Sciences. 2000;55(1):M43.
8. Newman AB, Simonsick EM, Naydeck BL, et al. Association of long-distance corridor walk performance with mortality, cardiovascular disease, mobility limitation, and disability. JAMA.2006;295(17):2018-2026.
9. Pahor M, Guralnik JM, Ambrosius, et al. Effect of Structured Physical Activity on Prevention of Major Mobility Disability in Older Adults: The LIFE Study Randomized Clinical Trial. JAMA. 2014.
10. Deshpande N, Metter JE, Guralnik J, et al. Sensorimotor and psychosocial determinants of 3-year incident mobility disability in middle-aged and older adults. Age and Ageing. 2014;43(1):64-69.
11. Holmgren M, Lindgren A, de Munter J, et al. Impacts of mobility disability and high and increasing body mass index on health-related quality of life and participation in society: a population-based cohort study from Sweden. BMC Public Health. 2014;14(1):381.
12. Capistrant BD, Glymour MM, Berkman LF. Assessing Mobility Difficulties for Cross-National Comparisons: Results from the World Health Organization Study on Global Ageing and Adult Health. Journal of the American Geriatrics Society. 2014.
13. Murphy RA, Reinders I, Register TC, et al. Associations of BMI and adipose tissue area and density with incident mobility limitation and poor performance in older adults. The American journal of clinical nutrition, ajcn-080796. 2014.
14. Chung J, Demiris G, Thompson HJ. Instruments to Assess Mobility Limitation in Community-Dwelling Older Adults: A Systematic Review. Journal of Aging and Physical Activity. 2014.
15. Glass TA. Conjugating the “tenses” of function: Discordance among hypothetical, experimental, and enacted function in older adults. The Gerontologist, 1998;38(1): 101-112.
16. Reid SM, Lynn SK, Musselman RP, et al. Knee biomechanics of alternate stair ambulation patterns. Medicine and Science in Sports and Exercise. 2007;39(11):2005.
17. Nitz J, Gage A. Post stroke recovery of balanced sitting and ambulation ability. Australian Journal of Physiotherapy.1995;41(4):263-267.
18. Insall JN, Dorr LD, Scott RD, et al. Rationale of the Knee Society clinical rating system. Clin Orthop Relat Res, 1989;248(248):13.
19 Buzas JS, Stefanski LA, Tosteson TD. (2014). Measurement error. Handbook of Epidemiology, 1241-1282.
20. Saint-Maurice PF, Welk GJ, Beyler NK, et al. Calibration of self-report tools for physical activity research: the Physical Activity Questionnaire (PAQ). BMC Public Health, 2014;14(1):461.
21. Satariano WA, Guralnik JM, Jackson RJ, et al. Mobility and aging: new directions for public health action. Am J Public Health. 2012;102(8):1508-1515.
22. Siordia C. 2014. Intersecting Self-Reported Mobility and Gait Speed to Create a Multi-Dimensional Measure of Ambulation: The “Ambulation Speed-Endurance” (ASE) Typology. Journal of Frailty & Aging, in-press.
23. Siordia C. Disability Prevalence According to a Class, Race, and Sex (CSR) Hypothesis. Journal of Racial and Ethnic Health Disparities, in-press.


